original literary work declaration - …studentsrepo.um.edu.my/8390/7/tan_say_min.pdf · tesis ini...
TRANSCRIPT

ii
UNIVERSITI MALAYA
ORIGINAL LITERARY WORK DECLARATION
Name of Candidate: TAN SAY MIN (I.C/Passport No:
Registration/Matric No: KGA 090043
Name of Degree: MASTER OF ENGINEERING SCIENCE
Title of Project Paper/Research Report/Dissertation/Thesis (“this Work”):
PREPARATION AND CHARACTERIZATION OF PEO-PMMA-LiClO4-EC-
MnO2 NANOCOMPOSITE POLYMER ELECTROLYTES
Field of Study: Nanotechnology
I do solemnly and sincerely declare that:
(1) I am the sole author/writer of this Work; (2) This Work is original; (3) Any use of any work in which copyright exists was done by way of fair dealing and
for permitted purposes and any excerpt or extract from, or reference to or reproduction of any copyright work has been disclosed expressly and sufficiently and the title of the Work and its authorship have been acknowledged in this Work;
(4) I do not have any actual knowledge nor do I ought reasonably to know that the making of this work constitutes an infringement of any copyright work;
(5) I hereby assign all and every rights in the copyright to this Work to the University of Malaya (“UM”), who henceforth shall be owner of the copyright in this Work and that any reproduction or use in any form or by any means whatsoever is prohibited without the written consent of UM having been first had and obtained;
(6) I am fully aware that if in the course of making this Work I have infringed any copyright whether intentionally or otherwise, I may be subject to legal action or any other action as may be determined by UM.
Candidate’s Signature Date
Subscribed and solemnly declared before,
Witness’s Signature Date
Name: Designation:
iii
Abstract
Polymer electrolytes are of great interest for solid-state-electrochemical devices
especially in fuel cells and battery. There have been many studies that carried out to
improve the ionic conductivity in polymer electrolytes which include polymer blending,
incorporating plasticizers and filler additives in the electrolytes system. This thesis
describes the combined effect of incorporating the nano-sized MnO2 filler and the
EC plasticizer on the ionic conductivity enhancement of the polymer blend PMMA-
PEO-LiClO4 electrolyte. Maximum conductivity has been achieved by optimizing the
compositions of the plasticizer and the filler. Conduction characteristics of the
polymer electrolyte system are investigated. Free standing flexible electrolyte films of
composition 13.68 wt% PEO, 54.72 wt% PMMA, 7.59 wt% LiClO4, 19 wt% EC and 5
wt% MnO2 are prepared by solution casting method. A combination of X-ray diffraction
(XRD), UV-Vis spectroscopy, Fourier-transform infrared (FTIR) spectroscopy, Field
Emission Scanning Electron Microscopy (FESEM), thermal gravimetric analysis (TGA)
and differential scanning calorimetry (DSC) studies have indicated enhancement in the
amorphous phase of polymer system due to the polymer blend, plasticizer addition and
filler addition. Further, a reduction in the glass transition temperature and optical band
gap has inferred increase in the flexibility of the polymer chains. Ionic conductivity
studies are carried out as a function of chemical composition and temperature using
impedance spectroscopy. The conductivity values are presented and results are
discussed.
iv
Abstrak
Elektrolit polimer begitu mendapat perhatian dalam peranti keadaan pepajal
elektrokimia terutamanya sel fuel dan bateri. Terdapat banyak kajian yang telah
dijalankan untuk meningkatkan kekonduksian ionik dalam elektrolit polimer. Ini
termasuklah pemaduan polimer, penambahan agen plastik dan pengisi dalam sistem
elektrolit polimer. Tesis ini melaporkan kesan pada elektrolit polimer PMMA-PEO-
LiClO4 apabila pengisi MnO2 yang bersaiz nano ditambahkan dalam elektrolit polimer
yang telah dipadukan dua polimer yang berlainan dan ditambahkan agen plastic, EC.
Kekonduksian ionik maksimum telah dicapai apabila komposisi pengisi dan agen
plastik yang optimum telah ditambahkan ke dalam sistem elektrolit polimer. Sifat-sifat
kekonduksian elektrolit polimer telah dikaji dan dibincang. Filem kukuh elektrolit yang
mengandungi komposisi 13.68 wt% PEO, 54.72 wt% PMMA, 7.59 wt% LiClO4, 19 wt%
EC dan 5 wt% MnO2 disediakan dengan keadaan “solution casting”. Kombinasi kajian
XRD, optik, FTIR, FESEM dan DSC telah membuktikan fasa amorfus elektrolit
polimer. Tambahan lagi, penurunan suhu peralihan gelas dan jurang jalur optik telah
menjelaskan peningkatan kelenturan rantai polimer yang menyebabkan peningkatan
kekonduksian ionik. Kajian kekonduksian ionik telah dikaji dengan fungsi komposisi
kimia dan suhu dengan menggunakan mesin EIS. Nilai kekonduksian yang diperolehi
juga dibincangkan.

v
ACKNOWLEDGEMENT
I would like to express my deepest appreciation and thanks to my respectable
supervisor, Dr. Mohd Rafie Johan for his invaluable guidance, advice and
encouragement throughout this whole project. He always assists and guides me
patiently in solving various kinds of problems.
I would like to extend my sincere gratitude to Ms Alya and Ms Sue who had
kindly granted me the permission to do various tests and studies in Advanced Materials
Laboratory, University of Malaya (UM) and Science Laboratory, University Teknology
MARA (Uitm). My sincere appreciation also goes to Ms. Ng Meng Nee, my beloved
senior for her invaluable help in guiding me in my research.
I would like to show my great gratitude to my lovely family and my fellow
course mates. Without their understanding, continuous support, concern and
encouragement, I wouldn’t have completed the whole study smoothly. In short, I’m
wish to thanks all that have been kind to offer their assistance to help me to accomplish
my final year project.
vi
Table of content
ORIGINAL LITERARY WORK DECLARATION ........................................................ ii
Abstract ............................................................................................................................ iii
Abstrak ............................................................................................................................. iv
ACKNOWLEDGEMENT ................................................................................................ v
Table of content................................................................................................................ vi
List of Tables.................................................................................................................. viii
List of Figures .................................................................................................................. ix
LIST OF PAPERS PUBLISHED AND CONFERENCE PROCEEDING ................... xiv
LIST OF ABBREVIATIONS ......................................................................................... xv
CHAPTER ONE ............................................................................................................... 1
INTRODUCTION ........................................................................................................ 1
1.1 Background ..................................................................................................... 1
1.2 Importance Research Problem ........................................................................ 4
1.3 Significance of Research ................................................................................ 6
1.4 Research Objectives ........................................................................................ 6
1.5 Scope of Research ........................................................................................... 7
CHAPTER TWO .............................................................................................................. 9
LITERATURE REVIEW.............................................................................................. 9
2.1 Classification of polymer electrolyte .............................................................. 9
2.2 Ion conduction mechanism in electrolytes.................................................... 13
2.3 PEO/PMMA blend polymer electrolytes ...................................................... 19
2.4 Solvent .......................................................................................................... 22
2.5 Salts ............................................................................................................... 26
2.6 Plasticizer ...................................................................................................... 29
2.7 Filler .............................................................................................................. 31
2.8 Dielectric properties of polymer electrolytes ................................................ 33
2.9 Thermal stability of polymer electrolytes ...................................................... 36
2.10 Optical properties of electrolytes ................................................................... 38
CHAPTER THREE ......................................................................................................... 40
3.1 Materials ....................................................................................................... 40
3.2 Preparation of polymer blend electrolyte ..................................................... 41
3.3 Characterization Techniques ............................................................................. 46
CHAPTER FOUR ........................................................................................................... 77

vii
RESULTS AND DISCUSSION ................................................................................. 77
4.1 Structural Studies .......................................................................................... 77
4.2 Conductivity Studies ..................................................................................... 97
4.3 Dielectric Studies ......................................................................................... 108
4.4 Thermal Studies ........................................................................................... 113
4.4 Optical Studies ............................................................................................ 126
CHAPTER FIVE ............................................................................................................. 131
CONCLUSION AND FUTURE RECOMMENDATIONS ............................................. 131
References ..................................................................................................................... 134
Appendix ....................................................................................................................... 143

viii
List of Tables
Table 2.1 Some selected polymer host and their chemical formulae 15
Table 2.2 Properties of various polymer electrolyte solvents 24
Table 2.3 Examples of plasticizers commonly used in polymer electrolytes 29
Table 3.1 Materials and chemicals used in preparation of polymer electrolyte 40
Table 3.2 Samples with various composition of PMMA-PEO blend films 42
Table 3.3 Composition of PMMA-PEO-LiClO4 with manipulated salt content 43
Table 3.4 Composition of PMMA/PEO/ LiClO4 with various plasticizer contents 44
Table 3.5 Composition of PMMA/PEO/LiClO4/EC with various filler contents 45
Table 3.6: Equipments used in characterization of solid polymer electrolytes 46
Table 3.7 List of some simple chromophores and their light absorption characteristics74
Table 4.1Crystallite size of pure PEO and pure PMMA in comparison with the
various composition of PMMA/PEO polymer blend system 84
Table 4.2 Crystallite sizes for various composition of filler MnO2 in plasticized
polymer electrolyte 85
Table 4.3 Thermal properties of PMMA/PEO blends 113
Table 4.4 Thermal properties of PMMA/PEO/LiClO4 polymer electrolyte systems 114
Table 4.5 Thermal properties of PMMA/PEO/LiClO4/EC polymer electrolyte
system 115
Table 4.6 Thermal properties of PMMA/PEO/LiClO4/EC/MnO2 polymer
electrolyte system 116
Table 4.7 Initial and decomposition temperatures and percentage of total weight
loss for various solid polymer electrolyte systems 125
Table 4.8 Optical band gap for both direct and indirect of different polymer
electrolyte systems 130

ix
List of Figures
Figure 2.1 Schematic illustration of lithium ion transport in polyether media 16
Figure 3.1 Solution-casting for thin films 41
Figure 3.2 HIOKI HiTESTER machine 47
Figure 3.3 Complex impedance spectra of polymer electrolytes 50
Figure 3.4 X-ray diffraction machine 51
Figure 3.5 Diffraction of X-ray by planes of atoms 52
Figure 3.6 Diffraction of X-ray pattern of 80 wt% PMMA and 20 wt% PEO. 53
Figure 3.7 Placement of TEM grids on the gravimetric filter holder 55
Figure 3.8 Typical TEMs workings principal 56
Figure 3.9 TEM machine 58
Figure 3.10 Schematic diagram of light microscope (LM), transmission
electron microscope (TEM) and field emission scanning
electron microscope (FESEM) 61
Figure 3.11 Field Emission Scanning Electron Microscope (FESEM) 62
Figure 3.12 Spectrum FTIR Spectometer dual system 65
Figure 3.13 Differential scanning calorimetry (DSC) 67
Figure 3.14 Transgravimetric analysis machine 70
Figure 3.15 Electronic excitation of organic molecules 73
Figure 3.16 Cary 50 UV-Visible spectrophotometer 76
Figure 4.1 TEM image of MnO2 nanoparticles 78
Figure 4.2 Histogram of particle size distribution of MnO2 nanoparticles 78
Figure 4.3 (a) shows the XRD pattern for pure PMMA 79
Figure 4.3 (b) shows the XRD pattern for pure PEO. 80
Figure 4.4 (a) XRD pattern for 90:10 wt% of PMMA/PEO blend 80
Figure 4.4 (b) XRD pattern for 80:20 wt% of PMMA/PEO blend 81
Figure 4.4 (c) XRD pattern for 70:30 wt% of PMMA/PEO blend 81
Figure 4.4 (d) XRD pattern for 60:40 wt% of PMMA/PEO blend 82

x
Figure 4.4 (e) XRD pattern for 50:50 wt% of PMMA/PEO blend 82
Figure 4.4 (f) XRD pattern for 40:50 wt% of PMMA/PEO blend 83
Figure 4.5 XRD patterns for polymer electrolytes with various weight percent of
MnO2 nanofiller : a)54.7PMMA:13.4PEO:7.6LiClO4:19EC:5MnO2;
b)51.9PMMA:13PEO:7.2LiClO4:18EC:10MnO2;
c)48.9PMMA:12.2PEO:6.8LiClO4:17EC:15MnO2;
d)46.1PMMA:11.5PEO:6.4LiClO4:16EC:20MnO2;
e) 43.2PMMA:10.8PEO:6LiClO4:15EC:25MnO2 87
Figure 4.6 XRD pattern for (a)80PMMA:20PEO (b) 72PMMA:18PEO:10LiClO4
(c) 57.6PMMA:14.4PEO:8LiClO4:20EC;
(d)54.7PMMA:13.4PEO:7.6LiClO4:19EC:5MnO2 88
Figure 4.7 FTIR spectra for (a) pure PEO ; (b) pure PMMA
(c) 80PMMA:20PEO polymer blend;
(d)72PMMA:18PEO:10LiClO4 polymer electrolyte;
(e) 57.6PMMA:14.4PEO:8Li:20EC plasticized polymer electrolyte 90
Figure 4.7 (f) FTIR spectra for 54.7PMMA:13.4PEO:7.6LiClO4:19EC:5MnO2
composite polymer electrolye. 90
Figure 4.8 FTIR spectra for the optimum concentration of polymer electrolytes
with various weight percent of MnO2 nanofiller:
(a) 54.7PMMA:13.4PEO:7.6LiClO4:19EC:5MnO2
(b) 51.9PMMA:13PEO:7.2LiClO4:18EC:10MnO2
(c) 48.9PMMA:12.2PEO:6.8LiClO4:17EC:15MnO2
(d) 46.1PMMA:11.5PEO:6.4LiClO4:16EC:20MnO2
(e) 43.2PMMA:10.8PEO:6LiClO4:15EC:25MnO2 93
Figure 4.9 FESEM images for
(a) 80PMMA:20PEO,
(b) 72PMMA:18PEO:10 LiClO4,
(c) 57.6PMMA:14.4PEO:8 LiClO4:20EC,

xi
(d) 54.72 PMMA:13.68PEO:7.6 LiClO4:19EC:5MnO2 96
Figure 4.10 (a) Complex impedance spectra of polymer electrolytes at
various weight percent of PMMA/PEO blend: (a) 90:10 (b) 80:20
(c) 70:30 (d) 60:40 (e) 50:50 (f) 40:60 98
Figure 4.10 (b) Variation of conductivity for different weight percent of
PMMA/PEO 98
Figure 4.11 (a) Complex impedance spectra of polymer electrolytes 80:20 wt%
of PMMA/PEO at various LiClO4: (a) 2.5 wt%; (b) 5 wt%; (c) 7.5 wt%;
(d) 10 wt% (e) 12.5 wt% 99
Figure 4.11 (b) Variation of conductivity for 80:20 wt% PMMA-PEO with different
wt % of LiClO4 100
Figure 4.12 (a) Complex impedance spectra for PMMA/PEO/LiClO4
polymer electrolytes at various EC plasticizer: (a) 5 wt% (b) 10 wt%
(c) 15 wt% (d) 20 wt% (e) 25 wt% 101
Figure 4.12 (b) Variation of ionic conductivity for PMMA/PEO/LiClO4
with different weight percent of EC. 102
Figure 4.13 (a) Complex impedance spectra for 80:20:10:20 wt%
of PMMA/PEO/LiClO4/EC polymer electrolytes at various MnO2
filler: (a) 5 wt% (b) 10 wt% (c) 15 wt% (d) 20 wt% (e) 25 wt% 103
Figure 4.13 (b) Variation of ionic conductivity 80:20:10:20 wt%
of PMMA/PEO/LiClO4/EC polymer electrolyte with respect to
filler content at room temperature 104
Figure 4.14 (a) Temperature dependence of ionic conductivity for various
weight percent of PMMA: PEO blend polymer electrolyte systems:
90:10; (b) 80:20; (c) 50:50); (d) 60:40; (e) 50:50; (f) 40:60 106
Figure 4.14 (b) Temperature dependence of ionic conductivity for PMMA/PEO
blend at various weight percent of LiClO4 salt: (a) 2.5 wt% (b) 5 wt%
xii
(c) 7.5 wt% (d) 10 wt% (e) 12.5 wt% 106
Figure 4.14 (c) Temperature dependence of ionic conductivity for
PMMA/PEO/LiClO4 at various weight percent of EC plasticizer:
(a) 5 wt% (b) 10 wt% (c) 15 wt% (d) 20 wt% (e) 25 wt% 107
Figure 4.14 (d) Temperature dependence of ionic conductivity
for PMMA/PEO/LiClO4/EC at various weight percent of MnO2 filler:
(a) 5 wt% (b) 10 wt% (c) 15 wt% (d) 20 wt% (e) 25 wt% 107
Figure 4.15 Variation of real part of dielectric constant of (a) PMMA-PEO,
(b) PMMA-PEO-LiClO4, (c) PMMA-PEO-LiClO4-EC and
(d) PMMA-PEO-LiClO4-EC-MnO2 at room temperature. 108
Figure 4.16 Variation of imaginary part of dielectric constant of
(a) PMMA-PEO, (b) PMMA-PEO-LiClO4,
(c) PMMA-PEO-LiClO4-EC and (d) PMMA-PEO-LiClO4-EC-MnO2
at room temperature. 109
Figure 4.17 Variation of tan δ for (a) PMMA-PEO, (b) PMMA-PEO-LiClO4,
(c) PMMA-PEO-LiClO4-EC and (d) PMMA-PEO-LiClO4-EC-MnO2
at room temperature. 111
Figure 4.18 DSC thermograms for PMMA/PEO blend at various weight percent:
(a) 90:10; (b) 80:20 ; (c) 70:30; (d) 60:40; (e) 50:50; (f) 40:60 118
Figure 4.19 DSC thermograms for PMMA/PEO polymer electrolyte system at
various weight percent of LiClO4 : (a) 2.5 wt% ; (b) 5 wt%; (c) 7.5 wt%;
(d) 10 wt%; (e) 12.5 wt% 119
Figure 4.20 DSC thermograms for PMMA/PEO/LiClO4 polymer electrolyte
system at various weight percent of EC : (a) 5 wt% ; (b) 10 wt% ;
(c) 15 wt%; (d) 20 wt%; (e) 25 wt% 120
Figure.4.21 DSC thermograms for PMMA/PEO/LiClO4/EC polymer electrolyte
system at various weight percent of MnO2 filler: (a) 5 wt% MnO2
(b) 10 wt% MnO2 (c) 15 wt% MnO2 (d) 20 wt% MnO2
xiii
(e) 25 wt% MnO2 121
Figure 4.22 TGA-DTG curves for 80:20 wt% of PMMA/PEO blend 122
Figure 4.23 TGA-DTG curves for 72PMMA:18PEO:10Li polymer electrolytes 123
Figure 4.24 TGA-DTG curves for 57.6PMMA:14.4PEO:8Li:20EC polymer
electrolytes 123
Figure 4.25 TGA-DTG curves for
54.7PMMA:13.4PEO:7.6LiClO4:19EC:5MnO2 polymer electrolytes 124
Figure 4.26 Optical absorption spectra for optimum polymer electrolytes:
a) PEO- PMMA b) PEO-PMMA-LiClO4 c) PEO-PMMA-LiClO4-EC
d) PEO-PMMA-LiClO4-EC- MnO2 127
Figure 4.27 Plot of (αhυ)2 against Eg (photon energy) for the optimum
polymer electrolytes : a) PEO- PMMA b) PEO-PMMA-LiClO4
c) PEO-PMMA-LiClO4-EC d) PEO-PMMA-LiClO4-EC- MnO2 128
Figure 4.28 Plots of (αhυ)1/2 against Eg (photon energy) for the optimum
polymer electrolytes: a) PEO- PMMA b) PEO-PMMA-LiClO4
c) PEO-PMMA-LiClO4-EC d) PEO-PMMA-LiClO4-EC MnO2 129

xiv
LIST OF PAPERS PUBLISHED
AND
CONFERENCE PROCEEDING
Tan Say Min, M. R. Johan, Effects of MnO2 nano- particles on the conductivity
of PMMA-PEO-LiClO4-EC polymer electrolytes, Ionics 17 (2011) 485-490
(ISI-Cited Publication)
Tan Say Min, M. R. Johan, Effect of MnO2 nano-sized filler in ionic
conductivity of PEO/PMMA based polymer electrolytes, Proceeding of
International Conference on NanoElectronics, Taiwan (2011)
Tan Say Min, M. R. Johan, Electrical and optical properties of
PMMA-PEO-LiClO4-EC-MnO2, Ionics (2011) under revision [Manuscript No:
IONICS-2011-0126].

xv
LIST OF ABBREVIATIONS
Abbreviation Phrase
AgNO3 Silver nitrate
DBP Dibutyl phthalate
DMP Dimethyl phthalate
DSC Differential Scanning Calorimetry
EC Ethylene carbonate
EIS Electrochemical Impedance Spectroscopy
IS Impedance Spectroscopy
LPB Lithium Polymer Batteries
Li+ Lithium ion
LiTf Lithium triflate
LiBF4 Lithium-boron-tetrafluoride
LiBr Lithium bromide
LiCF3SO3 Lithium triflate
LiClO4 Lithium perchorate
LiNO3 Lithium nitrate
LiPF6 lithium hexafluorophosphate
LPB Lithium Polymer Batteries
MnO2 Manganese Dioxide
PEO Poly (ethylene oxide)
PC Propylene carbonate

xvi
PMMA Poly(methyl methacrylate)
PVC Polyvinyl chloride
SPEs Solid polymer electrolytes
Tg Glass transition temperature
Tm Melting temperature
TEM Transmission Electron Microscope
wt % Weight Percentage
XRD X-Ray Diffraction

1
CHAPTER ONE
INTRODUCTION
This chapter covers the introduction of present work, objectives and scope of this
research. This report is made up of five chapters and the organization has been
discussed.
1.1 Background
The development of polymer electrolytes has drawn the attention of many
researchers in the last two decades as they find applications not only in lithium batteries,
but also in other electrochemical devices such as super capacitors, electrochromic
devices and sensors etc. Such systems based on conventional poly (ethylene oxide)
(PEO) matrix offer room temperature conductvities generally of the order of 10-5 S cm-1
(Fenton et al, 1973). which preclude their utility in practical devices. Poly (methyl
methacrylate) PMMA, on the other hand, demonstrated to form highly conducting gel
electrolytes (10-3 S cm-1) at room temperature (Croce et al, 1993).
However, the ionic conductivity of such polymer electrolyte at ambient
temperature is rather low. Thus, in order to enhance the room temperature ionic
conductivity of the polymer electrolytes, several strategies have been developed that
include incorporating organic solvents (plasticizer) to form plasticized or gel polymer
electrolyte (Qian et al, 2002), doped with inorganic fillers to make composite polymer
electrol(Nan et al, 2003) and synthesizing new polymer (Ali et al, 2006). Plasticization
is an effective way to improve the ionic conductivity of polymer electrolyte, and among

2
a number of plasticizers, the most used plasticizers are low molecular weight organic
solvents such as propylene carbonate (PC), ethylene carbonate (EC), dimethyl carbonate
(DMC), and diethyl carbonate (DEC) (Qian et al, 2002). Plasticizers reduce the glass
transition temperature, Tg, of the polymer electrolyte which helps to increase the
segmental motion of the polymer backbone and generate free volume. Therefore, the
ions can migrate easily through the void resulting in ionic conductivity enhancement.
Besides that, the high dielectric constant and low viscosity of plasticizers also enable
them to incorporate with the polymer host to facilitate the formation of dissociated ions.
This approach leads to a high ambient conductivity but promotes deterioration of the
electrolyte’s mechanical properties and increases its reactivity toward the lithium metal
anode (Nan et al, 2003).
Alternatively, the addition of inorganic filler, namely, ceramic filler to the
polymer electrolytes has recently become an attractive approach due to the mechanical
stability and enhanced ionic conductivity and to electrolyte-electrode interface stability
(Qian et al, 2002). It has been well established that the addition of ceramic fillers
improved the conductivity of polymer host and their interfacial properties in contact
with the lithium electrode (Li et al , 2004). The concentration and the particles size of
the inert solid particles play a significant role in improving these physical properties as
the smaller the particles size is, the larger the conductivity enhancement will be. In part,
because of this idea, nanocomposite polymer electrolyte (NCPE) in which dispersion of
small fraction of low dimension particles in the conventional solid polymer complexes
is presently the focus of many studies (Li et al , 2004). The addition of filler particles
inhibit the crystallization of polymer chains and, hence, decrease the degree of
crystallinity (or increase the proportion of amorphous phase) in polymer. This, in turn,

3
lowers the temperature of stabilization of the amorphous phase in the polymer
electrolyte and, hence, increases the practical applicable range of conductivity of the
electrolyte.

4
1.2 Importance Research Problem
The key factor to make a high performance polymer electrolytes are 1) high
ionic conductivity, 2) chemically and electrochemically stable, 3) mechanically strong
and flexible, 4) thermally stable, 5) environmentally safety (Oh & Kim, 1978). The high
molecular weight of poly(ethylene oxide) (PEO) emerged as the best candidates to be
used as polymer matrix because of their salvation power, complexion ability and ion
transport mechanism (alkaline salt) (Pitawala et al., 2007). However, the ionic
conductivity of PEO–lithium salts (LiX) electrolytes at ambient temperature (10−7–10−6
Scm−1) is not sufficiently high for most practical applications. This main drawback
however, can be overcome by polymer blending, addition of low molecular weight
aprotic plasticizer, and addition of nanosized fillers (Qian et al, 2002).
In polymer blending, two or more polymers are blended together to create a new
polymer matrix with higher amorphousity compare to single polymer host. Following
by that, salts are added to provide mobile ions into the system with minimum possible
toxic by products. Furthermore, the use of plasticizers tends to increase the chain
mobility of the polymer yet decrease the mechanical strength of electrolytes,
particularly at a high degree of plasticization. As a result, the inorganic fillers are used
to improve the electrochemical and mechanical characteristics. In spite of that, there are
no reports that reveal the best selection and optimum composition of filler in polymer
electrolytes that give the maximum ionic conductivity and high mechanical stability.
In this work, PMMA/PEO-LiClO4-EC-MnO2 nanocomposite polymer
electrolytes were prepared, in which MnO2 filler were first ball-milled into nanosized

5
after LiClO4 salt and EC plasticizer were added in the polymer blend network. The
objective of this work is to determine the optimum composition and to study the
combined effect of salt, plasticizer and nanosized filler on the chemical interaction,
morphology, structure, thermal stability, and ionic conductivity of PMMA/PEO
polymer blend electrolyte system.

6
1.3 Significance of Research
The production of high ionic conductivity of polymer electrolytes is always the
main objective. To the best of our knowledge, there are no studies with regard to the use
of nano-sized manganese dioxide (MnO2) as filler in polymer electrolytes. Therefore,
this study is a very significance and important either towards the fundamental aspect of
polymer electrolyte or their applications in the industry.
1.4 Research Objectives
The objectives of this research are listed below:
• To formulate the optimum miscibility of PMMA/PEO polymer blend as a host
polymer in a plasticized composite polymer electrolytes.
• To investigate the effects of lithium salt (LiClO4), plasticizer ethylene carbonate
(EC) and nanofiller manganese dioxide (MnO2) on the PMMA/PEO polymer
blend
• To determine the optimum composition of salt, plasticizers and filler in
PMMA/PEO blend with respect to the ionic conductivity
7
1.5 Scope of Research
There have been several reviews with regard to the lithium polymer batteries
technology from various perspectives since the inception of lithium ion technology
(Blomgren, 1999; Fry and Wiley, 1989). Seeing that electrolytes interact closely with
both cathode and anode materials during the operation, their effect on cell performance
has been discussed in most reviews. However, attention has always focused on
electrode materials, especially the anodes and yet electrolytes as an important
component of the cell have not been comprehensively treated in any of the dedicated
reviews.
This research tends to invalidate the deficit by improving the development of
electrolytes of lithium-based batteries. Since lithium ion chemistry is the only apparent
successful commercialized rechargeable lithium-based technology, emphasis will be
placed on the electrolytes developed for this system. The integration and the
characterization of polymer blend electrolytes will taken as the dominant stage, and the
scope of the review will include their ionic conductivity, effect of nano-size filler and
plasticizer, thermal stability, chemical stability, thermal properties and performance at
elevated temperatures, compatibility in lithium battery and safety characterizations.
Unfortunately, the exact electrolyte compositions in commercialized devices are
usually proprietary knowledge, but publications from the affiliated researchers normally
disclose sufficient information to reveal the skeletal electrolyte components employed.
However, a great effort has been done based on such open literature to postulate the
fundamental of lithium polymer electrolyte battery. Although comprehensive coverage
was attempted, it is essentially impossible to embrace every aspect in an exhaustive

8
manner. The selection of references and the organization of the content is based on the
point of view of the author only.
9
CHAPTER TWO
LITERATURE REVIEW
This chapter begins with the fundamentals of lithium-ion polymer battery and follows
by the introduction of polymer electrolytes as well as classification of various polymer
electrolytes. Type of solvent, effect of plasticizer and filler are briefly discussed.
Finally, temperature behavior of polymer electrolytes is concisely discussed.
2.1 Classification of polymer electrolyte
Generally there are three main types of polymer electrolytes which are solid
polymer electrolytes, gelled polymer electrolytes and composite electrolytes. Gelled
polymer electrolytes and composites electrolytes are developed later to compromise the
drawback of solid polymer electrolytes.
Solid polymer electrolytes (SPE) are solvent of polar macromolecules that
dissolve salts like LiClO4, LiBF4, LiPF6, LiAsF6 and etc. Since this system does not
possess any organic liquid and thus the polymer host is used as mechanical matrix to
support process ability. The very first example of “dry solid” polymer electrolyte is the
poly (ethylene oxide) (PEO) based systems that showed very low ambient temperature
conductivities of the order of 10−8 S cm−1 (Fenton et al, 1973). However, the cycling
performance of this dry solid polymer electrolyte with lithium metal electrodes was not
satisfactory due to the decomposition of lithium dendrites and high degree of
crystallization of PEO. The poor performance of the cells was attributed to poor ionic
conductivity of the electrolytes.

10
Furthermore, ionic conductivity is not the only obstacle in developing SPEs in
electrochemical devices. In 1994, Anderman (1994) questioned almost all of the
previously projected advantages from the viewpoint of cell design and engineering. He
argued that: (1) The flexibility that a polymer electrolyte could not offer obvious
advantage to cell design, since the current cell components (i.e., electrodes coated on
substrates and a separator based on polyolefin films) already possess sufficient
flexibility. The limitations on the geometric shapes of lithium cells do not come from
the rigidity of electrolytes but rather from the terminals/connectors as well as
economical considerations; (2) The low reactivity of a polymer toward an electrode
would very likely be counteracted by the micrometer thickness of such polymer
materials (the necessity for thin films arises from the poor ion conductivities of such
electrolyte); (3) The safety of polymer electrolyte-based cells would be further
challenged by technical difficulties, since it would be almost impossible to manufacture
a polymer film of micrometer thickness in large scale and pinhole free; and (4) there
would be hardly any improvement in the tolerance against mechanical abuse for the
polymer electrolytes, since they do not offer superior mechanical strength to that of the
presently used polyolefin separators. In addition to the criticisms from Anderman
(1994), a further challenge to the application of SPEs comes from their interfacial
contact with the electrode materials, which presents a far more severe problem to the
ion transport than the bulk ion conduction does.
In liquid electrolytes, the electrodes are well wetted and soaked, so that the
electrode/electrolyte interface is well extended into the porosity structure of the
electrode. Hence, the ion path is little affected by the tortuosity of the electrode
materials. However, the solid nature of the polymer would make it impossible to fill
11
these voids with SPEs that would have been accessible to the liquid electrolytes, even if
the polymer film is cast on the electrode surface from a solution. Hence, the actual area
of the interface could be close to the geometric area of the electrode, that is, only a
fraction of the actual surface area that contact between electrode and electrolyte. Since
the porous structure is present in both electrodes in a lithium ion cell, the effect of
interfacial impedances associated with SPEs would become more pronounced (Song et
al, 1998)
However, the second category of polymer electrolyte called “gel polymer
electrolyte” (SPE) or “plasticized polymer electrolyte” are much closer to the actual
applications because they inherited the major properties from the bulk liquid
electrolytes, including ion conduction, electrochemical stability on both carbonaceous
anode and various metal oxide cathode materials, safety, and tolerance against
mechanical and electric abuses (Song et al, 1998). In GPEs, the major solvents are small
organic molecules that help in solvating the salts and also act as conducting medium.
While only small percentage of polymer are added in GPEs to provide mechanical
stability by increasing the viscosity of electrolytes (Sekhon et al, 1998). Since the small
amount of polymer only serves as the skeleton providing dimensional integrity, the
ether linkage of polymer is no longer the sole choice of building block for its chemical
structure. Thus eliminating potential concerns over the electrochemical stability that
might arise from the oxidative or reductive degradations of polymer segments in a
lithium or lithium ion cell environment. Certainly, the concomitant consequence of the
low polymer presence in GPEs is the poorer mechanical strength as compared with the
cases of the pure SPEs, and either chemical or physical cross-linking is frequently
necessary for the dimensional stability of such gel materials.
12
Composite electrolyte on the other hand, is a subset of polymer electrolytes with
an idea of incorporating electrochemically inert fillers in to polymer matrices (Croce at
e, 1998). Generally, high surface area particulate fillers such as ZrO2, TiO2, Al2O3 and
hydrophobic fumed silica were incorporated in to the polymer matrices and are called
“composite polymer electrolytes” or “composite ceramic electrolytes”. The advantages
of incorporating the fillers are two-fold. One is the enhancement in ionic conductivity at
low temperatures and the other one is to improve the stability at the interface with
electrodes. The increase in conductivity is generally attributed either to the formation of
a new kinetic path via a thin interphase layer along the interface itself, or to a
concentration enhancement due to space charges in the sub interface region (Liang 1973;
MacCallum and Vincent 1987, 1989; Maier, 1989; Wagner, 1989).

13
2.2 Ion conduction mechanism in electrolytes
The ability to conduct ion is the basic function of electrolytes. This would
determine how fast the energy stored in the electrodes can be delivered. In liquid
electrolytes, the transport of ions is realized via two-step process: (1) the solvation and
dissociation of ionic compounds (usually crystalline salts) by polar solvent molecules
and (2) the migration of these solvated ions through the solvent media. During the
solvation, the stability of the salt crystal lattice is energetically compensated by the
coordination of solvent dipoles with the isolated ions. Therefore these ions should
always migrate with a “solvation sheath” around them, which consists of a certain
number of oriented solvent molecules (Ue, 1994).
Ion conduction in the solid polymer electrolyte is fundamentally different from
the conventional ion-hopping conduction observed in aqueous electrolyte. The ion
conduction of polymer electrolyte below glass transition temperature, Tg is usually
described by a simple Arrhenius expression:
σ = σo e-Ea/RT (2.1)
where σo is a constant, R is the gas constant, T is the absolute temperature and Ea is the
activation energy for the thermally activated process.

14
However, at temperature above Tg, the ionic conductivity amorphous polymer
electrolytes is decidedly non-Arrhenius, that is, a plot of the logarithm of the
conductivity versus the reciprocal temperature is markedly curved. These conductivity
data is said to show Vogel-Tamman-Fulcher (VTF) profile. According to VTF,
viscosity (η) of the polymer electrolyte system at high temperature start to take place of
reaction rate where polymer segmental motion is faster than the classical ion hopping
rates which explain the non-Arrhenius behaviour. Conceptually, the local segmental
motion of the conductive polymer is often characterized by the glass transition
temperature (Tg) of the polymer, as exemplified by the VTF form of temperature-
dependent conductivity.
=
exp(−
) (2.2)
where T0 is the equilibrium glass transition temperature below which all segmental
motion is frozen and B is the pseudoactivation energy. Knowledge of the structural
properties of the ion-conducting amorphous phase is, however limited. Consequently,
the mechanism of ion conduction at the molecular level is still not fully understood.
However in general, polymers which are suitable to act as a matrix in polymer
electrolytes are those with low enough Tg to remain rubbery at room temperature while
preserving the lithium ion conductivities similar to those of the typical ionic liquid
systems. In spite of that, as the Tg of polymer is getting lowered, the mechanical
strength of these polymers approaches “liquidlike” state, thus conflicting with the
fundamental reason polymer electrolytes are desired (Stephan, 2005). Table 2.1 show
some selected polymer host and their chemical formulae.

15
Table 2.1 Some selected polymer host and their chemical formuale ( Stephan, 2005)
Polymer host Repeat unit Glass transition temperature, Tg (°C)
Melting point,
Tm (°C)
Poly(ethylene oxide) –(CH2CH2O)n– −64 65
Poly(propylene oxide) –(CH(–CH3)CH2O)n– −60 - Poly(acrylonitrile) –(CH2–CH(–CN))n– 125 317 Poly(methyl methacrylate) –(CH2C(–CH3)(–COOCH3))n 105 –
Poly(vinyl chloride) –(CH2–CHCl)n– 85 –
Poly(vinylidene fluoride) –(CH2–CF2)n– −40 171
Poly(vinylidene fluoride-hexafluoropropylene)
–(CH2–CH) −90 135
Apparently, the ion conduction in polymer electrolytes was close associated with
certain local structural relaxations related to glass transition of the polymer. Poly
(ethylene oxide) (PEO) is a commonly used example of ether-based polymer which can
dissolve inorganic salts and exhibit ion conduction at room temperature. Wright and co-
workers were the first group of researchers to discover that the ether-based polymer
poly(ethylene oxide) (PEO) was able to dissolve inorganic salts and exhibit ion
conduction at room temperature (Fenton et al, 1973). The ion conduction of PEO and
other similar polyether-based media mainly occurred in the amorphous phases.
A generally accepted model described a microscopic sequence in which lithium
ions were coordinated by the ether oxygen atoms on the segments of a polymeric chain
in a similar way to their complexation by crown ethers or other oligoether-based
solvents (Armand et al,1980). A continuous segmental rearrangement accompanied by
the gradual replacement of the ligands in the solvation sheath of lithium ions, hence,
resulted in the long-range net displacement of lithium ions, as shown in Figure 1.

Ion conduction actually
complexes of both charges.
ability, reflects the influence of these two
subsequent migration, in ter
Zi is the valence order of ionic species
expressed n in the equation below:
The mobility of an ion is known to vary inversely with its solvation radius r
to the Stokes-Einstein relation (
Figure 2.1 Schematic i(Xu, 2004)
on conduction actually consists of the oriented movement of ion/solvent
complexes of both charges. Ionic conductivity σ, which quantifies the ion
ability, reflects the influence of these two aspects, that is, solvation/dissociation and the
migration, in terms of the free ion number ni and the ionic mobility
is the valence order of ionic species i, and e is the unit char
expressed n in the equation below:
= ∑
ion is known to vary inversely with its solvation radius r
Einstein relation (Robinson & Stokes, 1959):
=
2.1 Schematic illustration of lithium ion transport in p
16
consists of the oriented movement of ion/solvent
, which quantifies the ion conduction
aspects, that is, solvation/dissociation and the
and the ionic mobility ui, where
is the unit charge of electrons as
(2.3)
ion is known to vary inversely with its solvation radius ri according
(2.4)
lithium ion transport in polyether media

17
where η is the viscosity of the media. This approach seems to be useful in increasing
the cation mobility when the cation species are kept constant. In spite of that, very few
attempts are realized at improving ion conductivity via the salt approach due to limited
choice of suitable anions for lithium electrolyte solute. Instead, solvent composition
tailoring has been the main tool for manipulating electrolyte ion conductivity (Bockris
and Reddy, 2000). From Equation (2.4), it is known that the most important bulk
properties of the solvents which determine the charge carrier number (ni) and ion
mobility (µ i) are dielectric constant ε and viscosity η.
In order for a solvated ion to migrate under an electric field, it must prohibit
from forming close ion pairs with its counterions by the solvating solvent. The ability of
the solvent molecule in shielding the interionic coulombic attraction is closely related
with its dielectric constant. The critical distance for the ion pair formation q is given by
Bjerrum’s treatment,
= !!"
#$$% (2.5)
where z, ε0, k, and T are the valence orders of ions, the dielectric constant of vacuum,
Boltzmann’s constant, and temperature, respectively (Bockris and Reddy, 2000;
Robinson and Stokes, 1959). Apparently, in a solvent with a higher dielectric constant,
ions would have a higher probability of staying free at a given salt concentration and ion
association would be less likely to occur.
Solvents of low viscosity have always been considered the ideal candidates for
electrolyte application. However, their actual use was restricted because most of these

18
solvents have low dielectric constants and cannot dissociate ions effectively enough to
prevent ion pairing (Jasinski, 1968). Since a high dielectric constant and low viscosity
usually cannot be integrated into a single solvent, usually binary or mixture of selected
components with optimum viscosity and dielectric was used to formulate electrolytes
for lithium batteries (Bockris and Reddy, 2000). Extensive studies have been carried out
on the effects of salt concentration, solvent composition, and temperature on ionic
conductivity in different electrolyte systems (Xu and Angell, 2001; Ding et al, 2001;
Chen et al, 2000). The most meticulous work among these research by Ding et al. (2001)
and Chen et al. (2000). They developed a series of binary systems pertinent in lithium
ion cells. This trend allows the tailoring of salt concentration and solvent composition to
maximize ion conductivity at a given temperature for practical interests.
19
2.3 PEO/PMMA blend polymer electrolytes
A macromolecule is simply a molecule with a large relative molecular mass, Mr.
A polymer electrolyte must have high ionic conductivity. The main criteria for the
selection of polymer as a host in the polymer electrolyte are polymer must contain polar
groups which can act as electron donors in order to form a dative bond with the cations
of the incorporating salts. Other than that, the polymer must have low glass transition
temperature, Tg and high dielectric constant,ε. Glass transition temperature, Tg
constitutes the most important mechanical property for all polymers. Upon synthesis of
a new polymer, the glass transition temperature is among the properties measured. The
glass transition temperature, Tg is the temperature at which the amorphous phase of the
polymer is converted between rubbery and glassy state. Above Tg polymer is in rubbery
state, the polymer is soft and flexible; below Tg polymer is in glassy state, the polymer
is hard and rigid.
PEO-based electrolyte is the earliest and the most extensively studied system.
This system usually refers to the solvent-free PEO-salt complexes. The electrolytes
commonly exhibit conductivities which range from 10-8 to 10-4 S cm-1 at temperatures
between 40 and 100 oC, which excludes practical applications at ambient temperature.
This obstacle originates from, first, the high degree of crystallinity which is
unfavourable for ionic conduction in these complexes and, second, the low solubility of
salt in the amorphous phase. However, their high viscosities even near its melting point
allow a very thin electrolyte layers. Therefore, many valuable investigations and
evolution have therefore focused primarily on the PEO-based electrolytes via various
approaches such as using blends (Borkowska et al, 1993; Wieczorek et al, 1995),

20
copolymers (Wieczorek and Stevens, 1997), combbranch polymers (Booth et al, 1989)
and cross-linked ‘networks’ (LeNest et al,1985). All these enhancements have been
achieved either by reducing the crystallinity of polymers or by lowering the glass-
transition temperature.
On the other hand, Iijima and Toyoguchi (1985) found that poly (methyl
methacrylate) (PMMA) could be used as gelating agent in polymer electrolytes. The
influence of concentration of polymer in the gelled electrolytes and the conductivity and
viscosity of gel electrolytes comprising of PMMA-LiClO4 and PC have been reported
(Iijima et al, 1985). At ambient temperature the ionic conductivity was found to
decrease with increasing amount of polymer and was in the range of 10−3–10−5 S cm−1
(Bohnke et al, 1993). In low concentrations of PMMA, the gelatinized electrolyte was
considered as a liquid electrolyte encaged in a polymer matrix. However, the decrease
in ionic conductivity and an increase in activation energy at high concentration were
attributed to some interactions created between the polymer chain and the conducting
electrolytes. In addition, they have been shown to possess higher Li+ transference
numbers than PEO and good compatibility with lithium (Iijima et al, 1985). However,
though PMMA have better conductivity and compatibility with lithium electrodes, their
practical application is offset due to their poor mechanical strength.
Consequently, a new attempt has been achieved to provide a powerful route to
engineering new properties in materials using available polymers - polymer blending.
Blending of polymers generally increase the amorphousity of the electrolyte and inhibit
crystallinity thus leading to conductivity mechanical strength enhancement. From
polymer blending it is possible to produce a range of materials with properties that are

21
superior to that of each individual component polymers (Rhoo et al, 1997; Oh and Kim,
1999; Pielichowski, 1999; Stephen et al, 2000; Tang and Liau, 2000; Pielichowski and
Amerton, 2000). The main advantages of the blended systems are simplicity of
preparation and ease of control of physical properties by compositional changes (Acosta
and Morales, 1996; Rocco et a., 2001) and also it usually requires little or no extra
expenditure compared to new polymer synthesis. However, the miscibility between the
constituents of polymer mixture on molecular scale is responsible for material with
superior properties (Rajulu et al, 1999).
Miscibility between the components in the polymer blend determines the
polymer electrolyte performance. Miscibility may arise from specific interactions, such
as dipole-dipole forces (Aubin et al, 1983) and charge transfer complexes (Ohno and
Kumanotani, 1979) for homopolymer mixtures or segment-segment repulsion inside the
blends. The breakage and formation of new bond between the polymers in miscible
polymer blend require less applied thermal energy to produce chain mobility which
increases ionic conductivity of the polymer electrolyte. In general, miscible blend of
two polymers have the properties somewhere between or more superior than those of
the two unblended polymers.

22
2.4 Solvent
Generally, the solvent in liquid electrolytes is used to allow facile ion transports
that determine the performance of device. The solvent in conventional liquid electrolyte
remain in the system but however, the solvent that used in polymer electrolyte system
does not remain in the system but evaporated after the formation of polymer electrolytes.
Solvent in polymer electrolytes does not contribute much in faster ion transport but is
used to dissociate and stabilized the ions in the system and prevent ion agglomeration.
The ionic conductivity of polymer electrolytes is due to local segmental motion of
polymer mainly. Conspicuously, local relaxation of the polymer chain explains the ion
conduction in the system.
The solvent used to dissolve polymer, salts, plasticizer and filler must possesses
high dielectric constant, ε to ensure complete dissociation of ions to allow possible
interactions between the components that give rise to superior properties. An ideal
solvent should meet the following minimal criteria: (1) It should be able to dissolve
salts to sufficient concentration. In other words, it should have a high dielectric constant
(ε). (2) It should be fluid (low viscosity è), so that facile ion transport can occur. (3) It
should remain inert to all cell components, especially the charged surfaces of the
cathode and the anode, during cell operation. (4) It should remain liquid in a wide
temperature range. In other words, its melting point (Tm) should be low and its boiling
point (Tb) is high. (5) It should also be safe (high flash point Tf), nontoxic, and
economical (Xu 2004). In addition, polymer electrolyte solvents which are only organic
molecules must be able to dissolve sufficient amounts of lithium salt as well. Therefore,

23
only those with polar groups such as carbonyl (C=O), nitrile (C≡N), sulfonyl (S=O),
and ether-linkage (-O-) merit consideration.
In 1958 it was observed that lithium could be electrodeposited from a solution of
LiClO4 in PC, and PC became the immediate focus of investigation (Jasinski and
Kirkland, 1663). However, it was soon discovered that PC solvent offered poor cycling
efficiency and the potential hazards that make people turned to ethers for improved
lithium morphology (Jasinski,1967; Selim and Bro, 1974; Raul and Brummer, 1977).
The formation of dendrite lithium in ether based solvents seemed to be sufficiently
suppressed even at high charge rates (Koch et al,1982). However, efforts to incorporate
ether-based electrolytes in lithium cells were still troubled by the poor capacity retention
and prolonged cycling (>100 cycles) of the cells still produced dendrite deposition
which terminated the cells by creating shorts, despite the improved lithium morphology
observed in the short term (Abraham et al, 1984)
Compared with PC, EC has comparable viscosity and slightly higher dielectric
constant, which are favorable merits for a solvent candidate. However, because of its
high melting point (36 °C), it was never favored as an ambient-temperature electrolyte
solvent in the early days of lithium battery research. In early 1970s, Scrosati and Pistoia
(1970) reported that the suppression of the melting point of EC could be done by
addition of small percentage (9%). Further investigation found that the electrolytes
based on EC as compared with PC demonstrated improvements, not only in bulk ion
conductivity but also in interfacial properties such as lower polarization on various
cathode surfaces (Pistoia et al,1970)

On the other hand
It is produced mainly as a byproduct of acrylonitrile manufacture. I
medium-polarity solvent that is miscible with water and has a convenient liquid rang
laboratory with a dipole moment of 3.84
applications because of its relatively high dielectric constant and ability to dissolve
electrolytes (Internet reference
reactivity make it a popular choice for
molecules is not fully under
considerations are involved
Table 2.2 Properties of various polymer electrolyte solvents (29/12/2009)
Solvent Molecular structure
EC
PC
Aceto-nitrile THF
In spite of that, Tetrahydrofuran (THF) appears to be the preferable solvent in
the laboratory when a
water miscibility is not an issue.
low viscosity at standard temperature and pressure. This heterocyclic compound has the
chemical formula (CH
is a useful solvent (Internet reference 18
On the other hand, acetonitrile is a colourless liquid with simplest organic nitrile.
It is produced mainly as a byproduct of acrylonitrile manufacture. I
polarity solvent that is miscible with water and has a convenient liquid rang
ith a dipole moment of 3.84 D, Acetonitrile is widely used in
applications because of its relatively high dielectric constant and ability to dissolve
Internet reference 29/12/2009). Its low viscosity and low chemi
reactivity make it a popular choice for solvent. However, the role of
molecules is not fully understood, since thermodynamic salvation
considerations are involved in addition to dynamic mass-transport
Properties of various polymer electrolyte solvents (
Mw Tm/ oC Tb/ oC
Viscos-city, η
Dielectric constant, ɛ (25°C)
88 36.4 248 1.9 89.78 (40°C)
102 -48.8 242 2.53 64.92
41 -45.0 82 0.352 36.00
72.11 -108.4 66 0.48 7.58
In spite of that, Tetrahydrofuran (THF) appears to be the preferable solvent in
the laboratory when a moderately higher-boiling ethereal solvent is required and its
water miscibility is not an issue. THF is a colourless, water-miscible organic liquid with
low viscosity at standard temperature and pressure. This heterocyclic compound has the
la (CH2)4O. As one of the most polar ethers with a wide liquid range, it
Internet reference 18/09/2011). The oxygen center of ethers in THF
24
simplest organic nitrile.
It is produced mainly as a byproduct of acrylonitrile manufacture. It is used as a
polarity solvent that is miscible with water and has a convenient liquid range in
Acetonitrile is widely used in the battery
applications because of its relatively high dielectric constant and ability to dissolve
. Its low viscosity and low chemical
he role of the solvent
salvation dissociation
effects.
Properties of various polymer electrolyte solvents (Internet Reference
Dielectric constant,
(25°C)
Dipole moment/ debye
Density/ g cm-3, 250C
4.61 1.321
4.81 1.200
3.84 0.7767
1.75 0.8892
In spite of that, Tetrahydrofuran (THF) appears to be the preferable solvent in
boiling ethereal solvent is required and its
miscible organic liquid with
low viscosity at standard temperature and pressure. This heterocyclic compound has the
O. As one of the most polar ethers with a wide liquid range, it
The oxygen center of ethers in THF

25
can coordinate to Lewis acids such as Li+, Mg2+, and boranes. THF appear as a better
option to dissolve polymer due to the THF is considered a relatively nontoxic solvent,
with the median lethal dose comparable to that for acetone and acetronitrile. Table 2.2
shows the properties of various polymer electrolyte solvents.
26
2.5 Salts
An ideal electrolyte solute for rechargeable polymer lithium batteries should
meet the following minimal requirements: (1) It should have large anions and low
dissociation energy so that it easily dissociates. (2) The anion should be stable against
oxidative decomposition at the cathode. (3) The anion should be inert to electrolyte
solvents. (4) Both the anion and the cation should remain inert toward the other cell
components such as separator, electrode substrate and cell packaging materials. (5) The
anion should be nontoxic and remain stable against thermally induced reactions with
electrolyte solvents and other cell components. Apparently, the available choice of
lithium salts that are suitable for electrolyte application is rather limited when compared
to the wide spectrum of aprotic organic compounds that could make possible electrolyte
solvents (Kang, 2004).
In spite of that, LiClO4 has been a popular electrolyte solute owing to its
satisfactory solubility and high conductivity (9.0 mS cm-1 in EC/DMC at 20 °C) as well
as its high anodic stability (Tarascon et al, 1994). Recent studies found that solid
electrolytes interface (SEI) films formed in LiClO4 electrolytes, on both lithium and
carbonaceous anode surfaces, are of lower impedance than those formed in LiPF6 or
lithium tetrafluoroborate (LiBF4) electrolytes due to the absence of hydrogen fluoride
(HF) (Aurbach et al,1995). It is believed that HF will reacts with either alkyl carbonate
or Li2CO3 and forms the highly resistive lithium fluoride (LiF) (Aurbach et al,1995).
Compared with other lithium salts, LiClO4 also has the merits of being relatively less
hygroscopic and is stable to ambient moisture. However, the high oxidation state of
chlorine (VII) in perchlorate makes it a strong oxidant, which readily reacts with most
27
organic species in violent ways under certain conditions such as high temperature and
high current charge (Jasinski and Carroll, 1970). Actually, back in the 1970s it had
already been realized that LiClO4 was impractical as an electrolyte solute for industry
purposes (Jasinski and Carroll, 1970). Nevertheless, it is still frequently used as a salt of
convenience in various laboratory tests because it is easy to handle and economical.
In general, LiAsF6 was a superior salt to LiClO4 as an electrolyte solute for
lithium batteries (Rauh et al, 1978). However, the electrochemical reduction of As(V)
would raise concern about the safety of using LiAsF6 in a commercial battery where
arsenate in its oxidation state of As(III) and As(0) are particularly toxic. In spite of that,
the combination of cathodic and anodic stability would have made LiAsF6 a very
promising candidate salt for both lithium and lithium ion batteries yet the toxicity not
been a source of concern (Jasinski and Carroll, 1970). Like LiAsF6, LiBF4 is a salt
based on an inorganic superacid anion and has moderate ion conductivity in nonaqueous
solvents. It was out of favouring in the early days of lithium battery research because
the ether-based electrolytes containing it were found to result in poor lithium cycling
efficiencies, which decayed rapidly with cycle number (Koch et al, 1978). However,
later it was found that the multiple advantages of LiBF4 as compared with other salts
which include less toxicity than LiAsF6 and higher safety than LiClO4, but its moderate
ion conductivity has been a major obstacle to its application (Ue, 1994).
Among the numerous salts vying for lithium/lithium ion batteries, LiPF6 was the
obvious winner and was eventually commercialized. The success of LiPF6 was not
achieved by any single outstanding property but, rather by the combination of a series of
well- balanced properties with concomitant compromises and restrictions. For example,

28
in the commonly used carbonate solvent mixtures it has a lower conductivity than
LiAsF6 (Walker et al 1996), a lower ionic mobility than LiBF4 (Ue, 1994), a lower
thermal stability than most of the other salts (Methlie et al,1969), a lower anodic
stability than LiAsF6 and LiSbF6 (Takeda et al,1997) and a lower chemical stability
toward ambient moisture than LiClO4, LiIm, and LiTf. However, none of these other
salts could meet all these multifaceted requirements simultaneously as well as LiPF6
does. LiPF6 was proposed as an electrolyte solute for lithium-based batteries in the late
1960s.
With a cell thickness measuring as little as one millimeter (0.039 inches), dry
polymer electrolytes enable equipment designers to create designs with their own
imagination in terms of form, shape and size. Since then, it is possible to have part of a
protective housing in the shape of a mattress that can be rolled up, or are even
embedded into a carrying case or piece of clothing. Unfortunately, the dry Li-polymer
suffers from poor conductivity. Internal resistance is too high which cause them
unsuitable in the commercial application.

29
2.6 Plasticizer
Plasticizers are addictives that increase the plasticity or fluidity of a material.
There are many types of plasticizers for various applications such as plasticizer for
plastics, concrete, gypsum wallboard production and plasticizer for energetic materials.
In polymer electrolytes, plasticizer for plastics is used to further increase the ionic
conductivity of polymer electrolyte system. Plasticizers work by embedding themselves
between the chains of polymers, spacing them apart (increasing the free volume and
thus significantly lowering the glass transition temperature.
Table 2.3 Examples of plasticizers commonly used in polymer electrolytes (Nogueira et
al, 2004).
Plasticizer Dielectric constant Viscosity / mPa.s (at
25oC)
Ethylene carbonate (EC) 89.6 1.86
Propylene carbonate (PC) 64.4 2.53
Dimethyl sulfoxide 46.8 2.0
Diethyl carbonate (DEC) 2.82 0.748
Dimethyl carbonate (DMC) 3.12 0.585
Dimethylacetamide (DMA) 37.8 1.937
Plasticizer that used in polymer electrolytes must possesses high dielectric
constant and good miscibility with polymer-salt to help in dissociating the salts, thereby
increasing the number of mobile ions which leads to conductivity enhancement. Other

30
than that, it must have low viscosity and volatility to help to increase the mobility of the
conducting ions. Plasticizer with high boiling temperature and low freezing temperature
is important as it can used to reduce the crystallinity of the host polymer and decrease
the viscosity of the polymer electrolytes. Some plasticizers are able to assist in
dissolution and dissociation of salts that further lower down the glass transition
temperature, Tg and provide new pathways for the ion migrations which increase the
ionic mobility. (Cao et al, 1995; Biancardo et al. 2006). Table 2.3 shows the examples
of plasticizers commonly used in polymer electrolytes (Nogueira et al, 2004).
From Table 2.2, it is obvious that ethylene carbonate (EC) is most suitable to be
used as plasticizer as EC has the highest dielectric constant and lowest viscosity among
other plasticizers. In addition, the essence of plasticizer addition is to enhance the
conductivity of solid polymer electrolytes using low molecular weight and high
dielectric constant additives such as propylene carbonate (PC), ethylene carbonate (EC),
polyethylene glycol (PEG) etc. (Kumar and Sekhon , 2002; Tsutsumi et al, 1998). These
additives increase the amorphous content of the polymer matrix and tend to dissociate
ion-pairs into free cations and anions thereby leading to an overall enhancement in
conductivity. Therefore, by incorporating substantial amount of plasticizer, improved
ionic conductivity of polymer electrolytes have been attained. By increasing the
polymer segmental mobility, plasticizers can result in greater ion dissociation which
allows greater numbers of charge carriers for ionic transport.
31
2.7 Filler
Fillers are particles that added in polymer electrolytes to form composite
polymer electrolytes. Fillers are able to improve the ionic conductivity without
degrading mechanical and interfacial properties of polymer electrolyte. Examples of
fillers that used in polymer electrolytes are oxide ceramics including Al2O3, TiO2, and
ZrO2, treated SiO2, molecular sieves or zeolite, rare-earth ceramics, carbon, and
ferroelectric materials (Maier et al, 1989). Inorganic or ceramic fillers are most
commonly used type of filler in polymer electrolyte system. However, the particle size
and the characteristics of the fillers play vital roles in the electrochemical properties of
the electrolytes (Srun Jung et al, 2009).
In a polymer electrolyte, relaxation and segmental motion of the polymer chains
are regarded as the key factors in enabling ion transport, suggesting that a sufficient
conductivity obtained only when the polymer is over its amorphous state. The addition
of fillers to a polymer was found to improve the ionic conductivity by reducing the
crystallization tendency. Upon filler addition into polymer electrolyte, filler particles
compete with Li+ to coordinate with polymer chain segment. Such coordination
prevents polymer host from crystallizing and releases more free Li+ ions. These two
modes of coordination produce more dissociated lithium ions as charge carriers and
more amorphous region for the carriers to transfer and finally enhance the conductivity
of the polymer electrolytes (Maier et al, 1989).
32
Most of the studies have focused on the synthesis of nanosized fillers because
the mechanical strength and the electrochemical performance of the electrolytes
increase with the decreasing size of fillers. Having nanosized of filler with greater
surface charges increase the ionic charge carrier concentration at the interface and create
the presence of a high conductivity path at the interface. This help in developing
connectivity or ‘percolation’ at a certain composition threshold of the dispersoid.
Introducing ceramic powders with nanometer-sized grains to a polymer electrolyte may
improve mechanical strength as well. At the electrode/electrolyte interface, certain
ceramic fillers are found to suppress the growth of resistive layers (Scrosati and Vincent,
2000). The addition of these solid fillers to the polymer electrolyte significantly
increases the properties of the electrolytes in terms of ionic conductivity, mechanical
stability, thermal and chemical stability, and stability of the interface between the
electrolytes and lithium electrodes.

33
2.8 Dielectric properties of polymer electrolytes
Dielectrics are insulating materials which have very tightly bound electrons to
the nuclei in their atoms. Accordingly they have very few free electrons to flow the
current and their electrical conductivity is very low. Most of the polymers (or plastics)
are typical dielectrics. Irradiation of polymers with gamma rays, neutrons, protons or
other heavy ions produces structural changes in the polymer matrix. Such changes have
been studied in recent past by many workers (Singh et al., 2005, Surinder Singh 2006,
Martinez-Pardo et al., 1998)
The most important property of a dielectric is to get polarized under the action
of applied electric field. As the relationship between electric displacement vector &''(,
electric field vector )'( , polarization vector *'+ and the dielectric constant (or relative
permittivity) εr is given by
&''( = ,)'( + *'( = ,, )'( = ,)'( (2.6)
where ε0 is the permittivity of free space, a measurement of dielectric constant, εr gives
significant insight to the modification of the bulk properties responsible for the
dielectric response. Such studies will give better understanding of track formation
mechanism on the basis of microstructures so formed due to passage of heavy ions
through polymers (or plastics).
The study of changes in dielectric response of solids also provides information
about orientation and translational adjustment of mobile charges present in the dielectric

34
medium in response to an applied electric field. The energy transferred to an alternating
field is a function not only of the field but also depends on physical characteristic of the
material. The dependence of contributions of different components of dielectric
polarization (viz. the electric polarization, ionic polarization and orientational
polarization) on frequency of applied ac field is responsible for the changes in the value
of dielectric constant.
The dielectric constant (or relative permittivity) of a dielectric solid, placed in an
alternating electric field of angular frequency ω, is a complex quantity because the
orientational polarization lags behind the polarizing electric field as the frequency of the
applied field is increased. The complex dielectric constant can be written in the form
,(.) = ,′(.) − 0,′′(.)1 (2.7)
where ,′(.) is the real dielectric constant and characterizes the most important
electrical property of the dielectric material. The imaginary part ,′′(.) characterizes
the dissipation of energy of electric oscillation in a dielectric subjected to the action of
an alternating electric field. In this way there is a phase lag between the electric
displacement vector &''(, and the electric field vector )'( because at high frequencies the
dipoles do not faithfully follow the rapidity of the applied alternating field.
This phase lag is described by the so-called dielectricloss tangent or dissipation
factor given by
tan 5 = ,′′6(7)
,′6(7) (2.8)
The magnitude of real dielectric constant ,′(.) of the polymer is determined
by the chemical constitution, structure and composition. The parameters that

35
characterize the dielectricloss depend upon the specific features of molecular motion in
polymers; hence, on changes in their chemical constitution and structure. Real
polymeric dielectrics are commonly described by a spectrum of relaxation times. In
their case relaxation spectra appear due to presence of long polymeric chains and
specific inter-molecular interactions. However, the expression for ,(.)assume the
simplest form in the case of relaxation process characterized by a single relaxation time
(Perpechko, 1997). If we introduce a relaxation time τ, for the process to go from one
equilibrium state to another equilibrium state, i.e., from absorption to dissipation,
,′(.) = 8 +
9.: (2.9)
,′′(.) =
9.: (2.10)
where A and B are constants and ω is the angular frequency.
On the other hand, dielectric constant was calculated from the measured
capacitance using the relation (Perpechko, 1997)
, =;<
;= , >? =
$@
Ae (2.11)
Here, εo is the permittivity of vacuum or free space, A is the cross-sectional area and d
is the thickness of the sample film. Cp is the capacity of the condenser filled with the
dielectric (plastic).

36
2.9 Thermal stability of polymer electrolytes
Polymer electrolytes that exhibit fast ion transport at elevated temperatures are
essential especially in electrochemical devices that operating in the 100-200oC range.
For instance, the used of polymer electrolytes in fuel cell at elevated temperature has
several advantages. It increases the kinetic rates for the fuel cell reactions, it reduces
problems of catalyst poisoning by absorbed carbon monoxide in the 150±2008C range,
it reduces the use of expensive catalysts, and it minimizes problems due to electrode
flooding. Thus, the thermal stability of polymer electrolyte is a very important.
Generally, it is very difficult to increase the thermal stability of polymer
electrolytes owing to the chemical instability of electrolytes in the organic solvents at
elevated temperature and the difficulty of replacing it with new lithium salts. Xu et al.
(2002) and Jow et al. (2003) showed that LiPF6-based cells suffer obvious permanent
capacity loss when operate at temperatures up to 70 °C. They believed that reactive
decomposition products such as HF and PF5 confer upon the electrolyte stable
performance at elevated temperatures. On the other hand, Zhang et al. (2002) reported
that electrolytes based on LiBF4 could allow the lithium ion cells to cycle at
temperatures up to 70 °C. Irreversible reactions occurred at temperatures above 80 °C,
and the cells lost capacity rapidly, which was accompanied by the rise of cell impedance
simultaneously.
Principally, thermal stabilities of polymer electrolyte were studied by heating
samples in a TGA and DSC and analyze the resulting residues by elemental analysis.

37
The glass transition temperature, melting point and the thermal stability of the polymer
electrolyte membrane are all important parameters resulting from the microstructure and
morphology of the system. These parameters will affect the overall properties of the
electrolyte. The glass transition temperature (Tg) is one of the most important
parameters of the amorphous phase for the flexibility of the polymer at room
temperature. The volume of amorphous phase in polymer electrolyte system can be
calculated using relative percentage of crystallinity. By assuming that PMMA-PEO-
LiClO4-EC as comparison, the relative percentage of crystallinity (Xc) was calculated
based on the following equation with the DSC data. The degree of crystallinity (χc) of
the MnO2 fraction in the matrix is calculated from the equation.:
χC (Diller) = ∆IJ,LMN
∆IJ.PLLQPRNSTUVNWRU (2.12)
Where ∆HY.Z[[\Z]^_`ab^c]a = 198.45 J g-1 is the melting enthalpies per gram of
solid polymer electrolyte system without filler (Cosaerr et al, 2002) and ∆HY,[d^e is
the melting enthalpies per gram of solid polymer electrolyte system with filler. The
apparent enthalpies of melting (∆Hm) are derived from the area under the endothermic
peaks respectively.

38
2.10 Optical properties of electrolytes
It is known that optical absorption studies have been particularly useful to
understand the band structure and energy gap of crystalline and amorphous materials.
The band structure, direct and indirect transition, as well as the absorption edge of
amorphous and crystalline materials can be determined from optical absorption results,
which illustrate the energy band structure. Insulators/semiconductors are generally
classified into two types; (a) direct band gap and (b) indirect band gap. The top of the
valence band and the bottom of the conduction band both correspond to zero crystal
momentum in direct band gap semiconductors. It is a different case for indirect band
gap semiconductors, whereby the bottom of the conduction band does not correspond to
zero crystal momentum. In indirect band gap materials, the transition from valence to
conduction band is associated with a phonon of the right magnitude of crystal
momentum.
Davis and Shalliday (Davis and Shalliday, 1960) reported that near the
fundamental band edge, both direct and indirect transitions occur and can be observed
by plotting α1/2 and α2 as a function of energy (hν) as in Equation (2.15) and (2.16)
(Davis and Shalliday, 1960 ; Thutpalli and Tomlin, 1976) :
(hνnα)2=C1(hν−Egd) (2.15)
(hνnα)1/2=C2(hν−Egi) (2.16)
where hν is the photon energy, Egd, the direct band gap, Egi, the indirect band gap, n, the
refractive index, α, the absorption coefficient and C1, C2 are constants. These

39
expressions can be applied to both direct and indirect transitions and are helpful in the
determination of the band structure of materials. When a direct band gap exists, the
absorption coefficient has the following dependence on the energy of the incident
photon as in Equation (2.17) (Davis and Shalliday, 1960 ; Thutpalli and Tomlin, 1976)
αhν=C(hν−Eg)1/2 (2.17)
where Eg is the band gap, C, is a constant dependent on the specimen structure, α is the
absorption coefficient, ν is the frequency of the incident light, and h, the Planck's
constant. To determine the nature and width of the band gap, α, (αhν)2, (αhν)1/2 were
plotted as a function of photon energy (hν) and the absorption edge values were
obtained by extrapolating the linear portions of the curves to zero absorption value. For
indirect transitions, which require photon assistance, the absorption coefficient has the
following dependence on the photon energy (Davis and Shalliday, 1960 ; Thutpalli and
Tomlin, 1976).
αhν=A[hν−Eg+Ep]2+B[hν−Eg−Ep]
2 (2.18)
where Ep is the energy of the photon associated with the transition and A and B are
constants depending on the band structure.
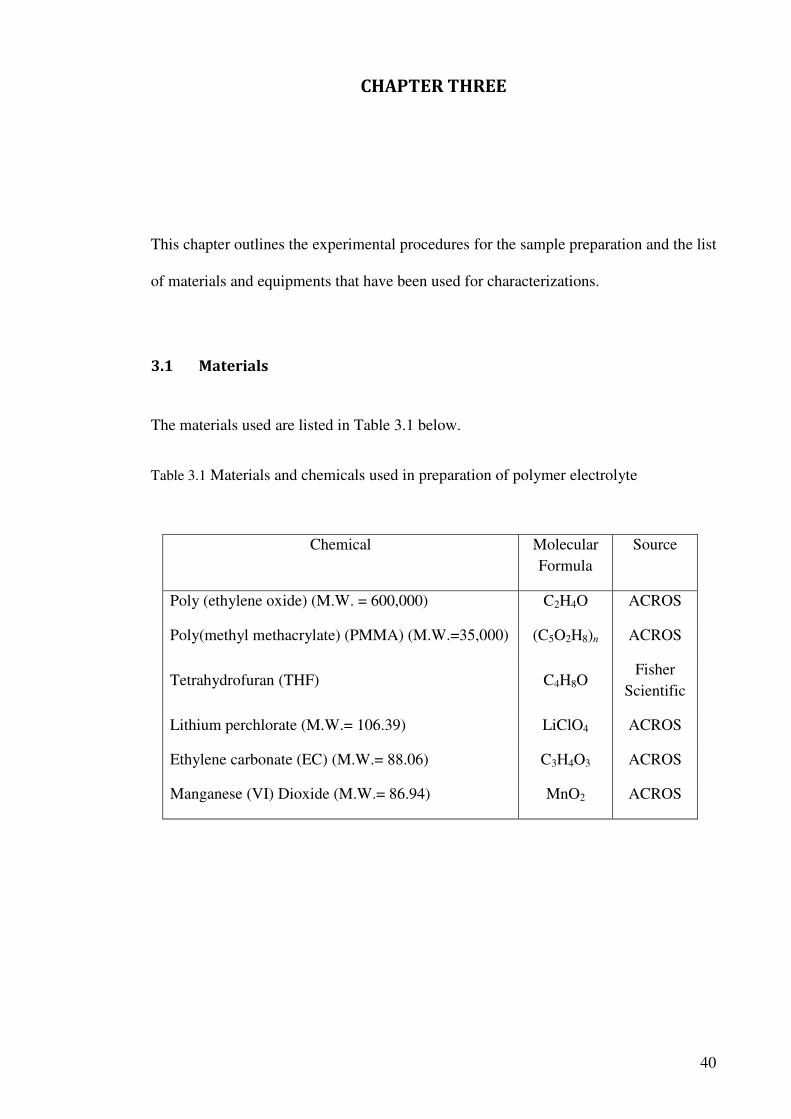
40
CHAPTER THREE
This chapter outlines the experimental procedures for the sample preparation and the list
of materials and equipments that have been used for characterizations.
3.1 Materials
The materials used are listed in Table 3.1 below.
Table 3.1 Materials and chemicals used in preparation of polymer electrolyte
Chemical Molecular Formula
Source
Poly (ethylene oxide) (M.W. = 600,000) C2H4O ACROS
Poly(methyl methacrylate) (PMMA) (M.W.=35,000) (C5O2H8)n ACROS
Tetrahydrofuran (THF) C4H8O Fisher
Scientific
Lithium perchlorate (M.W.= 106.39) LiClO4 ACROS
Ethylene carbonate (EC) (M.W.= 88.06) C3H4O3 ACROS
Manganese (VI) Dioxide (M.W.= 86.94) MnO2 ACROS

41
3.2 Preparation of polymer blend electrolyte
3.2.1 Preparation of PMMA-PEO blend polymer electrolytes
PMMA and PEO were put in a vacuum oven respectively at 60 and 100oC for 24 hours.
Desired amount of PMMA was dissolved in tetrahyrofuran and stirred for about 12
hours. Respective amount of PEO was dissolved in tetrahydrofuran and stirred for about
12 hours at 60oC. The two solutions were then mixture together and stirred for another
12 hours to get a homogeneous viscous mixture as shown in Figure 3.1. The solution
obtained was cast as thin film on petri dishes and solvents were allowed to evaporate at
room temperature. The samples were stored in desiccators until further use. Table 3.2
summarized the weight percent and mass of the prepared samples.
Figure 3.1 Solution-casting for thin films

42
Table 3.2 Samples with various composition of PMMA-PEO blend films
Sample PMMA PEO
Wt(%) Mass (g) Wt (%) Mass (g)
90PMMA_10PEO 90 0.90 10 0.10
80PMMA_20PEO 80 0.80 20 0.20
70PMMA_30PEO 70 0.70 30 0.30
60PMMA_40PEO 60 0.60 40 0.40
50PMMA_50PEO 50 0.50 50 0.50
40PMMA_60PEO 40 0.40 60 0.60

43
3.2.2 Preparation of PMMA-PEO-LiClO4 polymer electrolytes
Prior to the preparation of polymer electrolytes, LiClO4 was dried at 100 oC for 24 hours
in order to remove any trace of water present in the samples. Having optimized and
confirmed the homogeneous blending of PMMA-PEO composition (80PMMA:20PEO)
showed the highest conductivity, manipulated amount of salt were added into the
solution and similar procedure as stated previously was carried out to produce thin film
on Petri dishes. The total amount of salt was based on 100% by weight of the total
polymer blend (PMMA-PEO). The samples were stored in the desiccators until further
use. Table 3.3 summarized the weight percent and mass of the prepared sample.
Table 3.3 Composition of PMMA-PEO-LiClO4 with manipulated salt content
Sample
PMMA PEO LiClO4
Mass (g) Mass (g) Wt (%) Mass (g)
80PMMA:20PEO 0.80 0.20 0 0.0000
78PMMA:19.5PEO:2.5Li 0.80 0.20 2.5 0.0256
76PMMA:19PEO:5Li 0.80 0.20 5.0 0.0526
74PMMA:18.5PEO:7.5Li 0.80 0.20 7.5 0.0811
72PMMA:18PEO:10Li 0.80 0.20 10.0 0.1111
70PMMA:17.5PEO:12.5Li 0.80 0.20 12.5 0.1429
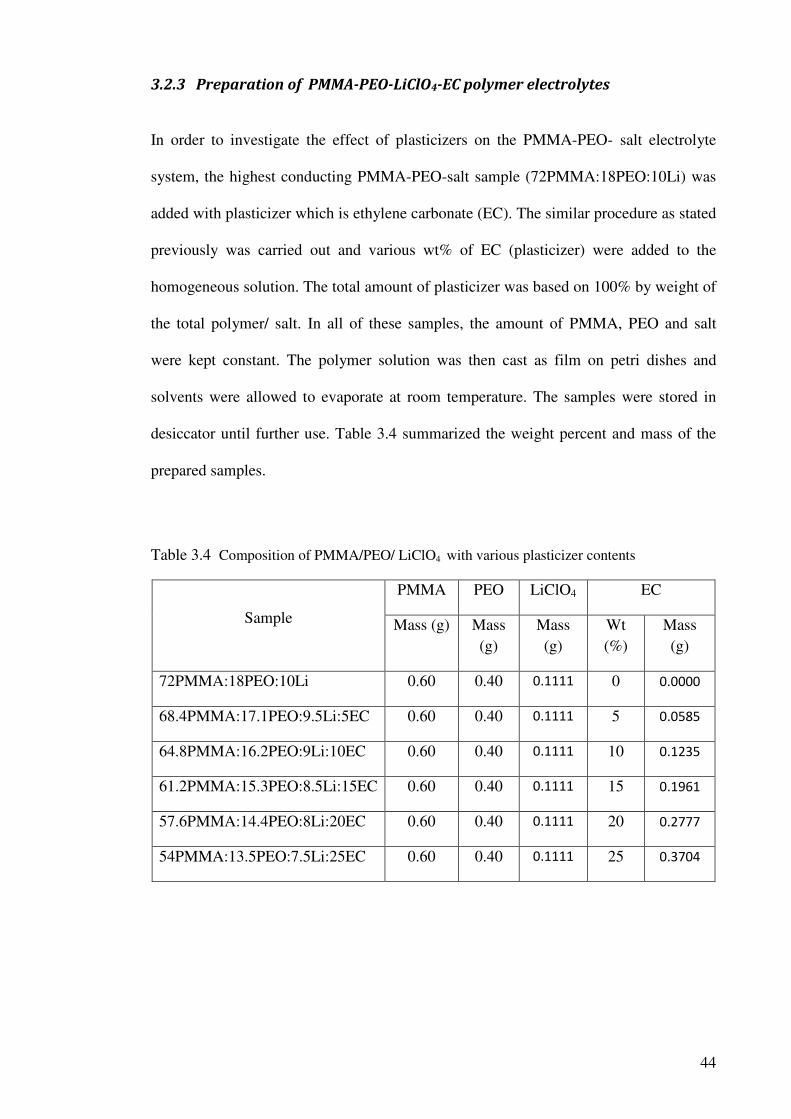
44
3.2.3 Preparation of PMMA-PEO-LiClO4-EC polymer electrolytes
In order to investigate the effect of plasticizers on the PMMA-PEO- salt electrolyte
system, the highest conducting PMMA-PEO-salt sample (72PMMA:18PEO:10Li) was
added with plasticizer which is ethylene carbonate (EC). The similar procedure as stated
previously was carried out and various wt% of EC (plasticizer) were added to the
homogeneous solution. The total amount of plasticizer was based on 100% by weight of
the total polymer/ salt. In all of these samples, the amount of PMMA, PEO and salt
were kept constant. The polymer solution was then cast as film on petri dishes and
solvents were allowed to evaporate at room temperature. The samples were stored in
desiccator until further use. Table 3.4 summarized the weight percent and mass of the
prepared samples.
Table 3.4 Composition of PMMA/PEO/ LiClO4 with various plasticizer contents
Sample
PMMA PEO LiClO4 EC
Mass (g) Mass (g)
Mass (g)
Wt (%)
Mass (g)
72PMMA:18PEO:10Li 0.60 0.40 0.1111 0 0.0000
68.4PMMA:17.1PEO:9.5Li:5EC 0.60 0.40 0.1111 5 0.0585
64.8PMMA:16.2PEO:9Li:10EC 0.60 0.40 0.1111 10 0.1235
61.2PMMA:15.3PEO:8.5Li:15EC 0.60 0.40 0.1111 15 0.1961
57.6PMMA:14.4PEO:8Li:20EC 0.60 0.40 0.1111 20 0.2777
54PMMA:13.5PEO:7.5Li:25EC 0.60 0.40 0.1111 25 0.3704
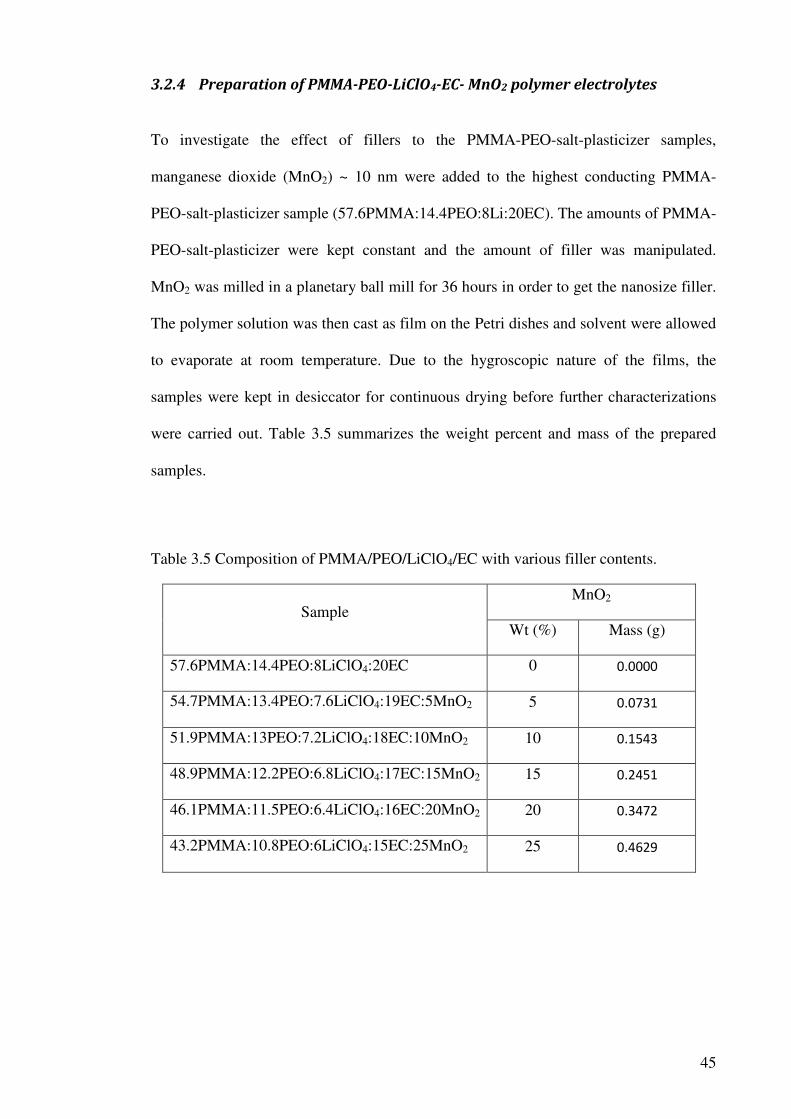
45
3.2.4 Preparation of PMMA-PEO-LiClO4-EC- MnO2 polymer electrolytes
To investigate the effect of fillers to the PMMA-PEO-salt-plasticizer samples,
manganese dioxide (MnO2) ~ 10 nm were added to the highest conducting PMMA-
PEO-salt-plasticizer sample (57.6PMMA:14.4PEO:8Li:20EC). The amounts of PMMA-
PEO-salt-plasticizer were kept constant and the amount of filler was manipulated.
MnO2 was milled in a planetary ball mill for 36 hours in order to get the nanosize filler.
The polymer solution was then cast as film on the Petri dishes and solvent were allowed
to evaporate at room temperature. Due to the hygroscopic nature of the films, the
samples were kept in desiccator for continuous drying before further characterizations
were carried out. Table 3.5 summarizes the weight percent and mass of the prepared
samples.
Table 3.5 Composition of PMMA/PEO/LiClO4/EC with various filler contents.
Sample MnO2
Wt (%) Mass (g)
57.6PMMA:14.4PEO:8LiClO4:20EC 0 0.0000
54.7PMMA:13.4PEO:7.6LiClO4:19EC:5MnO2 5 0.0731
51.9PMMA:13PEO:7.2LiClO4:18EC:10MnO2 10 0.1543
48.9PMMA:12.2PEO:6.8LiClO4:17EC:15MnO2 15 0.2451
46.1PMMA:11.5PEO:6.4LiClO4:16EC:20MnO2 20 0.3472
43.2PMMA:10.8PEO:6LiClO4:15EC:25MnO2 25 0.4629

46
3.3 Characterization Techniques
PMMA-PEO polymer blend based nano-composite polymer electrolytes were studied in
detailed using several analytical techniques which include electrical and structural,
mechanical as well as thermal properties. The studies were only performed on the films
with the highest room temperature of conductivity systems. Some experiments (FTIR
and XRD) were carried out to run on pure sample as a control set. The equipments used
in these studies are shown in Table 3.6 below:
Table 3.6: Equipments used in characterization of solid polymer electrolytes.
Equipment Model Function
Impedance Spectroscopy
(IS)
HIOKI 3531 Z Hi
Tester
To investigate the electrical properties of polymer/salt at various composition of plasticizer and filler.
Fourier Transform Infrared Spectroscopy
(FTIR)
FTIR ABB BOMEN MB104 IR
To study the characteristic band of polymer electrolytes
Transmission Electron Microscope
(TEM)
LIBRA® 120 To study the size distribution of the filler nano-particles
X-Ray Diffraction
(XRD)
Phillips X-pert MRD
To examine the crystallinity of SPEs.
Differential Scanning Calorimeter (DSC) To measure glass transition and crystallization temperature of the composite electrolyte film
Field Emission Scanning Electron Microscope (FESEM
To study the surface structure of electrolyte film

47
3.3.1 Electrical Studies
3.3.1.1 Impedance Spectroscopy (IS)
Impedance spectroscopy is a powerful tool for the characterization of many electrical
properties of material and their interface with electron conducting electrodes. Figure 3.2
show the picture of HIOKI HiTESTER machine. The impedance technique is extremely
resourceful for determining the contribution of electrode or electrolyte processes
because the detail contained in an impedance spectrum is quite significant. A single
impedance spectrum can provide information about diffusion, charge transfer and
adsorption / dissociation processes at the electrode / electrolyte interface as well as
about the grain conductivity (intragrain) and grain boundary (intergrain) blocking in
polycrystalline electrolytes (Cahn, 1994).
Figure 3.2 HIOKI HiTESTER machine

48
Impedance spectres copy (IS) has been widely used to characterize the nature of
lithium-ion electrode processes and interfacial properties, as well as for distinguishing
individual contributions to overall cell impedance and resistivity. Impedance data is
used to quantify changes that can be linked to electrode film formation and changes in
the interfacial properties of the electrode. Also, by comparing impedance spectra at
different states of discharge of an electrochemical cell, one can draw rough conclusions
about phenomena such as film growth, diffusion resistance, etc. Comparing impedance
data as a function of cell cycle life affords a measure of overall cell, as well as
individual cell component, stability with time.
According to the theoretical analysis given by Watanabe and Ogata (Watanabe
and Ogata, 1987), two semicircles should appear in the impedance spectrum for a
symmetric cell, i.e., one at high frequencies corresponding to the bulk electrolyte
impedance and the other at low frequencies related to the interfacial impedance. It has
also been reported (Song et al, 1998; Abraham et al, 1995; Appetecchi et al, 1999) that
the high-frequency semicircle does not appear in practical impedance plots for
plasticized polymer and filler-added polymer electrolyte membranes. This feature
indicates that the conductivity is mainly due to ions. (Watanabe and Ogata, 1987). The
high-frequency intercept corresponds to the bulk resistance (Rb) of the electrolyte and
provides a measure of its bulk ionic conductivity (Monroe et al, 2004).
In the present work, the sample is in the form of thin film. The thickness of the
sample films was controlled between the ranges of 1.9 to 2.1 mm. To measure the
impedance of the films, the samples were palletized into a round shape that fit the size
of the electrodes. The samples were then sandwiched between the two stainless steel

49
blocking electrodes with the contact area of 2.33 to 2.36 cm-2. A HIOKI 3531 LCR
bridge that has been interfaced with a computer was used to perform the impedance
measurement for each polymer electrolyte film in the frequency of 50 Hz to 1 MHz and
in the temperature range of room temperature (25oC) to elevated temperturae
(60oC).The software for controlling the measurement can also calculates the real and
imaginary impedance.
The conductivity-temperature studies were performed only on the films with the
highest room temperature of conductivity from the (PMMA / PEO), (PMMA / PEO /
LiClO4), (PMMA / PEO / LiClO4 / EC), (PMMA / PEO / LiClO4 / EC / MnO2) systems.
The conductivity-temperature studies were carried out by placing the sample holder
containing the sample in temperature controlled furnace in 25 to 100 oC temperature
range in steps of 10oC.
Hence the conductivity (σ) of the sample were then calculated using
= f
gh@ (3.5)
where, t is the sample thickness (cm), A is the effective contact area of the electrode and
the electrolyte (cm2) and Rb is the bulk resistance (Ω). The bulk resistance (Rb) value
was obtained from the plot of negative imaginary impedance versus real impedance.
Figure 3.3 shows the complex impedance spectra of polymer electrolytes. On the other
hand, the resistivity, ρ is the reciprocal value of conductivity:
i =
j (3.6)
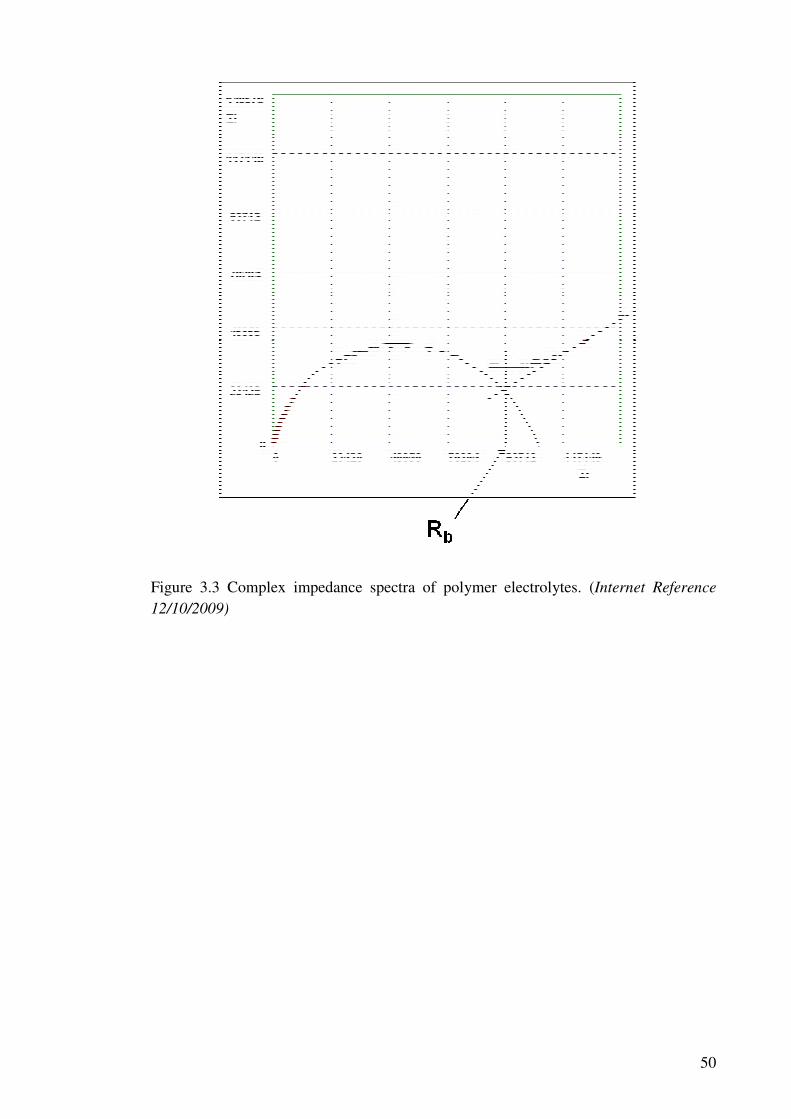
Figure 3.3 Complex i12/10/2009)
omplex impedance spectra of polymer electrolytes. (
50
polymer electrolytes. (Internet Reference

51
3.3.3 Structural Studies
3.3.3.1 X-Ray Diffraction (XRD)
X-ray diffraction is a powerful experimental tool which can be used to determine the
main feature of the structure, for example the lattice parameter and type of structure, as
well as other details such as the arrangement of different kinds of atoms in crystal.
Figure 3.4 shows X-ray diffraction machine. The technique is also widely used in
chemical identification and analysis due to the accurate intensity measurements which
allows a quantitive estimate of the various elements in the sample to be made
(Smallman, 1995 ; Shackleford, 2000).
Figure 3.4: X-ray diffraction machine

52
As the sample rotates in XRD machines, the angle between the incident beam
emitted and the normal to the film varies. The relationship of x-ray wavelength and
interatomic spacing to the diffracted beam is clearly stated in Bragg’s law (Shackleford,
2003):
2d sin Ө = n λ (3.7)
Here d is the interplanar spacing, Ө is the Bragg angle, n is the order of the reflection, λ
is the X-ray wavelength. The samples were scanned with a beam of monochromatic
CuKα- X radiation of wavelength λ = 1.5406 Å between a 2 Ө angle of 20° to 80°.
From the diffractograms, the crystallite size was calculated. The crystalline size can be
obtained from the Scherrer equation (Shackleford, 2003):
L=0.9 λ / β cos Ө (3.8)
where, L is the crystalline size and β is the full width half maximum (FWHM) of the
chosen peak. The chosen peaks must exist in the diffractogram of all samples prepared.
An example of a XRD diffractogram is shown in Figure 3.5 (Calister, 2003) and Figure
3.6.
Figure 3.5 Diffraction of X-ray by planes of atoms (Internet reference 08/04/2010)
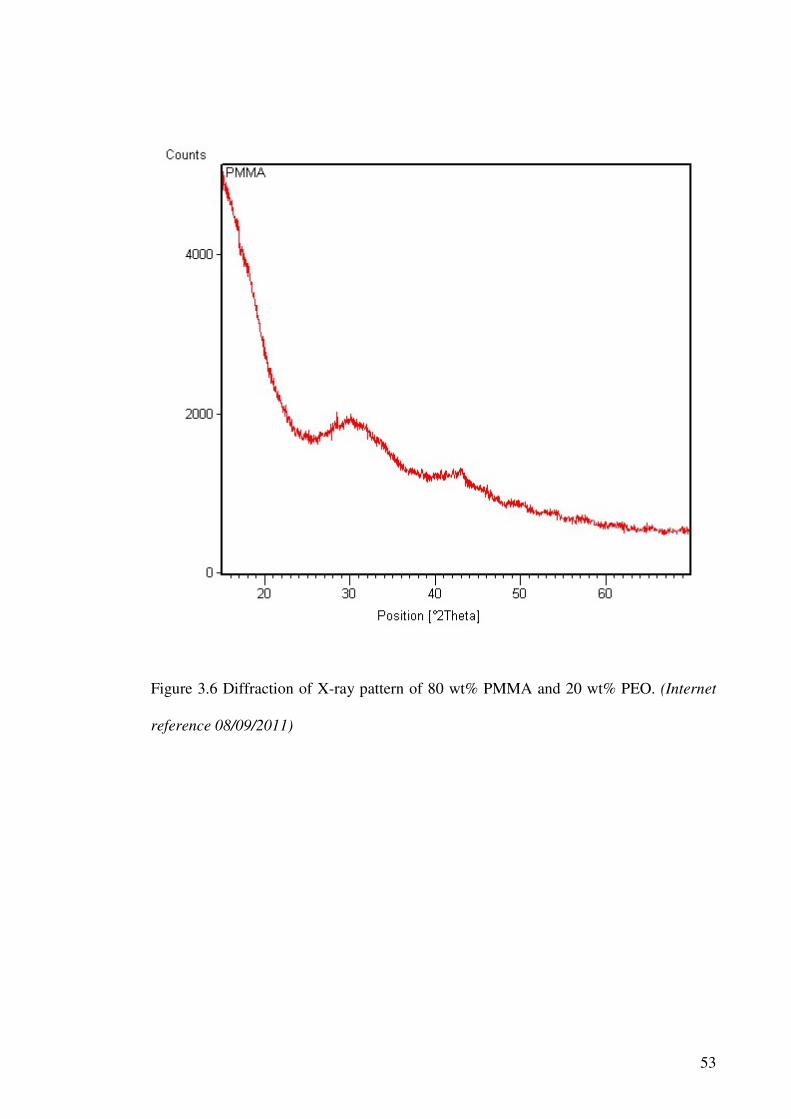
53
Figure 3.6 Diffraction of X-ray pattern of 80 wt% PMMA and 20 wt% PEO. (Internet
reference 08/09/2011)

54
3.3.3.2 Transmission Electron Microscope (TEM)
Transmission electron microscopy (TEM) is a microscopy technique whereby a beam of
electrons is transmitted through an ultra thin specimen, interacting with the specimen as
they pass through. An image is formed from the interaction of the electrons transmitted
through the specimen, which is magnified and focused onto an imaging device, on a
layer of photographic film, or to be detected by a sensor such as a CCD camera. TEM
owing to the small de Broglie wavelength of electron enables the instrument to be able
to examine fine detail of a sample. Alternate modes of use allow for the TEM to observe
modulations in chemical identity, crystal orientation, electronic structure and sample
induced electron phase shift as well as the regular absorption based imaging.
For TEM observations, thin samples are required due to the important
absorption of the electrons in the material. High acceleration voltage reduces the
absorption effects but can cause radiation damage (estimated at 170 kV for Al). At these
acceleration tensions, a maximum thickness of 60 nm is required for TEM observations
and quantifications. Therefore, prior to the analysis of TEM, the sample must be well
prepared in order to obtain a clear resolution image. This can be achieved by the
deposition of a dilute sample containing the specimen onto support grids or films.
In the present work, the composite filler, Manganese Oxide (MnO), after
being ball milled for 36 hours were dispersed in the ethanol and sonicated for 60
minutes to prevent them from agglomeration on the copper grid later. The high
dispersion of MnO nano-particles can be formed during the high-energy ball-milling
process. A single drop of suspension was placed onto a 200 Cu Mech holey support film
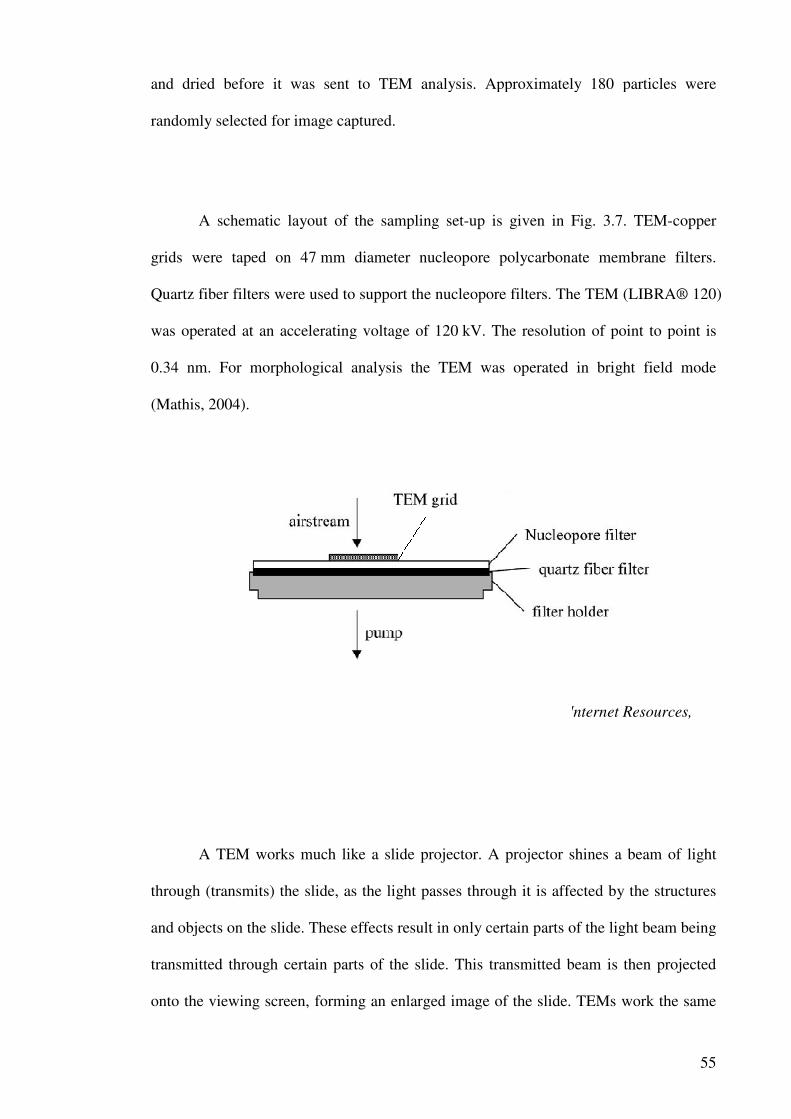
and dried before it was sent to TEM analysis. Approximately 180 particles were
randomly selected for image captured.
A schematic layout of the sampling set
grids were taped on 47
Quartz fiber filters were used to support the n
was operated at an accelerating voltage of 120
0.34 nm. For morphological analysis the
(Mathis, 2004).
A TEM works much like a slide projector. A projector shines a beam of light
through (transmits) the slide, as the light passes through it is affected by the structures
and objects on the slide. These effects result in only certain parts of the light beam being
transmitted through certain parts of the slide. This transmitted beam is then proje
onto the viewing screen, forming an enlarged image of the slide. TEMs work the same
Figure 3.7: Placement of TEM grids on the gravimetric filter holder (
19/03/2009)
and dried before it was sent to TEM analysis. Approximately 180 particles were
randomly selected for image captured.
A schematic layout of the sampling set-up is given in Fig. 3.7
s were taped on 47 mm diameter nucleopore polycarbonate mem
lters were used to support the nucleopore filters. The TEM (
t an accelerating voltage of 120 kV. The resolution of point to point is
For morphological analysis the TEM was operated in bright field mode
A TEM works much like a slide projector. A projector shines a beam of light
nsmits) the slide, as the light passes through it is affected by the structures
and objects on the slide. These effects result in only certain parts of the light beam being
transmitted through certain parts of the slide. This transmitted beam is then proje
onto the viewing screen, forming an enlarged image of the slide. TEMs work the same
Figure 3.7: Placement of TEM grids on the gravimetric filter holder (Internet Resources,
55
and dried before it was sent to TEM analysis. Approximately 180 particles were
Fig. 3.7. TEM-copper
ucleopore polycarbonate membrane filters.
ucleopore filters. The TEM (LIBRA® 120)
The resolution of point to point is
s operated in bright field mode
A TEM works much like a slide projector. A projector shines a beam of light
nsmits) the slide, as the light passes through it is affected by the structures
and objects on the slide. These effects result in only certain parts of the light beam being
transmitted through certain parts of the slide. This transmitted beam is then projected
onto the viewing screen, forming an enlarged image of the slide. TEMs work the same
Internet Resources,
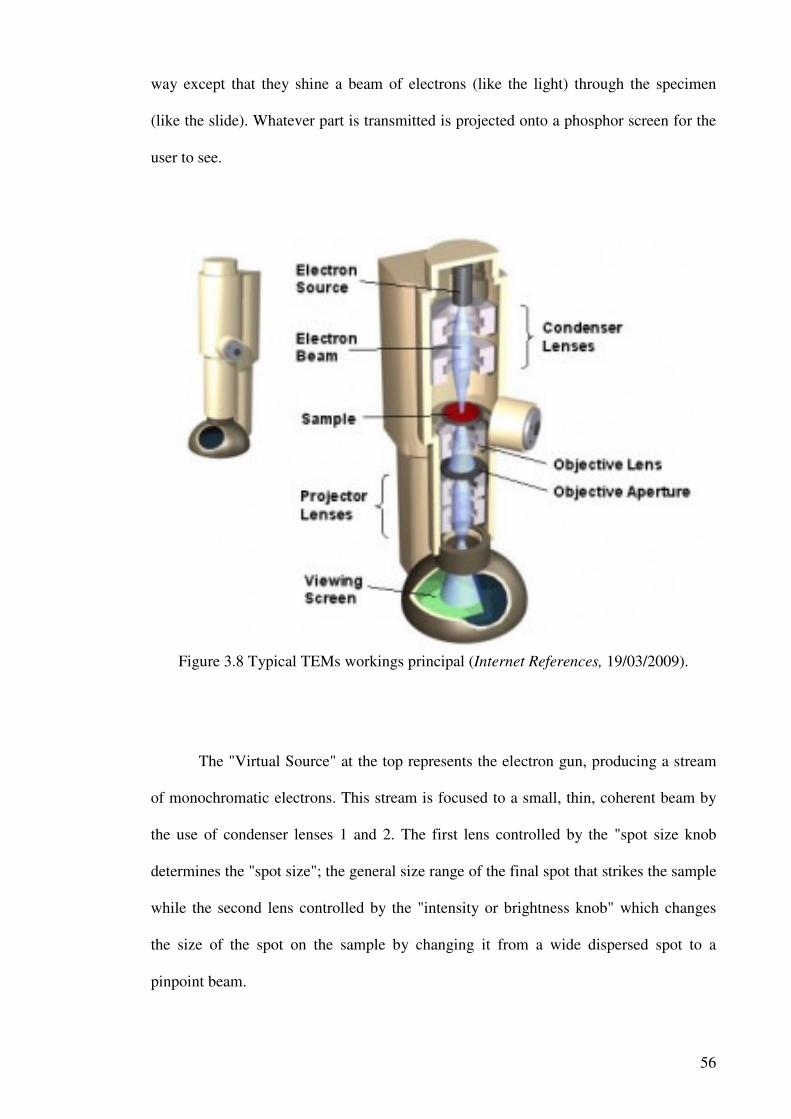
56
way except that they shine a beam of electrons (like the light) through the specimen
(like the slide). Whatever part is transmitted is projected onto a phosphor screen for the
user to see.
Figure 3.8 Typical TEMs workings principal (Internet References, 19/03/2009).
The "Virtual Source" at the top represents the electron gun, producing a stream
of monochromatic electrons. This stream is focused to a small, thin, coherent beam by
the use of condenser lenses 1 and 2. The first lens controlled by the "spot size knob
determines the "spot size"; the general size range of the final spot that strikes the sample
while the second lens controlled by the "intensity or brightness knob" which changes
the size of the spot on the sample by changing it from a wide dispersed spot to a
pinpoint beam.
57
The beam is restricted by the condenser aperture, knocking out high angle
electrons. The beam strikes the specimen and parts of it are transmitted This
transmitted portion is focused by the objective lens into an image. Optional Objective
and Selected Area metal apertures can restrict the beam. In addition to that, the
resolution of objective aperture can be contrasted by blocking out high-angle diffracted
electrons whereas the selected area aperture allow the user to examine the periodic
diffraction of electrons by ordered arrangements of atoms in the sample.
The image is passed down the column through the intermediate and projector
lenses, being enlarged all the way. The image strikes the phosphor image screen and
light is generated, allowing the user to see the image. The darker areas of the image
represent those areas of the sample that fewer electrons were transmitted through (they
are thicker or denser). The lighter areas of the image represent those areas of the sample
that more electrons were transmitted through (they are thinner or less dense). Figure 3.9
show the TEM machine.

58
Figure 3.9 TEM machine

59
3.3.3.3 Field Emission Scanning Electron Microscope (FESEM)
FESEM is the abbreviation of Field Emission Scanning Electron Microscope. A
FESEM is microscope that works with electrons (particles with a negative charge)
instead of light. These electrons are liberated by a field emission source. The object is
scanned by electrons according to a zig-zag pattern. FESEM is used to visualize very
small topographic details on the surface or entire or fractioned objects. Researchers in
biology, chemistry and physics apply this technique to observe structures that may be as
small as 1 nanometer (= billion of a millimeter). The FESEM may be employed for
example to study organelles and DNA material in cells, synthetical polymeres, and
coatings on microchips.
In FESEM, electrons are liberated from a field emission source and accelerated
in a high electrical field gradient. Within the high vacuum column these so-called
primary electrons are focussed and deflected by electronic lenses to produce a narrow
scan beam that bombards the object. As a result secondary electrons are emitted from
each spot on the object. The angle and velocity of these secondary electrons relates to
the surface structure of the object. A detector catches the secondary electrons and
produces an electronic signal. This signal is amplified and transformed to a video scan-
image that can be seen on a monitor or to a digital image that can be saved and
processed further.
In standard electron microscopes electrons are mostly generated by heating a
tungsten filament by means of a current to a temperature of about 2800°C. Sometimes
electrons are produced by a crystal of lantanumhexaboride (LaB6) that is mounted on a

60
tungsten filament. This modification results in a higher electron density in the beam and
a better resolution than with the conventional device. In a field emission (FE) scanning
electron microscope no heating but a so-called "cold" source is employed. An extremely
thin and sharp tungsten needle (tip diameter 10–7 –10-8 m) functions as a cathode in
front of a primary and secondary anode. The voltage between cathode and anode is in
the order of magnitude of 0.5 to 30 KV. Because the electron beam produced by the FE
source is about 1000 times smaller than in a standard microscope, the image quality is
markedly better. As field emission necessitates an extreme vacuum (10-8 Torr) in the
column of the microscope, a device is present that regularly decontaminates the electron
source by a current flash. In contrast to a conventional tungsten filament, a FE tip last
theoretically for a lifetime, provided the vacuum is maintained stable.
The electron beam is focused by the electro-magnetic lenses (condenser lens,
scan coils, stigmator coils and objective lens) and the apertures in the column to a tiny
sharp spot. The current in the condenser determines the diameter of the beam: a low
current results in a small diameter, a higher current in a larger beam. A narrow beam has
the advantage that the resolution is better, but the disadvantage that the signal to noise
ratio is worse. The situation is reversed when the beam has a large diameter. The
condenser lens consists mostly out of two parts. The scan coils deflect the electron beam
over the object according to a zig-zag pattern. The formation of the image on the
monitor occurs in synchrony with this scan movement. The scan velocity determines the
refreshing rate on the screen and the amount of noise in the image. The smaller the
scanned region on the object, the larger the magnification becomes at a constant
window size. Scan coils often consist of upper and lower coils, which prevent the
formation of a circular shadow at low magnification.

Figure 3.10 Schematic diagram of light microscope (LM), transmission electron
microscope (TEM) and f
(Internet Resources 08082011
The objective lens is the lowest lens in the column. The objective focuses the
electron beam on the object. At a short
apply a greater force to deflect the
produces the smallest beam diameter, the
field.. The stigmator coils are utilized to correct irregularities in the x and y
of the beam and thus to obtain
circular, but ellipsoidal, the image looks blurred and
Schematic diagram of light microscope (LM), transmission electron
microscope (TEM) and field emission scanning electron m
Internet Resources 08082011)
The objective lens is the lowest lens in the column. The objective focuses the
electron beam on the object. At a short working distance the objective lens needs to
apply a greater force to deflect the electron beam. The shortest working distance
produces the smallest beam diameter, the best resolution, but also the poorest depth of
The stigmator coils are utilized to correct irregularities in the x and y
of the beam and thus to obtain a perfectly round-shaped beam. When the beam is not
circular, but ellipsoidal, the image looks blurred and stretched.
61
Schematic diagram of light microscope (LM), transmission electron
microscope (FESEM).
The objective lens is the lowest lens in the column. The objective focuses the
working distance the objective lens needs to
beam. The shortest working distance
best resolution, but also the poorest depth of
The stigmator coils are utilized to correct irregularities in the x and y deflection
When the beam is not

62
After the object has been covered by a conductive layer, it is mounted on a
special holder. The object is inserted through an exchange chamber into the high
vacuum part of the microscope and anchored on a moveable stage. In the virtual
FESEM the object can be moved in horizontal and vertical direction on the screen by
operating the arrows in the particular box. In the real microscope the object can be
repositioned in the chamber by means of a joy stick that steers in left right axis, or
forward and backward. In addition, the object can be tilted (e.g. for stereo views),
rotated and moved in Z direction. Figure 3.11 shows field emission scanning electron
microscope connected to a computer.
Figure 3.11 Field Emission Scanning Electron Microscope (FESEM)

63
On the other hand, the “secondary electron emission” detector (scintillator) is
located at the rear of the object holder in the chamber. When the primary probe
bombards the object, secondary electrons are emitted from the object surface with a
certain velocity that is determined by the levels and angles at the surface of the object.
The secondary electrons, which are attracted by the Corona, strike the scintillator
(fluorescing mirror) that produces photons. The location and intensity of illumination of
the mirror vary depending on the properties of the secondary electrons. The signal
produced by the scintillator is amplified and transduced to a video signal that is fed to a
cathode ray tube in synchrony with the scan movement of the electron beam. The
contrast in the ‘real time’ image that appears on the screen reflects the structure on the
surface of the object. Parallel to the analog image, a digital image is generated which
can be further processed.
64
3.3.3.4 Fourier Transform Infrared Spectroscopy (FTIR)
Fourier transform infrared spectroscopy (FTIR) is a technique which is used to obtain
an infrared spectrum of absorption, emission, photoconductivity or Raman scattering of
a solid, liquid or gas. An FTIR spectrometer simultaneously collects spectral data in a
wide spectral range. This confers a significant advantage over a dispersive spectrometer
which measures intensity over a narrow range of wavelengths at a time.
The term Fourier transform infrared spectroscopy originates from the fact that a
Fourier transform (a mathematical algorithm) is required to convert the raw data into the
actual spectrum. The goal of any absorption spectroscopy (FTIR, ultraviolet-visible
("UV-Vis") spectroscopy, etc.) is to measure how well a sample absorbs light at each
wavelength. The most straightforward way to do this, the "dispersive spectroscopy"
technique, is to shine a monochromatic light beam at a sample, measure how much of
the light is absorbed, and repeat for each different wavelength. (This is how UV-Vis
spectrometers work, for example.)
Fourier transform spectroscopy is a less intuitive way to obtain the same
information. Rather than shining a monochromatic beam of light at the sample, this
technique shines a beam containing many different frequencies of light at once, and
measures how much of that beam is absorbed by the sample. Next, the beam is modified
to contain a different combination of frequencies, giving a second data point. This
process is repeated many times. Afterwards, a computer takes all these data and works
backwards to infer what the absorption is at each wavelength.
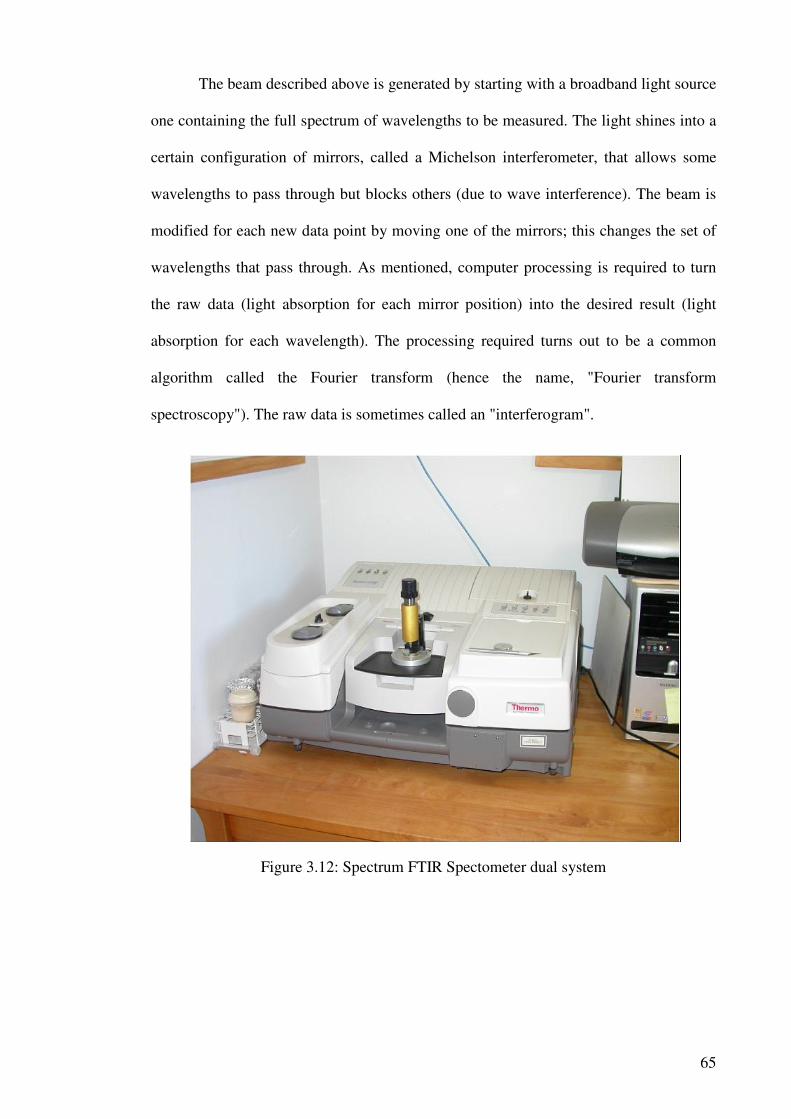
65
The beam described above is generated by starting with a broadband light source
one containing the full spectrum of wavelengths to be measured. The light shines into a
certain configuration of mirrors, called a Michelson interferometer, that allows some
wavelengths to pass through but blocks others (due to wave interference). The beam is
modified for each new data point by moving one of the mirrors; this changes the set of
wavelengths that pass through. As mentioned, computer processing is required to turn
the raw data (light absorption for each mirror position) into the desired result (light
absorption for each wavelength). The processing required turns out to be a common
algorithm called the Fourier transform (hence the name, "Fourier transform
spectroscopy"). The raw data is sometimes called an "interferogram".
Figure 3.12: Spectrum FTIR Spectometer dual system

66
In this work, the FTIR spectra of the samples were recorded using Perkin
Elmer FL Winlab FTIR spectrometer, equipped with an air-cooled rare earth oxide
filament source, CSI beam splitter and DTGS detector, as shown in Figure 3.12. The
instrument was set for ten scans at 4 cm-1 resolution with cosine apodisation in the mid-
IR region: 4,000 - 400 cm-1. No purging was carried out. The samples were placed into
the sample holder made and contacted with a diamond stub.

67
3.3.4 Thermal Studies
3.3.4.1 Differential scanning calorimetry (DSC)
Differential scanning calorimetry or DSC is a thermoanalytical technique in which the
difference in the amount of heat required to increase the temperature of a sample and
reference is measured as a function of temperature. Both the sample and reference are
maintained at nearly the same temperature throughout the experiment. Generally, the
temperature program for a DSC analysis is designed such that the sample holder
temperature increases linearly as a function of time. The reference sample should have a
well-defined heat capacity over the range of temperatures to be scanned. In this thesis,
differential scanning calorimeter was used to measure the glass transition and
crystallization temperature of the composite electrolyte films within the temperature
range of -100 to 200oC at a scanning rate of 5oC per min. Figure 3.13 show the machine
of DSC.
Figure 3.13: Differential scanning calorimetry (DSC)

68
The basic principle underlying this technique is that when the sample undergoes a
physical transformation such as phase transitions, more or less heat will need to flow to
it than the reference to maintain both at the same temperature. Whether less or more
heat must flow to the sample depends on whether the process is exothermic or
endothermic. For example, as a solid sample melts to a liquid it will require more heat
flowing to the sample to increase its temperature at the same rate as the reference. This
is due to the absorption of heat by the sample as it undergoes the endothermic phase
transition from solid to liquid. Likewise, as the sample undergoes exothermic processes
(such as crystallization) less heat is required to raise the sample temperature. By
observing the difference in heat flow between the sample and reference, differential
scanning calorimeters are able to measure the amount of heat absorbed or released
during such transitions. DSC may also be used to observe more subtle phase changes,
such as glass transitions. It is widely used in industrial settings as a quality control
instrument due to its applicability in evaluating sample purity and for studying polymer
curing.
DSC is used widely for examining polymers to check their composition.
Melting points and glass transition temperatures for most polymers are available from
standard compilations, and the method can show possible polymer degradation by the
lowering of the expected melting point, Tm, for example. Tm depends on the molecular
weight of the polymer, so lower grades will have lower melting points than expected.
The percentage crystallinity of a polymer can be found from the crystallization peak of
the DSC graph since the heat of fusion can be calculated from the area under an
absorption peak. DSC can also be used to study thermal degradation of polymers.

69
Impurities in polymers can be determined by examining thermograms for anomalous
peaks, and plasticisers can be detected at their characteristic boiling points.
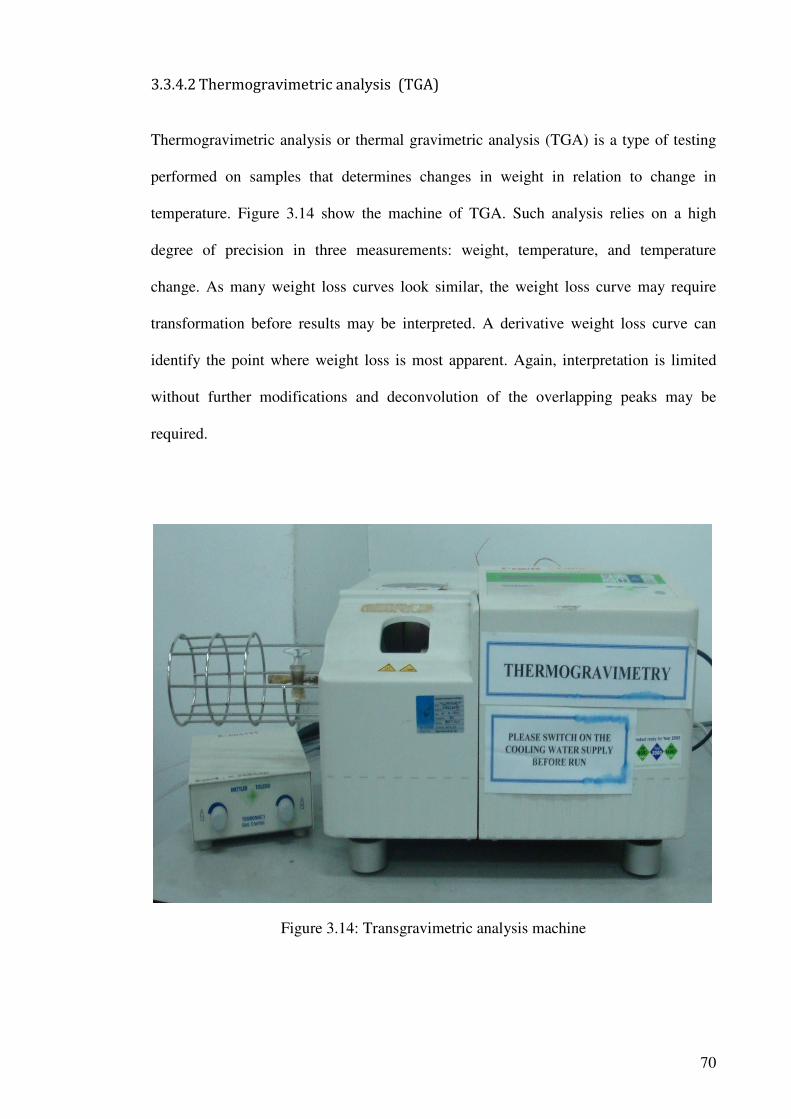
70
3.3.4.2 Thermogravimetric analysis (TGA)
Thermogravimetric analysis or thermal gravimetric analysis (TGA) is a type of testing
performed on samples that determines changes in weight in relation to change in
temperature. Figure 3.14 show the machine of TGA. Such analysis relies on a high
degree of precision in three measurements: weight, temperature, and temperature
change. As many weight loss curves look similar, the weight loss curve may require
transformation before results may be interpreted. A derivative weight loss curve can
identify the point where weight loss is most apparent. Again, interpretation is limited
without further modifications and deconvolution of the overlapping peaks may be
required.
Figure 3.14: Transgravimetric analysis machine

71
TGA is commonly employed in research and testing to determine
characteristics of materials such as polymers, to determine degradation temperatures,
absorbed moisture content of materials, the level of inorganic and organic components
in materials, decomposition points of explosives, and solvent residues. Simultaneous
TGA-DTA/DSC measures both heat flow and weight changes (TGA) in a material as a
function of temperature or time in a controlled atmosphere. Simultaneous measurement
of these two material properties not only improves productivity but also simplifies
interpretation of the results. The complementary information obtained allows
differentiation between endothermic and exothermic events with no associated weight
loss (e.g. melting and crystallization) and those that involve a weight loss (e.g.
degradation).
The sample is placed in a small electrically heated oven with a thermocouple to
accurately measure the temperature. The atmosphere may be purged with an inert gas to
prevent oxidation or other undesired reactions. A computer is used to control the
instrument.Analysis is carried out by raising the temperature of the sample gradually
and plotting weight (percentage) against temperature. The temperature in many testing
methods routinely reaches 1000°C or greater. After the data are obtained, curve
smoothing and other operations may be done to find the exact points of inflection.

72
3.3.5 Optical Studies
3.3.5.1 Ultra-Violet Visible (UV-Vis) Spectroscopy
Ultraviolet-visible spectroscopy (UV-Vis) refers to absorption spectroscopy or
reflectance spectroscopy in the ultraviolet-visible spectral region. This means it uses
light in the visible and adjacent (near-UV and near-infrared (NIR)) ranges. The
absorption or reflectance in the visible range directly affects the perceived colour of the
chemicals involved. In this region of the electromagnetic spectrum, molecules undergo
electronic transitions. UV/Vis spectroscopy is routinely used in analytical chemistry for
the quantitative determination of different analytes, such as transition metal ions, highly
conjugated organic compounds, and biological macromolecules.
The functioning of this instrument is relatively straightforward. A beam of light
from a visible and/or UV light source (colored red) is separated into its component
wavelengths by a prism or diffraction grating. Each monochromatic (single wavelength)
beam in turn is split into two equal intensity beams by a half-mirrored device. One
beam, the sample beam (colored magenta), passes through a small transparent container
(cuvette) containing a solution of the compound being studied in a transparent solvent.
The other beam, the reference (colored blue), passes through an identical cuvette
containing only the solvent. The intensities of these light beams are then measured by
electronic detectors and compared. Over a short period of time, the spectrometer
automatically scans all the component wavelengths in the manner described. The
ultraviolet (UV) region scanned is normally from 200 to 400 nm, and the visible portion
is from 400 to 800 nm.

73
The visible region of the spectrum comprises photon energies of 36 to 72
kcal/mole, and the near ultraviolet region, out to 200 nm, extends this energy range to
143 kcal/mole. Absorption spectroscopy carried out in this region is sometimes called
"electronic spectroscopy". Various kinds of electronic excitation that may occur in
organic molecules are shown in Figure 3.15. As a rule, energetically favoured electron
promotion will be from the highest occupied molecular orbital (HOMO) to the lowest
unoccupied molecular orbital (LUMO), and the resulting species is called an excited
state. When sample molecules are exposed to light having an energy that matches a
possible electronic transition within the molecule, some of the light energy will be
absorbed as the electron is promoted to a higher energy orbital. An optical spectrometer
records the wavelengths at which absorption occurs, together with the degree of
absorption at each wavelength. The resulting spectrum is presented as a graph of
absorbance (A) versus wavelength.
Figure 3.15 Electronic excitation of organic molecules

74
Because the absorbance of a sample will be proportional to the number of
absorbing molecules in the spectrometer light beam (e.g. their molar concentration in
the sample tube), it is necessary to correct the absorbance value for this and other
operational factors. The corrected absorption value is called "molar absorptivity", and is
particularly useful when comparing the spectra of different compounds and determining
the relative strength of light absorbing functions (chromophores). Molar absorptivity (ε)
is defined as in equation (3.9):
ε = @
kl (3.9)
where A is the absorbance, c is the sample concentration in moles/liter and l is length of
light path through the sample in cm.
Table 3.7 List of some simple chromophores and their light absorption characteristics
Table 3.7 shows the list of some simple chromophores and their light absorption
characteristics. The oxygen non-bonding electrons in alcohols and ethers do not give
rise to absorption above 160 nm. Molar absorptivities may be very large for strongly
absorbing chromophores (>10,000) and very small if absorption is weak (10 to 100).
Chromophore Example Excitation λmax, nm ε Solvent C=C Ethene π π* 171 15,000 hexane C≡C 1-Hexyne π π* 180 10,000 hexane
C=O Ethanal n π* π π*
290 180
15 10,000
hexane hexane
N=O Nitromethane n π* π π*
275 200
17 5,000
ethanol ethanol
C-X X=Br X=I
Methyl bromide Methyl Iodide
n σ* n σ*
205 255
200 360
hexane hexane

75
The magnitude of ε reflects both the size of the chromophore and the probability that
light of a given wavelength will be absorbed when it strikes the chromophore.
The absorption of light radiation in a sample obeys the Beer-Lambert
relationship, which states that the concentration of a substance in a sample is directly
proportional to the absorbance, A. The incident radiation refers to Io and the intensity of
transmitted radiation refers to I,
bcA ε= (3.10)
where ɛ is the molar absorptivity constant, b is the path length and c is the molar
concentration of the absorbance. When monochromatic radiation passes through a
homogeneous sample, the intensity of the emitted radiation depends upon the thickness,
L and concentration, c. The ratio Io/I, known as transmittance, is expressed as a
percentage and is therefore referred to as % transmittance. The absorbance is related to
percent transmittance, T by the expression:
bcTI
IA o
ε=
=
=
100loglog (3.11)
Figure 3.16 shows Cary 50 UV-Visible spectrophotometer used for optical
characterization of polymer electrolytes. The wavenumber range for this equipment is
180-900 nm, and the wavenumbers considered in this research are within the range of
300 – 600 nm at a scan speed of 60 nm/min. Prior to using ‘UV-Cary50’ software,
baseline correction of the spectrophotometer was carried out using tetrahydrofuran
(THF) for polymer electrolyte solution. 1 mL of polymer electrolyte was diluted in 10

76
mL of THF and rinsed in ultrasonic bath with re-distilled deionized water for 10 min.
The absorption spectra were recorded at a rate of 60 nm min-1, with a spectral resolution
of 2 nm at room temperature in a 1 cm optical path quartz cuvette.
Figure 3.16 Cary 50 UV-Visible spectrophotometer

77
CHAPTER FOUR
RESULTS AND DISCUSSION
This chapter presents results of various studies of the properties of nanocomposite solid
polymer electrolytes. The particles size and particle size distribution of manganese
dioxide (MnO2) filler were examined by transmission electron microscope (TEM) and
the optimum composition of PMMA-PEO-LiClO4-EC-MnO2 nanocomposite were
obtained through the electrical, structural, thermal and optical studies.
4.1 Structural Studies
4.1.1 Transmission electron microscope (TEM) analysis of MnO2 nano-filler
Figure 4.1 represents the TEM image of the MnO2 nanoparticles. The figure exhibits
non-sperical shape of particles with average size of the particles is within the range of
30 nm. The particle size distribution of MnO2 nano-particles is shown in Figure 4.2 with
a normal type. The distribution was found to be dependent on sampling technique,
sample size and preparation method (Vella et al. 2006).
A number of physical phenomena become pronounced as the size of the material
in a system approaching nano scale. These include statistical mechanical effects, as well
as quantum mechanical effects. The increase in surface area of nanosize filler to volume
ratio alters mechanical, thermal and catalytic properties of electrolyes (Internet
reference 16/5/2012). Additionally, filler in nano-scale provides high specific surface
area that is available for interaction with the polymer. This interaction competes with
the local lithium-polymer coordination sites which in turn frees up the polymer

segmental motion. However, with increasing filler content, some agglomeration begins
to occur which reduces the active surface area availab
(Forsyth et al, 2002)
Fig
Figure 4.2: Histogram of particle size distribution of MnO
Freq
uenc
y %
However, with increasing filler content, some agglomeration begins
to occur which reduces the active surface area available to interact with the polymer
Figure 4.1: TEM image of MnO2 nanoparticles
0 5 10 15 20 25 30 35 40 45 50 55 60 65
Figure 4.2: Histogram of particle size distribution of MnO 78
However, with increasing filler content, some agglomeration begins
le to interact with the polymer
cles
Figure 4.2: Histogram of particle size distribution of MnO2 nanoparticles
Particle size (nm)

79
4.1.2 X-ray diffraction (XRD) studies
Figure 4.3 (a) – (b) show the XRD pattern for pure PMMA and PEO. It can
observed that two obvious crystalline peaks occurred at the angle of 2Ѳ = 13.33, 30.51
in pure PMMA and one single apparent crystalline peaks happened at angle of 2Ѳ =
13.77 in pure PEO. Figures 4.4(a) – (f) show the XRD patterns of PMMA:PEO blend at
90:10, 80:20, 70:30, 60:40, 50:50 and 40:60 weight percent.
Figure 4.3 (a) shows the XRD pattern for pure PMMA.
0
20
40
60
80
100
120
140
160
0 10 20 30 40 50 60 70 80 90
Co
un
t
2Ѳ (2 Theta)
Pure PMMA

80
Figure 4.3 (b) shows the XRD pattern for pure PEO.
Figure 4.4 (a) XRD pattern for 90:10 wt% of PMMA/PEO blend
0
1000
2000
3000
4000
5000
6000
7000
8000
9000
0 10 20 30 40 50 60 70
Co
un
ts
2Ѳ (2 Theta)
0
50
100
150
200
250
300
0 10 20 30 40 50 60 70 80 90
Co
un
t
2Ѳ (2 Theta)
Pure PEO
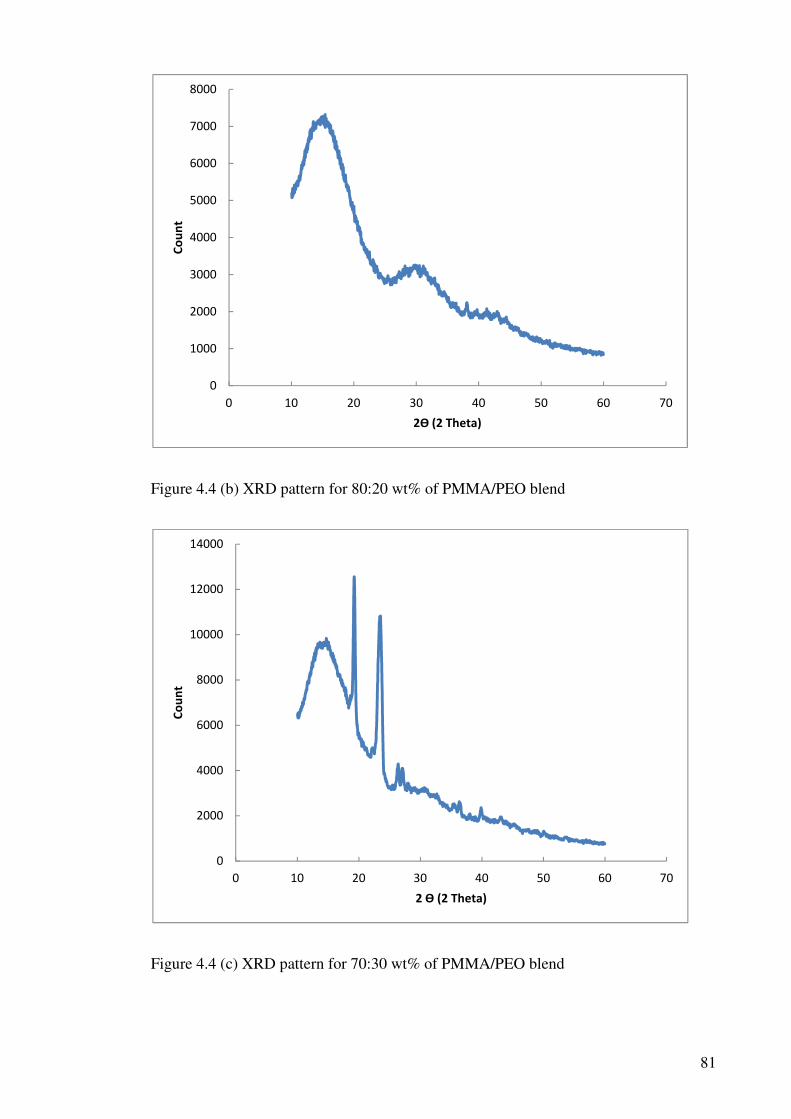
81
Figure 4.4 (b) XRD pattern for 80:20 wt% of PMMA/PEO blend
Figure 4.4 (c) XRD pattern for 70:30 wt% of PMMA/PEO blend
0
1000
2000
3000
4000
5000
6000
7000
8000
0 10 20 30 40 50 60 70
Co
un
t
2Ѳ (2 Theta)
0
2000
4000
6000
8000
10000
12000
14000
0 10 20 30 40 50 60 70
Co
un
t
2 Ѳ (2 Theta)

82
Figure 4.4 (d) XRD pattern for 60:40 wt% of PMMA/PEO blend
Figure 4.4 (e) XRD pattern for 50:50 wt% of PMMA/PEO blend
0
2000
4000
6000
8000
10000
12000
14000
16000
0 10 20 30 40 50 60 70
Co
un
t
2Ѳ (2 Theta)
0
2000
4000
6000
8000
10000
12000
14000
16000
0 10 20 30 40 50 60 70
Co
un
t
2Ѳ (2 Theta)

83
Figure 4.4 (f) XRD pattern for 40:50 wt% of PMMA/PEO blend
The XRD pattern of the pure PMMA shows a semi crystalline nature and two
amorphous humps were observed in XRD pattern of pure PEO. Table 4.1 show the
crystallite size of pure PEO, pure PMMA and various composition of PMMA/PEO
polymer blend system. From table 4.1 we can conclude that the amorphousity of
80PMMA:20PEO is the highest as the system has a smallest crystalline size compare to
pure PMMA and pure PEO. There is a wide broadening of crystalline peak observed in
Figure 4.4 (b) due to the strain inclusion in the polymer blend electrolyte system that
explained the decreasing crystallite size. This indicates the homogeneity of the polymer
blend. Apparently, the most suitable composition of polymer matrix as a host was 80:20
weight percent of PMMA/PEO.
0
5000
10000
15000
20000
25000
30000
0 10 20 30 40 50 60 70
Co
un
t
2Ѳ (2 Theta)

84
Table 4.1 Crystallite size of pure PEO and pure PMMA in comparison with the various
composition of PMMA/PEO polymer blend system.
Sample 2Ѳ ± 0.01 (degree) d (nm)
pure PMMA 13.33 0.83
30.51 0.79
pure PEO 13.77 0.68
90PMMA:10PEO
14.11 5.25
19.15 1.65
23.22 0.70
80PMMA:20PEO 14.64 0.71
29.64 0.75
70PMMA:30PEO
15.19 0.96
19.26 9.67
23.52 6.09
27.04 4.09
60PMMA:40PEO
14.44 0.96
19.26 6.91
23.52 6.09
27.04 3.50
50PMMA:50PEO
14.44 0.89
19.44 6.04
23.70 4.87
26.85 3.50
40PMMA:60PEO
15.00 0.96
19.44 6.04
23.33 6.08
26.85 3.50

85
Figure 4.5 shows the XRD patterns of the polymer electrolytes with various
weight percent of MnO2 filler. Generally, it can be observed that three crystalline peaks
occured at angle of 2θ = 28.6°, 37.4°, 42.6° and 56.2°. The present of these crystalline
peaks were due to the presence of polymer side chains. However, the intensities of the
crystalline peaks are varies with weight percent of MnO2 in the polymer electrolyte
Table 4.2 show the crystallite size for various composition of filler MnO2 in plasticized
polymer electrolytes.
Table 4.2 Crystallite sizes for various composition of filler MnO2 in plasticized polymer
electrolyte.
Sample d (nm)
2Ѳ ± 0.01 (degree) 28.6° 37.4° 42.6° 56.2 O
54.7PMMA:13.4PEO:7.6LiClO4:19EC:5MnO2; 0.03 - - -
51.9PMMA:13PEO:7.2LiClO4:18EC:10MnO2 0.07 - 0.04 -
48.9PMMA:12.2PEO:6.8LiClO4:17EC:15MnO2 0.10 0.03 0.02 0.04
46.1PMMA:11.5PEO:6.4LiClO4:16EC:20MnO2 0.25 0.07 0.02 0.07
43.2PMMA:10.8PEO:6LiClO4:15EC:25MnO2 0.11 0.05 0.03 0.05
From Table 4.2, it is observed that the composition of
54.7PMMA:13.4PEO:7.6LiClO4:19EC:5MnO2 (Figure 4.5 (a)) gives the most
amorphous state where the crystallite size overall were small compare to other
composite electrolyte systems. In other words, this composition is said to be most
homogenous composite polymer electrolyte. This implies that the optimum composition
of fillers (5 wt% MnO2) has prevented the salts from totally recystallizing out of the
polymer electrolytes system and helps to dissociate the salt leading to an increase in the
number density of mobile ions and conductivity. At the same time, the presence of
optimum composition filler in polymer electrolyte increase the stability and mechanical
strength of the polymer electrolyte which allow the fabrication of a free standing

86
electrolyte system. In Figures 4.5 (b) – (e), it can be observed that several crystalline
peaks start to appear at angle of 2ϴ = 37.4°, 42.6° and 56.2o. This can be explained that
the amount of filler above 5 wt% start to agglomerate with other ions components and
form clustered ions in the polymer electrolyte system. Furthermore, the polymer
electrolyte systems in Figures 4.5 (b) - (e) appeared to be brittle and fragile which is not
stable as polymer electrolyte systems. Figure 4.6 (a) - (d) shows the XRD pattern for
polymer blend, polymer electrolytes, plasticized polymer electrolytes and composite
polyemer electrolytes. From Figure 4.6, we can observe that the presence of filler in
polymer electrolytes further suppress the crystallinity where almost no cryatlline peak
were observed in composite polymer electrolytes.

87
Figure 4.5 XRD patterns for polymer electrolytes with various weight percent of MnO2 nanofiller :
a) 54.7PMMA:13.4PEO:7.6LiClO4:19EC:5MnO2; b) 51.9PMMA:13PEO:7.2LiClO4:18EC:10MnO2 ;
c) 48.9PMMA:12.2PEO:6.8LiClO4:17EC:15MnO2; d) 46.1PMMA:11.5PEO:6.4LiClO4:16EC:20MnO2;
e) 43.2PMMA:10.8PEO:6LiClO4:15EC:25MnO2
0
200
400
600
800
1000
1200
1400
10 20 30 40 50 60 70 80 90
Co
un
t
2Ѳ (2 Theta)
(a)
(b)
(c)
(d)
(e)

88
0
2000
4000
6000
8000
0 10 20 30 40 50 60 70
Polymer electrolyte
0
2000
4000
6000
8000
0 10 20 30 40 50 60 70
Polymer blend
0
200
400
600
800
0 10 20 30 40 50 60 70 80 90
Composite polymer electrolyte
Figure 4.6 XRD pattern for (a)80PMMA:20PEO (b) 72PMMA:18PEO:10LiClO4
(c) 57.6PMMA:14.4PEO:8LiClO4:20EC
(d)54.7PMMA:13.4PEO:7.6LiClO4:19EC:5MnO2
0
1000
2000
3000
4000
5000
6000
0 10 20 30 40 50 60 70
Plasticized polymer electrolyte
(a)
(b)
(c)
(d)

89
0500100015002000250030003500
Tra
nsm
itta
nce
Wavenumbers/cm-1
Pure PEO
4.1.3 Fourier transform infrared (FTIR) studies
Figure 4.7(a) - (f) show the FTIR spectra for pure PEO, pure PMMA, polymer blend,
polymer electrolyte, plasticized polymer electrolyte and composite polymer
electrolytes in the region of 3500 – 500 cm-1.
. Figure 4.7 FTIR spectra for (a) pure PEO ; (b) pure PMMA
0500100015002000250030003500
Tra
smit
tan
ce
Wavenumbers/ cm-1
Pure PMMA
(a)
(b)
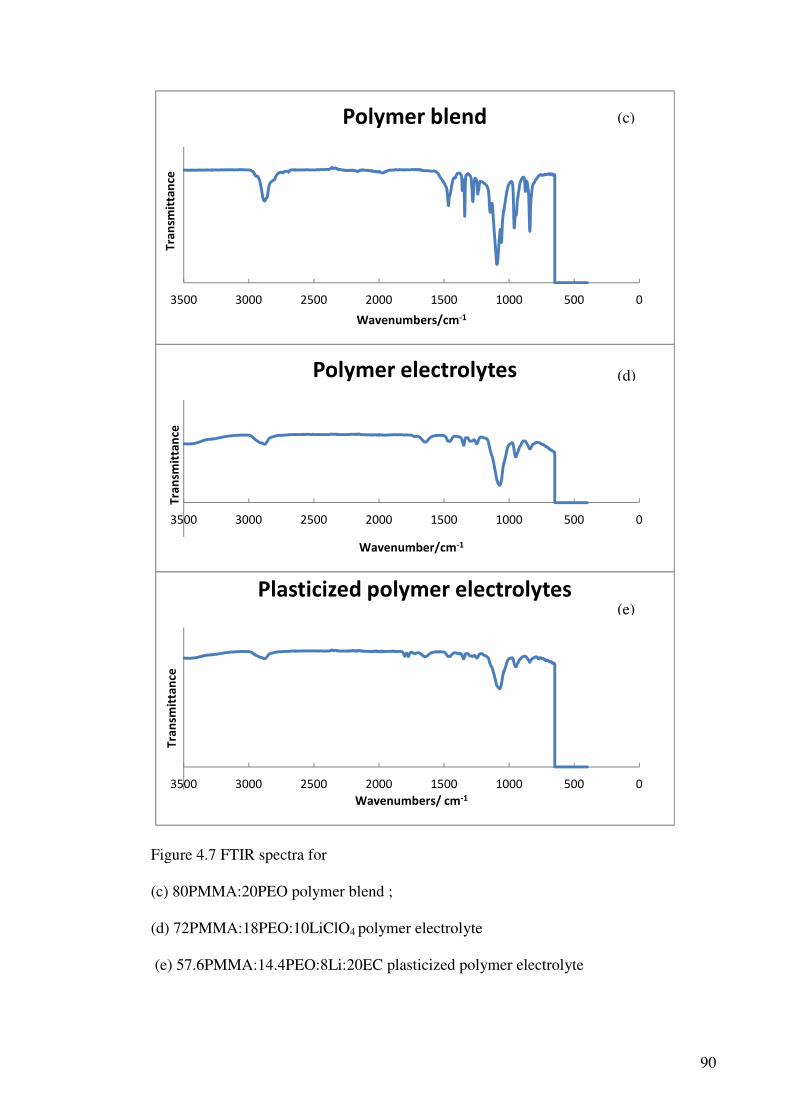
90
Figure 4.7 FTIR spectra for
(c) 80PMMA:20PEO polymer blend ;
(d) 72PMMA:18PEO:10LiClO4 polymer electrolyte
(e) 57.6PMMA:14.4PEO:8Li:20EC plasticized polymer electrolyte
0500100015002000250030003500
Tra
nsm
itta
nce
Wavenumbers/cm-1
Polymer blend
0500100015002000250030003500
Tra
nsm
itta
nce
Wavenumbers/ cm-1
Plasticized polymer electrolytes
0500100015002000250030003500
Tra
nsm
itta
nce
Wavenumber/cm-1
Polymer electrolytes
(c)
(d)
(e)

91
Figure 4.7 (f) FTIR spectra for 54.7PMMA:13.4PEO:7.6LiClO4:19EC:5MnO2
composite polymer electrolye.
FTIR spectroscopy has been used to identify the functional groups and the
interaction between components in a system. Figures 4.7 (a) – (c) show the FTIR
spectra for pure PEO, pure PMMA and polymer blend system respectively. For pure
PMMA the frequency at 842 cm-1 is assigned to C-H rocking vibrations. The
frequencies at 2950 cm-1 and 1242 cm-1 are assigned to CH2 stretching and O-CH2
deformation vibrations of pure PMMA. The peaks at 950 cm-1 and 1240 cm-1 may be
assigned to CH2 wagging and CH2 rocking vibrations respectively in pure PEO. The
absorption peaks at 1454 cm-1, 1889 cm-1 and 2889 cm-1 are assigned to asymmetric C-
H stretching in pure PEO. The peak at 1736 cm-1 corresponding to the stretching
frequency of C=O of pure PMMA is shifted to about 1432 cm-1 in the PMMA-PEO
polymer blend. The frequency 1151 cm-1 due to the C-C vibration is shifted to 948 cm-1
in the polymer blend. The C-C stretching frequency 1354 cm-1 of pure PEO is shifted to
about 1145 cm-1 in the polymer blend. The shifted broad peaks found in the polymer
(f)
0500100015002000250030003500
tra
nsi
mit
tan
ce
wavenumbers/cm-1
Composite polymer electrolyte(f)
92
electrolyte originated from the complex formation between all the components in the
polymer electrolyte system. The formation of new peaks along with changes in the
existing peaks in the FTIR spectra confirms the complexation. These results suggest that
homogeneous polymer complex are formed over all the blend compositions.
On the other hand, Figure 4.7 (d) - (f) show the FTIR spectra for salt added
polymer electrolyte, plasticized polymer electrolytes and composite polymer
electrolytes. It can also be observed that the intensity of absorption band at most of the
peaks are reduced when salt, plasticizer and filler are added. This shows that the
complexation has occurred between polymer blend, lithium perclorate salt, EC
plasticizer and MnO2 fillers. In spite of that, in Figure 4.7 (e) the peak at 928 cm-1 that
assigned to C=O bending band, and slightly shifted to 716 cm-1 due to the interaction of
polymers with the CH2 bending band at 1480 cm-1 of pure EC. The band at 1860 cm-1 is
due to C=O stretching of pure EC. The ring breathing of EC at 1803 cm-1 disappears in
the polymer electrolyte system, indicating the occurrence of interactions between the
polymers and plasticizer, EC. There is hardly any noticeable shift in peaks of the
plasticized polymer electrolytes and composite polymer electrolytes as presented in
Figures 4.7 (d) and (e). Hence, it can conclude that filler addition does not interact much
with the components in plasticized polymer electrolyte, yet only stabilize the
modification of bond in plasticized polymer electrolytes and provide inner dirving force
in addition to the external driving force of the applied electric field (Rajendra et al.
2000).

93
50010001500200025003000350040004500
Tra
nsm
itta
nce
Wavenumbers/ cm-1
Figure 4.8 FTIR spectra for the optimum concentration of polymer electrolytes with various weight percent of MnO2 nanofiller:
(a) 54.7PMMA:13.4PEO:7.6LiClO4:19EC:5MnO2
(b) 51.9PMMA:13PEO:7.2LiClO4:18EC:10MnO2
(c) 48.9PMMA:12.2PEO:6.8LiClO4:17EC:15MnO2
(d) 46.1PMMA:11.5PEO:6.4LiClO4:16EC:20MnO2
(e) 43.2PMMA:10.8PEO:6LiClO4:15EC:25MnO2
(a)
(b)
(c)
(d)
(e)

94
Figure 4.8 show the FTIR spectra for PMMA-PEO-LiClO4-EC-MnO2 polymer
electrolytes in region 4500 – 5000 cm-1. It can be observed the present of new peaks at
2916 and 2848 cm-1 for the sample containing 25wt% of MnO2.. The interactions
between the polymer electrolytes and MnO2 filler may result in “charge transfer”,
whereby the sp2 carbons in the polymer blend matrix compete with dopant ions and
perturb the H-bond, resulting in an increase in the stretching intensity (Rajendra et al.,
2000). In the region of 2000 to 3000 cm-1, the intensities of the peaks decrease with
decreasing filler contents. The ionic conduction is higher due to the contribution of filler
which provides an inner driving force in addition to the external driving force of the
applied electric field (Rajendra et al. 2000). Therefore, it can be concluded that the
nanocomposite polymer electrolyte containing the optimum concentration of MnO2
filler is more sensitive to the external electric fields and is more efficient for the
conduction of lithium ions. These observations imply that there are interactions between
the components in the polymer electrolyte system. From the above analysis, the
complex formation of nanocomposite polymer electrolyte has been confirmed.

95
4.1.4 Morphological studies
Figures 4.9 (a) – (d) show the surface morphologies of PMMA-PEO, PMMA-
PEO-LiClO4, PMMA-PEO-LiClO4-EC and PMMA-PEO-LiClO4-EC-MnO2 polymer
electrolyte systems. The figures show a marked change in the surface properties on the
addition of salts, plasticizer and filler. Prior to the addition of plasticizer, the
micrograph of PMMA-PEO and PMMA-PEO-LiClO4 (Figure 4.9 (a) and Figure 4.9
(b)) show a smooth surface with low crystalline domain. After plasticizer addition
(Figure 4.9 (c)), the micrograph of plasticized polymer electrolyte shows the presence of
spherulites, which is the characteristic of lamellar structure, with surface roughness that
may be related to the crystalline fraction of the material. The boundary between the
spherulites is the amorphous phase regions (Dhilip et al, 2010). The effect of adding
EC, plasticizer is in the highest conducting sample of PMM-PEO-LiClO4 system has
been investigated. It is observed that the samples are softer and less brittle.
Upon addition of filler, there was a decrease in the spherulite size and hence a
substantial increase in the amorphous boundary region. The surface roughness and
crystalline texture are decreased ultimately resulted in smooth texture of the surface.
Therefore, the filler addition helps in further reducing the crystallinity of the polymer
electrolyte films, which is responsible for obtaining higher conductivity. Figure 4.9(d)
shows the micrograph image of nanocomposites polymer electrolytes which recorded
the highest ionic conductivity. It shows that the MnO2 nanoparticles are distributed
randomly in the polymer host (Mohd Rafie Johan et al, 2011). Furthermore, there are no
define boundaries for foreign impurities exist which also justify the homogeneity of the
mixture.

96
(a) (b)
(c) (d)
Figure 4.9 FESEM images for (a) 80 wt% PMMA-20 wt% PEO, (b) 72 wt% PMMA-18 wt% PEO– 10 wt%LiClO4, (c) 57.6 wt% PMMA-
14.4 wt% PEO–8 wt% LiClO4–20 wt% EC, (d) 54.72 wt% PMMA-13.68 wt% PEO–7.6 wt% LiClO4–19 wt% EC–5 wt% MnO2

97
4.2 Conductivity Studies
Figure 4.10 (a) shows the typical Nyquist plot of PEO-PMMA polymer
electrolytes at various weight percent of PMMA. The value of conductivity of the
polymer blend is contributed by the presence of mobile ions in the air and surrounding.
The typical Nyquist plot of PEO-PMMA comprises of a broadened semicircle which
attributed to the due to the parallel combination of bulk resistance (due to the migration
of ions) and bulk capacitance (due to the immobile polymer chains). The frequency
response of the polymer electrolyte could be represented by an equivalent circuit
consisting of a parallel combination of resistance and capacitance (Macdonald, 1987).
The presence of the depressed semicircle reveals the non-Debye nature of the sample
due to the potential well for each site, through which the ion transport takes place, not
being equal (Lanfredi et al, 2002). The intercept of the semicircle with the real axis
(Zreal) at low frequency give rise to the bulk resistance (Rb) of the materials. It is evident
from the plot that 80:20 weight percent of PMMA/PEO has the smallest diameter of
impedance arc. This indicate that this composition of electrolyte possess highest ionic
conductivity.
Figure 4.10 (b) shows the variation of ionic conductivity for different weight
percent of PMMA-PEO. It is notable that the ionic conductivity of the polymer blend
composition of 80 wt% of PMMA and 20wt% of PEO showed the highest value at room
temperature which is 2.02 x 10⁻⁸ S/cm. A small decrease in conductivity is observed for
a composition beyond 80 wt% of PMMA due to viscosity in the polymer blend which
later was further justified by DSC.

98
Figure 4.10 (a) Complex impedance spectra of polymer electrolytes at various weight
percent of PMMA/PEO blend: (a) 90:10 (b) 80:20 (c) 70:30 (d) 60:40 (e) 50:50 (f)
40:60
Figure 4.10 (b) Variation of conductivity for different weight percent of PMMA/PEO
0
10
20
30
40
50
60
70
80
90
0 50 100 150 200 250
Zim
ag
X 1
04
(Ω)
Zreal x 104 (Ω)
(a)
(b)
(c)
(d)
(e)
(f)
0
5
10
15
20
25
0.20 0.30 0.40 0.50 0.60 0.70 0.80 0.90 1.00
con
du
ctiv
ity
(x
10
-8S
cm
-1)
Composition of PMMA (wt%)
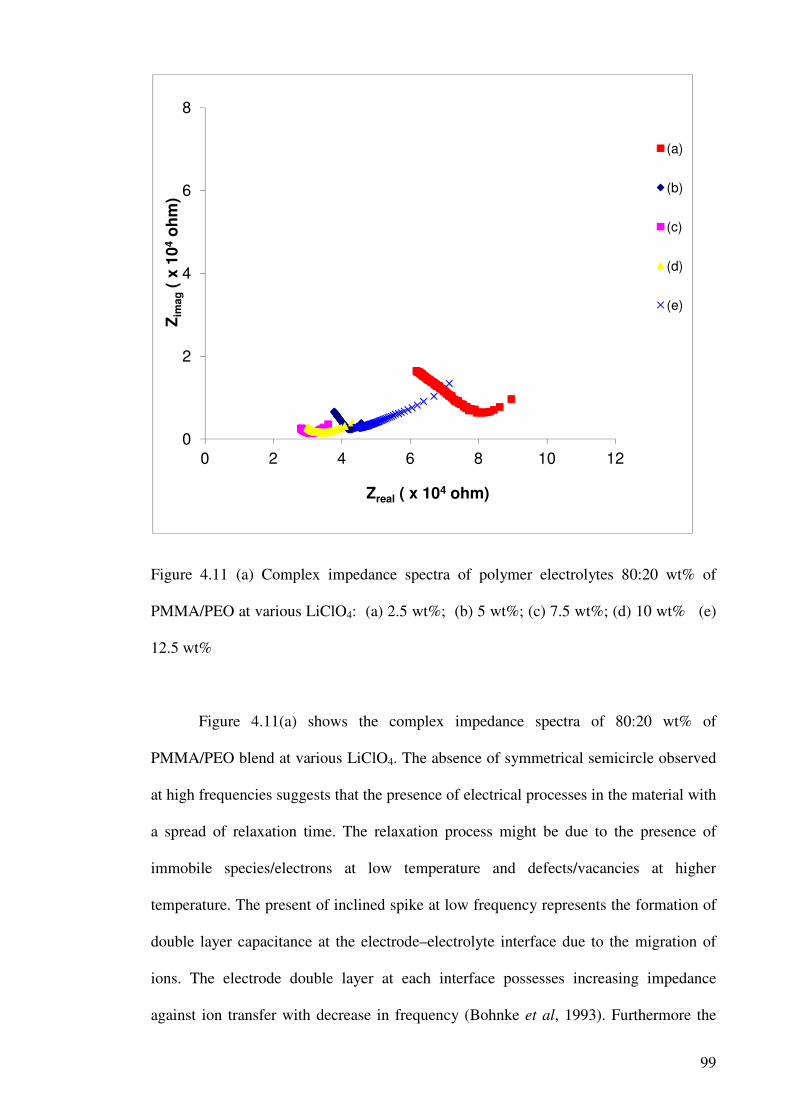
99
Figure 4.11 (a) Complex impedance spectra of polymer electrolytes 80:20 wt% of
PMMA/PEO at various LiClO4: (a) 2.5 wt%; (b) 5 wt%; (c) 7.5 wt%; (d) 10 wt% (e)
12.5 wt%
Figure 4.11(a) shows the complex impedance spectra of 80:20 wt% of
PMMA/PEO blend at various LiClO4. The absence of symmetrical semicircle observed
at high frequencies suggests that the presence of electrical processes in the material with
a spread of relaxation time. The relaxation process might be due to the presence of
immobile species/electrons at low temperature and defects/vacancies at higher
temperature. The present of inclined spike at low frequency represents the formation of
double layer capacitance at the electrode–electrolyte interface due to the migration of
ions. The electrode double layer at each interface possesses increasing impedance
against ion transfer with decrease in frequency (Bohnke et al, 1993). Furthermore the
0
2
4
6
8
0 2 4 6 8 10 12
Zim
ag
( x
10
4o
hm
)
Zreal ( x 104 ohm)
(a)
(b)
(c)
(d)
(e)

100
0
2
4
6
8
0.0 2.5 5.0 7.5 10.0 12.5
Co
nd
uct
ivit
y (
10
-4S
cm
-1)
Composition of LiClO4 (wt %)
inclination of the spike at an angle less than 90° to the real axis is due to the roughness
of the electrode–electrolyte interface (Ressy et al,2007).
Figure 4.11 (b) Variation of conductivity for 80:20 wt% PMMA-PEO with different wt %
of LiClO4
Figure 4.11 (b) shows the impedance spectra of PEO-PMMA blend at various
weight percent of LiClO4 salts. It can be observed that the conductivity of the polymer
blend increases with the increase in salt content. The highest value of conductivity is
7.38 x 10⁻⁴ S cm-1 for 10wt% of LiClO4. As the salt content increases, the number of
free mobile ions increases and thus increases the ionic conductivity, σ. However, for
system with salt content beyond 10 wt% of LiClO4, the conductivity decreases because
ions start to agglomerate and decrease the number of free mobile ions.

101
Figure 4.12 (a) Complex impedance spectra for PMMA/PEO/LiClO4 polymer
electrolytes at various EC plasticizer: (a) 5 wt% (b) 10 wt% (c) 15 wt% (d) 20 wt% (e)
25 wt%
Figure 4.12 (a) shows the impedance spectra of Complex impedance spectra of
PMMA/PEO/LiClO4 polymer electrolytes at various wt% EC plasticizers. The presence
of asymmetric semicircle in the higher frequency region is due to bulk and grain
boundary resistance of the electrolyte. The inclined straight line at lower frequency
region with the real axis can be attributed due to the capacitance of electrolyte/electrode
double layer. The diameter within the semi-circle of the Nyquist plots decreases with
increasing the concentration of plasticizer. This may be associated with the substantial
decrease in grain boundary resistance of the materials when the concentration of
plasticizer is increased (Wang et al, 2005). As a result, the movement of Li+ ion through
the polymer chain becomes easier. This provide the evidence that plasticizer plays an
important role in influencing the ionic conductivity of polymer electrolyte system.
0.00
0.05
0.10
0.15
0.20
0.00 0.10 0.20 0.30 0.40 0.50
Zim
ag
x 1
04(o
hm
)
Zreal x 104 (ohm)
(a)
(b)
(c)
(e)
(d)

102
0
5
10
15
20
0 5 10 15 20 25
Co
nd
uct
ivit
y (
10
-4S
cm
-1)
Composition of EC (wt %)
Figure 4.12 (b) Variation of ionic conductivity for PMMA/PEO/LiClO4 with different
weight percent of EC.
Figure 4.12 (b) shows the effect of EC on the conductivity of the highest
conducting PMMA-PEO-LiClO4 sample. It is observed that the ionic conductivity of
the salted polymer blend electrolyte is increased upon the addition of EC plasticizer. EC
possess the properties of low viscosity and high dielectric constant, which facilitates to
dissociate more salts into ions and increases the ionic conductivity. The maximum
conductivity value of 1.82 x 10⁻³ S cm-1 is obtained at 20 wt% of the plasticizer content
and decrease again at EC content of 25 wt%. This decrease in conductivity could be due
to ion aggregation. This is because ion aggregation decreases the available number of
charge carriers.
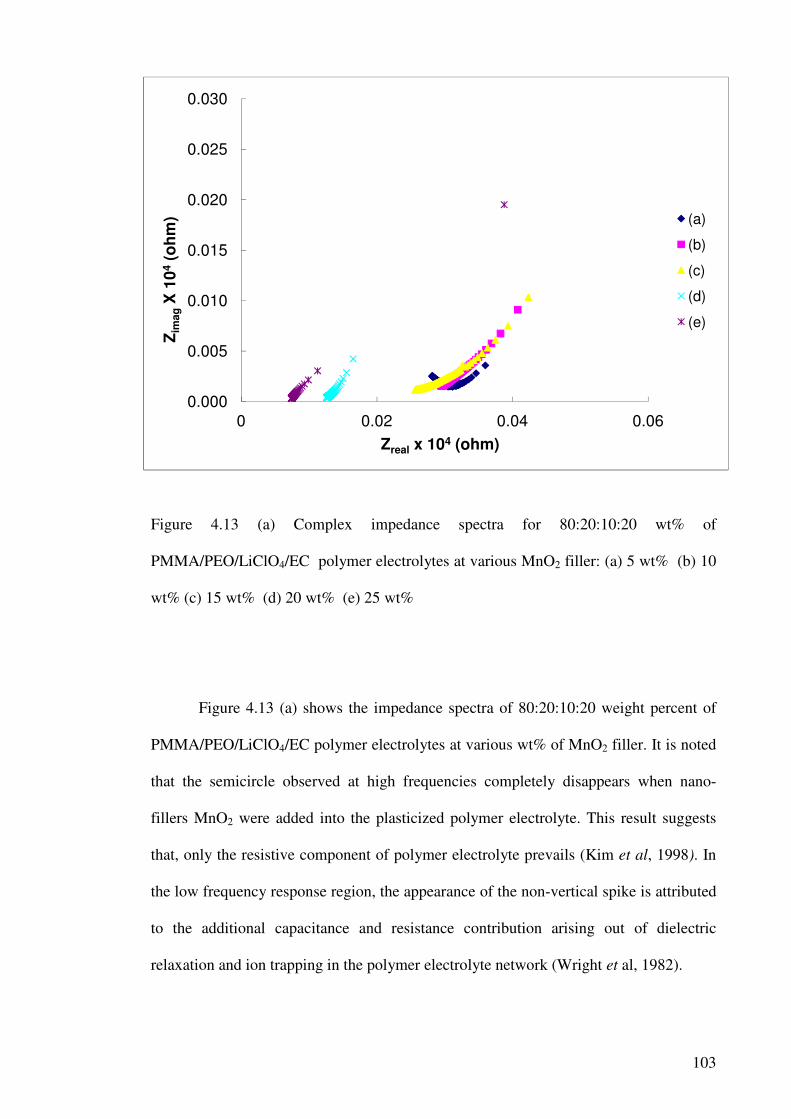
103
0.000
0.005
0.010
0.015
0.020
0.025
0.030
0 0.02 0.04 0.06
Zim
ag
X 1
04
(oh
m)
Zreal x 104 (ohm)
(a)
(b)
(c)
(d)
(e)
Figure 4.13 (a) Complex impedance spectra for 80:20:10:20 wt% of
PMMA/PEO/LiClO4/EC polymer electrolytes at various MnO2 filler: (a) 5 wt% (b) 10
wt% (c) 15 wt% (d) 20 wt% (e) 25 wt%
Figure 4.13 (a) shows the impedance spectra of 80:20:10:20 weight percent of
PMMA/PEO/LiClO4/EC polymer electrolytes at various wt% of MnO2 filler. It is noted
that the semicircle observed at high frequencies completely disappears when nano-
fillers MnO2 were added into the plasticized polymer electrolyte. This result suggests
that, only the resistive component of polymer electrolyte prevails (Kim et al, 1998). In
the low frequency response region, the appearance of the non-vertical spike is attributed
to the additional capacitance and resistance contribution arising out of dielectric
relaxation and ion trapping in the polymer electrolyte network (Wright et al, 1982).

104
0
1
2
3
4
5
6
0 5 10 15 20 25 30
Co
nd
uct
ivit
y (
10
-3S
cm
-1)
Composition of MnO2 (wt %)
Figure 4.13 (b) shows the effect of MnO2 nano-filler on the conductivity of the
highest conducting PMMA-PEO-LiClO4-EC sample. It is observed that the conductivity
increases upon the addition of MnO2 filler with a maximum value of 5.02 x 10⁻³ S cm-1
at room temperature. The addition of nano-filler retards the recrystallization of polymer
chains. Since the size of filler is too small compared to the polymer host, the filler is
able to penetrate into the polymer matrix and promotes an interaction between filler,
plasticizer and polymer chain molecules. Consequently, the cohesive force between the
polymer chains is reduced and provides a more flexible chain segmental motion (Uma
et al, 2004).
Figure 4.13 (b) Variation of ionic conductivity 80:20:10:20 wt% of
PMMA/PEO/LiClO4/EC polymer electrolyte with respect to filler content at room
temperature

105
Figure 4.14 (a) – (d) show the temperature dependence of ionic conductivity for
various polymer electrolyte systems. All the curves display similar behaviour, i.e. a
combination of VTF and Arrhenius behaviour. Arrhenius region is noticed in low
temperature regime while VTF nature is exhibited at higher temperature. The effect of
temperature (T) on conductivity is not governed by the classical theory that is the
dependence of conductivity on temperature does not follow only the Arrhenius law
where the activation energy for the ion’s motion in polymer matrix is dominant. When
ion transport is facilitated by the mobility of the polymer, the conductivity may obey the
Vogel-Tammann-Fulcher (VTF) relation at higher temperature around melting
temperature of the polymer electrolytes. (Appetecchi et al, 1998).

106
-8.0
-6.0
-4.0
-2.0
2.6 2.8 3.0 3.2 3.4
log
σ (
S c
m-1
)
1000/T (K-1)
(a)
(b)
(c)
(d)
(e)
Figure 4.14 (a) Temperature dependence of ionic conductivity for various weight
percent of PMMA: PEO blend polymer electrolyte systems: 90:10; (b) 80:20; (c)
50:50); (d) 60:40; (e) 50:50; (f) 40:60
Figure 4.14 (b) Temperature dependence of ionic conductivity for PMMA/PEO blend
at various weight percent of LiClO4 salt: (a) 2.5 wt% (b) 5 wt% (c) 7.5 wt% (d) 10 wt%
(e) 12.5 wt%
-8.40
-8.20
-8.00
-7.80
-7.60
-7.40
-7.20
-7.00
2.60 2.70 2.80 2.90 3.00 3.10 3.20 3.30 3.40
log
σ (
S c
m-1
)
1000/T (K-1)
(a)
(b)
(c)
(d)
(e)
(f)

107
Figure 4.14 (c) Temperature dependence of ionic conductivity for PMMA/PEO/LiClO4
at various weight percent of EC plasticizer: (a) 5 wt% (b) 10 wt% (c) 15 wt% (d) 20
wt% (e) 25 wt%
Figure 4.14 (d) Temperature dependence of ionic conductivity for PMMA/PEO/LiClO4/EC at various weight percent of MnO2 filler: (a) 5 wt% (b) 10 wt% (c) 15 wt% (d) 20 wt% (e) 25 wt%
-3.50
-3.00
-2.50
-2.00
-1.50
2.60 2.80 3.00 3.20 3.40
log
σ (
S c
m-1
)
1000/T (K-1)
(a)
(b)
(c)
(d)
(e)
-3.50
-3.00
-2.50
-2.00
-1.50
2.6 2.8 3 3.2 3.4
log
σ (
S c
m-1
)
1000/T (K-1)
(a)
(b)
(c)
(d)
(e)

108
4.3 Dielectric Studies
Figures 4.15 – 4.16 show the frequency dependence of real and imaginary parts
of the dielectric relaxation curves for 80:20 wt% of PMMA/PEO, 80:20:10 wt% of
PMMA/PEO/LiClO4, 80:20:10:20 wt% of PMMA/PEO/LiClO4/EC and 80:20:10:20:5
wt% of PMMA/PEO/LiClO4/EC/MnO2 polymer electrolyte system. Both real and
imaginary parts of the dielectric constant rise sharply towards low frequencies. However
the rise is displaced to higher frequencies upon addition of salts, plasticizer and filler
into the polymer electrolyte systems. The periodic reversal of the electric field occurs
extremely fast at high frequencies and that there is no excess of ion diffusion in the
direction of the field. The polarization due to the charge accumulation decreases,
leading to the decrease in the value of the real and imaginary part of dielectric constant
(Ramesh et. al., 2001)
Figure 4.15 Variation of real part of dielectric constant of (a) PMMA-PEO, (b) PMMA-
PEO-LiClO4, (c) PMMA-PEO-LiClO4-EC and (d) PMMA-PEO-LiClO4-EC-MnO2 at
room temperature.
0
5
10
15
20
25
30
35
0 1 2 3 4 5 6
εr
Log ƒ (Hz)
(a)
(b)
(c)
(d)
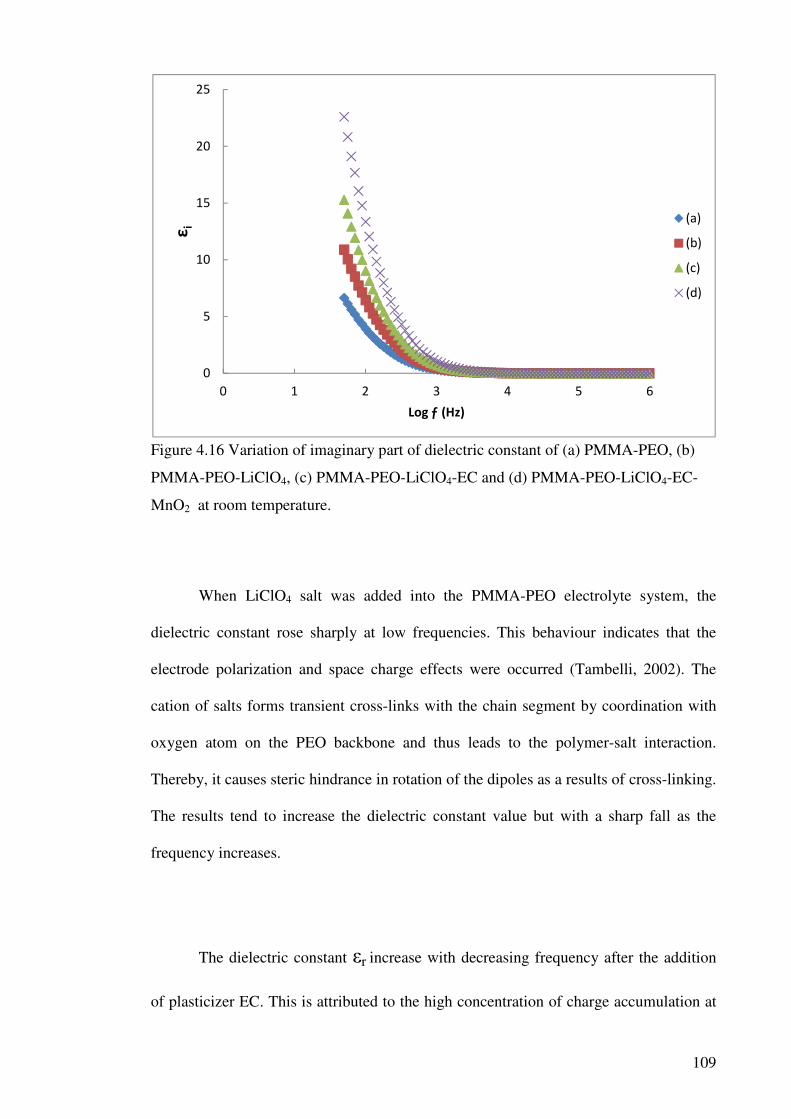
109
Figure 4.16 Variation of imaginary part of dielectric constant of (a) PMMA-PEO, (b)
PMMA-PEO-LiClO4, (c) PMMA-PEO-LiClO4-EC and (d) PMMA-PEO-LiClO4-EC-
MnO2 at room temperature.
When LiClO4 salt was added into the PMMA-PEO electrolyte system, the
dielectric constant rose sharply at low frequencies. This behaviour indicates that the
electrode polarization and space charge effects were occurred (Tambelli, 2002). The
cation of salts forms transient cross-links with the chain segment by coordination with
oxygen atom on the PEO backbone and thus leads to the polymer-salt interaction.
Thereby, it causes steric hindrance in rotation of the dipoles as a results of cross-linking.
The results tend to increase the dielectric constant value but with a sharp fall as the
frequency increases.
The dielectric constant εr increase with decreasing frequency after the addition
of plasticizer EC. This is attributed to the high concentration of charge accumulation at
0
5
10
15
20
25
0 1 2 3 4 5 6
εi
Log ƒ (Hz)
(a)
(b)
(c)
(d)

110
the electrode-electrolyte interface (Baskaran et al, 2004). However, a rapid decrease in
dielectric constant was observed within the frequency range of 1-10 kHz. This may
attributed to the tendency of dipoles in macromolecules to orient themselves in the
direction of the applied field in the low frequency range.
Apparently, it can be observed that a large increase of εr and εi upon the addition
of MnO2 fillers due to dipolar and free charge contributions. Further increase of the
molecular mobility is reflected both by the increase of free charge mobility and the
shifting of peak towards the higher frequency side. Some changes are expected in the
dipole moment when nano sized MnO2 fillers are added, which raise the dielectric
constant in the system. Since MnO2 filler has a high dielectric constant (Internet
reference 01/12/2011), it contributes to the conduction of lithium ions by providing an
inner driving force in addition to the external driving force of the applied electric field.
It can therefore be concluded that the composite electrolyte, which contains the
inorganic filler, is more sensitive to external electric fields and more efficient for the
conduction of lithium ions.
This behaviour would make the dipole moments more changeable and polarized
under the electric charge and discharge processes. Therefore, the changeable dipole
momentum acts as one type of vibration and can give some activation energy and more
chance for ion conduction, which accordingly results in the increase of ionic
conductivity.

111
Fig. 4.17 shows the variation of tangent δ with frequency of polymer electrolyte
system at room temperatures. The loss spectra characterized by peak appearing at a
characteristic frequency suggest the presence of relaxing dipoles in all samples. The
tangent δ peaks shift towards the higher frequency side on the addition of salts,
plasticizer and fillers.
Figure 4.17 Variation of tan δ for (a) PMMA-PEO, (b) PMMA-PEO-LiClO4, (c)
PMMA-PEO-LiClO4-EC and (d) PMMA-PEO-LiClO4-EC-MnO2 at room temperature.
0
10
20
30
40
50
60
0 1 2 3 4 5 6 7 8
tan
δ
Log f (Hz)
(a)
(c)
(b)
(d)

112
The addition of LiClO4 salt into the polymer electrolyte system had a profound
effect on the relaxation rate of PMMA-PEO polymer electrolyte system. This relaxation
could be attributed to the addition of free moving ions of lithium that coordinated with
polymer chain segments (Bergman et al, 1995). However, the process of dielectric loss
can be assigned to the relaxation phenomena due to glass transition of the amorphous
component of the polymer (Havriliak and Negami, 1995). It is observed that the peak
frequency is shifting towards the higher frequency side with addition of plasticizer EC.
However, there is an increase in the amorphous content in the materials when
MnO2 fillers were added into the polymer electrolyte system. These further speed up the
segmental motion by increasing the available free volume. It is evidenced by the peak
shifting towards higher frequency side, thereby reducing the relaxation time. The
relatively fast segmental motion coupled with mobile ions enhances the transport
properties on plasticization. The loss peak is shifting towards the higher frequency side
on addition of filler.

113
4.4 Thermal Studies
4.3.1 Differential Scanning Calorimeter (DSC) analysis
DSC was used to measure the glass transition and crystallization temperature of
the polymer electrolyte system within temperature range of -100 to 200 oC at a scanning
rate of 5oC per min. The preparation of polymer electrolyte with a low glass transition
temperature (Tg) is one of the important factors for increasing conductivity. Figures
4.18 – 4.21 show the DSC curves of different polymer electrolyte systems. In Figure
4.18, DSC curves of different ratios of PMMA and PEO on melting and crystallinity
behavior of the blend system was shown. Generally, two well-separate peaks were
obtained on DSC thermogram as shown due to incompatibility between PMMA and
PEO. Only for blend ratio (80:20), a single peak is observed which indicate the
miscibility between PMMA and PEO. Apparently, this indicates the formation of an
intermolecular interaction between the polymers components. Table 4.3 summarizes the
DSC results.
Table 4.3 Thermal properties of PMMA/PEO blends
wt% PEO wt% PMMA Tg (oC) Tm (oC) ∆Hm (J/g) Χc (%)
10 90 -54.84 58.98 54.84 60.01
20 80 -60.00 52.13 53.15 16.18
30 70 -55.54 52.34 232.40 27.48
40 60 -56.54 54.05 386.38 37.33
50 50 -58.84 59.77 424.50 46.11
60 40 -52.65 58.24 376.40 54.42

114
The degree of crystallinity Xc(%) is calculated, according to the equation χc =
∆Hm/203 J g− 1 (where χc is the relative percentage of crystallinity of the PEO-based
blender, and 203 J g− 1 is the ∆Hm of 100% crystalline PEO) (Hu et al, 2007). It can be
seen that the composition of 80wt % PMMA and 20wt% PEO shows the lowest Tg and
Tm which is around -60oC and 52.13oC respectively. This manifested that the high
miscibility level between PMMA and PEO at the composition of 80wt% PMMA and
20wt% PEO. In addition, the decrease of crystallinity, χc increased the amorphous phase
in the polymer blend which collaborate the proof of miscibility again. Figure 4.19 show
the DSC thermogram of 80:20 wt% of PMMA/PEO blend at various wt% of LiClO4.
From Table 4.4, it can be observed that the melting temperature and crystallinity
decreases with salt addition, as usually observed for polymer electrolytes (Armand,
1994). A significant decrease in Tg with increasing LiClO4 concentration is observed.
This can be interpreted on the basis of chain flexibility, which is reflected by Tg. The
salt effect is related to a weakening of the dipole–dipole interactions between the PEO-
PMMA polymer blend chains due to the presence of salt (Umadevi et al, 2002). The
low glass transition temperature causes the higher segmental motion of the polymer
electrolyte, which enables the easy flow of ions through polymer chains network when
there is an applied electric field.
Table 4.4 Thermal properties of PMMA/PEO/LiClO4 polymer electrolyte systems
% LiClO4 Tg (oC) Tm (oC) ∆Hm (J/g) Χc (%)
2.5 -60.71 51.98 67.45 28.58
5.0 -61.12 50.93 15.15 27.32
7.5 -67.54 50.34 9.40 24.54
10.0 -70.54 49.05 11.38 12.50
12.5 - 49.77 4.50 22.17
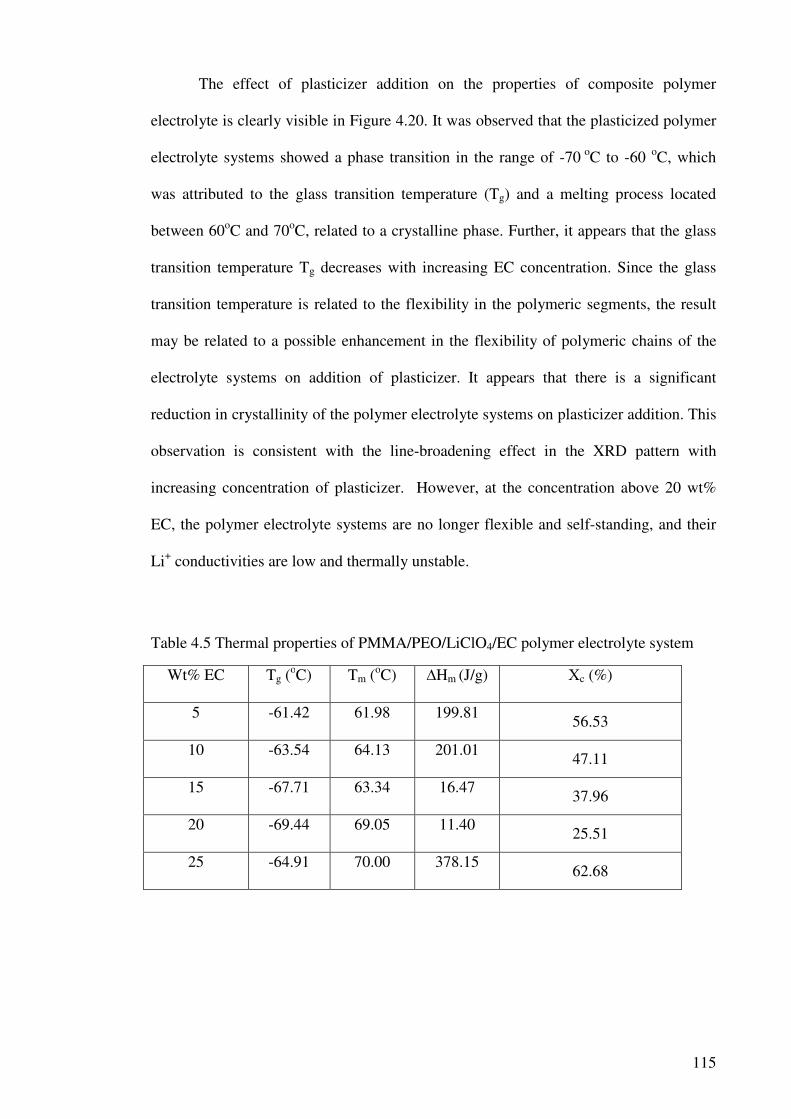
115
The effect of plasticizer addition on the properties of composite polymer
electrolyte is clearly visible in Figure 4.20. It was observed that the plasticized polymer
electrolyte systems showed a phase transition in the range of -70 oC to -60 oC, which
was attributed to the glass transition temperature (Tg) and a melting process located
between 60oC and 70oC, related to a crystalline phase. Further, it appears that the glass
transition temperature Tg decreases with increasing EC concentration. Since the glass
transition temperature is related to the flexibility in the polymeric segments, the result
may be related to a possible enhancement in the flexibility of polymeric chains of the
electrolyte systems on addition of plasticizer. It appears that there is a significant
reduction in crystallinity of the polymer electrolyte systems on plasticizer addition. This
observation is consistent with the line-broadening effect in the XRD pattern with
increasing concentration of plasticizer. However, at the concentration above 20 wt%
EC, the polymer electrolyte systems are no longer flexible and self-standing, and their
Li+ conductivities are low and thermally unstable.
Table 4.5 Thermal properties of PMMA/PEO/LiClO4/EC polymer electrolyte system
Wt% EC Tg (oC) Tm (oC) ∆Hm (J/g) Χc (%)
5 -61.42 61.98 199.81 56.53
10 -63.54 64.13 201.01 47.11
15 -67.71 63.34 16.47 37.96
20 -69.44 69.05 11.40 25.51
25 -64.91 70.00 378.15 62.68

116
Figure 4.21 shows the effect of MnO2 nano filler on thermal transitions of PEO-
PMMA-LiClO4-EC polymer electrolyte system. It is observed that all filler added
polymer electrolytes system shows an endothermic peaks temperature around 80 °C
attributed to the melting of the crystalline phases of polymer electrolyte. It is observed
that with the decreasing of filler concentration, both the Tg and Tm decreases. This
implies a complete transformation of polymer matrix from semi-crystalline to
amorphous phase. The change in morphology is attributed to the filler concentration,
which may result from the increased mobility and dissociation effect evidenced by the
dielectric constants for increased concentration of charge carriers. This argument
supports our observation from the FT-IR studies. When above concentration of 5 wt%,
fillers are overloaded and form ions segregation.
Table 4.6 Thermal properties of PMMA/PEO/LiClO4/EC/MnO2 polymer electrolyte system
Wt% MnO2 Tg (oC) Tm (oC) ∆Hm (J/g) Χc (%)
5 -76.42 69.13 16.54 17.99
10 -73.54 74.47 103.65 50.07
15 -70.71 67.34 98.40 57.54
20 -67.44 71.25 216.37 64.53
25 -60.91 73.77 529.01 71.56
Table 4.6 shows the thermal properties of PMMA/PEO/LiClO4/EC/MnO2
polymer electrolyte system .As seen from the table, the degree of crystallinity increases
dramatically with increasing of filler content which indicate that the filler is overloaded
in the polymer matrix and form ion segregation which conspire with the FTIR and XRD
results. The smallest crystallinity, χc achieved by 80 wt% PMMA- 20 wt% PEO -10 wt%

117
LiClO4 – 20 wt% EC - 5wt% MnO2 justify the amorphous phase in the polymer
electrolyte system which collaborate the proof of miscibility again.
In general, a low glass transition temperature of the polymer electrolyte system
is essential to obtain high ionic conductivity at room temperature (Fonseca et al, 2002).
The Tg of all the solid polymer electrolytes systems are found to be well below room
temperature, which satisfies one of the major prerequisites of a material to behave as a
solid polymer electrolyte system at ambient temperatures. The lowest glass transition
temperature is achieved when 5wt % of MnO2 filler is incorporated into the 80 wt%
PMMA -20 wt% PEO -10wt% LiClO4 – 20wt% EC polymer electrolyte system which
attributed to the disruption of the ordered domains in the polymer matrix.
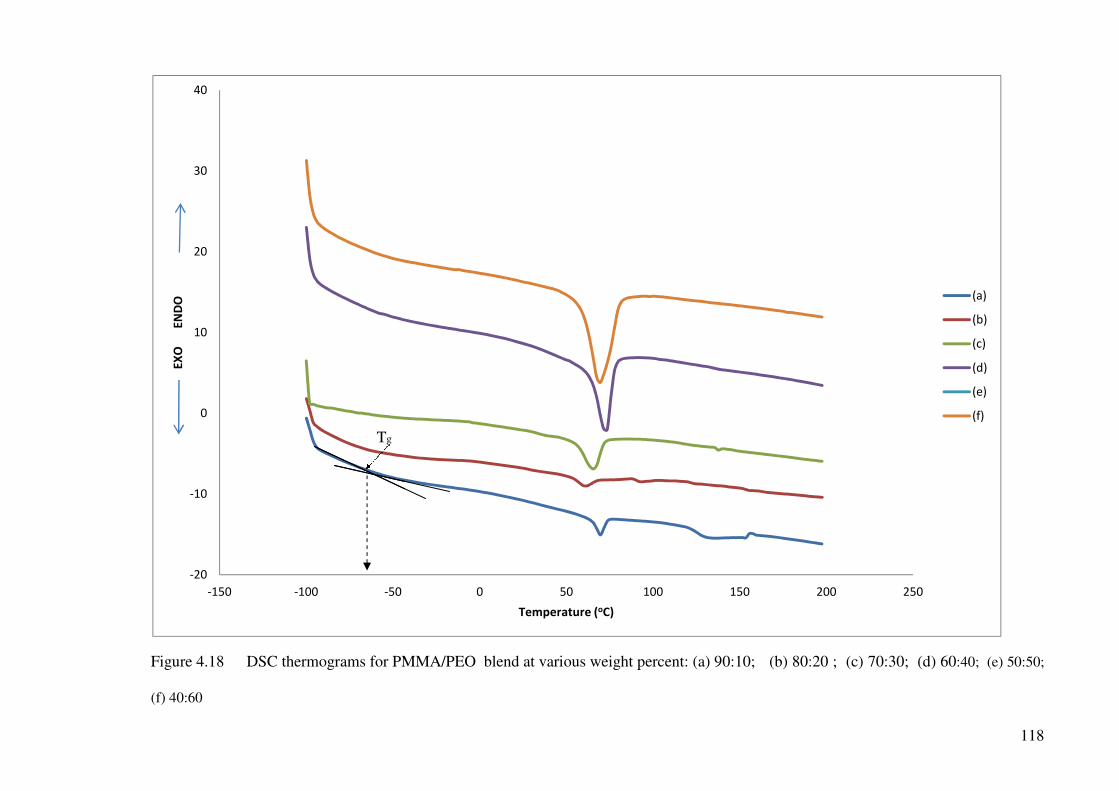
Figure 4.18 DSC thermograms for PMMA/PEO
(f) 40:60
-20
-10
0
10
20
30
40
-150 -100 -50
EX
O
E
ND
O
Tg
MMA/PEO blend at various weight percent: (a) 90:10; (b) 80:20 ;
0 50 100 150
Temperature (oC)
118
(b) 80:20 ; (c) 70:30; (d) 60:40; (e) 50:50;
200 250
(a)
(b)
(c)
(d)
(e)
(f)

119
Figure 4.19 DSC thermograms for PMMA/PEO polymer electrolyte system at various weight percent of LiClO4 : (a) 2.5 wt% ; (b) 5 wt%;
(c) 7.5 wt%; (d) 10 wt%; (e) 12.5 wt%
-30
-20
-10
0
10
20
30
40
-150 -100 -50 0 50 100 150 200 250
(a)
(b)
(c)
(d)
(e)
Temperature (oC)
EX
O
EN
DO
Tg
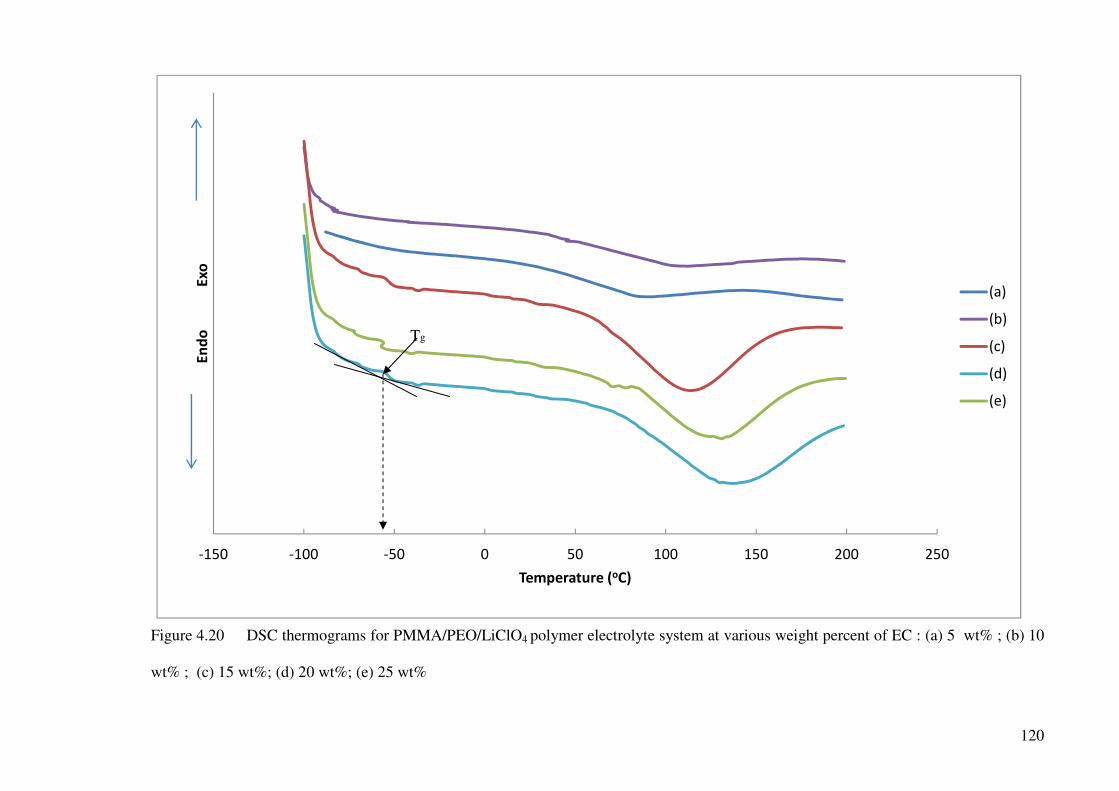
120
-150 -100 -50 0 50 100 150 200 250
En
do
Exo
Temperature (oC)
(a)
(b)
(c)
(d)
(e)
Figure 4.20 DSC thermograms for PMMA/PEO/LiClO4 polymer electrolyte system at various weight percent of EC : (a) 5 wt% ; (b) 10
wt% ; (c) 15 wt%; (d) 20 wt%; (e) 25 wt%
Tg

121
Figure.4.21 DSC thermograms for PMMA/PEO/LiClO4/EC polymer electrolyte system at various weight percent of MnO2 filler: (a) 5 wt%
MnO2 (b) 10 wt% MnO2 (c) 15 wt% MnO2 (d) 20 wt% MnO2 (e) 25 wt% MnO2
-150 -100 -50 0 50 100 150 200 250
En
do
.
E
xo.
Temperature (oC)
(a)
(b)
(c)
(d)
(e)
Tg

122
4.3.2 Thermogravimetric (TGA) Analysis
In order to ascertain the thermal stability, the polymer electrolytes systems were
subjected to TGA amd DTG analysis. Figures 4.22 - 4.25 presented the
thermogravimetry (TG) and derivative thermogravimetry (DTG) profiles of polymer
electrolytes system at a heating rate of 10 °C min−1. In Figure 4.22, the polymer blend
appears to be quite dry since its weight is almost constant up to 45 oC. Above 45 oC,
after complete dehydration, no further weight loss is observed until an irreversible
decomposition commenced at 370oC and shows a weight loss of 92.13%. In indicates
that the polymer blend is stable up to 45 oC. The loss may due to decomposition of
polymer blend occurred (Stephen et al, 2005)
Figure 4.22 TGA-DTG curves for 80:20 wt% of PMMA/PEO blend
0
5
10
15
20
25
0
10
20
30
40
50
60
70
80
90
100
0 200 400 600 800 1000 1200
We
igh
t lo
ss (
%)
Temperature (0C)
TGA
DTG

123
Figure 4.23 TGA-DTG curves for 72PMMA:18PEO:10Li polymer electrolytes
.
Figure 4.24 TGA-DTG curves for 57.6PMMA:14.4PEO:8Li:20EC polymer electrolytes
0
4
8
12
16
20
0
10
20
30
40
50
60
70
80
90
100
0 200 400 600 800 1000 1200
We
igh
t lo
ss (
%)
Temperature (0C)
0
10
20
30
40
50
60
70
80
90
100
0 200 400 600 800 1000 1200
0
2
4
6
8
10
12
14
Temperature (oC)
WE
igh
t lo
ss (
%)
TGA
TGA
DTG
DTG

124
Figure 4.25 TGA-DTG curves for 54.7PMMA:13.4PEO:7.6LiClO4:19EC:5MnO2
polymer electrolytes
Figure 4.23 show the TGA-DTG curve for 72PMMA:18PEO:10Li polymer
electrolytes. A weight loss about 4.45% at 85oC is observed due to the removal of
moisture in LiClO4 salt in the electrolyte (Uma et al, 2004). The second decomposition
occurred at 380 oC which showed weight loss of 85.37%. Obviously, this indicates that
72PMMA:18PEO:10Li polymer electrolyte is stable up to 85oC. Figure 4.24 show the
TGA- DTG curves for 57.6PMMA:14.4PEO:8Li:20EC polymer electrolytes. At
temperature around 101 oC, a small amout of weight loss is observed. This is considered
as teh result of loss of solvent and moisture from the electrolytes as mentioned earlier.
This firest decomposition occurred at temperature 101oC which suffered weight loss
from 2.21%. In Figure 4.25, the initial weight loss temperature happened at 110 oC
which suffered a weight loss of 0.98%. this shows that thermal stability increase with
0
2
4
6
8
10
12
14
0
10
20
30
40
50
60
70
80
90
100
0 200 400 600 800 1000 1200
We
igh
t lo
ss (
%)
Temperature (0C)
TGA
DTG
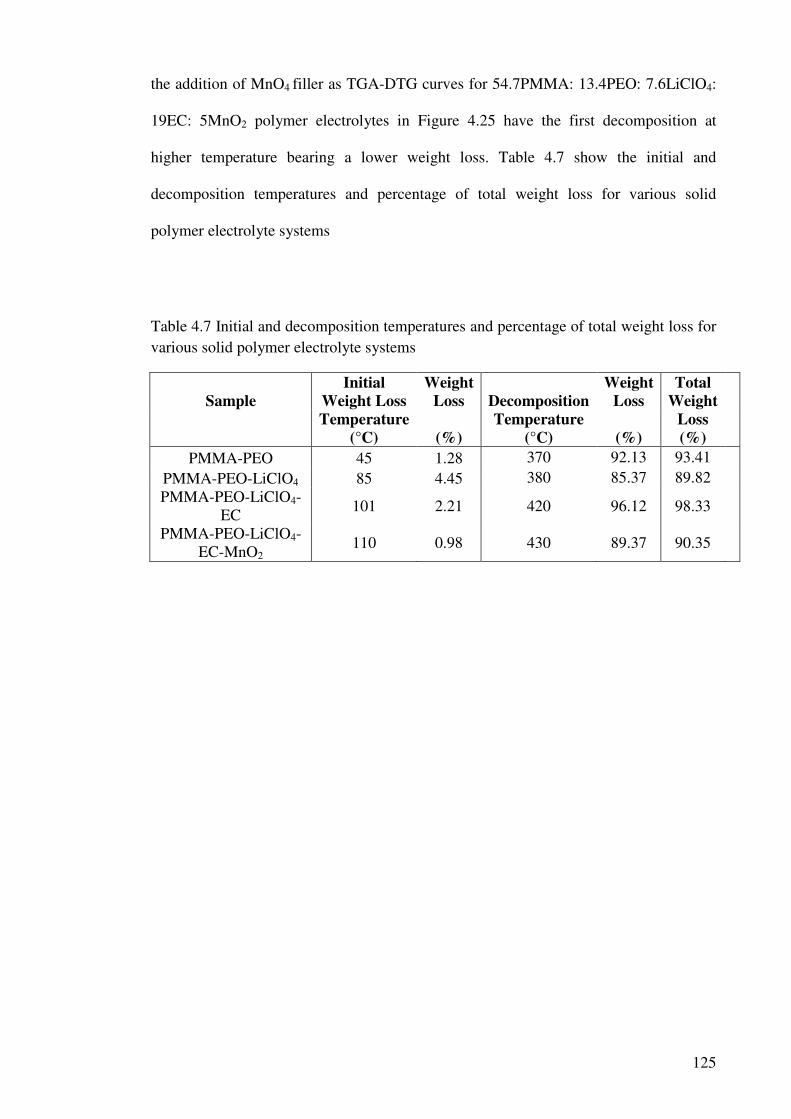
125
the addition of MnO4 filler as TGA-DTG curves for 54.7PMMA: 13.4PEO: 7.6LiClO4:
19EC: 5MnO2 polymer electrolytes in Figure 4.25 have the first decomposition at
higher temperature bearing a lower weight loss. Table 4.7 show the initial and
decomposition temperatures and percentage of total weight loss for various solid
polymer electrolyte systems
Table 4.7 Initial and decomposition temperatures and percentage of total weight loss for various solid polymer electrolyte systems
Sample
Initial
Weight Loss
Weight
Loss Decomposition
Weight
Loss
Total
Weight
Temperature
(°C) (%)
Temperature
(°C) (%)
Loss
(%)
PMMA-PEO 45 1.28 370 92.13 93.41 PMMA-PEO-LiClO4 85 4.45 380 85.37 89.82 PMMA-PEO-LiClO4-
EC 101 2.21 420 96.12 98.33
PMMA-PEO-LiClO4-EC-MnO2
110 0.98 430 89.37 90.35
126
4.4 Optical Studies
Figure 4.26 shows the optical absorption spectra for the optimum polymer
electrolytes within the region of 230-290 nm. It is observed that there is a peak at
around 230 nm representing the π-π* electron orbital transition along the backbone of
the polymer matrix PMMA-PEO chain (Harold et al, 2005). The absorption intensity
varies when salts, plasticizer and fillers are added into the polymer electrolyte system.
This shows the occurrence of electronic transition between the bonds. The shift in
absorption edge towards higher wavelengths indicates the formation of inter/intra bonds
between each component in the polymer electrolyte system, which is consistent with the
FTIR results. These bonds reflect the variation of energy bandgap which arises due to
the variation in crystallinity within the polymer matrix (Yahya, 2000)
Figures 4.27 – 4.28 show the Tauc’s plot with variation of (αhυ)1/2 and (αhυ)2
with hυ. Optical band gap Eg can be determined by the extrapolation of best fit line
between (αhυ)1/2 and (αhυ)2 intercept the x-axis. The variation of optical band gap with
different polymer electrolyte system are summarized in Table 4.8.

127
Figure 4.26 Optical absorption spectra for optimum polymer electrolytes: a) PEO- PMMA b) PEO-PMMA-LiClO4 c) PEO-PMMA-LiClO4-EC
d) PEO-PMMA-LiClO4-EC MnO2
0.00
0.20
0.40
0.60
0.80
1.00
1.20
1.40
1.60
1.80
2.00
230 240 250 260 270 280 290
Ab
sorb
an
ce
Wavenumber (nm)
(a)
(b)
(d)
(c)

128
0
10
20
30
40
50
60
70
80
90
100
4.5 4.6 4.7 4.8 4.9 5 5.1 5.2 5.3 5.4
(αh
v)2
(eV
/cm
)2
Eg (eV)
(a)
(b)
(c)
(d)
(d)
Figure 4.27 Plot of (αhυ)2 against Eg (photon energy) for the optimum polymer electrolytes : a) PEO- PMMA b) PEO-PMMA-LiClO4 c)
PEO-PMMA-LiClO4-EC d) PEO-PMMA-LiClO4-EC- MnO2

129
Figure 4.28 Plots of (αhυ)1/2 against Eg (photon energy) for the optimum polymer electrolytes: a) PEO- PMMA b) PEO-PMMA-LiClO4 c)
PEO-PMMA-LiClO4-EC d) PEO-PMMA-LiClO4-EC MnO2
0.00
0.50
1.00
1.50
2.00
2.50
3.00
3.50
5 5.1 5.2 5.3 5.4 5.5 5.6 5.7 5.8
(αh
v)1
/2(e
V/c
m)1
/2
Eg
(a)(d)
(b)
(c)
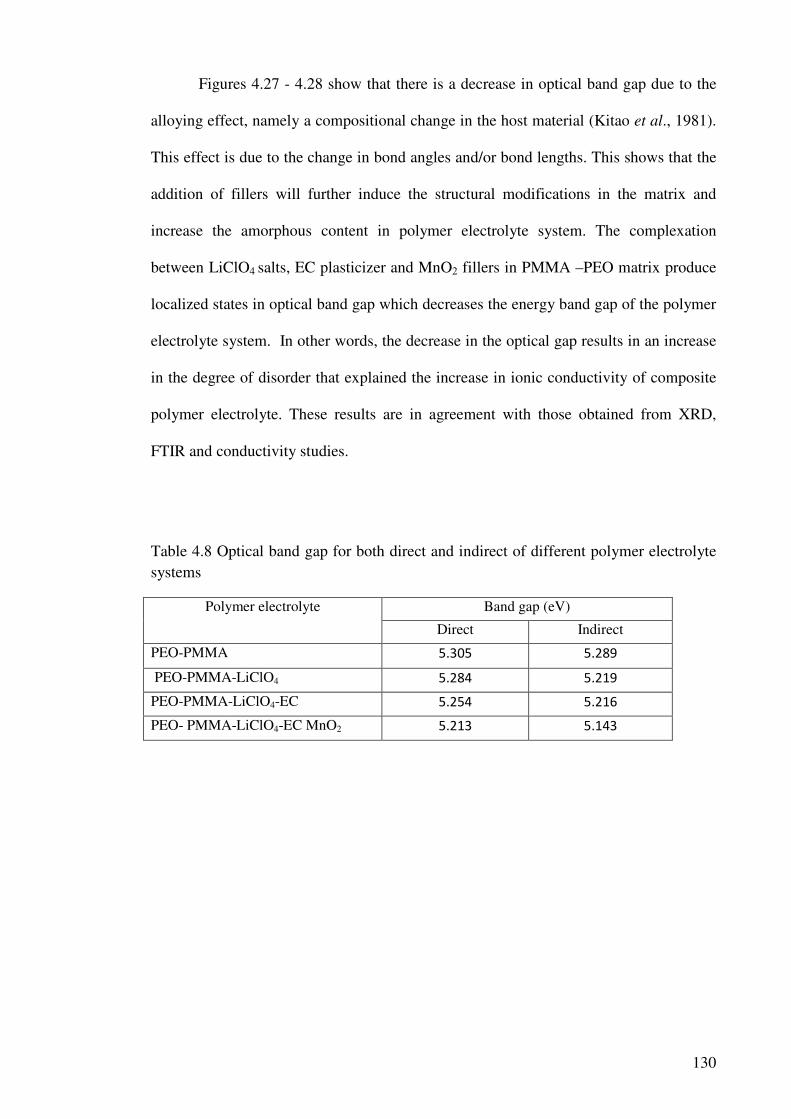
130
Figures 4.27 - 4.28 show that there is a decrease in optical band gap due to the
alloying effect, namely a compositional change in the host material (Kitao et al., 1981).
This effect is due to the change in bond angles and/or bond lengths. This shows that the
addition of fillers will further induce the structural modifications in the matrix and
increase the amorphous content in polymer electrolyte system. The complexation
between LiClO4 salts, EC plasticizer and MnO2 fillers in PMMA –PEO matrix produce
localized states in optical band gap which decreases the energy band gap of the polymer
electrolyte system. In other words, the decrease in the optical gap results in an increase
in the degree of disorder that explained the increase in ionic conductivity of composite
polymer electrolyte. These results are in agreement with those obtained from XRD,
FTIR and conductivity studies.
Table 4.8 Optical band gap for both direct and indirect of different polymer electrolyte systems
Polymer electrolyte Band gap (eV)
Direct Indirect
PEO-PMMA 5.305 5.289
PEO-PMMA-LiClO4 5.284 5.219
PEO-PMMA-LiClO4-EC 5.254 5.216
PEO- PMMA-LiClO4-EC MnO2 5.213 5.143
131
CHAPTER FIVE
CONCLUSION AND FUTURE RECOMMENDATIONS
In this work, PMMA, PEO, LiClO4, EC and MnO2 were mixed in appropriate amounts
to form film by the solution casting technique and subjected to a detailed structural
characterization, ionic conductivity studies and optical studies.
5.1 Conclusion
Mechanical milling of MnO2 powders produces homogenously sized nano-particles
with particle size range of 30 nm. High dispersion and narrow size distribution of
MnO2 nano-particles has been successfully prepared. TEM result justify the particles
size range.
The ionic conductivity of PMMA-PEO polymer blend was found to be 2.02 x
10-8 S cm-1. Upon addition of 12 wt% salt, the ionic conductivity was increased to 7.38
x 10-4 S cm -1. Further enhancement in the ionic conductivity of PMMA-PEO- LiClO4
system has been found on plasticization. The highest room temperature of conductivity
achieved for the PMMA-PEO- LiClO4 system with 25 wt% EC is 1.82 x 10⁻³ Scm-1. The
presence of the filler has shown the conductivity enhancement of the polymer
electrolyte where the addition of 5 wt% MnO2 slightly increases the conductivity up to
5.02 x 10⁻³ S cm-1 at room temperature.
132
The increase in conductivity can be attributed to:
(i) Increase amorphicity of the samples. This is reflected in the values of
percentage of crystallinity. Sample with more amorphous structure
exhibits higher conductivity.
(ii) Increase in the number of ions in the PMMA-PEO-LiClO4 system due to
dissociation of salt.
(iii) Platicization effect. Plasticizer increases the degree of salt dissociation
(or number of ions) and serves as a diffusion pathway for the lithium
ions. The plasticizer seems to play a catalytic role in dissociating the salt
and increasing the carrier concentration.
(iv) The ceramic particle acting as nucleation centers for the minute
crystallites. The ceramic filler aiding in the formation of disordered
phases in the polymer electrolyte. The addition of filler forms a new
kinetic path via polymer-ceramic boundaries.
(v) The temperature-dependent ionic conductivity plots of the electrolyte
films seem to obey the Arrhenius relationship at low temperature region
and VTF relationship at high temperature region.
The structure and complexation of the polymeric material in the electrolyte
system has been ascertained by the XRD, FESEM, and FTIR analysis. The XRD and
FTIR studies revealed that the optimum filler concentration provide large amount of
amorphous volume due to the complexation of components within the polymer
electrolyte system, which produced greater ionic diffusivity. The optical band gaps
results further proved that a composition of 80 wt% PMMA, 20 wt% PEO, 10 wt%
LiClO4, 20 wt% EC- 5 wt% MnO2 is the best candidate for electrochemical device
applications. Thermal studies which include DSC, TGA and DTG were carried out to

133
determine the thermal stability of the electrolyte system. It was found that the polymer
electrolyte system of 580 wt% PMMA, 20 wt% PEO, 10 wt% LiClO4, 20 wt% EC- 5 wt%
MnO2 possess Tg within the range of 50 – 60 oC were obtained.
5.2 Suggestion for future work
Work should be continued to enhance the conductivity of the electrolyte to as high as
10-3 or 10-2 S cm -1 since electrolytes synthesized based on nanocomposite polymers
show superior properties as compared to conventional polymer electrolytes. This may
be achieve by:
(i) Introducing a second or third plasticizer. Using a combination of suitable
plasticizer to help dissociate the ions and low viscosity to increase
mobility of system.
(ii) Future studies should be emphasize on the battery fabrication because
the polymer electrolyte systems studied in this research are quite
promising and possess the potential of substituting the liquid electrolyte
in batteries.
(iii) Trapping the liquid organic electrolyte solution in an appropriate
polymer matrix to form the so called hybrid polymer electrolytes

134
References
Abraham K. M., Alamgir M. Solid State Ionics, 311, 70 (1994)
Ajji, A., Polymer Engineering & Science, 35, 64 (1995)
Ali, A. M. M., Yahya M. Z. A., Bahron H., Subban R. H.Y., Harun, M. K., Materials
Letters. 61, 2026 (2006)
Albinsson I., Mellander E. & Stevens J.R.. Journal of Chemical Physics, 96, 681 (1992)
Alias Y., Ling I., Kumatha K., Ionics, 11, 472 (2006)
Allen N. S., Ortega A., Sandoval G., Liau C. M., Polymer, 85, 927 (2004)
Althues H, Henle J, Kaskel S. Chemical Society, 36, 145 (2007)
Armand M. B., Chabagno J. M., Duclot M., Ionics, 12, 131 (1979)
Armand. M. Solid State Ionics, 69, 309 (1994)
Ashcroft A. T., Cheetham A. K., Harris P. J. F., Jones R.H., Natarajan S., Sankar G.,
Stedman N. J., Thomas J .M. Catalysis Letters, 24, 47 (1994)
Bergman R., Brodin A., Engberg D., Lu Q., Angell C.A. and Torell L.M. Electrochiia
Acta 40, 2049 (1995)
Bohnke O, Frand G, Resrazi M, Rousselet C. and Truche C., Solid State Ionics, 66, 97
(1993)
Bruce P. G., Electrochimica Acta, 40, 207 (1995)
Brummer S. B., Koch V. R., Materials for Advanced Batteries, 78, 128 (1978)

135
Brus L. E. Journal of Chemical Physics, 80, 440 (1984)
Capiglia C., Mustarelli P., Quartarone E., Tomasi C., Magistri A., Solid State Ionics,
118, 73 (1999)
Caseri W., Chemiacl Engineerig Communication, 196, 549 (2009)
Caseri W. Macromolecular Rapid Communication, 21, 70522 (2000)
Chandra S., Sekhon S. S., Arora N. Ionics, 6, 112 (2000)
Colomban P. J. Physics and Chemical of Solid, 45, 981 (1984)
Cohen M.H., & Turnball D., Journal of Chemical Physics, 31, 1164 (1959)
Cosaert K., Eeeckhout E., Goethals E, Prez FD, Guegan P, Cheradame H., Polymer, 51,
1231 (2002)
Croce F., Persi L., Scrosati B. Solid State Ionics, 69, 320 (2001)
Davis D.S., Shalliday T.S., Physical Review Letters 118, 1020 (1960)
Dillip K. Pradha, Samantaray B. K., Choudhary R. N. P., Karan N. K., Reji Thomas,
Ionics 17, 127 (2011)
Fenton, D. E. Parker, J. M. & Wright, Polymer, 14, 589 (1973).
Forsyth M., MacFarlane D.R., Best A., Adebahr J., Jacobsson P., Hill A.J., Solid State
Ionics 147, 203 (2002)
KatiyarDickerson R.R., Kondragunta S., Stenchikov G., Civerolo K.L., Doddridge B.G.,
Holben B.N. Science, 278, 82730 (1997)

136
Elliott W. Report No 1, Contract NAS 3-6015 (1964)
Ericson H, Svanberg C, Brodin A, Grillone A M, Panero S & Scrosati B Electrochimica
Acta 45, 1409 (2000)
Fan L., Dang Z., Nan C.W., Electrochimica Acta, 48, 205 (2002)
Faubl H., Quinn M.H. Internationl Contact Lens Clinic, 27, 6574 (2000)
Fenton D.E., Parker J.M., Wright P.V., Polymer, 14, 589 (1973)
Feuillade G., Perche P. J. Appl. Electrochimica 5, 63 (1975)
Fonseca C.P., Cezare T.T., Neves S. J. Power Sources, 112, 395 (2002)
Fontenella J.J., Wintergill M.C., Calame J.P. , Andeen C.G., Solid State Ionics, 8, 333
(1983)
Gray F.M., Polymer electrolytes, Advance Material, Weinheim, Germany (1997)
Gray F.M. Fundamentals and Technological Applications, Advance Material,
Weinheim, Germany (1991)
Harold, G., John, W., Eldridge, M. The Definitive Processing Guide and Handbook,
New Jersey (2005)
Hashimi, S.A., Thakur, A.K., Upadhyaya, H.M., European Polymer Journal, 34, 1227
(1998)
Havriliak S. and Negami S. Polymer, 8, 161 (1967)
Heffels W, Friedrich J, Darribe`re C, Teisen J, Interewicz K, Bastiaansen C, Polymer, 2,
14356 (1997)
137
H.M.J.C. Pitawala, M.A.K.L. Dissanayake , V.A. Seneviratne. Solid State Ionics. 178,
885 (2007)
Huang X.D., Goh S.H., Polymer, 43, 583 (2000)
Hui Yang, Xiao-Dong Shen, Journal of Power Sources, 67, 515 (2007)
Hung C.H., Whang W.T. Journal of Material Science, 15, 26774 (2005)
Jayathilaka P.A.R.D., Dissanayake M.A.K.L., Albinsson I., Mellander B.E.,
Electrochimica. Acta, 47, 3257 (2002)
Julien C.M. Solid State Ionics, 177, 11 (2006)
Kerr J.B., Han Y.B., Liu G., Reeder C., Xie J., Sun X., Electrochimica Acta, 50, 234
(2004)
Kim D.W., Kim Y.R,. J.K. Park, Moon S.I. Solid State Ionics, 106, 329 (1998)
Kim D.W., Noh K.A., Min H.S., Kang D.W., Sun Y.K., Solid State, 5, 63 (2002)
Kim H.S., Shin J.H., Moon S.I., Kim S.P., Electrochimica Acta, 48, 1573 (2003)
Kim K.T., Kim K.B., Kim S.W., Park J.K., Electrochimica Acta, 45, 4001 (2000)
Kitao M., Akao H., Ishikawa T., Yamada S. Physica Status Solidi (a). 64, 493 (1981).
Kumar B., Scanlon L.G., Spry R.J. Journal of Power Sources, 96, 337 (2001)
Lanfredi S., Saia P.S. & Lebullenger R. Solid State Ion, 146, 329 (2002)
Lee, L. H., Park, J. K. & Kim ,Journal of Polymer Science, 34, 1427 (1996).
Leo C.J., Rao G.V.S., Chowdari B.V.R.. Solid State Ionics, 148, 159 (2002)

138
LEO Preparation and Characterization of Solid Polymer Electrolyte System, Thesis,
University of Malaya (2005)
Leo C.J., Subba Rao G.V. & Chowdari B.V.R. Solid State Ionics, 148, 159 (2002)
Li Z. H., Zhang H. P., Zhang P., The Journal of Applied Electrochemistry, 38, 109
(2004)
Linford R.G., Scrosati B., Applications of Electroactive Polymers, London (1993)
MacCallum, J.R., Smith M.J., Vincent C.A. Solid State Ionics, 11, 307 (1984)
MacCallum J.R. & Vincent C.A., Polymer Electrolyte Review 1, Elsevier, London
(1987)
Macdonald J R, Impedance spectroscopy, Emphasizing Solid Materials and Systems.
Wiley, New York (1987)
Mano V., Felisberti, M.I., Paoli, Maromolecules, 30, 3026 (1997)
Martinez-Pardo, Cardoso J., Vazquez H. & Aquilar M., Nuclear Instrument and
Method, 140, 325 (1998)
Mastragostino, M., Soavi, F., Zanelli, A., Journal of Power Sources, 81, 72 (1995)
Masui T, Yamamoto M, Sakata T, Mori H, Adachi G., Journal of Material Chemistry,
10, 3537 (2000)
Mathis U., Kaegi R., Mohr M., Zenobi R., Atmospheric Environment, 38, 4347 (2004)
Meneghetti, P., Qutubbuddin, S., Webber A. Electrochimica Acta, 49, 4923 (2004)

139
Michael M.S., Jacob M.M.E., Prabaharan S.R.S., Radhakrishna S. Solid State Ionics, 98,
167 (1997)
Mishra S., Perumal G.B., Naik J.B. Polymer-plastics Technology and Engineering, 36.
489 (1997)
Mohamed N.S., Subban R.H.Y., Arof A.K., Journal of Power Sources, 56, 153 (1995)
Mohd Rafie Johan, Oon Hooi Shy, Suriani Ibrahim,Siti Mariah Mohd Yassin, Tay Yin
Hui, Solid State Ionics, 196, 41 (2011)
Monroe C., Matsukevich D. N., Maunz P., Moehring D. L., Olmschenk S., Physical
Review Letters , 100, 150404 (2008)
Morishita K, Takarada T. Journal of Materials Science. 34, 1169 (1999).
Nan C. E. W., Fan L., Lin Y., and Cai Q., Physical Review Letters, 91, 2661041 (2003)
Osada Y., Kajiwara K., Gels handbook, San Diego (1995)
Othman, L., Chew, K.W., Osman, Z., Ionics, 10, 1007 (2007)
Osman Z., Arof A.K., Electrochimica Acta. 48, 993 (2003)
Owen J., Booth C., Price C., Editors Comprehensive polymer science, Pergamon Press,
Oxford, 2, 669 (1989)
Perpechko, Low Temperature Properties of Polymers, MIR Publishers, Moscow (1997)
Periasamy P., Tatsumi K., Shikano M., Fujieda T., Saito T., Mizuhata M., Kajinami A.,
Deki S., Journal of Power Sources, 88, 269 (2000)

140
Puri B.R., Sharma L.R., Panthania M.S. Principles of Physical Chemistry, Prentice Hall,
3 (1998)
Qian X., Gu N., Cheng Z., Yang X., Wang E., and Dong S., Materials Chemistry and
Physics, 74, 98 , (2002)
Ramesh S., Arof A. K., Science Engineering, 85, 11 (2001)
Rajendra S., Mahalingam T., Kanna R., Solid State Ionic,130, 143 (2000)
Rajendran S., Sivakumar M., Subadevi, Materials Letters, 58, 641 (2004)
Ratner M.A., Polymer Electrolytes Review, 23, 173 (1987)
Reddy M.J., Chu P.P., Journal of Power Sources, 135, 1 (2004)
Ressy V.S., Zhu Q.Y., Miang L.Q., Solid State Electrochemistry, 11, 542 (2007)
Rhoo H.J., Kim H.T., Park J.K., Hwang T.S., Eletrochimica Acta, 42, 1571 (1997)
Rhoo H.J., Kim H.T., Park J.K., Hwang T.S.. Electrochimca Acta, 42, 1571 (1997)
Ries G, Heller W, Puchta H, Sandermann H, Seidlitz HK, Hohn B. Nature, 406, 98101
(2000)
Sekhon S. S., Singh H. P. Solid State Ionics, 152, 167 (2002)
Sekhon S. S., Pradeep, Agnihotry S. A. Solid State Ionics, 24, 217 (1998)
Shriver D.F., Bruce P.G. Solid state electrochemistry, 21, 95 (1995)
Sim L.H., Gan S.N., Chan C.H., Yahya R. Spectrochimica Acta Part A: Molecular and
Biomolecular Spectroscopy, 76, 287 (2010)

141
Singh, Nilam Singh & K.P. Singh, Bulletin of Material Science, 28, 599 (2005)
Song J. J.,Wang Y. Y. ,Wan C. C. , Journal of Power Sources, 77, 183 (1999)
Song L., Chen Y., Evans J.W., Journal of Electrochemical Society, 144, 3797 (1997)
Sperling L.H., Introduction to Physical Polymer Science, Wiley, New York (1993)
Stephan A.M., Kataoka H.,Saito Y., Macromolecules 34, 695 (2001)
Stephan A.M., Kumar T.P., Karan R.T., Renganathan N.G., Pitchumani S., Muniyandi
N., Journal of Power Sources, 83, 80(2004)
Stephan A.M., Renganathan N.G., Gopukumar S., Chemistry Physics, 85, 6 (2004)
Surinder Singh, Nuclear Instrument and Method, 244, 252 (2006)
Tambelli C.C., Bloise A.C., Rosario A.V., Magon C.J., Donoso J.P. Electrochimica
Acta, 47, 1677 (2002)
Tarascon J.M., Gozdz A.S., Schmutz C., Chmutz F., Shokoohi F., Warren P.C., Solid
State Ionics,49, 86 (1996)
Thutupalli G.M., Tomlin S.G., Applied Physics, 9, 1639 (1976)
Uma T., Mahailngam T., Stimming U., Material Chemistry Physics, 85, 131 (2004)
Umadevi C., Sharma A.K. & Rao V.V.R.N. Journal of Material Letter, 56, 167 (2002)
Watanabe M., Ogata N., Polymer Electrolyte Review (1987)
Wright P.V. & Lee C.C. Polymer , 23, 681 (1982)

142
Wu X. Novel Polymer Electrolyte for Lithium Rechargeable Battery, PhD Thesis, NUS
(1999)
Xiong M, Gu G, You B, Wu L. Journal of Applied Polymer Science, 90, 192331 (2003)
Yahya Al-Ramadin, Optical Material, 14, 287 (2000)
Yuwono A.H., Liu B., Xue J., Wang J., Elim H.I., Ji W., Journal of Materials
Chemistry 14, 297 (2004)
Zhang J, Luo S, Gui L. Journal of Materials Science, 32, 146972 (1997)
Zheng J, Siegel R.W., Toney C.G., Journal of Polymer Science Polymer Physics, 41,
103350 (2003)

143
Appendix