original paper compositional, structural and vibrational ... · alkali basalts of the ssvf were...
TRANSCRIPT
www.jgeosci.org
Journal of Geosciences, 63 (2018), 215–226 DOI: 10.3190/jgeosci.266
Original paper
Compositional, structural and vibrational spectroscopic characteristics of feldspar megacrysts in alkali basalts from southern Slovakia
Monika huraIOvá1, Christian L. LENGauEr2, rainer abart3, vratislav huraI4*
1 Comenius University, Department of Mineralogy and Petrology, Ilkovičova 6, 842 15 Bratislava, Slovakia2 University of Vienna, Institute for Mineralogy and Crystallography, Althanstrasse 14 (UZA II), 1090 Vienna, Austria3 University of Vienna, Department of Lithospheric Research, Althanstrasse 14 (UZA II), 1090 Vienna, Austria4 Slovak Academy of Sciences, Institute of Earth Sciences, Dúbravská cesta 9, 840 05 Bratislava, Slovakia; [email protected]* Corresponding author
Feldspar megacrysts in Late Miocene–Pliocene maars, diatremes and basaltic lava flows in the northern part of the Pannonian Basin span the compositional range from Nasanidine, through anorthoclase to oligoclase and andesine. Newly formed An82 plagioclase (bytownite) crystallized within composite melt inclusions hosted by the oligoclase. Powder Xray diffraction data indicate strong structural disorder diagnostic of the high albite–high sanidine series typical of magmatic feldspars. The magmatic origin is also corroborated by chemical compositions, which plot along the 700 ± 50 °C solvus, with the exception of the most sodic Ab79 plagioclase megacryst projecting along the 600 °C isotherm. Vibrational spectroscopic records document that the basic groups of magmatic feldspars can be identified by the specific pattern of the group I and IV bands in the 350–600 cm–1 range. The IVa band at 560–570 cm–1 is diagnostic for triclinic feldspars. The anorthite and orthoclase contents can be inferred from the 506–515 cm–1 (Ia) and 473–486 cm–1 (Ib) peak separation values combined with the Ia bandwidth.
Keywords: feldspar, megacryst, alkali basalt, Pannonian Basin, Slovakia, Western CarpathiansReceived: 4 January 2018; accepted: 15 August 2018; handling editor: R. Skála
There are several studies focused on the Raman spectral characteristics of feldspargroup minerals (e.g., Mernagh 1991; Bendel and Schmidt 2008; Freeman et al. 2008; Bersani et al. 2018). However, comparison of results and identification of feldspar with lowresolution portable and field spectrometers are still hindered by the varying degree of accuracy, random sample orientation and the need for a precisely calibrated spectrometer. Here we demonstrate that the compositional and structural characteristics of magmatic feldspars can be inferred solely from a Raman spectral record obtained without a precisely calibrated highresolution spectrometer and special sample preparation.
2. Geological setting
The Late Miocene–Pleistocene SouthSlovakian Volcanic Field (SSVF) extends over an area of ~300 km2 along the Hungarian–Slovakian border. The SSVF belongs to the alkali basalt volcanic province of the intraCarpathian backarc basin (Pannonian Basin), which is interpreted to result from a withinplate, postcollisional volcanic activity triggered by the decompression melting of depleted asthenosphere (Dobosi
1. Introduction
Feldspar megacrysts up to 12 cm in size occur in continental alkali basalts (e.g., Bahat 1979; Aspen et al. 1990; Upton et al. 1999, 2009). Their compositions comprise sanidine, anorthoclase, potassic oligoclase and albite (Chapman 1976; Chapman and Powell 1976; Ulrych et al. 1998; Upton et al. 1999; Gernon et al. 2016), and typical orthoclase contents range between 10 and 30 mol. % (Aspen et al. 1990; Guo et al. 1992). A high degree of disorder and structural states corresponding to the high albite–high sanidine series (Kroll and Ribbe 1983) are diagnostic of a magmatic origin (Hoffer and Hoffer 1973; Chapman 1976).
This paper provides first information on alkali feldspar and plagioclase megacrysts from Late Miocene–Pleistocene maars, diatremes, and lava flows in the northern promontory of the Pannonian Basin. The investigated feldspars represent a unique set of rapidly quenched and chemically homogeneous minerals devoid of exsolutions, which had not undergone lowtemperature reequilibration and hydrothermal alteration. As such they are particularly suitable for a Raman spectrometric study supplemented by powder Xray diffraction (XRD) and electronprobe microanalysis (EPMA).

Monika Huraiová, Christian L. Lengauer, Rainer Abart, Vratislav Hurai
216
et al. 1995; Downes and Vaselli 1995; Konečný et al. 1995, 2002; Pécskay et al. 2006). In the SSVF, spatially isolated monogenetic volcanoes originated due to postrift thermal subsidence superimposed on a Miocene, Alpinetype subduction accompanying the collision of the ALCAPA and Tisia microplates with the European Plate (Konečný et al. 2002; Seghedi et al. 2004). The alkali basalts of the SSVF were formed in the time interval between 8 and 0.2 Ma (Konečný et al. 1995, 1999; Vass et al. 2007) and they cover the compositional range from basanite to phonotephrite.
Feldspar fragments (Fig. 1a) rarely occur in coarse friable tuffs of the maar exposed 1.3 km SW from Gemer-ské Dechtáre village (48°14'6.41"N, 20°1'35.42"E). The megacryst assemblage also includes kaersutite and spinel. Apatite recovered from welded basaltic tuff yielded a (U–Th–Sm)/He age of 3.1 ± 0.2 Ma, whereas zircons from the same tuff layer provided a U–Pb age of 3.19 ± 0.03 Ma (Hurai et al. 2013a).
The Hajnáčka diatreme (48°13'5.25"N, 19°57'18.59"E) is a relic feeder conduit of an uplifted and eroded maar crosscutting Lower Miocene sediments. The diatreme has been assigned to the Early Romanian, third volcanic phase (Konečný et al. 1999) based on the 2.7 ± 0.5 Ma K–Ar wholerock age of an intersecting basalt dike (Vass et al. 2007). The (U–Th–Sm)/He method applied to apatite recovered from basaltic tuff in contact with the basalt dike yielded an age of 2.1 ± 0.2 Ma (Hurai et al. 2013a). Exceptionally large feldspar megacrysts with a diameter of up to 8 cm (Fig. 1b) occur in palagonitized tuff breccia with scoria and basalt fragments, where they are associated with syenite, carbonatized syenite, and carbonatite xenoliths (Hurai et al. 2013b). The mega
cryst assemblage in this locality is complemented by rare amphibole (kaersutite).
A coarsegrained palagonite tuff in a subsided block of the maar infill within the upper part of the diatreme exposed in the eastern part of Šurice village (48°13'34.01"N, 19°54'45.56"E) contains abundant feldspar and nepheline fragments, up to 1 cm in size. Radiometric data are missing, but the diatreme was assigned to the 3rd volcanic phase based on indirect geological criteria (Konečný et al. 1999).
One plagioclase megacryst, 2 cm in diameter, was also found in the basaltic lava flow near Mašková village (48°19'13.19"N, 19°34'24.74"E) dated at 7.15 ± 0.23 Ma using the K–Ar method (Kantor and Wiegerová 1981). The lava composition corresponds to a nephelinenormative tephrite, with an increased CO2 content (5.9 wt. %) reflecting the presence of numerous carbonated pyroxenite xenoliths (Hurai et al. 2007). The megacryst assemblage also includes kaersutite crystals, up to 8 cm in size.
3. Methods
A total of nine optically homogeneous crystals devoid of impurities and 2–5 cm in size have been selected for XRD, EPMA and Raman study. The investigated crystals are angular to oval, without discernible crystal facets, with typical cleavage parallel to the (001) and (010) planes. Mineral or melt inclusions are missing, except for the plagioclase HA1 from the Hajnáčka diatreme, which hosts composite melt inclusions with newly formed Caplagioclase crystals (Hurai et al. 2011).
a b5 cm3 cm
Fig. 1 Examples of megacrysts in alkali basalts from southern Slovakia. a – Sanidine in a basalt bomb extracted from welded lapilli tuff of the Gemerské Dechtáre maar, sample GD1. b – Cataclased feldspar megacryst (not included in this study) in the palagonite tuff breccia of the Hajnáčka diatreme.

Feldspar megacrysts in alkali basalts, Slovakia
217
3.1. Electron-microprobe microanalysis
Chemical compositions were studied using a CAMECA SX100 electron microprobe (Geological Survey of Slovakia, Bratislava, and University of Vienna, Austria). The following excitation lines and standard materials have been used (firstorder element lines in parentheses): albite – Na (Kα), orthoclase – Si (Kα), K (Kα), Al2O3 – Al (Kα), forsterite – Mg (Kα), wollastonite – Ca (Kα), SrTiO3 – Sr (Lα), barite – Ba (Lα), fayalite – Fe (Kα). An accelerating voltage of 15 kV, 20 nA beam current and 5 µm beam diameter were used to optimize the spatial resolution, matrix correction factors and to minimize surface damage and loss of alkalis. Matrix effects were resolved using the X–φ correction method (Merlet 1992). Detection limits were as follows (ppm, varied slightly for each analysis): Na – 360 ± 20, Si – 225 ± 10, K – 180 ± 10, Al – 230 ± 15, Mg – 260 ± 20, Ca – 190 ± 10, Sr – 480 ± 20, Ba – 410 ± 20, Fe – 215 ± 10. Standard deviations (±1σ) varied between 0.02 and 0.34 wt. %.
Empirical formulae and endmember mole fractions were recalculated based on 8 oxygen atoms per formula unit. Miscibility limits (solvi) were computed using the SolvCalc program (Wen and Nekvasil 1994) and the thermodynamic model of Benisek et al. (2010).
3.2. raman spectroscopy
A confocal Xplora Raman spectrometer from Horiba Ltd. (Institute of Earth Sciences, Bratislava) was used for measurement of vibration modes of the feldspar megacrysts. The system includes a flatfield 20 cm spectrograph with a multichannel aircooled (–70 °C) Syncerity CCD detector (256 pixels) and color camera optically coupled to an Olympus BX51 microscope. Raman spectra were collected with a 100× longworkingdistance (3.4 mm) objective lens (numerical aperture NA = 0.8) and 532 nm excitation wavelength of a 25 mW solidstate NdYAG laser. A set of bandpass and edge filters were used to collect
scattered light in the 50–1200 cm–1 region. The holographic grating with 1800 grooves/mm combined with 50 µm entrance slit enabled a maximum spectral resolution of 3.5 cm–1 using the 532 nm excitation wavelength. The wavelength calibration was accomplished with a neon light source and the principal vibrational band of silicon (520.7 cm–1). The spectral acquisition was controlled using the LabSpec6 software. Spectra of feldspar grains were scanned in realtimedisplay mode at various positions using rotatable stage and then representative spectra have been recorded using the 1800 gr/mm spectrometer grating and 50 s acquisition time. Background correction, filtering, and peak fitting operations with mixed GaussLorentz functions have been performed using the routines implemented in the LabSpec5 software.
3.3. Powder X-ray diffraction
Powder XRD analyses were obtained using a Bruker D8Advance Eco Xray diffractometer system (University of Vienna, Austria), equipped with a CuKαoptimized LynxEye XET positionsensitive detector with an angular opening of 3.29° 2θ, primary Nifilter, fixed divergence slit (FDS = 0.3°), 2.5° Soller slits for primary and secondary beam path, and a fixed antiscatter knife edge improved by an inhouse variable scatter screen. Diffrac
AnAb
Or+Cn
miscibility gap
50
mol. %
50 mol. %50 mol. %
600 °C800 °C
MS-1HA-1 by
HA-1
SU-13-1
GD-1
HA-2
HA-3
HA-13-6
HA-13-8
HA-13-5HA-13-7
Fig. 2 Endmember mole percentages in feldspar megacrysts from southern Slovakia. The dashed curves show the miscibility limits (solvi) for 600, 700, 800 °C isotherms and 5 kbar.

Monika Huraiová, Christian L. Lengauer, Rainer Abart, Vratislav Hurai
218
tion data in the range of 10–75° 2θ have been collected with a 0.02° 2θ step size and counting time of 1 s/step. Qualitative data treatment based on indexing (Coelho 2003), whole XRD pattern decomposition (Pawley 1981) and structure refinement (Rietveld 1969) was done with the program TOPAS (Bruker 2014).
4. Results
4.1. Electron-probe microanalysis
The compositions of the feldspar megacrysts (Tab. 1, Fig. 2) cover the range from andesine (MS1) through oligoclase (HA1, HA137) and anorthoclase (HA3, HA135, HA138) to sanidine (GD1, HA2, HA136, SU131). Sample HA2 is most enriched in BaO and SrO up to 3.7 and 0.5 wt. %, respectively. Sample HA1 contains composite carbonate–phosphate–silicate melt inclusions with newlyformed Caplagioclase crystals corresponding to bytownite (An82Ab17Or+Cn1).
Lamellar, exsolutionresembling precipitates have been observed in the anorthoclase megacryst HA135.
The precipitates can be classified as antiperthite owing to increased orthoclase (Or) and celsian (Cs) contents compared to the host crystal. The average composition of the precipitates corresponds to Ab68Or20An7Cn4.
4.2. Powder X-ray diffraction
The calculated unitcell and structural state parameters of the investigated megacrysts (Tab. 2) are consistent with the monoclinic highsanidine to triclinic highalbite series (Kroll and Ribbe 1983), with t1(o) + t1(m) values ranging between 0.53 and 0.61 (Fig. 3).
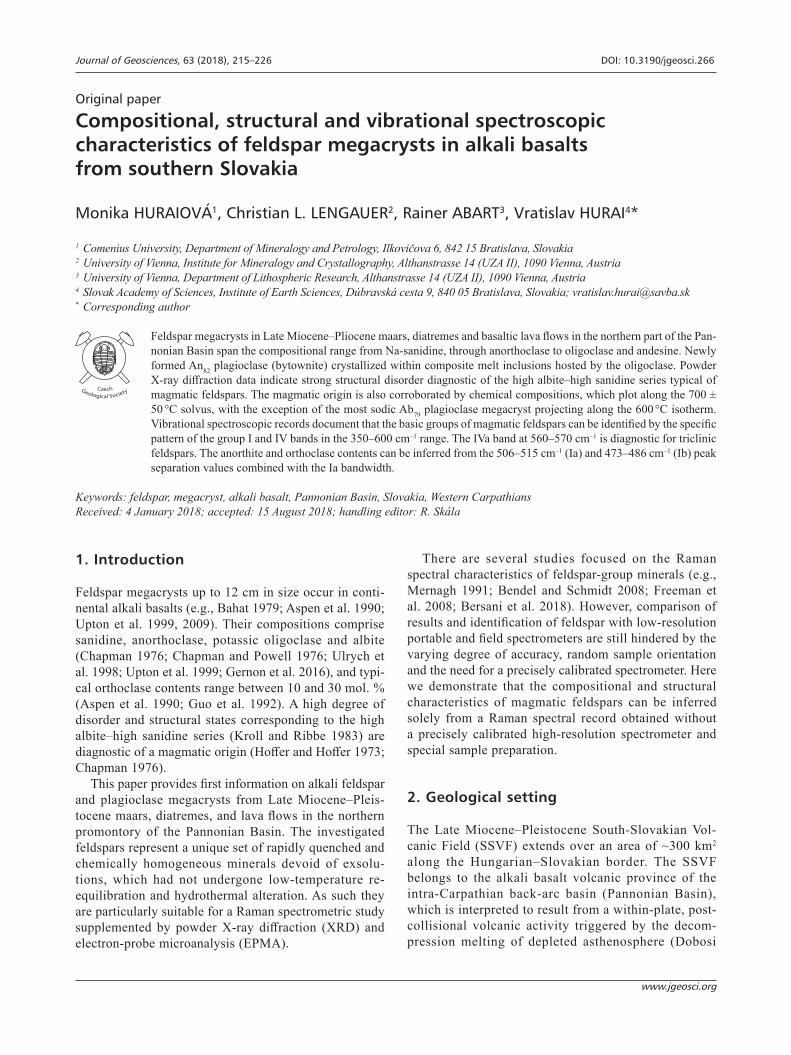
4.3. raman spectrometry
Representative Raman spectra of feldspar megacrysts are shown in Figs 4 and 5, and parameters of the Iac and IVa bands are listed in Tab. 3. In general, the vibrational spectra of feldspars are characterized by two dominant group I bands at ~510 ± 3 cm–1 (Ia) and ~468 ± 2 (Ib) interpreted as breathing modes of fourmembered tetrahedral rings. The minor latticevibration groups II and III
Tab. 1 Average electronprobe microanalyses (in wt. %), empirical formulae (in apfu), and calculated endmember mole percentages of feldspar megacrysts from Gemerské Dechtáre (GD), Hajnáčka (HA), Šurice (SU) and Mašková (MS)
Sample GD1 HA2 HA136 SU131 HA138 HA3 HA135 HA137 HA1 MS1 HA1 by
Mineral sanidine sanidine sanidine sanidine anorthoclase anortho/ oligoclase
anortho/ oligoclase oligoclase oligoclase andesine bytownite
N* 2 8 25 26 19 7 30 20 17 1 2SiO2 65.22 62.11 64.31 65.72 64.59 64.56 63.75 62.52 60.81 59.15 46.80Al2O3 19.39 21.37 19.40 19.03 21.00 21.51 21.93 22.70 23.96 25.72 33.51FeO 0.08 0.10 0.08 0.04 0.13 0.07 0.13 0.14 0.17 0.26 0.07MgO bdl bdl 0.01 0.01 0.01 bdl 0.02 0.02 bdl 0.01 0.01CaO 0.51 0.56 0.38 0.17 1.80 2.34 2.69 3.36 4.81 7.63 16.12SrO 0.05 0.53 0.19 0.00 0.19 0.03 0.59 0.97 1.10 na 1.88BaO 0.64 3.57 1.79 0.05 0.77 0.04 0.67 0.64 0.38 na 0.12Na2O 4.87 5.21 5.21 4.11 7.62 9.09 8.44 8.18 7.70 6.73 1.80K2O 9.09 7.25 8.29 10.98 3.86 1.75 1.79 1.43 0.97 0.54 0.12Σ oxides 99.85 100.39 99.66 100.10 99.97 99.32 100.01 99.95 99.90 100.03 100.44Al 1.038 1.159 1.048 1.017 1.108 1.138 1.153 1.198 1.267 1.354 1.824Si 2.962 2.857 2.947 2.982 2.892 2.866 2.845 2.800 2.729 2.642 2.162Fe3+ 0.003 0.036 0.003 0.001 0.004 0.002 0.004 0.005 0.006 0.010 0.002Mg 0.001 0.001 0.001 0.001 0.001 0.000 0.000 0.001Ca 0.025 0.027 0.019 0.008 0.086 0.112 0.129 0.161 0.231 0.365 0.798Sr 0.001 0.005 0.005 0.000 0.005 0.000 0.015 0.025 0.029 0.050Ba 0.012 0.064 0.032 0.001 0.014 0.001 0.012 0.011 0.007 0.002Na 0.429 0.465 0.463 0.361 0.662 0.792 0.730 0.710 0.670 0.583 0.161K 0.527 0.425 0.485 0.636 0.221 0.097 0.102 0.082 0.056 0.031 0.007Σ cations 4.996 5.007 5.001 5.007 4.993 5.008 4.992 4.994 4.996 4.985 5.008Albite 43.1 ± 0.6 47.2 ± 1.6 46.2 ± 1.1 35.9 ± 1.2 67.0 ± 0.6 78.6 ± 0.2 75.9 ± 0.9 73.3 ± 0.6 69.5 ± 0.9 59.0 16.6 ± 1.2Anorthite 2.5 ± 0.0 2.8 ± 0.2 1.9 ± 0.2 0.8 ± 0.1 8.8 ± 0.4 11.2 ± 0.4 13.0 ± 0.8 16.7 ± 0.6 24.0 ± 0.7 37.0 82.2 ± 1.2Orthoclase 52.7 ± 0.7 43.0 ± 1.5 48.2 ± 1.1 63.0 ± 1.1 21.9 ± 0.8 9.9 ± 0.5 9.3 ± 1.0 7.9 ± 0.4 5.2 ± 0.3 3.1 0.5 ± 0.1Celsian 1.2 ± 0.0 6.5 ± 0.4 3.2 ± 0.4 0.1 ± 0.1 1.4 ± 0.2 0.0 ± 0.0 1.0 ± 0.2 1.2 ± 0.1 0.0 ± 0.0 0.2 ± 0.0KFeSi3O8 0.3 ± 0.0 0.4 ± 0.1 0.3 ± 0.1 0.1 ± 0.1 0.4 ± 0.1 0.2 ± 0.1 0.4 ± 0.1 0.5 ± 0.1 0.6 ± 0.1 0.9 0.2 ± 0.0*N – the number of analyses used for calculating the average composition, bdl – below detection limit

Feldspar megacrysts in alkali basalts, Slovakia
219
5. Discussion
Together with the newly formed An82 plagioclase crystallized from melt inclusions in the oligoclase megacryst HA1 (Hurai et al. 2011), the feldspars in the alkali ba
bands below 400 cm–1 reflect rotation–translation modes of the fourmembered rings and cageshears, respectively. The midtoweak group IV bands between 550 and 850 cm–1 are attributed to the tetrahedral deformations. The modes between 1000 and 1200 cm–1 are caused by the tetrahedral breathing (McKeown 2005; Freeman et al. 2008).
Structural disorder of the investigated megacrysts is indicated by the lower intensity of the Ib band compared to that of the Ia band, the negligible Ic band at 454–460 cm–1, the broadening of the group II band at 280 cm–1, and the generally smaller number of bands compared to ordered feldspars (Freeman et al. 2008; Makreski et al. 2009).
b (A)
7.1
7.2
12.9
t+ t
1(o)
1(m)
12.8 13.0
c(A
)
HA
HS
LA
LM
Monoclinic
Triclin
ic
endmember
plagioclase
sanidine
1.0
0.9
0.8
0.7
0.6
0.5MS-1
HA-1
GD-1
HA-2
Tab. 2 Unitcell dimensions, structural state parameters and selected XRD reflections of feldspar megacrysts from Gemerské Dechtáre (GD), Hajnáčka (HA), and Mašková (MS)
Sample GD1 HA2 HA136 HA138 HA3 HA135 HA137 HA1 MS1sanidine sanidine sanidine anorthoclase oligo/anorthoclase oligo/anorthoclase oligoclase oligoclase andesine
Space group C2/m C2/m C2/m C1̅ C1̅ C1̅ C1̅ C1̅ C1̅a (Å) 8.3993(5)* 8.3979(3) 8.4012(5) 8.2086(4) 8.2023(4) 8.2105(6) 8.2168(5) 8.1927(1) 8.1771(1)b (Å) 13.0076(4) 13.0102(2) 13.0124(3) 12.9096(4) 12.8990(5) 12.9105(8) 12.9131(6) 12.8966(1) 12.8779(2)c (Å) 7.1655(3) 7.1696(2) 7.1680(3) 7.1266(3) 7.1239(3) 7.1256(5) 7.1284(5) 7.1205(1) 7.1153(1)α (°) 90 90 90 92.928(4) 93.048(5) 92.918(3) 92.877(6) 93.136(1) 93.440(1)β (°) 116.128(3) 116.036(2) 116.083(3) 116.327(3) 116.370(3) 116.336(5) 116.317(4) 116.272(1) 116.261(1)γ (°) 90 90 90 90.319(4) 90.260(4) 90.304(6) 90.339(6) 90.25(1) 90.094(1)V (Å3) 702.88(6) 703.84(4) 703.81(5) 675.66(5) 674.00(5) 675.72(9) 676.77(8) 673.27(1) 670.39(2)tr[110] (Å) 7.7419 7.7426 7.7444 7.6299 7.6273 7.6317 7.6323 7.6243 7.6217tr[11̅0] (Å) 7.7419 7.7426 7.7444 7.6684 7.6587 7.6684 7.6733 7.6545 7.6330∆tr (Å) 0.0000 0.0000 0.0000 –0.0386 –0.0314 –0.0368 –0.0410 –0.0302 –0.0113t1(o)** 0.2769 0.2927 0.2802 0.2644 0.2798 0.2652 0.2601 0.2863 0.3307°2Θ CuKα
(2̅01) 21.46 21.43 21.43 21.85 21.87 21.84 21.84 21.93 21.97(131) 30.05 29.99 29.99 31.29 31.31 31.28 31.31 31.38 31.46(13̅1) – – – 29.57 29.57 29.58 29.57 29.60 29.59(06̅0) 41.66 41.61 41.61 42.14 42.14 42.13 42.14 42.12 42.20(2̅04) 50.98 51.04 51.05 51.27 51.28 51.27 51.28 51.39 51.48
*standard uncertainties in parentheses refer to the last decimal digit**calculated from V and tr[11̅0] after Kroll and Ribbe (1987)
Fig. 3 Plot of c against b for natural and synthetic feldspars using endmember projections as in Kroll and Ribbe (1983). Diagonal lines are contours of t1(o) + t1(m), showing complete order in the low albite (LA) – low microcline (LM) series, contrasting with the structural disorder in the high sanidine (HS) – high albite (HA) series. Open and solid diamonds refer to plagioclase and Kfeldspar megacrysts, respectively, from the SouthSlovakian Volcanic Field.

Monika Huraiová, Christian L. Lengauer, Rainer Abart, Vratislav Hurai
220
HA-1 bytownite
An Ab82 17
MS-1 andesine
Ab An Or59 37 3
HA-13-7 oligoclase
Ab An Or Cn73 17 8 1
HA-1 oligoclase
Ab An Or70 24 5
14
3
10
61
03
15
91
73
19
5
28
0
40
3
47
6
56
5
79
0
50
5
17
5
15
8 19
5
28
1
40
5 56
6
77
37
92
48
0
50
8
18
4
20
3
25
7
27
7
40
7 43
5
48
5
55
9
68
3
74
4 76
5
40
44
05
38
5 40
4
47
4
50
6
56
6
47
9
50
8
56
6
43
5
48
5
50
5
51
4
55
9
50
4
Re
lati
ve
in
ten
sit
y (
a.u
.)R
ela
tiv
e i
nte
nsit
y (
a.u
.)R
ela
tiv
e i
nte
nsit
y (
a.u
.)R
ela
tiv
e i
nte
nsit
y (
a.u
.)
Ia
Ia
Ia
Ib
Ib
Ib
IVa
IVa
IVa
100 200 300 400 500
Raman shift (cm )–1
Raman shift (cm )–1
600 700 800 350 400 450 500 550 600
10
4
17
31
87
27
4
40
0
47
1
50
2
56
2
63
3
76
57
83
56
1
50
2
39
9
47
1
IVa
Ia
Ib
Fig. 4 Representative Raman spectra of plagioclases from Hajnáčka (HA), and Mašková (MS) scanned in two directions. Spectra in the left column are backgroundcorrected and normalized to the equal intensity of the Ia band. The deconvoluted spectra of the group I and IV bands in the right column are smoothed and backgroundcorrected. Band positions are not corrected for the daily drift and they may differ from those listed in Tab. 3.

Feldspar megacrysts in alkali basalts, Slovakia
221
salts of the SSVF cover the entire composition range of megacrysts described so far from basaltic rocks, including continental alkali basalts and ultraphyric tholeiitic lavas with calcic plagioclase macrocrysts (e.g., Cullen et al. 1989; Hansen and Grönvold 2000).
The XRD data from the SSVF feldspar megacrysts are consistent with the structurally disordered high sanidine to high albite series as defined by Kroll and Ribbe (1983). Apart from the structural disorder preserved due to rapid quenching, the hightemperature origin of the feldspar megacrysts is corroborated by rare composite melt inclusions (Hurai et al. 2011) and chemical compositions projecting along the 700 ± 50 °C solvus (Fig. 2). The megacryst with the highest albite content (Ab79, sample HA3) plots below the 600 °C isotherm.
All these temperatures are relatively low if compared to those of basaltic magmas, indicating that the feldspar megacrysts are noncognate with the host basalt and they must represent a lower temperature–lower pressure fractionation products of more evolved alkalic melts. Two compositionally contrasting groups of feldspar megacrysts identified in the Hajnáčka diatreme, i.e. sanidine and oligoclase, do not plot along a single tieline connecting compositions of coexisting feldspars at identical temperatures and pressures despite using various Margules models included in the SolvCalc program (Wen and Nekvasil 1994). This indicates that the sanidine and oligoclase megacrysts crystallized either at various pressures or from compositionally different melts.
The characteristics of Raman spectra of feldspargroup minerals are useful for their field identification with low spectralresolution portable instruments or those onboard the Marsexploring rovers (Wang et al. 2003; Rull Pérez et al. 2017) that cannot be precisely calibrated due to large temperature fluctuations and mechanical vibrations. Although there have been numerous studies focused on the Raman spectra of feldspargroup
minerals, comparison of results is hindered by varying degrees of accuracy, different spectral resolutions and random orientation of investigated samples. Freeman et al. (2008) analyzed feldspars from terrestrial and lunar rocks and concluded that Raman spectra are insensitive to K and Na contents, although a total of four compositional and structural feldspar groups, i.e. highK alkali feldspars (microcline, orthoclase, sanidine), hightemperature plagioclases of intermediate composition, including ternary feldspars (Ab75–30), low and hightemperature albite (Ab > 85) and anorthite (An > 85) can be distinguished according to the position of the Ia band, which moves from 513 ± 1 cm–1 in alkali feldspars to 504.9 ± 0.1 cm–1 in anorthite. Bendel and Schmidt (2008) inferred that the bands located at 120–142 cm–1, 454–461 cm–1 (Ib) and 510–514 cm–1 (Ia) could be used to constrain the K/(Na + K) ratio in natural sanidine–anorthoclase series with an accuracy of ± 0.07. The K/(Na + K) ratio determination has been made using a precisely calibrated 80 cm spectrometer with a spectral dispersion better than 0.43 cm–1/pixel and a spectral resolution better than 1.5 cm–1.
Figures 4 and 5 document that calcic feldspar groups can be reliably identified according to the band pattern in the 350–600 cm–1 region recorded with a spectral resolution of ~3.5 cm–1 provided by a 20 cm Raman spectro meter. Sanidine differs from other feldspars by the missing IVa band between 560 and 570 cm–1, and by the clearly discernible Ic band at 458 ± 2 cm–1. Anorthoclase differs from sanidine by the IVa band at 572 ± 2 cm–1 discernible in feldspars with An > 9 mol. %, and by a substantially smaller Ic band compared to that in sanidine. The IVa band in synthetic Kfeldspars is believed to reflect the phase transition from the monoclinic structure of sanidine to the triclinic structure of anorthoclase (Bendel and Schmidt 2008). This interpretation is consistent with the unitcell parameters of SSVF anorthoclases, which plot within the field of triclinic feldspars (Fig. 3).
Tab. 3 Positions of Iac, and IVa bands, linewidths of the Ia band, and Ia–Ib separation values (RBS) in feldspar megacrysts from SouthSlovakian Volcanic Field
Sample Anorthite Orthoclase Band IVa Band Ia FWHMIa Band Ib Band Ic RBSIaIb
mol. % mol. % cm–1 cm–1 cm–1 cm–1 cm–1 cm–1
HA1 by 82.2 0.5 560(1) 506.4(5) 20(2) 485.7(5) 477(1) 21(1)MS1 37.0 3.1 566.6(9) 509(1) 18.7(2) 480(1) 468(5) 28.7(8)HA1 24.0 5.2 569.6(5) 510.8(3) 17.3(3) 479.7(3) 463(2) 31.6(3)HA137 16.7 7.9 571.4(3) 511.4(1) 16.6(4) 478.3(5) 460(1) 32.8(4)HA135 13.0 9.3 572.2(4) 511.3(5) 16.1(1) 477.4(6) 457(3) 34.0(8)HA3 11.2 9.9 572(2) 510.9(1) 16.0(1) 477.9(4) 458(1) 33.1(5)HA138 8.8 21.9 570(2) 512.5(4) 15.7(3) 475.5(1) 456(3) 38.0(7)HA2 2.8 43.0 – 514.6(1) 13.3(1) 474(1) 458(2) 40.7(9)HA136 1.9 48.2 – 515.5(5) 13.0(1) 473.7(2) 457(1) 41.7(1)GD1 2.5 52.7 – 514.4(1) 13.1(1) 473.7(8) 458(2) 40.9(8)SU131 0.8 63.0 – 514.8(2) 12.7(1) 473.8(9) 457(2) 41.2(9)standard deviations (1σ) in parentheses refer to last decimal digits, FWHM = full width at half maximum
Monika Huraiová, Christian L. Lengauer, Rainer Abart, Vratislav Hurai
222
HA-13-8 anorthoclase
Ab Or An67 22 9
HA-13-5 anorthoclase/oligoclase
Ab An Or76 13 9
SU-13-1 sanidine
Or Ab An63 36 1
GD-1 sanidine
Or Ab An Cn53 43 3 1
HA-2 sanidine
Ab Or Cn An47 43 7 3
13
31
27
16
21
79
28
3
40
1
47
1
51
3
14
0
19
4
28
02
84
40
3 57
0
47
6
50
9
17
2
12
51
23
15
61
71 28
1
39
7
45
54
69
51
0
14
7
16
9
19
8
28
5
40
3
46
04
73
51
5
28
0
40
1
47
2
51
0
56
8
16
6
39
93
99
45
9
47
3
51
4
40
2
45
9
47
6
51
0
57
0
40
13
97
45
5
47
0
51
0
45
8
47
4
51
5
47
3
51
0
56
8
100 200 300 400 500
Raman shift (cm )–1
Raman shift (cm )–1
Re
lati
ve
in
ten
sit
y (
a.u
.)R
ela
tiv
e i
nte
nsit
y (
a.u
.)R
ela
tiv
e i
nte
nsit
y (
a.u
.)R
ela
tiv
e i
nte
nsit
y (
a.u
.)R
ela
tiv
e i
nte
nsit
y (
a.u
.)
600 700 800 350 400 450 500 550 600
Ia
Ia
Ia
Ib
Ib
Ib
Ia
Ia
Ib
Ib
Ic
Ic
Ic
Ic
Ic
IVa
IVa
46
0

Feldspar megacrysts in alkali basalts, Slovakia
223
Plagioclases differ from ternary feldspars by a negligible Ic band, which is strongly overwhelmed by the dominant Ia band. Calcic plagioclases are also characterized by a unique moderatestrength band at 435 cm–1 that does not appear in the sodic and intermediate plagioclases. The Ia band at 506–512 cm–1 in calcic plagioclases is in fact a doublet with two components centered at ~506 and ~515 cm–1. Numerous midstrength group IV bands also appear between 680 and 770 cm–1 along with the intense group IVa band at 560–570 cm–1, the intensity of which increases with increasing anorthite content.
There are also some other trends discernible in the Raman spectra of the investigated feldspars (Tab. 3). The Ia band position increases from 506–507 cm–1 in bytownite, through 508–510 cm–1 in andesine, 511–513 cm–1 in oligoclase and ternary feldspars, to 514–516 cm–1 in sanidine. In contrast, the Ib band position shifts from ~486 cm–1 in bytownite to 474 cm–1 in Or43 sanidine and then remains essentially unchanged with increasing Or content. The Ia bandwidth (inferred by the deconvolution as a single band) also gradually decreases from 19–21 cm–1 in bytownite to 12.7 ± 0.1 cm–1 in Or63 sanidine. The position of the Ic band is fixed at 456–460 cm–1 in sanidines, ternary feldspars and plagioclases with An < 17 mol. % and then increases to 477 cm–1 in bytownite. Some of these trends are consistent with observations made by Mernagh (1991), Bendel and Schmidt (2008), Freeman et al. (2008) and Bersani et al. (2018).
The feldspar identification from absolute Raman band positions is impractical for portable or remotely controlled instruments that demand regular calibration to compensate for the laser frequency shifts due to temperature variations and mechanical vibrations. A difference between two peak positions seems to be more promising as it does not require the daily drift corrections. We have documented that the main feldspar groups can be distinguished merely from the spectral pattern in the 350–600 cm–1 region. However, more detailed discrimination can be made according to the peak separation value (RBS) that has the advantage of being insensitive to the temperaturedependent drift. The RBSIa–Ib value gradually increases from 20–22 cm–1 in bytownite to 40–43 cm–1 in sanidine (Fig. 6a). The Ia bandwidth and/or RBSIVaIa values can be used as supplementary parameters for the identification of feldspar.
The anorthite mole fractions (An) can be correlated with RBSIa–Ib (cm–1) using the following polynomial fit: An = 0.0017RBS2 – 0.144RBS + 3.07 (R2 = 0.9898) (Fig. 6a). An even better correlation coefficient (R2 = 0.993) has been obtained from the studied sample set for the relationship between the mole fraction of orthoclase (Or) and the RBS Ia–Ib using the exponential fit: Or = 0.000049e0.2243RBS. The linear correlation in the logarithmic scale allows the orthoclase contents to be inferred from the RBSIa–Ib outside the experimental range (Fig. 6b).
Raman data for the plagioclase dataset No. 1 (Bersani et al. 2018) show almost fixed RBSIa–Ib = 27 cm–1 for sodic plagioclases with An contents below 40 mol. % regardless of the anorthite content, being thus inconsistent with our trend. Data for magmatic feldspars published by Freeman et al. (2008) also display a wider scatter compared with our dataset, probably owing to a larger spectral resolution corresponding to 4–5 cm–1. Hence, more data on welldefined hightemperature feldspars would be needed to resolve these discrepancies.
6. Conclusions
1) The feldspar megacrysts from the SouthSlovakian Volcanic Field belong to the high albite–high sanidine series. They plot along the 700 ± 50 °C solvus, except for one megacryst with the highest Ab content (Ab79) that projects below the 600 °C isotherm. The inferred temperatures together with the strong structural disorder are diagnostic of magmatic feldspars, although the megacrysts are noncognate with the host basalt.
2) The main compositional groups of the magmatic feldspars can be discriminated using the Ia–Ib Raman band separation (RBSIa–Ib). The limiting values inferred from our dataset are as follows ( ± 1 cm–1): anorthite < 18, bytownite 18–22, labradorite 22–26, andesine 26–30, oligoclase 30–34, albite/anorthoclase 34–38, sanidine > 38. Absolute positions of the Ia and Ib bands and/or linewidths of the Ia band can be employed in the same way.
3) Triclinic feldspars can be distinguished from monoclinic ones by the presence of the IVa Raman band, the position of which changes from 570 to 560 cm–1 and intensity increases with an increasing anorthite content. However, quantitative determinations of the An content are hindered by the varying band intensity in different crystal orientations.
Acknowledgements. We thank the VEGA grant 1/0143/18 from the Slovak Grant Agency for financial support. Raman spectroscopic facility at the Slovak Academy of Sciences was also financed by the ERDFfunded project
Fig. 5 Representative Raman spectra of ternary feldspars and sanidine from Hajnáčka (HA), Gemerské Dechtáre (GD) and Šurice (SU) scanned in two directions. The spectra in the left column are backgroundcorrected and normalized to the equal intensity of the Ia band. The deconvoluted spectra of the group I and IV bands in the right column are smoothed and backgroundcorrected. The band positions are not corrected for the daily drift and they may differ from those listed in Tab. 3.

Monika Huraiová, Christian L. Lengauer, Rainer Abart, Vratislav Hurai
224
of the Centre of Excellence for Integrated Research on the Geosphere (ITMS26220120064). The XRD facilities at the University of Vienna were supported through
grant IP532017. The manuscript benefited from critical remarks of two anonymous reviewers and the handling editor (R. Skála).
15
0.0
0.1
0.2
0.3
0.4
0.5
0.6
0.7
0.8
0.9
1.0
20 25 30 35 40 45
RBS (cm )–1
An
orth
ite
(m
ole
fra
cti
on
)O
rth
ocla
se
(m
ole
fra
cti
on
)
HA-13-8
anorthoclase
sanidines
HA-1
bytownite
HA-13-7
oligoclase
HA-13-5
oligoclase/
anorthoclase
bytownite
labradorite
andesine
sanidine
oligoclase
anorthoclase
sanidine
plagioclases
albite/anorthoclase
anorthite
HA-3 oligoclase/
anorthoclase
HA-1
oligoclase
MS-1
andesine
polynomial
fit (R = 0.9898)2
exponential
fit (R = 0.9934)2
0.001
0.01
0.1
1
a)
b)
Fig. 6 Relationships between anorthite (a) and orthoclase contents (b), and the Raman Ia–Ib peak separation value (RBS) for feldspar megacrysts from alkali basalts of the SSVF. Horizontal error bars of the RBS correspond to 1σ uncertainty calculated from at least five Raman spectra obtained with variable grain orientations. Except for the HA1 bytownite, uncertainties (1σ) of the anorthite contents ( ± 0.008) are smaller than the vertical size of the graphical symbol used. Data from Freeman et al. (2008) – open squares, and Bersani et al. (2018) – open circles, are shown for comparison.

Feldspar megacrysts in alkali basalts, Slovakia
225
References
Aspen P, Upton BGJ, Dickin AP (1990) Anorthoclase, sanidine and associated megacrysts in Scottish alkali basalts: highpressure syenitic debris from upper mantle sources? Eur J Mineral 2: 503–517
Bahat D (1979) Anorthoclase megacrysts: physical conditions of formation. Mineral Mag 43: 287–291
Bendel V, Schmidt BC (2008) Raman spectroscopic characterization of disordered alkali feldspars along the join KAlSi3O8–NaAlSi3O8: application to natural sanidine and anorthoclase. Eur J Mineral 20: 1055–1065
Benisek A, Dachs E, Kroll H (2010) A ternary feldsparmixing model based on calorimetric data: development and application. Contrib Mineral Petrol 160: 327–337
Bersani D, Aliatis I, Tribaudino M, Mantovani L, Benisek A, Carpenter MA, Gatta GD, Lottici PP (2018) Plagioclase composition by Raman spectroscopy. J Raman Spectrosc 49: 684–698
Bruker (2014) DIFFRAC.SUITE TOPAS – version 5. Bruker AXS, Karlsruhe, Germany
Chapman NA (1976) Inclusions and megacrysts from undersaturated tuffs and basanites, East Fife, Scotland. J Petrol 17: 472–498
Chapman NA, Powell R (1976) Origin of anorthoclase megacrysts in alkali basalts. Contrib Mineral Petrol 58: 29–35
Coelho AA (2003) Indexing of powder diffraction patterns by iterative use of singular value decomposition. J Appl Crystallogr 36: 86–95
Cullen A, Vicenzi E, McBirney AR (1989) Plagioclaseultraphyric basalts of the Galapagos Archipelago. J Volcanol Geotherm Res 37: 325–337
Dobosi G, Fodor RV, Goldberg SA (1995) LateCenozoic alkalic basalt magmatism in Northern Hungary and Slovakia: petrology, source compositions and relationship to tectonics. Acta Vulcanol 7: 199–207
Downes H, Vaselli O (1995) The lithospheric mantle beneath the Carpathian–Pannonian Region: a review of trace element and isotopic evidence from ultramafic xenoliths. Acta Vulcanol 7: 219–229
Freeman JJ, Wang A, Kuebler KE, Jolliff BL, Haskin LA (2008) Characterization of natural feldspars by Raman spectroscopy for future planetary exploration. Canad Mineral 46: 1477–1500
Gernon TM, Upton BGJ, Ugra R, Yücel C, Taylor RN, Elliott H (2016) Complex subvolcanic magma plumbing system of an alkali basaltic maardiatreme volcano (Elie Ness, Fife, Scotland). Lithos 264: 70–85
Guo JF, Green TH, O´Reilly SY (1992) Ba partitioning and the origin of anorthoclase megacrysts in basaltic rocks. Mineral Mag 56: 101–107
Hansen H, Grönvold K (2000) Plagioclase ultraphyric basalts in Iceland: the mush of the rift. J Volcanol Geotherm Res 98: 1–32
Hoffer JM, Hoffer RL (1973) Composition and structural state of feldspar inclusions from alkaline olivine basalt, Potrillo basalt, southern New Mexico. Geol Soc Am Bull 84: 2139–2142
Hurai V, Huraiová M, Konečný P, Thomas R (2007) Mineral–melt–fluid composition of carbonatebearing cumulate xenoliths in Tertiary alkali basalts of southern Slovakia. Mineral Mag 71: 63–79
Hurai V, Huraiová M, Thomas R (2011) Calciocarbonatite melts in plagioclase megacrysts and xenoliths from Plio–Pleistocene alkali basalt (Slovakia). In: Bakker RJ, Baumgartner M, Doppler G (eds) European Current Research on Fluid Inclusions (ECROFI XXI), Montauniversität Leoben, Austria, 9–11 August 2011, Abstracts. Berichte der Geologischen Bundesanstalt 87: 110–111
Hurai V, Danišík M, Huraiová M, Paquette JL, Ádám A (2013a) Combined U/Pb and (U–Th)/He geochronometry of basalt maars in Western Carpathians: implications for age of intraplate volcanism and origin of zircon metasomatism. Contrib Mineral Petrol 166: 1235–1251
Hurai V, Huraiová M, Milovský R, Luptáková J, Konečný P (2013b) Highpressure aragonite phenocrysts in carbonatite and carbonated syenite xenoliths within an alkali basalt. Amer Miner 98: 1074–1077
Kantor J, Wiegerová V (1981) Radiometric ages of some basalts of Slovakia by K/Ar method. Geol Carpath 32: 29–34
Konečný V, Lexa J, Balogh K, Konečný P (1995) Alkali basalt volcanism in Southern Slovakia: volcanic forms and time evolution. Acta Vulcanol 7: 167–171
Konečný V, Lexa J, Balogh K (1999) Neogene–Quaternary alkali basalt volcanism in central and southern Slovakia (Western Carpathians). Geolines 9: 67–75
Konečný V, Kováč M, Lexa J, Šefara J (2002) Neogene evolution of the Carpatho–Pannonian region: an interplay of subduction and backarc diapiric uprise in the mantle. In: Bertotti G, Schulmann K, Cloetingh S (eds) Continental Collision and the TectonoSedimentary Evolution of Forelands. EGU Stephan Mueller Special Publication Series 1: 105–123
Kroll H, Ribbe PH (1983) Lattice parameters, composition, and Al/Si order in alkali feldspars. In: Ribbe PH (ed) Feldspar Mineralogy. Mineralogical Society of America Reviews in Mineralogy 2: 57–99
Kroll H, Ribbe PH (1987) Determining (Al,Si) distribution and strain in alkali feldspars using lattice parameters and diffraction peak positions: a review. Amer Miner 72: 491–506
Makreski P, Jovanovski G, Kaitner B (2009) Minerals from Macedonia. XXIV. Spectrastructure characterization of tectosilicates. J Molecul Struct 924–926: 413–419
McKeown DA (2005) Raman spectroscopy and vibrational analyses of albite: from 25 °C through the melting temperature. Amer Miner 90: 1506–1517
Monika Huraiová, Christian L. Lengauer, Rainer Abart, Vratislav Hurai
226
Merlet C (1992) Accurate description of surface ionization in electron probe microanalysis: an improved formulation. XRay Spectrom 21: 229–238
Mernagh TP (1991) Use of the laser Raman microprobe for discrimination amongst feldspar minerals. J Raman Spectrosc 22: 453–457
Pawley GS (1981) Unitcell refinement from powder diffraction scans. J Appl Crystallogr 14: 357–361
Pécskay Z, Lexa J, Szakács A, Seghedi I, Balogh K, Konečný V, Zelenka T, Kovacs M, Póka T, Fülöp A, Márton E, Panaiotu C, Cvetković V (2006) Geochronology of Neogene magmatism in the Carpathian arc and intraCarpathian area. Geol Carpath 57: 511–530
Rietveld HM (1969) A profile refinement method for nuclear and magnetic structures. J Appl Crystallogr 2: 65–71
Rull Pérez F, Maurice S, Hutchinson I, Moral A, Perez C, Diaz C, Colombo M, Belenguer T, LopezReyes G, Sansano A, Forni O, Parot Y, Striebig N, Woodward S, Howe Ch, Tarcea N, Rodriguez P, Seoane L, Santiago A, RodriguezPrieto JA, Medina J, Gallego P, Canchal R, Santamaría P, Ramos G, Vago JL, on behalf of the RLS Team (2017) The Raman laser spectrometer for the ExoMars Rover mission to Mars. Astrobiology 17: 627–654
Seghedi I, Downes H, Vaselli O, Szakács A, Balogh K, Pécskay Z (2004) Postcollisional Tertiary–Quaternary
mafic alkalic magmatism in the Carpathian–Pannonian region: a review. Tectonophysics 393: 43–62
Ulrych J, Pivec E, Povondra P, Buda G (1998) Nasanidine megacrysts from the Shavarin Caram volcano, Mongolia. Acta MineralPetrogr Szeged 39: 5–12
Upton BGJ, Hinton RW, Aspen P, Finch A, Valley JW (1999) Megacrysts and associated xenoliths: evidence for migration of geochemically enriched melts in the upper mantle beneath Scotland. J Petrol 40: 935–956
Upton BGJ, Finch AA, Słaby E (2009) Megacrysts and salic xenoliths in Scottish alkali basalts: derivatives of deep crustal intrusions and smallmelt fractions from the upper mantle. Mineral Mag 73: 943–956
Vass D, Elečko M, Konečný V (2007) Geology of the Lučenecká Kotlina Depression and Cerová Vrchovina Upland. Vydavateľstvo D. Štúra Publishers, Bratislava, pp 1–284 (in Slovak with English summary)
Wang A, Haskin LA, Lane AL, Wdowiak TJ, Squyres SW, Wilson RJ, Hovland LE, Manatt KS, Raouf N, Smith CS (2003) Development of the Mars microbeam Raman spectrometer (MMRS). J Geophys Res 108: 5005
Wen S, Nekvasil H (1994) SOLVCALC: an interactive graphics program package for calculating the ternary feldspar solvus and for twofeldspar geothermometry. Comput Geosci 20: 1025–1040