original paper molecular structure of the phosphate ... · molecular structure of the phosphate...
TRANSCRIPT

www.jgeosci.org
Journal of Geosciences, 62 (2017), 271–279 DOI: 10.3190/jgeosci.243
Original paper
Molecular structure of the phosphate mineral koninckite – – a vibrational spectroscopic study
Jakub JIRÁSEK1*, Jiří ČEJKA2, Luboš VRTIŠKA2,3, Dalibor MATÝSEK1, Xiuxiu RUAN4, Ray L. FROST4
1 Institute of Geological Engineering, Faculty of Mining and Geology, VŠB – Technical University of Ostrava, 17. listopadu 15/2172, 708 33 Ostrava-Poruba, Czech Republic; [email protected] Department of Mineralogy and Petrology, National Museum, Cirkusová 1740, 193 00 Prague – Horní Počernice, Czech Republic3 Department of Geological Sciences, Faculty of Science, Masaryk University, Kotlářská 2, 611 37 Brno, Czech Republic4 School of Chemistry, Physics and Mechanical Engineering, Science and Engineering Faculty, Queensland University of Technology, GPO Box 2434, Brisbane Queensland 4001, Australia* Corresponding author
We have undertaken a study of the mineral koninckite from Litošice (Czech Republic), a hydrated ferric phosphate, using a combination of scanning electron microscopy with electron probe micro-analyzer (wavelength-dispersive spectroscopy) and vibrational spectroscopy. Chemical analysis shows that studied koninckite is a pure phase with an empirical formula Fe3+
0.99(PO4)1.00∙2.75 H2O, with minor enrichment in Al, Ca, Ti, Si, Zn, and K (averages 0.00X apfu). Raman bands and shoulders at 3495, 3312, 3120, and 2966 cm–1 and infrared bands and shoulders at 3729, 3493, 3356, 3250, 3088, 2907, and 2706 cm–1 are assigned to the ν OH stretching of structurally distinct differently hydrogen bonded water molecules, A Raman band at 1602 cm–1 and shoulders at 1679, 1659, 1634, and 1617 cm–1 and infrared bands at 1650 and 1598 cm–1 are assigned to the ν2 (δ) H2O bending vibrations of structurally distinct differently hydrogen bonded water molecules. Raman shoulders at 1576, 1554, 1541, 1532, and 1520 cm–1 and infrared shoulders at 1541 and 1454 cm–1 may be probably connected with zeolitically bonded water molecules located in the channels. Raman bands and shoulders at 1148, 1132, 1108, 1063, 1048, and 1015 cm–1 and an infrared band and shoulders at 1131, 1097, 1049, and 1017 cm–1 are assigned to the ν3 PO4
3– triply degenerate antisymmetric stretching vibrations. A Raman band and a shoulder at 994 and 970 cm–1, respectively, and an infrared band and a shoulder at 978 and 949 cm–1, respectively, are assigned to the ν1 PO4
3– symmetric stretching vibrations. Infrared shoulders at 873, 833, and 748 cm–1 are assigned to libration modes of water molecules. Raman bands and shoulders at 670, 648, 631, 614, 600, 572, and 546 cm–1 and infrared bands at 592 and 534 cm–1 are assigned to the ν4 (δ) PO4
3– triply degenerate out-of-plane bending vibrations; weak band at 570 cm–1 may coincide with the δ Fe–O bending vibration. Raman bands and shoulders at 453, 443, 419, and 400 cm–1 are assigned to the ν2 (δ) PO4
3– doubly degenerate in-plane bending vibrations. Raman bands at 385, 346, 324, 309, 275, 252, and 227 cm–1 are assigned to the ν Fe–O stretching vibrations in FeO6 octahedra. Raman bands at 188, 158, 140, 112, 89, and 73 cm–1 are assigned to lattice vibrations.
Keywords: koninckite, phosphate, Raman spectroscopy, infrared spectroscopyReceived: 3 October 2016; accepted: 6 October 2017; handling editor: J. Sejkora
built as a heteropolyhedral framework with zeolite-like tunnels along [001]. The Fe3+ ions in the structure are in octahedral coordination by H2O molecules and oxygen ions of the PO4
3– tetrahedra. Koninckite should be an antiferromagnetic semiconductor, at least at low tem-peratures.
Summary of all known occurrences of koninckite and associated secondary minerals was given in Jirásek (2005) and Plášil et al. (2015). Circa 20 localities are known worldwide. Most often koninckite is associated with hydrated sulphates of Fe, Al and Mn in places of acid weathering of various phosphorous-rich rocks at shallow depths. At Richelle, Belgium (Van Tassel 1968), Nekézseny and Dédestapolcsány, Hungary (Koch 1985; Szakáll and Gatter 1993; Szakáll ed.
1. Introduction
Koninckite is a natural phosphate mineral of formula Fe3+(PO4)∙2.75H2O. It was named by Cesàro (1884) after Professor Laurent Guillaume de Koninck (1809–1887), notable Belgian paleontologist and chemist. Type local-ity is Richelle near Visé (Belgium). The mineral forms yellowish, white and colorless coatings, veins and rarely also crystal aggregates.
Koninckite belongs to the tetragonal crystal system. Published cell parameters are given in Tab. 1. The crystal structure of koninckite was solved recently by Plášil et al. (2015) from synchrotron powder X-ray diffraction data. Investigated material from Kociha (Slovakia) is tetrago-nal, with the space group P41212. Its crystal structure is
Jakub Jirásek, Jiří Čejka, Luboš Vrtiška, Dalibor Matýsek, Xiuxiu Ruan, Ray L. Frost
272
2002), Arnsberg (Blaß and Graf 1990) and Hardt-kopf (Blaß and Graf 1995), both in Germany, and Shanagolden, Republic of Ireland (Moreton and Green 2005), it originates by weathering of Carboniferous sedimentary rocks. At Oberbuchach, Austria (Leute 1996; Von Puttner 1997) and Montcada, Spain (Riba 1997) the source sediments are clayey Silurian shales. Cambro–Ordovician black shales are source rocks at Kociha, Slovakia (Novák et al. 2003), and Upper Proterozoic black shales in Litošice, Czech Republic (Jirásek 2005). At Untersulzbachtal, Austria (Burg-steiner 1997 in Leute 1999) source rocks are kyanite schists. Kovdor Massif, Russia yielded koninckite from apatite-rich fenite (Ivanyuk and Yakovenchuk 1987). Zoned concretions with koninckite from the Ponta Grosse Fm., Paraná Basin, Brazil, originate by lateritic weathering of Devonian sediments (Leonardos et al. 1987). Supergene koninckite was found in apatite-rich barren rock at base metal deposit of Pollone, Italy (Senesi 2000).
Exceptional origin of koninckite was described at four localities. At Kyrk-Bulak, Kyrgyzstan, Mn-rich koninckite is produced by decomposition of heterosite and strengite in granitic pegmatites (Beus 1950, 1951). At Oni-Ana, Japan, is koninckite present in cave sedi-ments (Kizaki 1983 in Sakurai et al. 1987). At Suwa Mine, Japan, this mineral originates by interaction of hot hydrothermal solutions rich in Fe3+ and SO4
2– with andesites and volcanoclastic rocks (Sakurai et al. 1987). Similar processes might be suspected for koninckite formation at New Idria Mine, California, USA, although there is only a short notice available about presence of the investigated mineral (Symons 1937).
Even though the work on the koninckite crystal struc-ture has been published recently, Raman and infrared spectroscopic studies have not been conducted so far. Still, Raman spectroscopy has proven an excellent tech-nique for the study of oxyanions in both solution and in secondary mineral formation (e.g., Frost et al. 2013a, b; 2014). The aim of this paper is therefore to report the Raman spectra of koninckite, and to relate the spectra to the molecular structure of this phosphate mineral. The paper follows the systematic research of the large group of supergene minerals and especially molecular structure of minerals containing oxyanions using infrared (IR) and Raman spectroscopy.
2. Material and methods
2.1. Samples description and preparation
The koninckite sample studied in this work comes from the Litošice, Pardubice Region, Czech Republic (N 49° 58.935′ E 015° 29.968′). It was described by Jirásek (2005). Material was found in a small dump of abandoned iron and manganese prospect, which explored southern end of belt of Neoproterozoic marine black py-ritic shales. These shales were interpreted as a product of submarine volcanic activity and were exploited in 19th and 20th centuries as a Fe–Mn ore and source of pyrite for chemical industry. Koninckite is present as white to beige veinlets up to 1 cm thick in the porous brownish amorphous phosphate historically described as delvauxite (possible diadochite). Macroscopically it looks massive, but small prismatic crystals up to c. 10 μm are visible in microscopic cavities by electron microscope.
The koninckite sample studied in this work occurs in association with dolomite. It was gently crushed and the associated minerals were removed under a Leica MZ4 stereomicroscope. Scanning electron microscopy (SEM) in the EDS mode was applied to support the mineral characterization.
2.2. Electron microscopy and microanalysis
The surface morphology of the samples was studied using scanning electron microscopy (FEI Quanta 650 FEG microscope equipped with energy-dispersive, wavelength-dispersive, electron backscatter diffraction and cathodoluminescence detectors) at Faculty of Mining and Geology, VŠB – Technical University of Ostrava. Microphotographs of separated, untreated and unpolished grains fixed on a graphite holder without coating were made by back-scattered electron (BSE) detector.
The chemical composition of koninckite was deter-mined using an electron microprobe Cameca SX 100 (Joint Laboratory of the Masaryk University and Czech Geological Survey, Brno). Wavelength dispersive mode and following conditions were used: accelerating voltage of 15 keV, beam current of 10 nA and beam diameter of 10 μm; analytical lines Kα; standards: Na (albite), Si, Al, K (sanidine), Mg (pyrope), P (fluorapatite), Ti (titanite),
Tab. 1 Lattice cell parameters of koninckite
Locality Source a (Å) c (Å)Litošice (Czech Republic) this study 11.9762(2) 14.6209(3)Kociha (Slovakia) Plášil et al. (2015) 11.9800(5) 14.618(1)Kociha (Slovakia) Novák et al. (2003) 11.956(6) 14.543(8)Suwa Mine (Japan) Sakurai et al. (1987) 11.977(2) 14.625(2)Richelle (Belgium) Van Tassel (1968) 11.95(5) 14.52(8)

Molecular structure of the phosphate mineral koninckite – a vibrational spectroscopic study
273
Ca (wollastonite), Fe (almandine), Mn (spessartine), Zn (gahnite), F (topaz). The raw data were processed using the X–φ matrix correction routine (Merlet 1994).
2.3. Powder X-ray diffraction
X-ray powder diffraction (XRD) measurements were conducted using a Bruker-AXS D8 Advance instrument (at VŠB – Technical University of Ostrava) with the 2θ/θ geometry using a silicon strip LynxEye position-sensitive detector under the following conditions: radiation CoKα/Fe filter, voltage 40 kV, current 40 mA, step by step mode of 0.014 2θ. The samples were placed on a zero-background rotating single-crystal Si slide and scanned. A total time on step 46.25 s and angular extent 5–140° 2θ were used. 5.6 wt. % of Si (NIST 640c) was added as internal standard for the measurement.
The data were digitally processed using the Bruker AXS Diffrac and Bruker EVA software and the PDF-2 database (2011 release; International Centre for Diffrac-tion Data). The cell parameters and quantitative composi-tion of the investigated sample were determined by the Rietveld method (Bruker Topas 4.2 software). Structural information published by Plášil et al. (2015) was used.
2.4. Raman and infrared spectroscopy
Raman spectra of the studied sample were collected at room temperature in the range 50−4000 cm–1 using a DXR dispersive Raman Spectrometer (Thermo Scientific) mounted on confocal Olympus microscope (National Museum, Prague). The Raman signal was excited by an unpolarized 532 nm diode-pumped solid-state laser and detected by a CCD detector. The experimental parameters were: 20× objective (estimated diameter of the laser spot less than 1.3 μm), 6 s exposure time, 3600 exposures, 830 lines/mm grating (spectral resolution better than 3 cm–1), 50 μm pinhole spectrograph aperture and 6 mW laser power level. The data were repeatedly acquired from dif-ferent grains in order to obtain a representative spectrum with the best signal to noise ratio. Eventual thermal dama-geof the measured point was excluded by visual inspection of excited surface after measurement, by observation of possible decay of spectral features in the start of excita-tion and checking for thermal downshift of Raman lines.
The instrument was set up by a software-controlled calibration procedure using multiple neon emission lines (wavelength calibration), multiple polystyrene Raman bands (laser frequency calibration) and standardized white-light sources (intensity calibration).
The infrared vibrational spectrum of koninckite was recorded by the attenuated total reflection (ATR) method with the diamond cell on a Nicolet iS5 spectrometer at the
National Museum, Prague. Spectra over the 4000−525 cm–1 range were obtained by the co-addition of 128 scans with a resolution of 4 cm–1 and a mirror velocity of 0.4747 cm/s. Spectra were co-added to improve the signal to noise ratio.
Spectral manipulations were performed using the Om-nic 9 software (Thermo Scientific). Gaussian/Lorentzian profile functions of the band-shape were used to obtain decomposed band components of the spectra. The decom-position was based on the minimization of the difference in the observed and calculated profiles until the squared correlation coefficient (r2) was greater than 0.995.
3. Results and discussion
3.1. Chemical characterization
The BSE image of koninckite sample studied in this work is shown in Fig. 1. The sample corresponds to an aggregate of crystals up to 20 µm long. New WDS data confirm pre-viously published EDS analysis (Jirásek 2005) and reveal chemically almost pure koninckite. The empirical formula of koninckite, calculated as the mean of 7 representative spot analyses (Tab. 2), is Fe3+
0.99(PO4)1.00∙2.75 H2O (based on 4 O and 2.75 H2O apfu). It shows minor Al (average 0.005 apfu), Ca (average 0.004 apfu), Ti (average 0.003 apfu) and K (average 0.002 apfu). Some analyses also contained up to 0.003 apfu of Zn, 0.003 apfu of Na, 0.002 apfu of Mg, and 0.009 apfu of F.
3.2. X-ray diffraction
Positions of the diffraction lines of the studied sample (Fig. 2) are in good agreement with the published ones
Fig. 1 Backscattered electron image of an aggregate of columnar koninckite crystals.

Jakub Jirásek, Jiří Čejka, Luboš Vrtiška, Dalibor Matýsek, Xiuxiu Ruan, Ray L. Frost
274
(PDF 00-041-1489). Diffraction pattern of koninckite is given in Tab. 3. Material shows minor (< 1.5 %) admixture of gypsum and jarosite. Due to the internal standard utilization it is clear that the investigated sample con-tains significant amount of the amorphous matter (c. 32 %). Published structural data (Plášil et al. 2015) are in a good agree-ment with the observed ones (Rwp = 7.0%, Rexp = 1.99%, GOF = 3.5%). Small differences in intensities can be ascribed to the partial dehydratation, since water is not stable bonded in the structure. The refined unit-cell parameters a = 11.9762(2) Å and c = 14.6209(3) Å are very simi-lar to the published data (Tab. 1).
Tab. 2 Chemical composition of the studied koninckite (wt. % and apfu)
1 2 3 4 5 6 7P2O5 34.25 34.37 34.03 34.15 35.25 33.76 34.01Al2O3 0.09 0.11 0.18 0.11 0.09 0.10 0.14Fe2O3 37.93 38.14 37.90 38.23 39.28 38.15 37.96SiO2 – 0.04 – 0.04 – – 0.08TiO2 0.14 0.13 0.13 0.09 0.08 0.09 0.11CaO 0.06 0.16 0.07 0.07 0.08 0.16 0.09ZnO – 0.10 0.09 0.13 – 0.07 0.01K2O 0.04 0.04 – 0.04 0.04 0.04 0.04H2O* 23.51 23.65 23.49 23.70 24.35 23.65 23.53Total 96.02 96.74 95.89 96.56 99.17 96.02 95.97P5+ 1.001 0.997 0.997 0.995 0.997 0.991 0.995Al3+ 0.004 0.005 0.007 0.005 0.003 0.004 0.006Fe3+ 0.986 0.984 0.987 0.990 0.988 0.996 0.987Si4+ – 0.001 – 0.001 – – 0.003Ti4+ 0.004 0.003 0.003 0.002 0.002 0.002 0.003Ca2+ 0.002 0.006 0.002 0.003 0.003 0.006 0.003Zn2+ – 0.003 0.002 0.003 – 0.002 –K+ 0.002 0.002 – 0.002 0.002 0.002 0.002H2O** 2.750 2.750 2.750 2.750 2.750 2.750 2.750* calculated on the basis of Fe3+/H2O ratio** calculated on the basis of 2.75 H2O in ideal formula of koninckite
Fig. 2 Powder XRD pattern of koninckite.
Molecular structure of the phosphate mineral koninckite – a vibrational spectroscopic study
275
present structurally distinct 2 Fe3+ and 2 P5+ units (Plášil et al. 2015). In the case of a free PO4
3– ion of Td sym-metry, there are nine normal vibrations characterized by four fundamental distinguishable modes of vibration: ν1 (A1) symmetric stretching vibration, Raman active (~938 cm–1); ν2 (E) doubly degenerate in-plane bending vibration, Raman active (~420 cm–1); ν3 (F2) triply de-generate antisymmetric stretching vibration, Raman and infrared active (~1017 cm–1); 4 (F2) triply degenerate out-of-plane bending vibration, Raman and infrared active (~527 cm–1) (Nakamoto 2009). In the case of symmetry lowering e.g. Td → C3v, C2v, C1, the ν1 PO4
3– symmetric stretching vibration is activated and can appear in the IR spectrum. A decrease of symmetry is also the cause of IR activation and splitting of the ν2 PO4
3– doubly de-generate bending vibration. Simultaneously, the ν3 PO4
3– triply degenerate antisymmetric stretching vibration and the ν4 PO4
3– bending vibration, both active in the IR and Raman spectra, can split into two or three components (Nakamoto 2009). Chukanov (2014) included in his atlas of spectra of minerals infrared spectrum of koninckite (cm–1): 3480 sh, 3260, 3145, 1640, 1140s, 1052 s, 1025 sh, 996 s, 875 w, 846 w, 770 w., 606, 540. This spectrum differs from the IR spectrum of koninckite presented in this paper. Raman and infrared spectra of the studied mineral koninckite are given in Fig. 3, tabularized values in Tab. 4.
Raman weak broad bands at 3312 and 3120 cm–1 with shoulders at 3495 and 2966 cm–1 (Fig. 4a) and infrared broad bands at 3250 and 3088 cm–1 with shoulders at 3729, 3493, 3356, 2907 and 2706 cm–1 (Fig. 5a) are as-signed to the ν OH stretching vibrations of structurally distinct and differently strong hydrogen bonded water molecules. According to Libowitzky’s empirical relation (Libowitzky 1999), O–H···O hydrogen bond lengths vary approximately in the ranges >3.2–2.65 Å (Raman) and
3.3. Raman and infrared spectroscopy
In the crystal structure of tetragonal mineral koninckite, FePO4.2.75 H2O, space group P41212 – D4
4, Z = 16, are
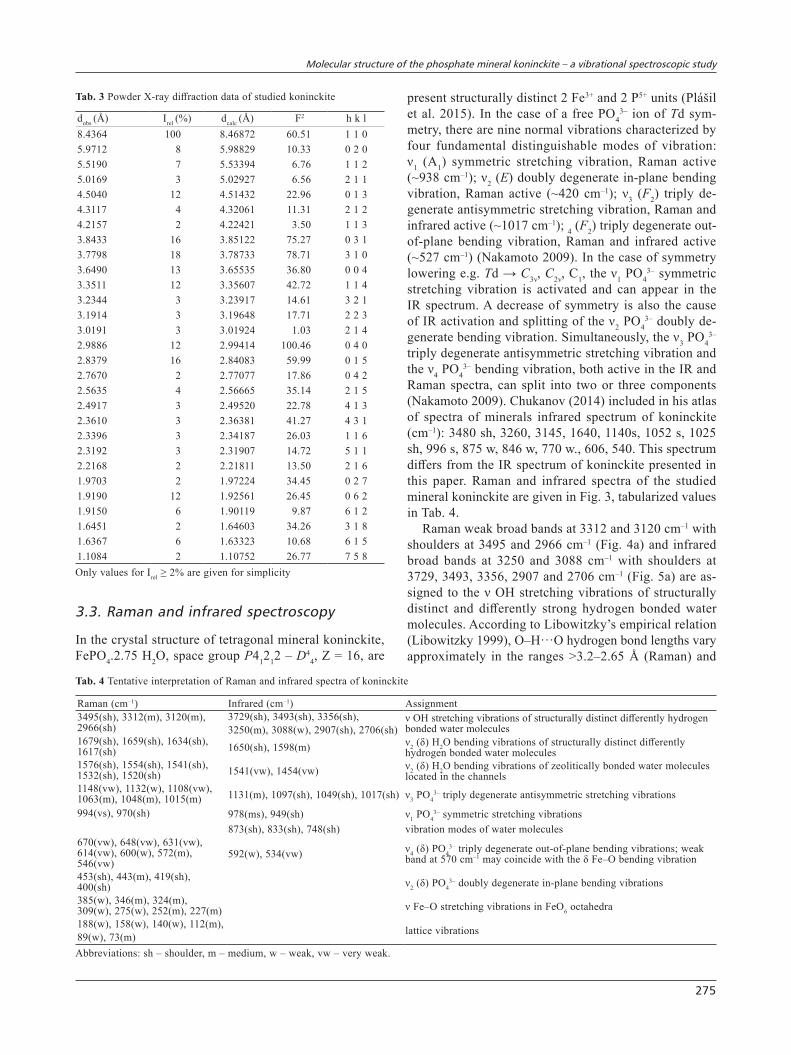
Tab. 3 Powder X-ray diffraction data of studied koninckite
dobs (Å) Irel (%) dcalc (Å) F2 h k l8.4364 100 8.46872 60.51 1 1 05.9712 8 5.98829 10.33 0 2 05.5190 7 5.53394 6.76 1 1 25.0169 3 5.02927 6.56 2 1 14.5040 12 4.51432 22.96 0 1 34.3117 4 4.32061 11.31 2 1 24.2157 2 4.22421 3.50 1 1 33.8433 16 3.85122 75.27 0 3 13.7798 18 3.78733 78.71 3 1 03.6490 13 3.65535 36.80 0 0 43.3511 12 3.35607 42.72 1 1 43.2344 3 3.23917 14.61 3 2 13.1914 3 3.19648 17.71 2 2 33.0191 3 3.01924 1.03 2 1 42.9886 12 2.99414 100.46 0 4 02.8379 16 2.84083 59.99 0 1 52.7670 2 2.77077 17.86 0 4 22.5635 4 2.56665 35.14 2 1 52.4917 3 2.49520 22.78 4 1 32.3610 3 2.36381 41.27 4 3 12.3396 3 2.34187 26.03 1 1 62.3192 3 2.31907 14.72 5 1 12.2168 2 2.21811 13.50 2 1 61.9703 2 1.97224 34.45 0 2 71.9190 12 1.92561 26.45 0 6 21.9150 6 1.90119 9.87 6 1 21.6451 2 1.64603 34.26 3 1 81.6367 6 1.63323 10.68 6 1 51.1084 2 1.10752 26.77 7 5 8Only values for Irel ≥ 2% are given for simplicity
Tab. 4 Tentative interpretation of Raman and infrared spectra of koninckite
Raman (cm–1) Infrared (cm–1) Assignment3495(sh), 3312(m), 3120(m), 2966(sh)
3729(sh), 3493(sh), 3356(sh), 3250(m), 3088(w), 2907(sh), 2706(sh)
ν OH stretching vibrations of structurally distinct differently hydrogen bonded water molecules
1679(sh), 1659(sh), 1634(sh), 1617(sh) 1650(sh), 1598(m) ν2 (δ) H2O bending vibrations of structurally distinct differently
hydrogen bonded water molecules1576(sh), 1554(sh), 1541(sh), 1532(sh), 1520(sh) 1541(vw), 1454(vw) ν2 (δ) H2O bending vibrations of zeolitically bonded water molecules
located in the channels1148(vw), 1132(w), 1108(vw), 1063(m), 1048(m), 1015(m) 1131(m), 1097(sh), 1049(sh), 1017(sh) ν3 PO4
3– triply degenerate antisymmetric stretching vibrations
994(vs), 970(sh) 978(ms), 949(sh) ν1 PO43– symmetric stretching vibrations
873(sh), 833(sh), 748(sh) vibration modes of water molecules670(vw), 648(vw), 631(vw), 614(vw), 600(w), 572(m), 546(vw)
592(w), 534(vw) ν4 (δ) PO43– triply degenerate out-of-plane bending vibrations; weak
band at 570 cm–1 may coincide with the δ Fe–O bending vibration453(sh), 443(m), 419(sh), 400(sh) ν2 (δ) PO4
3– doubly degenerate in-plane bending vibrations385(w), 346(m), 324(m), 309(w), 275(w), 252(m), 227(m) ν Fe–O stretching vibrations in FeO6 octahedra188(w), 158(w), 140(w), 112(m), 89(w), 73(m) lattice vibrations
Abbreviations: sh – shoulder, m – medium, w – weak, vw – very weak.

Jakub Jirásek, Jiří Čejka, Luboš Vrtiška, Dalibor Matýsek, Xiuxiu Ruan, Ray L. Frost
276
3.2–2.6 Å (infrared). These values are practically compa-rable to hydrogen bond lengths, inferred from the single-crystal structure data of koninckite (Plášil et al. 2015).
A Raman very weak band at 1602 cm–1 with some shoulders from 1679 to 1617 cm–1 (Fig. 4b) and infrared bands at 1650 and 1598 cm–1 (Fig. 5b) are attributed to the ν2 (δ) bending vibrations of structurally distinct and differently strong hydrogen bonded water molecules. Raman shoulders from 1576 to 1520 cm–1 and infrared shoulders at 1541 and 1454 cm–1 could probably be con-nected with zeolitic-type free non-hydrogen bonded water located in channels of koninckite (Plášil et al. 2015). However, as usually known, any resolution of observed Raman weak and very weak bands and shoulders make problems. Some of them should be therefore probably understood as artefacts of the profile fitting procedure.
Raman medium bands at 1063, 1048 and 1015 cm–1, weak and very weak bands and shoulders at 1148, 1132 and 1108 cm–1 (Fig. 4c) and an infrared medium band at 1131 cm–1 with shoulders at 1097, 1049 and 1017 cm–1 (Fig. 5c) are assigned to the ν3 PO4
3– triply degenerate
antisymmetric stretching vibrations. The number of ob-served bands and shoulders proves Td symmetry lowering connected with the splitting of the ν3 PO4
3– triply degener-ate vibrations and with two symmetrically distinct P5+ in the structure of koninckite (Plášil et al. 2015).
A Raman very strong band at 994 cm–1 with a shoulder at 970 cm–1 and an infrared medium strong band at 978 cm–1 with a shoulder at 949 cm–1 are attributed to the ν1 PO4
3– symmetric stretching vibrations (Figs 4c, 5c). The number of the bands and shoulders relates to two P5+ present in the structure of koninckite (Plášil et al. 2015).
Infrared shoulders at 873, 833 and 748 cm–1 (Fig. 5c) may be assigned to libration modes of water molecules (Frost et al. 2002).
A Raman medium band at 572 cm–1 and very weak bands and shoulders at 670, 648, 631, 614 and 546 cm–1 (Fig. 4d) and infrared weak and very weak bands at 592 and 534 cm–1 (Fig. 5c), respectively, are connected with the split ν4 (δ) PO4
3– triply degenerate out-of-plane bending vibrations and the δ Fe–O bending vibrations. Chukanov (2014) observed corresponding bands at 606
Rela
tive inte
nsity
Wavenumber (cm )–13500 3000 2500 2000 1500 1000
3000 2000 1500 1000 500Raman shift (cm )–1
Ram
an in
tensi
ty
a)
b)
Fig. 3a – Raman spectrum of koninckite over the 50 to 4000 cm–1 spectral range; b – infrared spectrum of koninckite over the 525 to 4000 cm–1 spectral range; both spectra are split at 2000 cm–1.

Molecular structure of the phosphate mineral koninckite – a vibrational spectroscopic study
277
and 540 cm–1 in the infrared spectrum of koninckite from Kociha, near Rimavská Sobota, Banská Bystrica District, Slovakia.
A Raman medium band at 443 cm–1 with shoulders at 453, 419 and 400 cm–1 are assigned to the split ν2 (δ) PO4
3– doubly degenerate bending vibrations (Fig. 4e). A Raman
medium bands at 346, 324, 252 and 227 cm–1 and Raman weak bands at 385, 309 and 275 cm–1 may be connected with ν Fe–O stretching vibrations in FeO6 octahedra. Ra-man medium and weak bands at 188, 158, 140, 112, 89 and 73 cm–1 (Fig. 4e–f) are assigned to lattice vibrations (Čejka et al. 2011; Kerolli-Mustafa et al. 2013).
Raman shift (cm )–1
Ra
ma
n in
ten
sity
28003000320034003600
31
20
29
663
45
9
33
12
152015401560158016001620164016601680
Ra
ma
n in
ten
sity
Raman shift (cm )–1
1520
1679
1659
1634
1617
1602
1576
1554
1541
1532
9501000105011001150
Ra
ma
n in
ten
sity
Raman shift (cm )–1
10
48
11
48
97
0
11
32
99
4
11
08
10
63
10
15
Ra
ma
n in
ten
sity
Raman shift (cm )–1
520540560580600620640660680
54
6
67
0 64
8
63
1
61
4
60
0
57
2
Raman shift (cm )–1
Ra
ma
n in
ten
sity
320340360380400420440460480
44
3
41
9
40
0 38
5 30
9
34
6
32
4
45
3
18
8
25
2
27
5
22
7
15
8
14
0
11
2
89
73
Raman shift (cm )–1
Ra
ma
n in
ten
sity
100150200250
a) b)
d)
f)
c)
e)
Fig. 4 Results of the band component analysis in the Raman spectrum of koninckite.

Jakub Jirásek, Jiří Čejka, Luboš Vrtiška, Dalibor Matýsek, Xiuxiu Ruan, Ray L. Frost
278
4. Conclusions
Molecular structure of koninckite can be better con-strained using the vibrational spectroscopy. Raman spec-troscopy shows the presence of PO4
3– -units as identified by the position of the Raman peaks. The observation of multiple phosphate bands supports the concept of non-equivalent phosphate units in the koninckite structure. The presence of water is identified in the structure of koninckite by both Raman and infrared bands. Multiple water bands are observed showing that also water is involved in different coordination environments in the structure of koninckite due to differing hydrogen bond strengths.
Acknowledgements. Some of the analytical work was performed using equipment that was financed by the project “Institute of Clean Technologies for Mining and Utilisation of Raw Materials for Energy” (LO1406) and supported by the “Research and Development for In-novations Operational Programme” that is financed by structural funds of the European Union and the state budget of the Czech Republic. The study was financially
260028003000320034003600Wavenumber (cm )
–1
Re
lative
in
ten
sity
27
06
32
50
29
07
30
88
33
56
37
29
34
93
Re
lative
in
ten
sity
1450150015501600165017001750
14
541
65
0
15
98
15
41
Wavenumber (cm )–1
60070080090010001100
Re
lative
in
ten
sity
11
31
10
97
10
49
10
17 97
8 94
9
87
3
83
3 74
8 59
2
53
4
Wavenumber (cm )–1
a) b)
c)supported by the Ministry of Culture of the Czech Re-public (DKRVO 2017/02; National Museum 00023272) to JČ. The authors are grateful to Martin Števko and an anonymous reviewer as well as the handling editor (Jiří Sejkora) for their constructive comments and sugges-tions, which substantially improved the quality of the manuscript.
References
Beus AA (1950) Magnesiophyllite and manganokoninck-ite – new minerals form pegmatites from the Turkestan Range. Dokl Akad Nauk SSSR 73: 1267–1269 (in Rus-sian)
Beus AA (1951) New phosphates form pegmatites from the Turkestan Range. Trudy Mineral Muz Akad Nauk SSSR 3: 19–36 (in Russian)
Blass G, Graf H-W (1990) Neufunde von bekannten Fundorten. Emser Hefte 3: 82–85
Blass G, Graf H-W (1995) Mineralogische Neuigkei-ten vom Hardtkopf bei Sundern-Linnepe, Sauerland. Mineralien-Welt 4: 26–27
Cesàro G (1884) Sur la koninckite, noveau phosphate fer-rique hydrate. Ann Soc Géol Belg 11: 157–247
Chukanov NV (2014) Infrared Spectra of Mineral Species, Extended Library, Vol. 1. Springer, Dordrecht, pp 1–1726
Čejka J, Sejkora J, Plášil J, Bahfenne S, Palmer S, Rintoul L, Frost RL (2011) A vibrational spectroscopic study of hydrated Fe3+ hydroxyl sulfates: polymorphic minerals butlerite and parabutlerite. Spectrochim Acta A 79: 1356–1363
Frost RL, Martens W, Williams PA, Kloprogge JT (2002) Raman and infrared spectroscopic study of the vivianite-group phosphates vivianite, baricite and bobier-rite. Mineral Mag 66: 1063–1073
Fig. 5 Results of the band component analysis in the infrared spectrum of koninckite.

Molecular structure of the phosphate mineral koninckite – a vibrational spectroscopic study
279
Frost RL, Lopez A, Xi Y, Granja A, Scholz R (2013a) Vibrational spectroscopic characterization of the phos-phate mineral kulanite Ba(Fe2+,Mn2+,Mg)2(Al,Fe3+)2 (PO4)3(OH)3. Spectrochim Acta A 115: 22–25
Frost RL, Palmer SJ, Xi Y, Čejka J, Sejkora J, Plášil J (2013b) Raman spectroscopic study of the hydroxy-phos-phate mineral plumbogummite PbAl3(PO4)2(OH,H2O)6. Spectrochim Acta A 103: 431–434
Frost RL, Scholz R, Lopez A, Xi Y, de Siqueira Queiroz C, Belotti FM, Filho MC (2014) Raman, infrared and near-infrared spectroscopic characterization of the herderite–hydroxylherderite mineral series. Spectrochim Acta A 118: 430–437
Ivanyuk GY, Yakovenchuk VN (1987) Minerals of the Kovdor Massif. Russian Academy of Science Kola Sci-ence Center Publishing, Kovdor-Apatity, pp 1–117
Jirásek J (2005) Find of koninckite near Litošice (Železné hory Mts.) in comparison with its world occurrences. Bull Mineral-Petrolog Odd Nár Muz (Praha) 13: 132–137 (in Czech)
Kerolli-Mustafa M, Baćić I, Ćurković L (2013) Investiga-tion of jarosite process tailing waste by means of Raman and infrared spectroscopy. Materialwiss Werkst 44: 768–773
Koch S (1985) Minerals of Hungary. Akadémiai Kaidó, Budapest, pp 1–562 (in Hungarian)
Leonardos OH, Fernandes SM, Fyfe WS, Powell M (1987) The micro-chemistry of uraniferous laterites from Brazil: a natural example of inorganic chromatography. Chem Geol 60: 111–119
Leute MA (1996) Mineralogische Neuigkeiten aus Öster-reich (1). Mineralien-Welt 3: 18–24
Leute MA (1999) Mineralogische Neuigkeiten aus Öster-reich (3). Mineralien-Welt 5: 26–36
Libowitzky E (1999) Correlation of O–H stretching fre-quencies and O–H..O hydrogen bond lengths in minerals. Monatsh Chem 130: 1047–1059
Merlet C (1994) An accurate computer correction program for quantitative electron probe microanalysis. Microchim Acta 114/115: 363–376
Moreton S, Green DI (2005) Phosphate minerals in-cluding koninckite and planerite from Grouse Lodge Quarry, Shanagolden, Co. Limerick. J Russell Soc 8: 78–80
Nakamoto K (2009) Infrared and Raman Spectra of Inor-ganic and Coordination Compounds, Part A: Theory and Applications in Inorganic Chemistry, 6th edition. Wiley, Hoboken, New Jersey, pp 1–432
Novák F, Pauliš P, Ševců J, Kopista J, Zeman Z (2003) Koninckite, evansite, vashegyite and volborthite from Kociha near Rimavská Sobota (Slovakia). Bull Mineral-Petrolog Odd Nár Muz (Praha) 11: 159–166 (in Czech)
Plášil J, Majzlan J, Wierzbicka-Wieczorek M, Kiefer B (2015) Crystal structure, thermal behaviour and para-genesis of koninckite, FePO4·2.75 H2O. Mineral Mag 79: 1159–1173
Riba JR (1997) Montcada Hill (Montcada and Reixac, Vallès Occidental), history, mining and mineralogy. Rev Mineral Catalun 7: 34–55 (in Catalan)
Sakurai K, Matsubara S, Kato A (1987) Koninckite from the Suwa Mine, Chino City, Nagano Prefecture, Japan. Bull Natl Sci Mus, Ser C 13: 149–156
Senesi F (2000) Koninckite and other phosphates from the Pollone Mine (Valdicastello Carducci, Lucca). Riv Mineral Ital 1: 46–48 (in Italian)
Symons HH (1937) Minerals and statistics. Calif J Mines Geol 33: 251–253
Szakáll S (ed) (2002) Minerals of the Carpathians. Granit, Prague, pp 1–479
Szakáll S, Gatter I (1993) Mineral Species of Hungary. Fair System Kft., Miskolc, pp 1–211 (in Hungarian)
Van Tassel R (1968) Données cristallographiques sur la Koninckite. Bull Soc Fr Mineral Cr 91: 487–489
Von Puttner M (1997) Das seltene Phosphatmineral Koninckit in einer Mineralisation vom Geo-Trail bei Oberbuchach, Karnische Alpen (Kärnten). Der Auf-schluss 48: 317–320
