original research article doi - 10.26479/2016.0105.03 ... · results were expressed as unit/l for...
TRANSCRIPT

Babar & Raje RJLBPCS 2016 www.rjlbpcs.com Life Science Informatics Publications
© 2016 Life Science Informatics Publication All rights reserved
Peer review under responsibility of Life Science Informatics Publications
2016 Jan- Feb RJLBPCS 1(5) Page No.241
Original Research Article DOI - 10.26479/2016.0105.03
POPULATION DYNAMICS OF PLANKTER IN A PERENNIAL WATER
BODY
Babar H. T and G. B. Raje
Department of Zoology, D. B. J. College, Chiplun, Dist. Ratnagiri (MS-India) – 415605
ABSTRACT: Present study was carried out to investigate the population dynamics of plankter
and productivity status of perennial aquatic body. Morawane dam is a perennial water body in
Chiplun Tehsil of Ratnagiri district in Maharashtra, India. The qualitative and quantitative analysis
of plankter was carried out with the help of Sedgwick- Rafter cell method during January 2012 to
December 2013. The percent composition of phytoplankter belonging to six major groups were
Chlorophyceae (53%), Bacillariophyceae (22%), Cyanophyceae (Myxophyceae) (22%),
Xanthophyceae (1%), Dinophyceae (1%), Chrysophyceae (1%). The group Chlorophyceae was
represented by 37 genera / species, among which Pediastrum sp. Chlorella, Scenedesmus,
Spirogyra and Treubaria were dominant in descending order. The group Cyanophyceae was
represented by Microcystis, Synecocystis, Oscillatoria, Aphanocapsa, Gleocapsa, Merismopedia
and Bacillariophyceae by Synedra, Navicula, Nitzschia, Cocconeis, Suriella and Fragillaria.
Study further reported five major groups viz. Rotifera (41%), Cladocera (24%), Copepod (23%),
Anostraca (10%) and Ostracoda (2%) of zooplankter. Group Rotifera showed increase in number
from December to May and successive decline from June to November. Copepoda group showed
decline in their number from January to May with steady increase from June to December with
peak in November and December. The seasonal fluctuations in zooplankter were well
synchronized with phytoplankter. The study dam is located at low altitudes and supporting
moderate number of species of zooplankton indicating mesotrophic conditions. This is further
supported by the presence of Microcystis, Oscillatoria, Nitzschia, Navicula, Scenedesmus and
Coleospharium.
________________________________________________________________________ ___ Key words: Population dynamics, Perennial water body, Phytoplankter, Zooplankter, Mesotrophic.
____________________________________________________________________ _ _____
*Corresponding author: Dr. Babar H. T. Ph.D.
Department of Zoology, D. B. J. College, Chiplun, Dist. Ratnagiri (MS-India) – 415605
Authors: Email: [email protected]; [email protected]
__________________________________________________________________________ _
Babar & Raje RJLBPCS 2016 www.rjlbpcs.com Life Science Informatics Publications
© 2016 Life Science Informatics Publication All rights reserved
Peer review under responsibility of Life Science Informatics Publications
2016 Jan- Feb RJLBPCS 1(5) Page No.242
1.INTRODUCTION
Study of the biological aspects such as phytoplankton, zooplankton, fishes, amphibians, reptiles,
aquatic birds, insects, etc. of the freshwater body determines the status of the aquatic environment.
But the productivity of water body, in terms of planktonic biomass, is regulated by various physico-
chemical factors viz., temperature, transparency, pH, electrical conductivity, total hardness, nitrogen
and phosphorus (Mahboob et al., 1993). About 75% of freshwater fish feed is plankton at one or the
other stage of their life cycle. Phytoplankton, algae and vascular aquatic plants conduct aeration of
water by releasing the oxygen and absorbing the carbon dioxide; and act as a main source of food
directly or indirectly to the fish population. Phytoplankton encompass a surprising range of cell size
and cell volume from the largest forms visible to the naked eye, Volvox (500 to1500 μm), to micro
plankton which vary from 60 to 500 μm. Nanoplankton are very small, their size varies from 5 to 60
μm. These can only be collected with a special nanoplankton net having mesh size of 30 μm (Wetzel,
1975). The Diatoms (Odum, 1971) are good indicators of water quality whereas benthic algae
(Hunding, 1971) are an important producer component of the littoral zone of eutrophic lake but
plankton algae (Palmer, 1980) are much more important than the attached algae in deep reservoirs.
The algae are more sensitive to detergents than bacteria and fungi (Issa and Ismail, 1995) and
therefore commonly used for monitoring environmental contamination (Wu, 1999). Zooplankton
and other micro invertebrates also depend upon phytoplankton for their existence. Zooplankter are
minute organisms that float in the surface water and play important role in the food web. Importance
of zooplankter as fish food has been studied by different workers (Fontaine and Revera, 1986 and
Geiger, 1983). They are considered to be the ecological indicators of water bodies (Gajbhiye and
Desai 1981). Zooplankters serve as the connecting link between primary producers and secondary
consumers in food chains of the lentic water bodies. Therefore, studies on long-term fluctuations in
the abundance of plankter are important in relation to the conservation of aquatic resources.
Availability of zooplankter as food for larval fish is thought to be one of the key factors that
determine the class strength of commercial fish (Cushing, 1978; Kane, 1993). Study of plankton
biomass is also important for the fish production. The high biomass values indicate the high fish
production. The distribution and abundance of plankton in polluted and unpolluted waters can
provide information on the status of water body. Hence, Morawane dam from Ratnagiri district of
Maharashtra, India was selected to study its status from the view point of planktons.

Babar & Raje RJLBPCS 2016 www.rjlbpcs.com Life Science Informatics Publications
© 2016 Life Science Informatics Publication All rights reserved
Peer review under responsibility of Life Science Informatics Publications
2016 Jan- Feb RJLBPCS 1(5) Page No.243
Study area
Google view of Morawane dam
Morawane dam is a perennial fresh water body situated in Chiplun Tehsil of Ratnagiri district (MS)
in the ranges of Sahyadri of Western Ghats. The dam is constructed across the Morawane Nalla in
Vashishthi River Basin in the year 2004 at the Latitude 170 32’ 55” N and Longitude 730 36’ 40” E
and comes under Konkan Irrigation Circle, South Division, Ratnagiri. Its catchments area is 8.03 sq.
km. receives an average annual rainfall of about 3300 mm. The dam is of earthen type having length
of 420 meters and maximum height of 24.37 meters with spillway of about 75 meters. The spillway
of dam is of Ogee type with maximum flood discharge of 281.015 M3. It has only one outlet in the
form of Left Bank Canal (LBC) of 5.50 km length. The 75% dependable yield of the dam is about
19.65 Mm3 with gross annual utilization of about 3.841 Mm3. Out of total water, 0.13 Mm3 is
available for drinking purpose and 2.97 Mm3 for irrigation purpose. The information pertaining to
the storage of reservoir indicates that the maximum water level (MWL) in the dam is 115 meters
while full reservoir level (FRL) is 112 meters. Two village viz. Morawane and Dalvatne come under
the command of dam with gross command area of about 286 hectares. The total land area under
submergence is about 23.44 hectares.
2. MATERIALS AND METHODS:
The plankton samples were monthly collected from three different stations of the dam between 8.30
am to 11.30 am during January 2012 to December 2013. Sample collection was done by using
conical net having mesh size of 120µ. Fixed volume of water (25 liters) was filtered through the
plankton net and plankter collected were concentrated to 250 ml and preserved in 4% formalin. The
samples were kept for setting for a period of 48 hrs. The qualitative and quantitative analysis of
phytoplankton and zooplankton was carried out in the laboratory with the help of Sedgwick- Rafter
cell method. Preserved and concentrated samples were agitated thoroughly for even distribution of
organisms and exactly one ml of sample was transferred on to the Sedgwick- Rafter cell counting
chamber. The counting of plankter was done under compound microscope (15x eyepiece, 10x and
40x objective lens) and photography was done by digital camera (Nikon) mounted on the microscope
with special attachment. Identification and classification of phytoplankton and zooplankton was

Babar & Raje RJLBPCS 2016 www.rjlbpcs.com Life Science Informatics Publications
© 2016 Life Science Informatics Publication All rights reserved
Peer review under responsibility of Life Science Informatics Publications
2016 Jan- Feb RJLBPCS 1(5) Page No.244
done with the help of books Smith, (1951), Edmondson, (1959), Findlay and Kling, (1979), Thomas,
(1983), Sarode and Kamat (1984), Adoni et al. (1985), Ling and Tyler (1986), Battish, (1992), Shiel,
(1995), Vashishta et al., (2008), Bellinger, and Sigee (2010) and http://www.algalweb.net website.
Identified planktons and observations were presented in percent composition and population
dynamics. Results were expressed as unit/l for phytoplankton and organism/l for zooplankton. The
phytoplankter and zooplankter were identified up to generic level while some of them were identified
up to species level.
3. RESULTS AND DISCUSSION
Phytoplankter:
Phytoplankter reported from Morawane dam belonged to five major divisions such as Chlorophyta,
Chrysophyta, Bacillariophyta, Dinophyta (Pyrrophyta) and Cyanophyta. The Chlorophyta reported
to be the largest division and included 37 genera/species of phytoplankton belonging to 12 families,
4 orders and one class. Second largest division was Cyanophyta contained 8 genera/ species
belonging to 3 families, 2 orders and one class, the Cyanophyceae (Myxophyceae). Division
Bacillarophyta contained only one class i. e. Bacillariophyceae which further contained 01 order, 05
families and 06 genera/species. The division Dinophyta included only 01 class i.e. Dinophyceae that
included 02 orders, 02 families and 02 genera/species. The Chrysophyta division included two
classes such as Chrysophyceae and Xanthophyceae. Each of the classes contained 01 order, 01
family and one (Table No. 1).
Table No. 1: Phytoplankton diversity in Morawane dam.
Division Class Order Family Genera
Chlorophyta
(Green Algae) Chlorophyceae Chlorococcales Dictyosphaeriaceae Botryococcus sp
Hydroditctyaceae Pediastrum sp
Coelastraceae Coelastrum sp
Oocystaceae Ankistrodesmus sp
Chlorella sp
Treubaria sp
Scenedesmaceae Scenedesmus sp
Crucigenia sp
Actinastrum sp
Ulotrichales Ulotrichaceae Ulothrix sp
Microsporaceae Microspora sp
Protococcaceae Protococcus sp
Volvocales Volvocaceae Eudorina sp
Volvox sp
Zygnematales Desmidiaceae Arthrodesmus sp
Closterium sp
Cosmarium botrytis

Babar & Raje RJLBPCS 2016 www.rjlbpcs.com Life Science Informatics Publications
© 2016 Life Science Informatics Publication All rights reserved
Peer review under responsibility of Life Science Informatics Publications
2016 Jan- Feb RJLBPCS 1(5) Page No.245
Cosmarium brebissonii
Cosmarium contractum
Cosmarium depressum
Cosmsrium formulosum
Desmidium sp
Penium margaritaceum
Staurastrum longispinum
Staurastrum manfeldtii
Staurastrum anatidum
Staurastrum arctison
Staurastrum cerastes
Staurastrum inflexum
Staurastrum johnsonii
Staurastrum ophiura
Staurastrum planktonicum
Staurastrum sexangulare
Staurastrum singulum
Gonatozygonaceae Gonatozygon sp
Zygnemataceae Spirogyra sp
Zygnema sp
Chrysophyta
Chrysophyceae Ochromonadales /
Chrysomonadales
Ochromonadaceae / Dinobryon sp
Dinobryaceae
Xanthophyceae Heterotrichales Tribonemataceae Tribonema sp
Bacillarophyta Bacillariophyceae
Bacillariales / Fragilariaceae Fragillaria sp
(Diatoms) Pennales
Synedra sp
Achnanthaecae Cocconeis sp
Naviculaceae Navicula sp
Nitzschiaceae Nitzschia sp
Surirellaceae Suriella sp
Pyrrophyta /
Dinophyta Dinophyceae Peridiniales Gonyaulacaceae Gonyaulax sp
Gymnodiniales Gymnodiniaceae Gymnodinium sp
Cyanophyta Cyanophyceae / Chroococcales Chroococcaceae Gloeocaspa sp
Myxophyceae
Synecocystis sp
Aphanocapsa sp
Microcystis sp
Merismopedia sp

Babar & Raje RJLBPCS 2016 www.rjlbpcs.com Life Science Informatics Publications
© 2016 Life Science Informatics Publication All rights reserved
Peer review under responsibility of Life Science Informatics Publications
2016 Jan- Feb RJLBPCS 1(5) Page No.246
Coelosphaerium sp
Nostocales Oscillatoriaceae Oscillatoria sp
Rivulariaceae Gloetrichia sp
Monthly variations in algal groups during January 2012 to December 2013 are depicted in Fig. No.1.
The minimum numerical density of Chlorophyceae (1618 units/l) was reported during June 2013
and maximum (4612 units/l) during December 2013. The range of Xanthophyceae was from 10 to
182 units/l. It was reported minimum during December 2013 and maximum during October 2012.
The Chrysophyceae group showed range between 12 units/l during December 2012 and 98 units/l
during May 2013. The Bacillariophyceae were reported to be minimum (572 units/l) during July
2013 and maximum (1926 units/l) during March 2012. The Dinophyceae group showed range from
nil during May 2013 to 156 units/l during July 2012. The Myxophyceae showed range between 372
units/l during June 2012 and 2211 units/l during February 2012.
Fig. No. 1: Monthly variation of Phytoplankton groups (units/l) in Morawane dam during January
2012 to December 2013
In the present investigation the order of dominance of various groups of phytoplankton in Morawane
dam was represented as: Chlorophyceae (53%) > Bacillariophyceae (22%) > Cyanophyceae
(Myxophyceae) (22%) > Xanthophyceae (1%) > Dinophyceae (1%) > Chrysophyceae (1%) (Fig.
No. 2).
0
500
1000
1500
2000
2500
3000
3500
4000
4500
5000
Jan
-12
Feb
Mar
Ap
r
May Jun
Jul
Au
g
Sep
Oct
No
v
Dec
Jan
-13
Feb
Mar
Ap
r
May Jun
Jul
Au
g
Sep
Oct
No
v
Dec
Un
its/
l
Month
Chlorophyceae
Xanthophyceae
Chrysophyceae
Bacillariophyceae
Dinophyceae
Myxophyceae

Babar & Raje RJLBPCS 2016 www.rjlbpcs.com Life Science Informatics Publications
© 2016 Life Science Informatics Publication All rights reserved
Peer review under responsibility of Life Science Informatics Publications
2016 Jan- Feb RJLBPCS 1(5) Page No.247
Fig. No - 2: Percent composition of Phytoplankton groups in Morawane dam.
The dominance of Chlorophyceae was noticed from October to April in Morawane dam. Its
population declined during monsoon. Similar trend was exhibited by Bacillariophyceae and
Myxophyceae. The Xanthophyceae, Chrysophyceae and Dinophyceae maintained their existence
throughout the study period with little variations (Fig. No.1). Dominant species of phytoplankter
reported in the study dam are micro photographed and depicted in Plate-.I.
PLATE – I: Photographs of dominant species of phytoplankton reported in the study dam.
CLASS - CHLOROPHYCEAE
Botryococcus sp Pediastrum sp Coelastrum sp Chlorella sp
Ulothrix sp Microspora sp Volvox sp Arthrodesmus sp
Chlorophycea
e
53%
Xanthophycea
e
1%
Chrysophycea
e
1%
Bacillariophyc
eae
22%
Dinophyceae
1%
Myxophyceae
22%

Babar & Raje RJLBPCS 2016 www.rjlbpcs.com Life Science Informatics Publications
© 2016 Life Science Informatics Publication All rights reserved
Peer review under responsibility of Life Science Informatics Publications
2016 Jan- Feb RJLBPCS 1(5) Page No.248
Cosmarium botrytis Cosmarium brebissonii Cosmarium contractum Cosmarium depressum
Cosmarium formulosum Desmidium sp Staurastrum longispinum Staurastrum manfeldtii
Staurastrum anatidium S. arctison S. inflexum S. ophiura
Cont…
S. planktonikum S. sexangulare S. singulum Spirogyra sp
Zygnema sp

Babar & Raje RJLBPCS 2016 www.rjlbpcs.com Life Science Informatics Publications
© 2016 Life Science Informatics Publication All rights reserved
Peer review under responsibility of Life Science Informatics Publications
2016 Jan- Feb RJLBPCS 1(5) Page No.249
CLASS - CHRYSOPHYCEAE CLASS - DINOPHYCEAE
Dinobryon sp Gonyaulax sp Gymnodinium sp
CLASS - BACILLARIOPHYCEAE
Synedra sp Navicula sp Nitzschia sp
CLASS - MYXOPHYCEAE / CYANOPHYCEAE
Aphanocapsa sp Microcystis sp Gloetrichia sp
Zooplankter:
The zooplankter reported from Morawane dam belonged to two major phyla such as Rotifera and
Arthropoda. Phylum Rotifera included 15 genera/species that belonged to class Monogononta; and
2 orders and 7 families. Amongst seven families of Monogononta, the family Brachionideae was
reported to be dominant. Phylum Arthropoda was major group that contained 20 genera/species that
belonged to only 1 class Crustacea, 5 orders and 11 families. Among all the families Cyclopoidae
was reported to be dominant (Table No. 2).

Babar & Raje RJLBPCS 2016 www.rjlbpcs.com Life Science Informatics Publications
© 2016 Life Science Informatics Publication All rights reserved
Peer review under responsibility of Life Science Informatics Publications
2016 Jan- Feb RJLBPCS 1(5) Page No.250
Table No. 2: Zooplankton diversity in Morawane dam.
Phylum Class Order Family Genera
Rotifera Monogononta Ploimida Brachionidae Brachionus calyciflorus
Brachionus forfocula
Kellicottia sp
Keratella cochlearis
Keratella tropica
Notholca sp
Colurella sp
Lecanidae Lecane sp
Notommatidae Cephalodella sp
Notommata copeus
Trichocercidae Trichocerca cylindrica
Trichocerca sp
Synchaetidae Ploesoma sp
Flosculariacea Filinidae Filina sp
Testudinellidae Pompholyx sp
Arthropoda Crustacea Anostraca Streptocephsalidae Steptocephalus diaptomus
Thamnocephalidae Eubranchipus sp
Cladocera Daphnidae Daphnia sp
Moinidae Moina sp
Bosminidae Bosminia sp
Chydoridae Camptocercus sp
Macrothricidae Macrothrix sp
Ostracoda Cypridae Cypris sp
Cyprinotus ostracod
Cyclopoida Cyclopoidae Cyclops sp
Mesocyclops sp
Cyclopoid copepod
Eucyclops sp
Ectocyclops sp
Tropocyclop sp
Nauplius sp
Calanoida Diaptomidae Diaptomus sp
Neodiaptomus sp
Centropagidae Limnocalanus sp
Limnocalanus macrurus
Monthly variations in various groups of zooplankton in the study dam during January 2012 to
December 2013 are depicted in Fig No. 3. The numerical density of Rotifera fluctuated from 934
units/l during November 2012 to 1377 units/l during March 2012. The Anostraca group indicated
numerical density from 148 units/l during July 2012 to 469 units/l during December 2012. The

Babar & Raje RJLBPCS 2016 www.rjlbpcs.com Life Science Informatics Publications
© 2016 Life Science Informatics Publication All rights reserved
Peer review under responsibility of Life Science Informatics Publications
2016 Jan- Feb RJLBPCS 1(5) Page No.251
Cladoceran density ranged between 395 units/l during July 2013 to 901 units/l during January 2013.
The numerical density of Ostracoda ranged from 7 units/l during January 2012 to 204 units/l during
August 2012. The Copepodan density range was from 227 units/l during May 2012 to 1152 units/l
during October 2013. The groups Cladocera, Anostraca and Copepoda showed rather similar trend
where their number was maximum during late monsoon and early winter; and low during June.
Rather opposite trend was shown by group Ostarcoda. Lowest number of Rotifera was reported
during November 2012 and January 2013; and highest from January to April in both the years
(Fig.No.3).
Fig. No. 3: Monthly variation of Zooplankter (units/l) in Morawane dam during January
2012 to December 2013
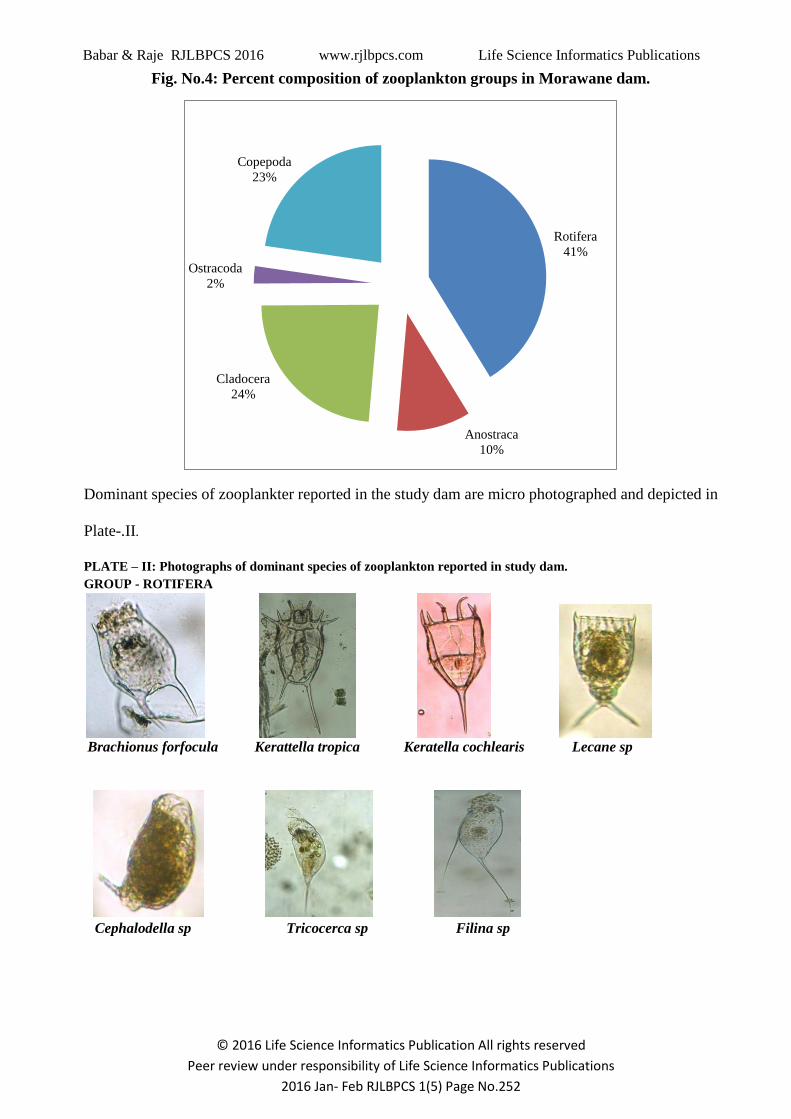
In the present investigation order of dominance of various groups of zooplankton in Morawane
dam was represented as Rotifera (41%) > Cladocera (24%) > Copepod (23%) > Anostraca (10%) >
Ostracoda (2%) (Fig.No.4).
0
200
400
600
800
1000
1200
1400
1600
Jan
-12
Feb
Mar
Ap
r
May Jun
Jul
Au
g
Sep
Oct
No
v
Dec
Jan
-13
Feb
Mar
Ap
r
May Jun
Jul
Au
g
Sep
Oct
No
v
Dec
Rotifera
Anostraca
Cladocera
Ostracoda
Copepoda
Babar & Raje RJLBPCS 2016 www.rjlbpcs.com Life Science Informatics Publications
© 2016 Life Science Informatics Publication All rights reserved
Peer review under responsibility of Life Science Informatics Publications
2016 Jan- Feb RJLBPCS 1(5) Page No.252
Fig. No.4: Percent composition of zooplankton groups in Morawane dam.
Dominant species of zooplankter reported in the study dam are micro photographed and depicted in
Plate-.II.
PLATE – II: Photographs of dominant species of zooplankton reported in study dam.
GROUP - ROTIFERA
Brachionus forfocula Kerattella tropica Keratella cochlearis Lecane sp
Cephalodella sp Tricocerca sp Filina sp
Rotifera
41%
Anostraca
10%
Cladocera
24%
Ostracoda
2%
Copepoda
23%

Babar & Raje RJLBPCS 2016 www.rjlbpcs.com Life Science Informatics Publications
© 2016 Life Science Informatics Publication All rights reserved
Peer review under responsibility of Life Science Informatics Publications
2016 Jan- Feb RJLBPCS 1(5) Page No.253
GROUP – CLADOCERA
Bosmania sp Daphnia sp Moina sp Macrothrix sp
GROUP – CYCLOPOIDA GROUP – CALANOIDA
Cyclopoid copepod Nauplius sp Limnocalamus sp
Population dynamic study of phytoplankton and zooplankton in the study dam during entire study
period indicated that the phytoplankton density was much more than the zooplankton. Both the
phytoplankton and zooplankton densities started declining from May and reached their lowest count
during June and July; and slowly increased to reach their peaks from December to February (Fig.
No.5). Season wise ups and downs in the population size of phytoplankter were followed by the
zooplankter.
Fig. No. 5: Monthly variations of population dynamics of phytoplankton and zooplankton in Morawane dam
during 2012 and 2013
0
1000
2000
3000
4000
5000
6000
7000
8000
9000
Jan
-12
Feb
Mar
Ap
r
May Jun
Jul
Au
g
Sep
Oct
No
v
Dec
Jan
-13
Feb
Mar
Ap
r
May Jun
Jul
Au
g
Sep
Oct
No
v
Dec
Un
its/
L
Month
Phytoplankton
Zooplankton

Babar & Raje RJLBPCS 2016 www.rjlbpcs.com Life Science Informatics Publications
© 2016 Life Science Informatics Publication All rights reserved
Peer review under responsibility of Life Science Informatics Publications
2016 Jan- Feb RJLBPCS 1(5) Page No.254
DISCUSSION:
Phytoplankter:
Phytoplankter are the minute aquatic non motile autotrophs carried by air currents and water currents
and essential in studying photosynthesis, understanding aquatic ecosystems and in production of
useful substances in aquatic body. Their population in aquatic ecosystem is regulated by various
environmental factors (Hutchinson, 1967). Excessive nutrients and organic inputs in water bodies
have led to their eutrophication, which is characterized by increase in phytoplankton nuisance algal
blooms, loss of water clarity and loss of oxygen in bottom waters. Therefore, phytoplankter and their
seasonal succession can be a better predictor of long term environmental changes in the aquatic
environment than the more usual descriptors of biomass and productivity indices (Moline and
Prezelin, 1996). In the present investigation Phytoplankter showed higher densities during winter
and summer. Maximum density of Chlorophyceae was observed during winter particularly in the
months of December and January and minimum during monsoon, particularly in the month of June.
Similar trend was exhibited by Bacillariophyceae and Myxophyceae (Cyanophyceae) in the study
dam. Garcia de Emiliani (1993) reported high density of phytoplankton during summer in the flood
plain lake of Argentina. Kalyani et al., (1999) have recorded two peaks, one in summer and other in
winter, of phytoplankton in Bhadrakali lake. Devika et al., (2006) have reported high population of
Chlorophyceae during summer due to high water temperature and transparency. Laskar and Gupta
(2009) have reported highest number of phytoplankton in pre-monsoon followed by monsoon, post
monsoon and winter in Chatla Floodplain Lake, Assam, but diversity and abundance of
phytoplankton always remains high in summer Wojciechowsk et al., (2007). Rajgopal et al., (2010)
have determined sequence of dominance as Chlorophyceae followed by Cyanophyceae and
Bacillariophyceae in Chinnapperkavil pond and Nallanchettipatti pond, Tamil Nadu and further
stated that Chlorophyceae and Cyanophyceae are tolerant to organic pollution and resist the stress
caused by pollution. Therefore, they may be used as pollution indicators. High phytoplankton density
during April and low during August was recorded by Mahor and Singh (2010) in freshwater reservoir
Ighra, Gwalior, MP. Bacillariophyceae was reported to be dominant group during winter due to weak
light and low temperature in wetlab Ghat in Wular lake (Ganai et al., 2010). Kotadiya and Acharya
(2013) determined maximum count of phytoplankton during summer and minimum during monsoon
in two freshwater bodies in rural area of Ahmadabad. The results of present study well synchronize
with the finding of other researchers. The water bodies having high levels of nutrients and organic
pollution provide favorable conditions to the pollution tolerant species of phytoplankton (Kelly et
al., 1995) to thrive well at low oxygen levels (Mason, 1996). Thus, in general, the periphytic
communities explain the oligotrophic nature of the water body. However, the presence of some
pollution tolerance species belonging to Chlorophyceae, Diatoms, Cyanophyta and blue green
Babar & Raje RJLBPCS 2016 www.rjlbpcs.com Life Science Informatics Publications
© 2016 Life Science Informatics Publication All rights reserved
Peer review under responsibility of Life Science Informatics Publications
2016 Jan- Feb RJLBPCS 1(5) Page No.255
among periphytic component of alga suggested the necessity of a detailed and long term monitoring
of the hydrobiology of water body as a means to protect it from catastrophic degradation due to
anthropogenic impacts (Jithesh, 2008). Mishra et al., (1992) reported common occurrence of
Zygnema species, Microcystis aeruginosa, Oscillatoria, in J. C. mill pond and Gangasagar pond at
Gwalior and also recorded abundance of Spirogyra and Pediastrum simplex along with high
concentration of oxygen in Gangasagar pond. Similar phytoplankton compositions were recorded in
the study dam with comparatively higher density of Pediastrum species and discontinuous
occurrence of Microcystis as its absence was reported from May to August 2013. However, the
occurrence of Microcystis, Oscillatoria represent considerable pollution load (Sawyer 1947, Brook,
1965). In the present study high density occurrence of Microcystis, Oscillatoria and Coleosphaerium
were observed in the dam. It may be due to extreme evaporation of water in summer that might be
the cause for increased organic load in these water bodies. The nitrogen hetrotophic Naviculae and
Nitzschia were reported throughout the study period in the dam indicating its moderate pollution
status. The presence of Microcystis, Oscillatoria, Nitzschia, Navicula, Scenedesmus and
Coleospharium proves meso-eutrophic nature of the dam.
Zooplankter:
Several ecological factors directly or indirectly affect existence and population dynamic of
zooplankton. The larval stages of carps mostly prefer zooplankton because of their high content of
proteins (Dewan et al., 1977). Seasonal fluctuations in the zooplankton population are a common
phenomenon because their population is severely affected by the variation in physico-chemical
parameters of water body. Their association, abundance, seasonal variation, richness and diversity
can be used for assessment of water pollution and for the fishery management. They not only
increase fish production but also help in bioremediation of heavy metals and other toxic materials
(Tapas and Bidhan, 2013). So far about 1700 species of Rotifers have been identified in the world,
of which 500 species have been described from Indian water bodies (Arora and Mehera, 2003; Kiran
et al., 2007; Vasanth Kumar et al., 2011). In most of the Indian water bodies Rotifers have been
reported as most dominant group of zooplankton. The genus Branchionus of the group Rotifera is
the most ancient genus represented by 46 species in India (Harikrishnan, 1995; Sharma and Sharma,
2001). In the present study five groups of zooplanktons such as Rotifera, Copepod, Cladocera,
Anostraca and Ostracoda have been reported in the dam. Group Rotifera showed increase in number
from December to May and successive decline from June to November. It was dominated by
Keratella cochlearis followed by K. tropica and Branchionus forficula and B. Calyciflorus. High
density of Keratella and Branchionus during February to May in Morawane dam might be due to
high temperature, low level of water and increased turbidity due to churning of bottom by wave
action (Pailwan, 2005).

Babar & Raje RJLBPCS 2016 www.rjlbpcs.com Life Science Informatics Publications
© 2016 Life Science Informatics Publication All rights reserved
Peer review under responsibility of Life Science Informatics Publications
2016 Jan- Feb RJLBPCS 1(5) Page No.256
Group Cladocera was represented by five species such as Bosminia sps., Moina sp., Daphnia sp.,
Camptocercus sp. and Macrothrix sp. The percent composition of Bosmonia in these groups was
maximum followed by Moina sp. and Daphnia sp. Presence of Daphnia sp. determines the clear and
non organic pollution status of dam. Major species reported from group Copepoda were Nauplius
sps. followed by Limnocalanus macrurus and Cyclopoid copepod during first year of study but in
the second year their trend was - Nauplius sps > Cyclopoid copepod > Tropocyclop > Ectocyclops.
Group Copepoda showed decline in their number from January to May in Morawane dam with
steady increase from June to December with peak in November and December. The Copepods
usually multiply in the stable environmental conditions but disappear with increasing level of
pollution. This decrease in Copepods and Cladoceras population in summer may be attributed to the
higher temperature (Shivkumar et al., 2001). The winter season remains most favorable period for
growth and multiplication of zooplanktonic species, during which phytoplankton population also
increases. Generally the water bodies situated at higher altitudes are oligotrophic and do not support
the diverse group of planktonic flora and fauna. But the present study dam is located at low altitudes
and supporting moderate number of species of zooplankton indicating mesotrophic conditions.
REFERENCES:
1. Adoni, A. D. (1985): Work book on limnology. Pratibha Publishers, Sagar, 1-126.
2. Arora, Jyoti and Naresh K. Mehra (2003): Species Diversity of Planktonic and Epiphytic Rotifers
in the Backwaters of the Delhi segment of the Yamuna River, with Remarks on New Records
from India. Zoological studies 42(2): 239-249.
3. Battish, S. K. (1992): Fresh water zooplankton of India, Oxford and IBH Publishing House. pp.
233.
4. Bellinger, E. G. and D. C. Sigee (2010): Freshwater Algae: Identification and Use as
Bioindicators. John Wiley and Sons, Ltd. UK.
5. Brook, A. J. (1965): Planktonic algae indicators of lake types with reference to Desmidiceae.
Limno, Oceanoger (10): pp.401-411.
6. Cushing, D. H. (1978): Biological effects of climate changes. P-V. Reu. Cons. Explor. Mer.,
173: 107-116.
7. Devika, R., A. Rajendran and P. Salvapathy (2006): Variation studies on the physico-chemical
and biological characteristics at different depths in model water stabilization tank. Poll. Res. 24.
771-774.
8. Dewan, S., Ali M. and M. Islam (1977): Study on the size and pattern of feeding of fries and
fingerlings of three majors carps, eg. Labeo rohita (ham.), Catla catla and Cirrhina mrigala.
Bangl desh. J. Agri. 2 (2): 2.

Babar & Raje RJLBPCS 2016 www.rjlbpcs.com Life Science Informatics Publications
© 2016 Life Science Informatics Publication All rights reserved
Peer review under responsibility of Life Science Informatics Publications
2016 Jan- Feb RJLBPCS 1(5) Page No.257
9. Edmondson, W. T. (1959): Fresh water biology. 2nd edi . John Wiley and Sons, New York,
USA.
10. Findlay, D. L. and H. J. Kling (1979): A Species List and Pictorial Reference to the
Phytoplankton of Central and Northern Canada - Part – I & II, Fisheries & Marine Service
Manuscript Report No.1503, Western Region, Fisheries and Marine Service Department of
Fisheries and the Environment Winnipeg, Manitoba A3T 2N6, Canada.
11. Fontaine, C. T. and D. B. Revera (1986): The mass culture of rotifers, Branchionus plicatalis,
for use as foodstuff in aquaculture. Proc. World Mariculture Soc. 11:211-218.
12. Gajbhiy, S. N. and B. N. Desai (1981): Zooplankton variability in polluted and unpolluted waters
of Bombay. Mahasagar. Bull. Nat. Inst Oceangr., 4: 173-182.
13. Ganai, A. H., Saltanat P., A. Khan and H. Maryam (2010): Phytoplankton diversity at Wetlab
Ghat in Wular lake, Kashmir. J. Eco. Nat. Envr.Vol. 2 (8):pp.140-146.
14. Garciade Emiliani, M. O. (1993): Effect of water level fluctuation on phytoplankton in a river
floodplain lake system (Parana river, Argentina) Hydribiol. 357, 1-15.
15. Geiger, J.G. (1983): A review of ponds zooplankton productions fertilization for the culture of
larval and fingerlings. Aquaculture 36:353-360.
16. Harikrishnan, K. (1995): Rotifer fauna of Thiruvananthapuram, Kerala, Zoos Print J., 10, 13.
17. Hunding, C. (1971): Production of benthic micro-algae in the littoral zone of a eutrophic lake,
Oikos 22, pp. 389-397.
18. Hutchinson, G. E. (1967): A treatise on Limnology (ii) Introduction to Lake Biology and the
limnoplankton, John Wiley and Sons, Inc. New York, London.
19. Issa, A. A. and M. A. Ismail (1995): Effects of detergents on River Nile water micro flora, Acta
Hydrobiol. 37(2), pp. 93-102.
20. Jithesh, K. R. (2008): Investigation on hydrobiology and water quality parameters of Periyar
Lake, Thekkady, Kerala. Ph.D. Thesis submitted to Mahatma Gandhi University, Kerala.
21. Kalyani, Y. and M. A. Singara charya (1999): Phytoplankton dynamics in Bhadrakali lake,
Warangal, (A.P.) In: freshwater ecosystem in India. (Ed. K. Vijaykumar) Daya Publishing house
Delhi. Pp. 209-719.
22. Kane, J. (1993): Variability of zooplankton biomass and dominant species abundance of Georges
bank 1997-1986. Fish . Bull., 3: 464-474.
23. Kelly, M. G. and B. A. Whitton (1995): The trophic diatom index: a new index for monitoring
eutrophication in rivers, J. Appl. Phycol 7, pp. 433-443.
24. Kiran. B. R., E.T. Puttalah and Devidas Kamath (2007): Diversity and Seasonal Fluctuation of
Zooplankton in Fish Pond of Bhadra Fish Farm, Karnataka; Zoos’ Print Jouirnal, 22 (12): 2935-
2936.
Babar & Raje RJLBPCS 2016 www.rjlbpcs.com Life Science Informatics Publications
© 2016 Life Science Informatics Publication All rights reserved
Peer review under responsibility of Life Science Informatics Publications
2016 Jan- Feb RJLBPCS 1(5) Page No.258
25. Kotadiya, N. G. and C. A. Acharya (2013): Comparative study of phytoplankton diversity in two
freshwater body of rural area of Ahmedabad. Life Science Leaflets. Vol. 4: 85-91.
26. Laskar, H. S. and Susmita Gupta (2009): Phytoplankton Diversity and dynamics of Chatla
floodplain lake, Barak Vally, Assam, North East India-A seasonal study. Journal of
Environmental Biology, 30 (6): 1007- 1012.
27. Ling, H. U. and P. A. Tyler (1986): A Limnological Survey of the Alligator River Region, Part
– II, Freshwater algae, exclusive of diatoms, Research Report - 3, Australian Government
Publishing Service, Canberra.
28. Mahboob, S., A. N. Sheri and T. Fouzia (1993): Effect of physico-chemical factors on the dry
weight of planktonic biomass in the brood stock pond-1, fish seed hatchery, Faisalabad. Pakistan
J. zool., 25: 15-18.
29. Mahor, R. K. and Beena Singh (2010): Diversity and seasonal fluctuation of phytoplankton in
freshwater reservoir Ighra Gwalior (M.P.), Int. Res. J. Vol. 1(10): 51-52.
30. Mason, C. F. (1996): Biology of freshwater pollution, 3rd Edn., Longman Group Ltd., UK,
p.351.
31. Mishra, S. R., Sanjay Sharma and R. K. Yadav (1992): Phytoplankton communities in relation
to environmental condition of lentic waters at Gwalior. J. Env. Biol. 13 (4): pp. 291-296.
32. Moline, M. A. and B. B. Prezelin (1996): Long-term monitoring and analysis of physical factors
regulating variability in coastal Antarctic phytoplankton biomass, in situ productivity and
taxonomic composition over sub seasonal, seasonal and inter annual time scales, Mar. Ecol.
Prog. 145, pp. 143-160.
33. Odum, E. P. (1971). Fundamentals of Ecology, Saunders Publ., Philadelphia, p.574.
34. Pailwan, I. F. (2005): Limnology and fisheries potential of perennial Tanks of Kolhapur district.
Ph. D. Thesis submitted to Shivaji University, Kolhapur.
35. Palmer, C. M. (1980): Algae and water pollution, Castle House Publication Ltd. New York, pp.4-
110.
36. Rajagopal, T., A. Thangamani, S. P. Sevarkodiyone, M. Sekar and G. Archunan. (2010):
Zooplankton diversity and physic-chemical conditions in three perennial ponds of Virudhunagar
district Tamilnadu. Journal of environmental Biology. 31, 265-272.
37. Sarode, S. T. and N. D. Kamat (1984): Fresh Water Diatoms of Maharashtra.Saikrupa Prakashan,
Aurangabad, Maharashtra.
38. Sawyer, C. H. (1947): Chemistry for Sanitary Engineers. McGraw Hill Book Company. New
York.
39. Sharma, B. K. and S. Sharna (2001): Biodiversity of Rotifer in some tropical flood plains lake
of the Brahmaputra river Basin, Assam (N E India). Hydrobiologia, 446, 305-313.

Babar & Raje RJLBPCS 2016 www.rjlbpcs.com Life Science Informatics Publications
© 2016 Life Science Informatics Publication All rights reserved
Peer review under responsibility of Life Science Informatics Publications
2016 Jan- Feb RJLBPCS 1(5) Page No.259
40. Shiel, R. J. (1995): A guide to Identification of Rotifers, Cladocerans and Copepods from
Australian Inland Waters, Identification Guide No. 3, Presented at the Taxonomy Workshop held
at The Murry-Darling Freshwater Research Centre, Albury, 8-10 February 1995.
41. Shivakumar, K., P. Sujatha, and K. Altaff (2001): Studies on the freshwater copepods and
cladocerans of Dharmapuri District, Tamilnadu. J. Aqua. Biol. Vol. 16 (1&2): 5-10.
42. Smith Gilbert M. (1951): Manual of Phycology. An Introduction to the Algae and their Biology
Waltham, Mass., U.S.A., Chronica Botanica Company. 375
43. Tapas, Kumar Datta and Patra C. Bidhan (2013): Biodiversity and seasonal abundance of
Zooplankton and its relation to physico-chemical parameters of Jamunabandh, Bishnupur, India.
Int. J. Sci. Res. Publi. Vol. 3 (8): 1-7.
44. Thomas, D. P. (1983): A Limnological Survey of the Alligator River Region, Northern Territory,
Part – I. Diatoms (Bacilariophyceae) of the Region, Research Report - 3, Australian Government
Publishing Service, Canberra.
45. Vasanth, Kumar B., P. V. Kajure and S. V. Roopa (2011): Aqua chemistry, Zooplankton nad
bacterial diversity in three ponds of Karwar district , Karnataka. Recent Res. Sci. Techn. 3 (4):
39-49.
46. Vashishta, B. R., Sinha A. K. and V. P. Singh (2008): Botany for degree students Algae. S.
Chand and Company Ltd. Ram Nagar New Delhi – 110055. Pp - 544.
47. Wetzel, R. G. (1975): Limnology, W. B. Saunders Company, Taronto. Pp. 743.
48. Wojciechowsk, W., A. Pasztaleniec and M. Solis (2007): Diversity and dynamics of
phytoplankton in floodplain lakes (Bug river, Estem Poland).Int. J. Oceangr. Hydrobiol.
XXXVI, 199-208.
49. Wu, J. (1999): A generic index of diatom assemblages as bionindicator of pollution in the
Keelung river of Taiwan, Hydrobiologia 397, pp.79-87.
50. www.algalweb.net