original research vertical distribution characteristics
TRANSCRIPT

Pol. J. Environ. Stud. Vol. 30, No. 6 (2021), 5811-5831
Original Research
Vertical Distribution Characteristics and Source Apportionment Of Heavy Metals in Urban
Near-Surface Dust Based on Receptor Model
Hui-Liang Wang1, 2, Chen-Yang Shen1, Peng-Lin Li1, Muhammad Faisal1, Shuang Zhu3*
1College of Water Conservancy Engineering, Zhengzhou University, Science Avenue No. 100, Fengyang Street, Zhongyuan District, Zhengzhou City, Henan Province, 450001, P. R. China2Zhengzhou Key Laboratory of Water Resource and Environment, Science Avenue No. 100, Fengyang Street, Zhongyuan District, Zhengzhou City, Henan Province, 450001, P. R. China
3School of Basic Medical Sciences, Zhengzhou University, Science Avenue No. 100, Fengyang Street, Zhongyuan District, Zhengzhou City, Henan Province, 450001, People’s Republic of China
Received: 7 January 2021Accepted: 18 May 2021
Abstract
The attention has been paid to high-rise environmental quality on account of human activities extension into vertical space and it was expected to identify the pollution sources first for contaminants disposal in the atmospheric environment. Eighteen urban road dust samples (RDS) and eighteen high-rise dust samples (HRD) were investigated in Zhengzhou, China. The descriptive statistical characteristics of heavy elements (HEs) concentrations in RDS and HRD were preliminarily analyzed, and combined with the features of sampling sites and functional areas, element characteristics in the two dust sample types were compared. As and Cu concentration in HRD are higher than those in RDS in most regions (>80%). According to pollution index (PI), Hg and Cd in both HRD and RDS are subject to considerable contamination and very high level of contamination, respectively. Overall, HEs in commercial area samples exceed those in other two functional areas of education area and residential area. High-rise dust samples from more than 85% of the study sites present extreme potential ecological risk; road dust samples from nearly half of the study sites present considerable risk and one-third of the study sites are at moderate risk. Based on the receptor-oriented source apportionment model of APCS-MLR, pollution sources contribution in RDS is concentrated in PC1 (construction industry and transport vehicle parts wear, 95.14% to Cu), while pollution sources contribution in HRD is concentrated in PC2 (corrosion of roof stainless steel products due to chronic air exposure, 71.20% to Cr). The significant correlation coefficient between measured and predicted concentrations of HEs
*e-mail: [email protected]
DOI: 10.15244/pjoes/137665 ONLINE PUBLICATION DATE: 2021-11-22

Wang H.L., et al.5812
Introduction
In the process of the rapid advancement of urbanization, human activity space has been greatly extended in height and high-rise buildings are ubiquitous, especially in urban cities [1, 2], which lead to an expectation of upper air quality in the modern city. Compared with road dust [3], the atmospheric dry sedimentation particles that sink on the top layer of city buildings can better reflect the contamination status of heavy elements (HEs) adsorbed in the atmospheric particulate matter. This is because pollutant content in road dust is not only affected by dry atmospheric precipitation, but also by vehicle exhaust, human activities, surface point source pollution and cleaning conditions [4, 5]. In addition, dust particles deposited on high-rise buildings would transport to the near-surface air and roads due to the interference of external environment such as wind [6, 7], while road sediment can also be re-suspended through a series of surface events and return to the atmosphere. Under rainfall, snowfall, stormwater or other meteorological conditions, through the scouring effect of runoff, the contamination particles from the roads and the dust from the high-rise buildings are brought into the urban pipelines, which become the main source of non-point contamination in urban waterbodies [8, 9]. Combining localized high emission factors and high-resolution activity data at the county level in Shandong, China [10], Zhao et al. classified emission sources into biomass burning, dust, fossil fuel combustion, industrial production processes, solvent utilization, waste disposal, and on-road vehicles, and the six pollution sources will also affect the concentration of contaminations in particulate matter in other cities. Preliminary analysis of heavy metal contamination in urban dust mainly concentrated in roads, such as urban streets [11], low impact development construction sites [12], school playground [13, 14], suburban avenues [9, 15] and so on. However, during the sampling process, the research on HEs in road dust is limited by point source pollution, which results in a small range of pollution characteristics represented by the collected samples. Li and Zhang investigated and analyzed the content of Cd, Cr, Pb, Cu, Ni, Ca, Fe and Zn in the urban dust of public corridor windows in three different high-rise buildings in Guiyang city [1]. The results showed that the distribution difference of dust deposition fluxes along the vertical space height was highest in winter, followed by summer, and the vertical space difference was relatively lower in spring and autumn [1]. Comparatively, as a direct production of atmospheric dry deposition, high-rise dust is less
influenced by human activities on the surface, and HE contents of the dust samples has a certain reference value for chronic pollution assessment within the study area. By comparing the concentration and contamination level of HE in high-rise dust (HRD) and urban road dust samples (RDS), the vertical variation of pollutants in dust can be analyzed in this paper, and the influence of human activities on the content of HE can also be studied.
Risk-based atmospheric management depend upon finding environmental contamination sources, affecting factors, pathway, mechanism of circulation and the exposed population [13]. Identifying the sources of pollutants and making clear the contribution of each pollution source to pollutants will undoubtedly be conducive to formulate targeted policies for more effective control of contaminant diffusion, and provide data reference and support for research projects on urban environmental cleanliness and improvement in the region [16, 17]. On account of different surrounding environment and interfering factors, there are some divergences in HE concentration and source between high-rise building sediments and urban road dust. At present, the more mature receptor models for qualitative and quantitative analysis of pollution sources include chemical mass balance (CMB) [18], potential source contribution (PSCF), positive matrix factorization (PMF) [19], Unmix [20], and absolute principal component analysis followed by multiple linear regression (APCA-MLR) [21, 22], which are all based on the physical and chemical characteristics of contaminant. Among them, CMB is the most precise and accurate model, but it requires to provide the pollution source profiles in advance [23]; PMF and APCA-MLR were often chosen for analyzing by researchers [4, 19, 20]. Guan et al. used PMF, APCA and Unmix receptor models to compare and analyze the source apportionment of heavy metal in 92 farmland sample sites in Wuwei, China, and found that APCS had a minimum error with outstanding effect, and could accurately reconstruct the contribution matrix [24]. By analyzing multiple source identification models, Huang et al. [16] obtained a conclusion that APCA-MLR model is preferable in the moderate contamination sites, while, Principal component analysis followed by multiple linear regression with distance (PCA-MLRD) model fits better in the high range of heavy element concentrations. In view of our previous preliminary research results in Zhengzhou [25], the operation method of APCA-MLR model was chosen in this paper for source identification.
The following three study directions were carried out in this article: (a) the concentration values of heavy
(R2>0.80 for most HEs) suggests that the source contribution analytical model of APCS-MLR has a good performance for the heavy metal data in urban dust samples.
Keywords: high-rise dust, heavy metal, pollution source identification, absolute principal component analysis, multiple linear regression

Vertical Distribution Characteristics and Source... 5813
metals in RDS and HRD were analyzed by multivariate statistics, and the vertical distribution characteristics of heavy metals in near-surface dust were preliminarily explored; (b) the influence mechanism between RDS and HRD was understood through comparing the difference of metal characteristics between them in each research site and different functional areas; (c) by combining principal component analysis with multiple linear regression, this paper makes an in-depth exploration of the discrepancy of heavy metal sources and the contribution of each contamination source in the dust at different heights in Zhengzhou. These findings are expected to provide scientific data and recommendations for the later atmospheric environment governance in Zhengzhou and implementation of some strategic decisions made by urban environmental health administration departments.
Materials and Methods
Study Area
Zhengzhou (112.7°-114.2°E, 34.3°-34.9°N), as the capital of Henan Province, is an essential key city in the central region of China and a particularly important national comprehensive transportation hub. As of December 2019, the resident population of the city was estimated to be 10.352 million. It was further estimated that the number of vehicles in the city had
surpassed 4,500,000 motor vehicles and 3,000,000 registered non-motor vehicles. Due to the high density of population and vehicles, the city inevitably faces some environmental problems, especially in the commercial districts and other areas where human activities are relatively intensive. Due to the limitation of high-rise sampling in park and industrial zones, sampling analysis was implemented on three functional areas (Educational Area (EA), Commercial Area (CA), Residential Area (RA)) in Zhengzhou. Zhengzhou university has the largest number of students in China and the largest campus area among all universities in Henan province. EA1 is its new campus, located in the northwest of Zhengzhou city; EA2 is its north campus, located in the center of Zhengzhou city. Longzihu College Park, also known as Longzihu university town, is located in new district of east Zhengzhou. It contains fifteen colleges and universities. As the school with the largest number of students and a relatively larger area among them, EA3 was selected as a research sampling site. EA3 and EA4 are the two campuses of the same university; EA4 is located in the north of Zhengzhou city, and EA5 is located in the south of Zhengzhou. CA1 and CA2, lied in the center of the city, are two typical business districts in Zhengzhou. In addition, by reason of restriction of the actual vertical sampling, residential area samples were only sampled at RA1. The spatial distribution diagram of all research sampling points is shown in Fig. 1.
Fig. 1. The location of each sampling site and the corresponding satellite map in Zhengzhou, China.

Wang H.L., et al.5814
Sample Collection
To study the vertical distribution characteristics of heavy elements in near-surface dust among different functional areas in Zhengzhou, a total of 36 samples were collected (18 urban road dust sediment samples and 18 high-rise dust samples) in eight research locations. In order to comprehensively consider the heavy elements contamination at the sampling sites, three sub-samples were investigated at each sampling site of EA1, EA3, RA1, CA1 and CA2. However, only one sample point was set for each site of EA2, EA4 and EA5 due to the limitation of the high-level samples collection process. All the road dust samples were obtained by collecting within a distance of approximately 10m along the roadside [25] and the high-rise samples were obtained by collecting within 10m2 on the roof of the building about 30 meters high; the weight of each sample was >100g [26]. A plastic brush and dustpan were employed to gather dust specimens and a clean hairbrush was used to transfer dust from the dustpan into a self-sealing polyethylene bag. The sampling tools would be cleaned after each sample collection to avoid the mixing of the dust retained in the brush and dustpan with the newly collected samples, which preventing the contamination between samples and improving the quality of determination. The resulting samples were stored in a laboratory refrigerator (4ºC) as quickly as possible before analyzing.
Measurement of Element Concentration in Dust Samples
Since fine-grained surface sediments is a good carrier of heavy elements [27, 28], all dust samples in this study were air dried and careened through a 100-mesh sieve (<150 μm) to determine the concentration of chromium (Cr), nickel (Ni), copper (Cu), zinc (Zn), arsenic (As), cadmium (Cd), lead (Pb) and mercury (Hg) according to previous studies on heavy elements by scholars [29, 30, 31]. 0.1 g dust sample was digested in a teflon digestion tank by using HNO3-HF-HClO4 on a graphite digestion apparatus in the fume hood to detect Cr, Ni, Cu, Zn, As, Cd and Pb. After the digestion was complete, the gestion solution in the tank was transferred to a 25 mL colorimetric tube, and the residual solution on the inner wall of the lid and the inside of the tank were cleaned with ultra-pure water at least three times. All the washings were also collected in the tube, and then placed on the ICP-MS instrument for the determination of element concentration values after constant volume [32]. Electric-heated thermostatic water bath combined with atomic fluorescence spectrometry was employed to determine Hg content in all dust samples [33, 34]. More detailed experimental procedures have been mentioned in our previous study [25].
Experimental QA/QC (Quality Assurance/Quality Control)
The series of certified reference materials (CRMs) for the chemical composition of soil (GSS 1-31), which were developed by Geophysical and Geochemical Prospecting Institute of Academy of Geological Sciences of Chinese, are mainly used as the reference standard of geology, geochemical and mineral survey, and for the quality monitoring in China [25]. In order to guarantee the accuracy of sample data in this paper, 10% of the parallel samples (N = 4), 10% of the CRMs (GSS-8 (N = 2) and GSS-11 (N = 2)) and two blank samples were measured during the experiment [35]. The correlation coefficient of the established standard curve is greater than 0.999 and two intermediate concentration points of the standard curves were established (one point for every 20 samples). The analysis results show that the two relative deviations between the measured results and the actual concentration values were both <10% and finally, zero analysis of the standard curve was conduct, which indicated that the relative deviation between the measurement result and the actual concentration value was <30%. As shown in Table 1, the experimental results meet the requirement that the relative standard deviation (RSD) of element concentration in each group of parallel samples is less than 30%; content detection values in CRMs are within the detectable range of certified values [35]. In addition, the two blank samples were found to be undetectable HE concentrations that were clearly below the method LOD values.
Evaluation of Pollution Levels
There are many evaluation indicators for assessing heavy metal pollution level of urban dust, including geo-accumulation index (Igeo) [36], contamination factor (CF) [30], pollution index (PI) [24, 31], ecological risk index (ERI) [37], pollution load index (PLI), etc. In this paper, PI value is selected to measure the pollution degree of each HE in each sample in the study area, and PLI is used to evaluate the comprehensive contamination level of all HEs in a certain point [29].
Pollution Index (PI)
Pollution index method was used to evaluate the contamination level of a certain element by comparing the content of HMs in dust with that in the background soil [38]. The calculation formula is as follows:
i / iPI C B= (1)
...where, Ci means the concentration of element i in dust samples; Bi indicates the concentration of element i in the background soil of Zhengzhou. The evaluation criteria for pollution levels are as follows:

Vertical Distribution Characteristics and Source... 5815
no contamination (PI<1), low level of contamination (1≤PI<2), middle level of contamination (2≤PI<3), considerable contamination (3≤PI<6), and very high level of contamination (6≤PI).
Pollution Load Index (PLI)
The assessment method of pollution load index was proposed by Tomlinson et al. [39] to analyze the pollution load of a certain location through the superposition of different elements. The value of PLI is calculated by the following equation:
n1 2 3 nPLI PI PI PI PI= × × × ×L
(2)
According to the computed results, the pollution degree of the site to be analyzed is divided into three categories: <1 indicates that there is no heavy element pollution [40]; the pollution level is moderate when PLI is greater than 1 and less than 2 [28]; and much more attention need to be paid and some remedial measures should be implemented when the PLI value of a place is greater than 2.
Potential Ecological Risk Index (RI)
The evaluation index of potential ecological risk, originated from Hakanson [41], can be applied to assess the level of heavy metal pollution in urban dust [31]. It is denoted by:
1
nir
iRI E
== ∑
(3)
=i i i
r r fE T C× (4)
= /i i if n nC C B
(5)
...where RI (ecological risk index) is the sum of ecological risk factors (Er
i); n is the heavy metal species studied in this paper, which is 8; Er
i is the monomial potential ecological risk factor for i species; Tr
i is the toxic response factor for a given metal –1 for Zn, 2 for Cr, 5 for Cu, Ni and Pb, 10 for As, 30 for Cd, and 40 for Hg [25, 31, 41]; Cf
i is the contamination factor of i and numerically equal to PI value; Cn
i and Bni are the same
as the variables Ci and Bi defined in Eq (1), respectively.According to the calculation of Er
i and RI, the ecological risk levels caused by metal elements in dust are described: Er≤40 or RI≤150 indicates low potential ecological risk; 40<Er≤80 or 150<RI≤300 indicates moderate potential ecological risk; 80<Er≤160 or 300<RI≤600 indicates considerable risk; 160<Er≤320 or 600<RI indicates high risk; Er>320 indicates extreme risk.
Tabl
e 1.
Par
amet
ers a
nd e
xper
imen
tal v
alue
s in
the
proc
ess o
f QA
/QC
for h
eavy
ele
men
ts c
once
ntra
tion
dete
rmin
atio
n.
Hea
vy m
etal
sC
rN
iC
uZn
As
Cd
PbH
g
RSD
of e
ach
grou
p of
par
alle
l sam
ples
2.24
%2.
62%
4.29
%6.
04%
5.27
%5.
11%
0.32
%7.
98%
3.12
%0.
01%
25.6
7%11
.73%
2.04
%6.
23%
5.06
%24
.77%
5.75
%6.
19%
4.30
%4.
47%
7.98
%14
.91%
4.89
%8.
82%
6.96
%2.
68%
9.76
%16
.29%
17.1
7%6.
11%
1.52
%17
.39%
LOD
21
0.6
10.
40.
092
0.00
2
LOQ
84
2.4
41.
60.
368
0.00
8
GSS
-8
(GB
W07
408)
Cer
tified
da
taSV
(mg/
kg)
6831
.524
.368
12.7
0.13
210.
017
U (m
g/kg
)6
1.8
1.2
41.
10.
022
0.00
3
Mea
sure
d da
ta (N
= 2
) (m
g/kg
)63
, 70
30.9
, 32.
023
.7, 2
4.4
66, 7
112
.0, 1
3.3
0.13
, 0.1
420
, 23
0.01
6, 0
.019
GSS
-11
(GB
W07
425)
Cer
tified
da
taSV
(mg/
kg)
5925
.421
.465
7.4
0.12
524
.70.
060
U (m
g/kg
)3
1.3
1.2
50.
50.
012
1.4
0.00
9
Mea
sure
d da
ta (N
= 2
) (m
g/kg
)57
, 60
24.8
, 26.
021
.0, 2
1.7
64, 6
87.
1, 7
.60.
119,
0.1
2824
.5, 2
4.9
0.05
9, 0
.064
Not
e: G
SS-8
: Luo
chua
n lo
ess o
f Sha
nxi P
rovi
nce;
GSS
-11:
soil
of L
iaoh
e Pl
ain;
SV:
Sta
ndar
d va
lues
; U: U
ncer
tain
ty
...

Wang H.L., et al.5816
Source Identification and Calculation of Contribution from Each Source
Based on the principal component analysis (PCA) combined with multiple linear regression (MLR) method for pollution source identification first proposed by Thurston and Spengler [22], the results of absolute principal component sore calculation and the measured concentration are treated as independent and dependent variables respectively, to carry out MLR simulation. Further compute is conducted for the contribution values of each component to each heavy element, and the accuracy of the model is observed through R2 and the comparison between measured and simulated value [21, 41].
Source Identification Using Principal Component Factor Analysis (PCFA)
Principal component analysis enables the first principal component to consider data changes as much as possible by using the orthogonal decomposition approach [24]. In the analysis process, each principal component was sequentially grouped according to maximum variance by observing the correlation between variables, so that the correlation between observed variables within the group was high, and the correlation of observed variables between different groups was low or even no correlation. The score variables of principal component factors affecting the content of HE in urban dust samples were calculated by the following model [16].
( )ik 1
p
z ij jkj
A a f=
= ∑ (6)
( )=ij ij j jZ C C σ−
(7)
...where, Cij is the concentration of jth chemical type in i observation point; C̄ j and σj are the mean concentration and standard deviation of j metal respectively.
Absolute Principal Component Score (APCS)
As a standardized value, Az cannot be used to calculate the original contribution of principal component directly. Only by subtracting the true zero factor score from the true sample score can the standardized factor scores be converted into the non-standard absolute principal component scores for the analysis of principal component contribution to pollutants [16, 21, 24]. The specific calculation formula is derived as followed.
( ) ( )0 j0 j jZ C σ= −
(8)
( ) ( )p
0 kj 01k jj
A S Z=
= ∑ (9)
( ) ( )z 0iik k kAPCS A A= −
(10)
...where, (Z0) is the contaminant concentration with standardized zero value in the sample; Skj is the factor score coefficient; APCSik is the absolute principal component scores; (A0)k is the score value of principal component under 0 value.
Pollution Source Contribution Calculation
Taking the measured HE concentration at each sample as the dependent variable and the corresponding APCS values as the independent variable, Multivariable linear regression (MLR) was conducted to obtain the regression coefficient of the regression equation and then determine the contribution rate of each principal component to each pollutant [42].
(11)
Contribution ratio of pollution source k to metal j concentration in dust:
(12)
Contribution ratio of unidentified source m to jth chemical type:
(13)
...where, akj is the regression coefficient of pollution source k to pollutant j; akj g APCSkj represents the contribution of source k to pollutant species concentration Cj; and bj is the constant term of MLR equation; APCSkj is the mathematic average of absolute principal component factor score in all samples of pollutant j.
Statistical Analysis
SPSS software was employed to obtain the descriptive statistical characteristics results of dust concentration data and analyze the correlation between heavy elements by Pearson correlation coefficients at different two-tailed test levels. Geographic Information System (ArcGIS) was mainly applied to draw the location map of sampling points. Moreover, other graphics in this paper were rendered by Origin and Python software.

Vertical Distribution Characteristics and Source... 5817
Results and Discussion
Analysis of Heavy Metal Pollution Characteristics of Near Surface Dust
Statistics Characteristic Description of Heavy Metal Concentration in Urban Dust
Based on the comparation of HEs concentration between road and high-level dust, other elements concentration in HRD are greater than that in RDS with the exception of Cu (Table 2). While the variance coefficient of heavy elements content, except for Zn, in HRD are lower than that in RDS, indicating that the diversity of human ground activity in different areas of the city has an effect on the concentration of heavy elements and chemical properties in road dust [12, 28]. No matter in RDS or in HRD, the concentration of Pb and As show little difference at different sampling points (CV values are all about 30%), which to some extent indicates that arsenic is a crust constituent element, and also implies that the prohibition of leaded petrol has played a certain role in Zhengzhou in recent decades, causing a small discrepancy of Pb concentration. By contrast, the concentration of Hg,
Cd, Zn, and Cu differ greatly among samples, and the same Zn variability was also found in Guiyang City [7]. The Zn, Pb, Cr, As and Hg concentration in HRD is relatively dispersed, according to the comparison of standard deviations values of HEs in RDS and HRD, while the content of other metals is more concentrated in HRD samples. Interestingly, the skewness of Pb concentration is negative in HRD but positive in RDS, which means more distribution of low lead concentration in HRD and high lead concentration in RDS. Furthermore, Cu, Zn, Cd, Pb and Hg content in RDS and HRD were all higher than those in Zhengzhou and China background soil values; the As concentration in HRD exceeded the background soil values in China, but that in RDS was lower than the background soil values in Zhengzhou. The mean concentration of heavy elements in all collecting samples were in the order of Zn>Pb>Cr>Cu>Ni>As>Cd>Hg both in RDS and HRD (Table 2), which is roughly the same as the order of the metal concentration in the dust from different floors in Guiyang [7]. Distinguishingly, in road dust samples of commercial districts (Table 3), the Cr concentration was higher than the Pb concentration, which is an expression of higher chromium accumulation in densely populated urban areas.
Table 2. Summary statistics of road and high-level dust heavy metal concentrations (mg/kg) for three different functional areas in Zhengzhou, China.
Element Cr Ni Cu Zn As Cd Pb Hg
Road dust
Min 25.08 7.74 10.73 63.68 8.03 0.23 28.44 0.04
Max 81.38 30.49 159.76 328.68 16.29 4.73 76.83 0.78
Mean 47.64 14.49 36.19 162.29 10.70 1.05 51.54 0.16
Median 46.76 13.09 29.67 133.94 10.53 0.61 48.31 0.09
SD 15.27 5.70 32.35 80.13 2.27 1.23 16.21 0.18
CV 0.32 0.39 0.89 0.49 0.21 1.17 0.31 1.13
Skewness 0.88 1.64 3.61 0.95 1.30 2.20 0.30 2.65
Kurtosis 0.35 2.87 14.31 0.072 1.59 4.48 -1.31 7.64
High-rise dust
Min 26.74 8.48 12.05 81.12 9.12 0.33 26.25 0.05
Max 94.78 28.23 57.34 1319.29 20.42 3.24 104.69 0.80
Mean 53.96 18.07 33.64 356.51 13.47 1.57 74.59 0.19
Median 51.91 18.87 28.15 247.90 12.44 1.69 74.97 0.13
SD 16.12 5.07 14.26 325.21 2.63 0.70 20.73 0.19
CV 0.30 0.28 0.42 0.91 0.20 0.45 0.28 1
Skewness 0.51 0.05 0.50 2.13 1.21 0.34 -0.83 2.47
Kurtosis 1.44 -0.27 -1.12 4.45 1.88 0.55 0.55 6.21
Background soil values of Zhengzhou 64 21 14 42 8 0.08 18 0.023
Background soil values of China 62.5 28.9 21.4 69.4 11.1 0.11 21.4 0.03
Note: SD = Standard Deviation; CV = Coefficient of Variance

Wang H.L., et al.5818
Vertical Distribution of Heavy Metal Concentration in Road and High-Rise Dust
It can be concluded that, according to the Fig. 2, the Cr concentration in RDS were lower than that in HRD in EA and RA, except for the location of EA3(3) and EA4(1); conversely, the content of Cr in RDS were higher than that in HRD in CA, except for the location of CA2(1). In addition, the relative standard deviation (RSD) of Cr concentration in RDS were all lower than that in HRD in each functional area (Table 3), which indicates that there is minor difference of chromium content in RDS samples in each part of the city. Surprisingly, the RSD of Cr in road dust were higher than that in HRD in all locations, which suggests that the variations of Cr content of road dust in all collecting samples were greater than that of HRD and the difference of Cr metal in RDS is more significant than that in HRD among different functional areas in Zhengzhou. In all functional areas, the Ni content of HRD were all greater than that in RDS (Table 3) and this general trend is consistent with conclusion of Zhang et al. [7] that heavy metal content in dust gradually increases with floor height; whereas, as can be seen from Fig. 2, the Ni concentrations of road dust were higher in EA1(3), EA3(3), EA4(1) and CA1(2), which can be attributed to the existence of urban surface point source pollution in campus and business districts. The RSDs of Ni in RDS are larger than that in HRD, implying that the Ni concentration of dust is greatly affected by human activities on the ground.
Among educational areas, Cu concentrations in RDS were lower in EA1(1), EA1(2), EA3(1), EA3(2), and EA4(1), but higher in EA1(3), EA2(1), EA3(3), and EA5(1) compared with that in HRD. The concentrations of Cu in RDS were a little higher than that in HRD in RA1. Interestingly, RDS and HRD represent high Cu concentration at the same point of CA1(2) (Fig. 2). And the content of Cu in RDS is higher than that in HRD in CA1, while only one point has higher copper content in RDS in CA2, and the other two sampling points have higher Cu content in HRD. Generally, the Zn concentrations in RDS are lower than that in HRD, which might be the result of long-term accumulation of deposition on the building. However, the higher concentration of Zn in RDS in EA1(2), EA3(3), EA4(1) and CA1(2) can attribute to the urban ground point source pollution. Analogously, arsenic concentrations in RDS are lower than that in HRD, except in EA3(2), EA4(1) and CA1(2), where the contents of As are higher in RDS. And the Cd concentrations in RDS are lower than those in HRD, except in EA3(3), EA4(1), CA1(2) and CA2(2). Except for the points of EA3(3), EA4(1), CA1(1), CA1(2), the Pb contents of RDS in other sampling points are lower than that of HRD. The concentrations of Hg in most of the sampling sites were not significantly different between RDS and HRD. The highest Hg concentration of HRD was found at the sampling point of EA4(1) and the highest Hg concentration of RDS was found at the sampling point of CA1(2).
Table 3. The mean concentration of heavy elements and relative standard deviation (RSD) in road and high-level dust samples collected from different functional areas of Zhengzhou, China.
Elements Cr Ni Cu Zn As Cd Pb Hg
EA
Road DustConcentration 37.73 14.77 24.32 169.05 11.07 0.96 45.26 0.11
RSD 20.22% 48.27% 39.97% 52.43% 18.27% 108.97% 31.93% 88.23%
High-level Dust
Concentration 49.06 17.81 29.63 290.50 13.26 1.49 70.01 0.19
RSD 33.02% 37.87% 49.78% 100.63% 13.97% 60.24% 36.44% 121.94%
CA
Road DustConcentration 63.71 14.38 56.78 182.41 10.87 1.41 62.57 0.26
RSD 21.72% 36.69% 90.19% 44.10% 28.04% 125.31% 27.11% 109.76%
High-level Dust
Concentration 60.98 17.68 43.31 528.22 14.99 1.49 79.80 0.23
RSD 29.87% 19.47% 29.68% 76.71% 21.65% 31.32% 17.59% 72.51%
RA
Road DustConcentration 45.24 13.84 30.66 101.77 9.27 0.61 48.34 0.09
RSD 14.87% 10.91% 8.03% 8.10% 6.16% 13.57% 22.66% 80.67%
High-level Dust
Concentration 54.64 19.61 26.30 211.14 11.07 2.00 77.94 0.09
RSD 15.59% 8.03% 12.82% 39.62% 15.31% 17.52% 24.53% 70.06%
All locations
Road DustConcentration 47.64 14.49 36.19 162.29 10.70 1.05 51.54 0.16
RSD 32.05% 39.36% 89.37% 49.38% 21.18% 117.27% 31.45% 118.46%
High-level Dust
Concentration 53.96 18.07 33.64 356.51 13.47 1.57 74.59 0.19
RSD 29.87% 28.06% 42.40% 91.22% 19.52% 44.77% 27.79% 102.11%

Vertical Distribution Characteristics and Source... 5819
Fig. 2. The scatter plot of the concentration of each element at all the sampling locations.

Wang H.L., et al.5820
The Difference and Comparison of Heavy ElementPollution in Different Functional Areas
From the Table 3, the orders of Cr and Pb concentration in both RDS and HRD and Cu concentration in road dust in different functional areas are CA>RA>EA, while the order of Cu concentration in HRD in different functional areas is CA>EA>RA. Huang et al. [43] investigated twenty-four topsoil samples around a slag disposal site in west Panzhihua by using lead isotopic compositions and discovered that the anthropogenic lead sources of coal and ore smelting slag were more likely to undergo chemical transfer. Cr and Cu are concentrated in RDS related to traffic discharge and have a bearing on tyre abrasive wear [11]. The three functional zones, especially commercial areas, are characterized by dense population and large vehicular traffic, under this circumstance, which may
lead to poor air ventilation within the region and easier to cause metal accumulation. The concentration of Zn and Hg both in road dust and high-level dust, As concentration in HRD and Cd concentration in RDS in different functional areas are listed in the order of CA>EA>RA (Table 3). The Ni and As content in RDS are highest in EA, followed by CA and RA, while the Ni and Cd content in HRD are highest in RA, followed by EA and CA. However, in general, there was no significant difference of Ni content in both RDS (p>0.95) and HRD (p>0.85) among various functional areas, and the same no significant difference (p>0.50) occurred in As of RDS and Cd of HRD. This finding mirrors the results from the previous studies of Li et al. [1] that the distribution discrepancy along the vertical spatial height of HEs concentration in summer dust is not obvious, based on the analysis of three sampling sites in Guiyang on different floors in four seasons.
Fig. 3. Boxplot of PI values of each element in sampling road dust (above) and high-rise dust (below).

Vertical Distribution Characteristics and Source... 5821
Heavy Metal Pollution Degree of Near Surface Dust
Pollution Level Assessment
Due to the different sources of heavy elements and the different influences of human activities on the heavy elements content, the pollution degree of each heavy element in the research area is different. According to PI values, the order of heavy metal pollution level in road dust is: Cd>Hg>Zn>Pb>Cu>As>Cr>Ni, and similar sequencing occurs in high-level dust samples: Cd> Zn>Hg>Pb>Cu>As>Ni>Cr (Fig. 3), which is consistent with the conclusions of previous scholars [5].
Either in RDS or in HRD, there was no contamination of Cr and Ni in most areas (72~89%) and low-level contamination of As in the vast majority of study areas (83~94%). That’s why researchers judged arsenic in the dust to be mostly from natural sources [34]. Compared with Zhengzhou background soil, the RDS and HRD samples were moderately polluted with Cu (mean PI values were 2.59 and 2.40, respectively). According to Fig. 3, it shows that the differences of Cu and Pb pollution in different locations of high-level dust are relatively larger than those of road dust samples, and the vast majority (89%) of HRD samples are at considerable lead contamination levels. This could be due to long-term accumulation of heavy elements in high-rise dust and the difference of human activity characteristics at different sampling points.
In addition, nearly half of HRD (44%) in the study sites were exposed to very high level of Zn contamination, while in road dust samples, half of the study sites (50%) were under middle zinc pollution level, which is relevant to the fact that urban road cleaning is much more frequent than HRD cleaning. However, in 17% of the road dust samples in the study sites, the zinc PI values are >6, especially in the sampling point of CA1(2) (PI = 7.79), which requires some measures to address the problem of high zinc concentration in urban dust. Except for a few sites, the distributions of mercury PI value of RDS and HRD in the research locations are relatively concentrated, and the median value of the data is between 3 and 6, which belongs
to considerable contamination [34]. The evaporative properties of Hg coupled with air circulation, makes it more widespread, and it is insoluble in water, so it is not desirable to improve atmospheric or road Hg pollution condition through spraying. Therefore, focusing on the analysis of pollution sources and reducing the consumption of mercury products may be an effective way to solve the problem of Hg contamination. As the metal with the highest PI value in dust samples, Cd is often used in alloy manufacturing, electroplating, rechargeable batteries, etc. Cadmium-polluted air and food have strong toxic hazards to the human body and metal metabolism is slow in the human body, hence, it is necessary to strengthen the detection of Cd emission in daily life and production, and further treatment measures should be implemented in the urban dust where existing high cadmium pollution levels.
As shown in Table 4, the average PLI values of HRD in each functional area are all higher than those of RDS under corresponding functional area, which indicates that there is an obvious accumulative effect of heavy elements in HRD. The PLI values of eight studied heavy elements are all highest in commercial areas, no matter in road dust or high-rise dust, and the specific ranking in different functional areas is as follows: CA>EA>RA. The pollution load value of RDS in the sample point of CA1(2) is highest (PLI = 6.24), which is larger than in the other two sample points of CA1 (2.08 and 3.27), representing apparent surface point source pollution. The PLI values of HRD are higher than those of RDS at other research points, except for EA3(3), EA4(1) and CA1(2), where the index values of RDS are higher than those of HRD. In HRD, expect the sampling point of EA3(3), the PLI values of other research points are all greater than 2. The relevant management units in Zhengzhou should pay attention to the high contamination condition caused by the accumulation of heavy metals in HRD. In comparison, urban surface roads are cleaned by environment sanitation administration departments, and the pollution load index values are low, half of the study sites show moderate pollution level (1<PLI<2), half show high pollution level.
Table 4. The Pollution Load Index (PLI) value of studied elements in road dust and high-rise dust of each sampling site.
Road dust
EA1(1) EA1(2) EA1(3) EA2(1) EA3(1) EA3(2) EA3(3) EA4(1) EA5(1) EA
1.95 2.58 2.41 2.11 1.20 1.31 1.91 3.11 1.76 2.04
CA1(1) CA1(2) CA1(3) CA2(1) CA2(2) CA2(3) CA RA1(1) RA1(2) RA1(3) RA
2.08 6.24 3.27 1.74 2.67 1.74 2.96 1.61 2.17 1.97 1.92
High-rise dust
EA1(1) EA1(2) EA1(3) EA2(1) EA3(1) EA3(2) EA3(3) EA4(1) EA5(1) EA
3.80 2.99 3.80 3.95 2.32 2.08 1.49 2.34 2.71 2.83
CA1(1) CA1(2) CA1(3) CA2(1) CA2(2) CA2(3) CA RA1(1) RA1(2) RA1(3) RA
2.69 2.94 4.13 5.63 3.80 3.12 3.72 2.64 2.53 3.17 2.78

Wang H.L., et al.5822
Potential Ecological Risk Assessment
In the vertical sampling points, the orders of monomial ecological risk factor values (Er) of each metal in road dust samples and high-level dust samples are: Cr<Ni<Zn<Cu<As<Pb<Hg<Cd (Fig. 4). In road dust samples, the Er value of each heavy metal has obvious outliers at the sampling sites, while the Er value distribution of each metal in the high-level dust samples is relatively concentrated among the sampling sites. The ecological risks caused by Cr, Ni, Zn, Cu, As and Pb in both road and high-rise dust are all <40, which is a negligible low potential ecological risk. Hg in road dust samples poses high ecological risk and Cd poses extreme ecological risk; Hg and Cd in high-rise dust samples all pose extreme risk. The Er values of Hg and Cd in road dust of Zhengzhou is higher in commercial district than in education district and residential district; the ecological risk caused by Cd in the high-rise dust is the highest in the residential study site of RA1.
Considering the influence of each metal, the ecological risk values (RI) of road dust and high-level dust at each sample point were comprehensively analyzed (Fig. 5). High-rise dust samples from more than 85% of the study sites present extreme potential ecological risk; road dust samples from nearly half of the study sites present considerable risk and one-third of the study sites are at moderate risk. The RI values of urban road dust and high-rise dust are the highest in CA, indicating the extreme ecological risk in the commercial area.
Analysis on the Difference of Heavy Metal Pollution Source of Dust with Different Height
Pearson Correlation Coefficient Analysis
The heatmap is employed to visualize the correlation between elements by color and shade, and the Pearson correlation values are also marked in the diagram
Fig. 4. Monomial ecological risk factor values (Er) of each heavy metal in road and high-rise dust of sampling sites.

Vertical Distribution Characteristics and Source... 5823
(Fig. 6). In the high-rise dust samples, except for the negative correlation with Hg, Cr is positively correlated with other heavy elements at different significance level (it is strongly correlated with Ni, Cu, Zn and Pb at p<0.01, and moderately correlated with As and Cd at the 0.05 level). It is generally believed that significant correlation between HEs may reflect the same origin or common influencing factors [28]. However, the correlation of Cr-Hg of road dust is strengthened by human activities on the ground in the study sample points, which, on the contrary, greatly weaken the correlation between Cr and other metals such as Ni and Zn. It might explain why the correlations between Cr and other heavy elements in RDS and those in HRD is accordingly different. Similarly, the strong correlations of Ni-Cu (0.65) and Cd-Pb (0.76) in HRD at the 0.01 level are also weakened in road dust (0.53 and 0.55, respectively). This is probably because the ground dust is under the influence of various factors, resulting in inapparent correlation among elements, which leads to unintelligibility and indistinctness of the source of heavy elements in road dusHigh linear correlations at the 0.01 level are displayed in Pb-Zn (0.609) and Pb- Cd (0.757) in HRD [40], which is, to some extent, weakened in road dust. A greater degree of weakening occurred in the correlation between Cu and As. Conversely, Cd-Cu, Cd-Zn and Cd-As are found to have significant correlations in road dust at p < 0.01 but no significant linear correlations in high-rise dust. This phenomenon also appears in Cu-Hg and Cd-Hg. In addition, there are moderate correlations of Zn-Ni (0.561) and Zn-Cu (0.556) in RDS at the 0.05 level, and there are no significant differences of Cr-Cd and Cu-Pb correlations between RSD and HRD at the same level of significance. The linear correlations between Hg and other elements in RDS is higher than those in the corresponding HRD. Moreover, it should
Fig. 5. Ecological risk index (RI) values of road and high-rise dust samples in different functional areas.
Fig. 6. Thermodynamic diagram of Pearson correlation coefficient between heavy elements in road dust (above) and high-rise dust (below).

Wang H.L., et al.5824
be emphasized that correlation coefficient is merely reflection of the linear relationship between variables and the direction of the correlation, not a representation of non-linear and other relationship between variables.
Principal Component Analysis (PCA)
Kaiser-Meyer-Olkin (KMO) test statistics are employed to compare the simple correlation coefficient and partial correlation coefficient between variables. It is found that the KMO value between heavy metals in RDS is 0.680, and that in HRD is 0.698 through analysis and calculation. Bartlett-test of sphericity is a test method for the correlation degree of variables, and the significance level values of it in both RDS and HRD are 0.00, which indicates that there is a significant difference between the actual correlation matrix and the assumed identity matrix [13, 28]. In summary, the concentration values of heavy metals in dust samples collected at each sampling point in this paper are suitable for factor analysis. The communality of each initial variable, that is, the ratio of each initial variable to be interpreted, and the factor load matrix of each heavy metal in each extracted principal component are shown in Table 5. The maximum variance method proposed by Kaiser was applied to minimize the number of variables with high load for each factor by means of orthogonal rotation [21, 41], simplifying the interpretation of factors [44].
In RDS, three principal components (PCs) were extracted by examining the total variance of each factor after rotation [44], accounting for 85.95% of all variables (Fig. 7). The sources of road dust are complex and more “stirred” by vehicles and human beings on the ground,
causing some metals not being able to form large load on a certain principal component. That may be the reason why the load differences of Cu and Hg on the three PCs are all not significant. PC1 is predominately weighted by Cr and Pb, followed by Hg and Cu, accounting for 60.17% of the total variance. Cr is primarily used in the production of stainless steels and various alloy steels in the form of ferroalloy (such as ferrochrome); chrome-plating and chromizing can make steel, copper and other metals form corrosion-resistant surface, which so is widely utilized for furniture, automobile parts, construction and other industries [5]. Pb is used as a raw material for batteries, cables, bullets, and ammunition and as an additive to gasoline; its compounds are used as raw materials for paints, glass, plastics and rubber. In addition, it is widely employed to manufacture chemical and metallurgical equipment due to its excellent acid and alkali corrosion resistance, and can also be used as a stabilizer for asphalt [13]. The pollution caused by lead as a gasoline additive to road dust has been confirmed by many scholars [5, 44]. As early as 1999, Zhengzhou Municipal People’s government promulgated a ban on the sale and use of leaded gasoline in motor vehicles and implemented relevant effective measures. In 2016, it officially promoted and used the upgrade scheme of National Phase V standard motor ethanol gasoline and diesel quality. Nonetheless, there is still moderate or even considerable Pb contamination, in the dust samples collected this time, especially in HRD. This may be because the lead accumulated in the soil on the urban roadsides does not completely degrade during this period of time, which also reflects the significance of the banning the use of leaded gasoline from the side. Hg is often used in industrial manufacturing chemical drugs
Table 5. The matrix of extracting element components from eight heavy element concentrations in road dust and high-rise dust samples by principal component analysis (PCA).
ElementRoad dust High-rise dust
ComponentsCommunalities
ComponentsCommunalities
1 2 3 1 2 3
Cr 0.937 0.161 0.208 0.947 0.685 0.621 0.247 0.915
Ni 0.077 0.026 0.953 0.916 0.833 0.385 -0.100 0.852
Cu 0.544 0.429 0.570 0.804 0.390 0.774 0.075 0.757
Zn 0.273 0.486 0.615 0.688 0.426 0.338 0.722 0.817
As 0.101 0.973 0.010 0.956 0.037 0.930 0.080 0.873
Cd 0.379 0.798 0.392 0.934 0.937 -0.029 -0.135 0.896
Pb 0.901 0.179 0.070 0.849 0.868 0.327 0.065 0.864
Hg 0.551 0.532 0.442 0.782 -0.328 -0.027 0.849 0.830
Eigenvalue 4.814 1.069 0.993 4.345 1.592 0.868
Variance (%) 60.173 13.357 12.416 54.312 19.901 10.848
Cumulative Variance (%) 60.173 73.530 85.947 54.312 74.213 85.061
Note: The higher factor loading in the component is in bold.

Vertical Distribution Characteristics and Source... 5825
and electrical products, insecticides, preservatives, electrodes in electrolysis equipment and catalysts, and it has been observed that Hg-containing particles are commonly synonymous with other metals for traffic contamination [27]. Cu is widely used in electrical devices, light industry, machinery manufacturing, construction industry, national defense industry and other fields. The enrichment factors of Pb and Cu in coarse particulate matter are more sensitive to human activities [8]. Moreover, Brown et al. [27] learned that Pb and Cu are both associated with mechanical wear of vehicles and found high correlations at all locations and particle size fractions. Comprehensive analysis shows that PC1 can be classified into construction industry, asphalt pavement wear and transport vehicle parts.
PC2 is responsible for 13.36% of the total variance with high loading of As and Cd, followed by Hg, and the
loading of Zn and Cu could be ignored. As compounds are often added to herbicides and rodent poisons and used in the manufacture of paints, wallpapers and pottery, and in semiconductors, corrosion-resistant steel and medicine. Cd is utilized for the manufacture of batteries and electroplating to prevent corrosion, and its compounds are also widely employed to yield pigments, paints, phosphors, insecticides, photocells and so on. According to the characteristics of high loading elements of PC2 and their utilization in the city, it is preliminarily judged that PC2 represented agrochemical products such as fertilizer and pesticides.
The third factor that is predominately composed of Ni and moderately load with Zn and Cu account for 8% of the total variance. Ni has excellent corrosion resistance and is used in electroplating to avoid rust and it can be also applied to alloys, catalyst, currency
Fig. 7. Scatter diagram of coefficient matrix of three extracted principal components (PC1, PC2 and PC3) affecting the heavy elements content in road (above) and high-rise dust (below).

Wang H.L., et al.5826
and stainless steel, etc [13]. Zn can be utilized for steel, metallurgy, machinery, chemical and other fields due to its high melting point oxide film and other fields, tires, automobile metal parts and lubricating oil also contained Zn. The enrichment coefficient of metals increases with the extension of build-up time, and the coefficient of Zn is the highest among the metals [8]. Previous study [45] has shown that Ni, Zn and Cu are widely used in vehicle components and related to traffic strength and vehicle tire wear. The sources of PC3 are abrasion of city electroplating materials and corrosion of metal surface weathering materials and other alloys.
Compared with the PCA results of heavy metals in RDS, the analysis results in HRD are more ideal, and the load distribution of each heavy metal is more concentrated on a certain PC (Fig. 7), which can be explained by the fact that HRD is less affected by human activities and comes from a relatively single source. The PC1 of HRD where Cd, Pb, Ni and Cr have high load accounts for 54.31% of all variables, which could be attributed to electroplating, alloys and building materials. In HRD, PC2 is responsible for 10.85% of the total variance and preponderantly loaded by As, Cu and Cr. Steel products and components such as reservoirs, fences, and gas pipelines contain Cu, Cr and As. Eventually, it is preliminarily determined that PC2 is the corrosion of stainless-steel products exposed to air for a long time. PC3, being principally composed of Hg and Zn, accounts for 10.85% of all variables. Consistently, Zn, as a traffic related contaminant, was observed to be nearly 100% correlation with Hg in all particle size components and at all locations [27]. Perhaps the re-deposition of resuspended road dust particles on the high-rise buildings could explain PC3 that is produced by traffic-related pollution sources.
Quantification of the Contribution of Each Source
The contribution of factor 1 to Cr, Cu, Pb and Hg in RDS is higher than that of other factors, which is consistent with the conclusion obtained by high load in PCA (Table 6). Factor 2 has a higher contribution to Zn, Cd and Hg, while factor 3 has a lower contribution to each metal. Although it is a known concern that PCA generates negative source contributions [41], it is physically impossible that unidentified pollution sources contribute negatively to Cu, Cd and Hg. Since the negative high contribution ratio mostly occurs on unidentified sources, it can be considered that the unidentified sources of road dust were identified as urban sanitation and daily cleaning. In HRD, the positive contribution of factor 2 to Cr, Cu, Zn and As is relatively high, while the contribution of factor 2 is “counteracted” by the unrecognized sources. Unidentified sources in urban high-rise dust can be considered as external forces such as wind, which reduces the content of heavy metals in dust samples to a certain extent and can be regarded as the so-called negative contribution. For Ni, Cd, Pb, the contribution rate of factor 1 is great, especially for Cd (77.40%). The similarity between factor 3 in HRD and factor 3 in RDS is that they contribute less to heavy metals than the first two factors. The unidentified source of pollution showed a significantly positive and negative contribution to Hg in HRD and RDS, respectively. Although the model does not require the emission sources inventory to be known in advance, it is essential to make clear the contribution of each pollutant source and the type of unidentified source for pollution control and prevention [10, 20, 24].
The excellent consistency between the measured and predicted concentrations of HEs (R2>0.80 for
ElementsRoad dust High-rise dust
Factor 1 Factor 2 Factor 3 Unidentified source Factor 1 Factor 2 Factor 3 Unidentified source
Cr 54.34% 9.36% 4.49% 31.81% 37.74% 71.20% 3.16% -12.10%
Ni 7.46% 1.72% 28.65% 62.17% 43.13% 41.50% -1.20% 16.57%
Cu 95.14% 77.82% 35.17% -108.13% 30.53% 126.07% 1.37% -57.97%
Zn 24.98% 51.11% 24.21% -0.30% 71.67% 118.29% 28.29% -118.25%
As 4.78% 44.24% 0.19% 50.79% 1.34% 69.74% 0.67% 28.25%
Cd 83.45% 198.27% 35.67% -217.39% 77.40% -5.13% -2.59% 30.32%
Pb 50.21% 10.88% 1.76% 37.15% 44.48% 34.86% 0.78% 19.88%
Hg 138.37% 120.93% 26.07% -185.37% -62.11% -10.26% 37.17% 135.20%
Note: High contribution values is in bold.
Table 6. The contribution ratio of identified and unidentified pollution sources in road and high-rise dust.

Vertical Distribution Characteristics and Source... 5827
most HEs, Table S1 and Table S2) indicates that the receptor-oriented source apportionment model of APCS-MLR is suitable for estimating the source contributions of HEs in urban dust samples [21]. Multiple linear fitting results of Zn and Hg in road dust were general (R2>0.66) and more samples data could be considered for analysis in the later research.
Conclusions
By analyzing the concentration characteristics of eight heavy elements (HEs) in thirty-six samples of HRD and RDS in Zhengzhou, China and identifying the pollutants sources, the following conclusions are drawn:
(1) The concentration of HEs were in the order of Zn>Pb>Cr>Cu>Ni>As>Cd>Hg both in RDS and HRD. The RSDs of Cr in RDS were all lower than that in HRD in each functional area, but the RSDs of Cr in RDS were higher than that in HRD in all locations, which indicates that compared to the HEs in HRD, there is a minor difference of HEs content in RDS in each functional area, but a relatively large difference among different functional areas.
(2) Zn and Hg concentration in both RDS and HRD, As concentration in HRD and Cd concentration in RDS are listed in the order of CA>EA>RA. Generally, Zn concentration in RDS is lower than that in HRD, which might be the result of long-term accumulation and adsorption of fine particulate matters on the building. In 17% of the study sites, the PI values of zinc in RDS is >6, especially in CA1(2) (7.79), which requires some measures to address the problem of high zinc concentration in urban dust. The average PLI value of HRD in different functional areas is all higher than that of RDS under corresponding functional areas, which indicates that there is an obvious accumulation effect of heavy elements HRD.
(3) Cr is strongly positively correlated with Ni, Cu, Zn and Pb at p<0.01, and moderately correlated with As and Cd at the 0.05 level in HRD. The correlation of Cr-Hg was strengthened by human activities on the ground in the study sample points. The PC1 of RDS predominately composed of Cr and Pb, were attributed to the construction industry and wear of asphalt road and transport vehicle parts. Compared with the PCA results of HEs in RDS, the analysis results in HRD are more ideal, and the load distribution of each HE is more concentrated on a certain PC.
(4) The similarity between factor 3 in HRD and factor 3 in RDS is that they contribute less to heavy metals than the first two factors. There was a significant correlation of the measured and predicted concentrations of HEs (R2>0.80 for most HEs) suggests that the APCS-MLR source apportionment model is fit better for estimating the source contributions of HEs in urban dust samples.
Acknowledgements
The research was financially supported by the National Natural Science Foundation of China [grant numbers 51879242 and 51739009].
Conflict of Interest
The authors declare no conflict of interest.
References
1. LI XIAO-yAN., ZHANG SHU-TING. Seasonal Provincial Characteristics of Vertical Distribution of Dust Loadings and Heavy Metals near Surface in City. J. Environ. Sci. 36 (6), 2274, 2015.
2. WANG J.Z., QIAN C., LIU J.Q., NI X.F., PENG S.C. The Effects of Height on the Accumulation of n-Alkanes and Polycyclic Aromatic Hydrocarbons (PAHs) in Air-Conditioning Filter Dust from High-Rise Apartments. Aerosol Air Qual. Res. 17 (6), 1582, 2017.
3. ZHAO H., LI X., WANG X. Heavy Metal Contents of Road-Deposited Sediment along the Urban-Rural Gradient around Beijing and its Potential Contribution to Runoff Pollution. Environ. Sci. Technol. 45 (17), 7120, 2011.
4. ABBASI S., KESHAVARZI B., MOORE F., HOPKE P.K., KELLy F.J., DOMINGUEZ A.O. Elemental and magnetic analyses, source identification, and oxidative potential of airborne, passive, and street dust particles in Asaluyeh County, Iran. Sci. Total Environ. 707 (10), 136132, 2020.
5. REHMAN A., LIU G., yOUSAF B., ZIA-UR-REHMAN M., ALI M.U., RASHID M.S., FAROOQ M.R., JAVED Z. Characterizing pollution indices and children health risk assessment of potentially toxic metal(oid)s in school dust of Lahore, Pakistan. Ecotox. Environ. Safe. 190, 110059, 2020.
6. MEI DAN., DENG QIHONG., WEN MENG., FANG ZHI Evaluating Dust Particle Transport Performance within Urban Street Canyons with Different Building Heights, Aerosol Air Qual. Res. 16 (6), 1483, 2016.
7. ZHANG SHU-TING., LI XIAO-yAN., CHEN SI-MIN Vertical characteristics of deposition fluxes of dust and heavy metals of Guiyang City. China Environmental Science. 35 (6), 1630, 2015.
8. WANG J., HUANG J.J., LI J. Characterization of the pollutant build-up processes and concentration/mass load in road deposited sediments over a long dry period. Sci. Total Environ. 718 (20), 137282, 2020.
9. ZHAO H., LI X. Understanding the relationship between heavy metals in road-deposited sediments and washoff particles in urban stormwater using simulated rainfall. J. Hazard. Mater. 246-247 (15), 267, 2013.
10. JIANG P., CHEN X., LI Q., MO H., LI L. High-resolution emission inventory of gaseous and particulate pollutants in Shandong Province, eastern China. J. Clean Prod. 259 (20), 120806, 2020.
11. KARA M. Assessment of sources and pollution state of trace and toxic elements in street dust in a metropolitan city. Environ. Geochem Health. 42 (10), 3213, 2020.
12. MA y., GONG M., ZHAO H., LI X. Contribution of road dust from Low Impact Development (LID) construction
Wang H.L., et al.5828
sites to atmospheric pollution from heavy metals. Sci. Total Environ. 698 (1), 134243, 2020.
13. JIN y., OCONNOR D., OK y.S., TSANG D.C., LIU A., HOU D. Assessment of sources of heavy metals in soil and dust at children’s playgrounds in Beijing using GIS and multivariate statistical analysis. Environ. Int. 124, 320, 2019.
14. PENG TIANyUE., O’CONNOR DAVID., ZHAO BIN., JIN yUANLIANG., ZHANG yUNHUI Spatial distribution of lead contamination in soil and equipment dust at children’s playgrounds in Beijing, China. Environ. Pollut. 245, 363-370, 2019.
15. CANDEIAS C., VICENTE E.D., TOME M., ROCHA F., AVILA P.F., CELIA A. Geochemical, Mineralogical and Morphological Characterisation of Road Dust and Associated Health Risks. Int. J. Environ. Res. Public Health 17 (5), 1563, 2020.
16. HUANG y., DENG M., WU S., JAPENGA J., LI T., yANG X., HE Z. A modified receptor model for source apportionment of heavy metal pollution in soil. J. Hazard. Mater. 354 (15), 161, 2018.
17. MEN C., LIU R., XU L., WANG Q., GUO L., MIAO y., SHEN Z. Source-specific ecological risk analysis and critical source identification of heavy metals in road dust in Beijing, China. J. Hazard. Mater. 388 (5), 121763, 2020.
18. HOPKE P.K., GLADNEy E.S., GORDON G.E., ZOLLER W.H., JONES A.G. The use of multivariate analysis to identify sources of selected elements in the Boston urban aerosol. Atmos Environ. 10 (11), 1015, 1976.
19. RAMíREZ O., LA CAMPA A.M., SANCHEZRODAS D., LA ROSA J.D. Hazardous trace elements in thoracic fraction of airborne particulate matter: Assessment of temporal variations, sources, and health risks in a megacity. Sci. Total Environ. 710 (25), 136344, 2020.
20. SONG y., XIE S., ZHANG y., ZENG L., SALMON L. G., ZHENG M. Source apportionment of PM2.5 in Beijing using principal component analysis/absolute principal component scores and UNMIX. Sci. Total Environ. 372 (1), 278, 2006.
21. GUO H., WANG T., LOUIE P.K. Source apportionment of ambient non-methane hydrocarbons in Hong Kong: application of a principal component analysis/ absolute principal component scores (PCA/APCS) receptor model. Environ. Pollut. 129 (3), 489, 2004.
22. THURSTON G.D., SPENGLER J.D. A quantitative assessment of source contributions to inhalable particulate matter pollution in metropolitan Boston. Atmos. Environ. 19 (1), 9, 1985.
23. VEGA E., MUGICA V., CARMONA R., VALENCIA E. Hydrocarbon source apportionment in Mexico City using the chemical mass balance receptor model. Atmos Environ. 34 (24), 4121, 2000.
24. GUAN Q., ZHAO R., PAN N., WANG F., yANG y., LUO H. Source apportionment of heavy metals in farmland soil of Wuwei, China: Comparison of three receptor models. J. Clean Prod. 237 (10), 117792, 2019.
25. WANG H., SHEN C., KANG y., DENG Q., LIN X. Spatial distribution of pollution characteristics and human health risk assessment of exposure to heavy elements in road dust from different functional areas of Zhengzhou, China. Environ. Sci. Pollut. Res. 27 (21), 26650, 2020.
26. yIN R., WANG D., DENG H., SHI R., CHEN Z. Heavy Metal Contamination and Assessment of Roadside and Foliar Dust along the Outer-Ring Highway of Shanghai, China. J. Environ. Qual. 42 (6), 1724, 2013.
27. BROWN A., yALALA B., CUKROWSKA E., GODOI R.H., POTGIETERVERMAAK S. A scoping study of component-specific toxicity of mercury in urban road dusts from three international locations. Environ. Geochem. Health 42, 1127, 2020.
28. ZHANG M., HE P., QIAO G., HUANG J., yUAN X., LI Q. Heavy metal contamination assessment of surface sediments of the Subei Shoal, China: Spatial distribution, source apportionment and ecological risk. Chemosphere 223, 211, 2019.
29. ALHARBI B.H., PASHA M.J., ALOTAIBI M.D., ALDUWAIS A.K., ALSHAMSI M.A. Contamination and risk levels of metals associated with urban street dust in Sci. Pollut. Res. 1-13, 2020.
30. RIyADH, SAUDI ARABIA. ENVIRON.HAMID F.A., BAKAR A.F., NG T.F., GHANI A.B., ZULKIFLEy M.T. Distribution and contamination assessment of potentially harmful elements (As, Pb, Ni, Cd) in top soil of Penang Island, Malaysia. Environ. Earth Sci. 78 (21), 1, 2019.
31. LIN H., ZHU X., FENG Q., GUO J., SUN X., LIANG y. Pollution, sources, and bonding mechanism of mercury in street dust of a subtropical city, southern China. Hum. Ecol. Risk Assess. 393, 2019.
32. HJ 766-2015, Solid Waste – Determination of metals – Inductively coupled plasma mass spectrometry (ICP-MS). Ministry of Environmental Protection of the People’s Republic of China (in Chinese).
33. HJ 680-2013, Soil and sediment – Determination of mercury, arsenic, selenium, bismuth, antimony – Microwave dissolution/Atomic Fluorescence Spectrometry. Ministry of Environmental Protection of the People’s Republic of China [In Chinese].
34. LU X., LI L. y., WANG L., LEI K., HUANG J., ZHAI y. Contamination assessment of mercury and arsenic in roadway dust from Baoji, China. Atmos. Environ. 43 (15), 2489, 2009.
35. HJ 803-2016, Soil and sediment-Determination of aqua regia extracts of 12 metal elements-Inductively coupled plasma mass spectrometry. Ministry of Environmental Protection of the People’s Republic of China [In Chinese].
36. RyBAK J., WROBEL M., BIHALOWICZ J.S., ROGULAKOZLOWSKA W. Selected Metals in Urban Road Dust: Upper and Lower Silesia Case Study. Atmosphere 11 (3), 2020.
37. JADOON S., MUHAMMAD S., HILAL Z., ALI M., KHAN S., KHATTAK N.U. Spatial distribution of potentially toxic elements in urban soils of Abbottabad city, (N Pakistan): evaluation for potential risk. Microchem J. 153, 104489, 2020.
38. CHEN yINAN., MA JIANHUA., MIAO CHANGHONG., RUAN XINLING Occurrence and environmental impact of industrial agglomeration on regional soil heavy metalloid accumulation: A case study of the Zhengzhou Economic and Technological Development Zone (ZETZ), China. J. Clean Prod. 245 (1), 18676, 2020.
39. TOMLINSON D.L., WILSON J.G., HARRIS C.R., JEFFREy D.W. Problems in the assessment of heavy-metal levels in estuaries and the formation of a pollution index. Helgol. Meeresunters. 33 (1), 566, 1980.
40. ENUNEKU A., BIOSE E., EZEMONyE L. Levels, distribution, characterization and ecological risk assessment of heavy metals in road side soils and earthworms from urban high traffic areas in Benin metropolis, Southern Nigeria. J. Environ. Chem. Eng. 5 (3), 2773, 2017.

Vertical Distribution Characteristics and Source... 5829
41. HAKANSON L. An ecological risk index for aquatic pollution control. A sedimentological approach. Water Res. 14 (8), 975, 1980.
42. LARSEN R.K., BAKER J.E. Source apportionment of polycyclic aromatic hydrocarbons in the urban atmosphere: a comparison of three methods. Environ. Sci. Technol. 37 (9), 1873, 2003.
43. DU Z.P., WANG M.J., yAN C.A., GAO W. Pollution source apportionment of Lake Dianchi based on absolute principal component score-multiple linear regression. Acta Scientiae Circumstantiae, 40 (3), 1130, 2020.
44. HUANG y., ZHANG S., CHEN y., WANG L., LONG Z., HUGHES S.S., NI S., CHENG X., WANG J., LI T.,
WANG R., LIU C. Tracing Pb and Possible Correlated Cd Contamination in Soils by Using Lead Isotopic Compositions. J. Hazard. Mater. 385 (5), 121528, 2020.
45. ROSCOE B.A., HOPKE P.K., DATTNER S.L., JENKS J.M. The Use of Principal Component Factor Analysis to Interpret Particulate Compositional Data Sets. Journal of the Air Pollution Control Association 32 (6), 637, 1982.
46. WAHAB M.I., RAZAK W.M., SAHANI M., KHAN F. Characteristics and health effect of heavy metals on non-exhaust road dusts in Kuala Lumpur. Sci. Total Environ. 703, 135535, 2020.
Supplementary Material
Table S1. Paraments of multiple linear regression of various heavy metals in road dust.
Dependent Variable B Standard Error β t value
Cr
Constant 15.157 3.090 4.904
APCS1 14.380
1.008
0.942 14.263
APCS2 2.073 0.136 2.056
APCS3 2.806 0.184 2.783
R = 0.969; R² = 0.939; Adjusted R² = 0.926; F = 71.804*
Ni
Constant 9.007 1.285 7.006
APCS1 0.600
0.419
0.105 1.430
APCS2 0.116 0.020 0.278
APCS3 5.448 0. 955 12.992
R = 0.961; R² = 0.924; Adjusted R² = 0.908; F = 56.969*
Cu
Constant -39.137 12.420 -3.151
APCS1 19.128
4.052
0.591 4.721
APCS2 13.088 0.405 3.230
APCS3 16.713 0.517 4.125
R = 0.883; R² = 0.780; Adjusted R² = 0.733; F = 16.581*
Zn
Constant -0.480 34.456 -0.014
APCS1 22.519
11.240
0.281 2.003
APCS2 38.544 0.481 3.429
APCS3 51.573 0.644 4.588
R = 0.851; R² = 0.725; Adjusted R² = 0.666; F = 12.275*
As
Constant 5.436 0.383 14.183
APCS1 0.284
0.125
0.125 2.270
APCS2 2.200 0.970 17.596
APCS3 0.027 0.012 0.218
R = 0.978; R² = 0.957; Adjusted R² = 0.948; F = 104.935*

Wang H.L., et al.5830
Cd
Constant -2.284 0.259 -8.817
APCS1 0.487
0.085
0.395 5.758
APCS2 0.968 0.786 11.454
APCS3 0.492 0.400 5.824
R = 0.966; R² = 0.934; Adjusted R² = 0.920; F = 66.086*
Pb
Constant 19.147 5.667 3.379
APCS1 14.375
1.849
0.887 7.776
APCS2 2.605 0.161 1.409
APCS3 1.194 0.074 0.646
R = 0.904; R² = 0.818; Adjusted R² = 0.779; F = 20.958*
Hg
Constant -0.287 0.080 -3.575
APCS1 0.119
0.026
0.644 4.556
APCS2 0.087 0.473 3.342
APCS3 0.053 0.285 2.013
R = 0.848; R² = 0.720; Adjusted R² = 0.660; F = 11.993*
Note: * indicates p<0.05
Table S1. Continued.
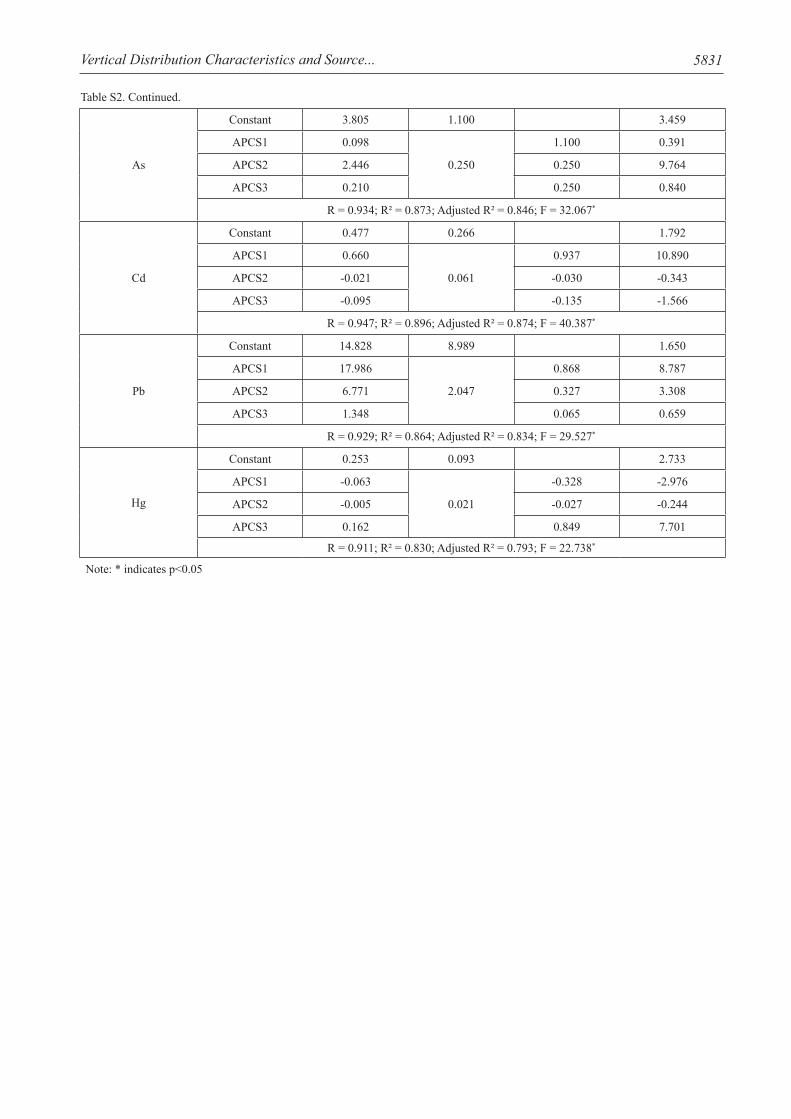
Table S2. Paraments of multiple linear regression of various heavy metals in high-rise dust.
Dependent Variable B Standard Error β t value
Cr
Constant -6.531 5.512 -1.185
APCS1 11.040
1.255
0.685 8.795
APCS2 10.003 0.621 7.969
APCS3 3.977 0.247 3.168
R = 0.957; R² = 0.915; Adjusted R² = 0.897; F = 50.297*
Ni
Constant 2.994 2.285 1.310
APCS1 4.224
0.520
0.833 8.117
APCS2 1.952 0.385 3.751
APCS3 -0.505 -0.100 -0.969
R = 0.923; R² = 0.852; Adjusted R² = 0.821; F = 26.968*
Cu
Constant -19.497 8.243 -2.365
APCS1 5.566
1.877
0.390 2.965
APCS2 11.040 0.774 5.882
APCS3 1.075 0.075 0.573
R = 0.870; R² = 0.757; Adjusted R² = 0.705; F = 14.573*
Zn
Constant -421.586 163.188 -2.583
APCS1 138.513
37.161
0.426 3.727
APCS2 109.799 0.338 2.955
APCS3 234.925 0.722 6.322
R = 0.904; R² = 0.817; Adjusted R² = 0.778; F = 20.862*
Vertical Distribution Characteristics and Source... 5831
Table S2. Continued.
As
Constant 3.805 1.100 3.459
APCS1 0.098
0.250
1.100 0.391
APCS2 2.446 0.250 9.764
APCS3 0.210 0.250 0.840
R = 0.934; R² = 0.873; Adjusted R² = 0.846; F = 32.067*
Cd
Constant 0.477 0.266 1.792
APCS1 0.660
0.061
0.937 10.890
APCS2 -0.021 -0.030 -0.343
APCS3 -0.095 -0.135 -1.566
R = 0.947; R² = 0.896; Adjusted R² = 0.874; F = 40.387*
Pb
Constant 14.828 8.989 1.650
APCS1 17.986
2.047
0.868 8.787
APCS2 6.771 0.327 3.308
APCS3 1.348 0.065 0.659
R = 0.929; R² = 0.864; Adjusted R² = 0.834; F = 29.527*
Hg
Constant 0.253 0.093 2.733
APCS1 -0.063
0.021
-0.328 -2.976
APCS2 -0.005 -0.027 -0.244
APCS3 0.162 0.849 7.701
R = 0.911; R² = 0.830; Adjusted R² = 0.793; F = 22.738*
Note: * indicates p<0.05
