ornl 4191
DESCRIPTION
http://www.energyfromthorium.com/pdf/ORNL-4191.pdfTRANSCRIPT
c
c
Contract No. W-.740 5-eng- 26
MOLTEN-SALT REACTOR PROGRAM SEMi ANNUAL PROGRESS REPORT For Period Ending August 31, 1967
ORNL -4191 UC-80 - Reactor Technology
M. W. Rosenthal, Program Director
R. B. Briggs, Associate Di rector P. R. Kasten, Associate Di rector
c
DECEMBER 1967
OAK RIDGE NATIONAL LABORATORY Ook Ridge, Tennessee
aperated by UNION CARBiDE CORPORATION
for the U. 5. ATOMIC ENERGY COMMISSION
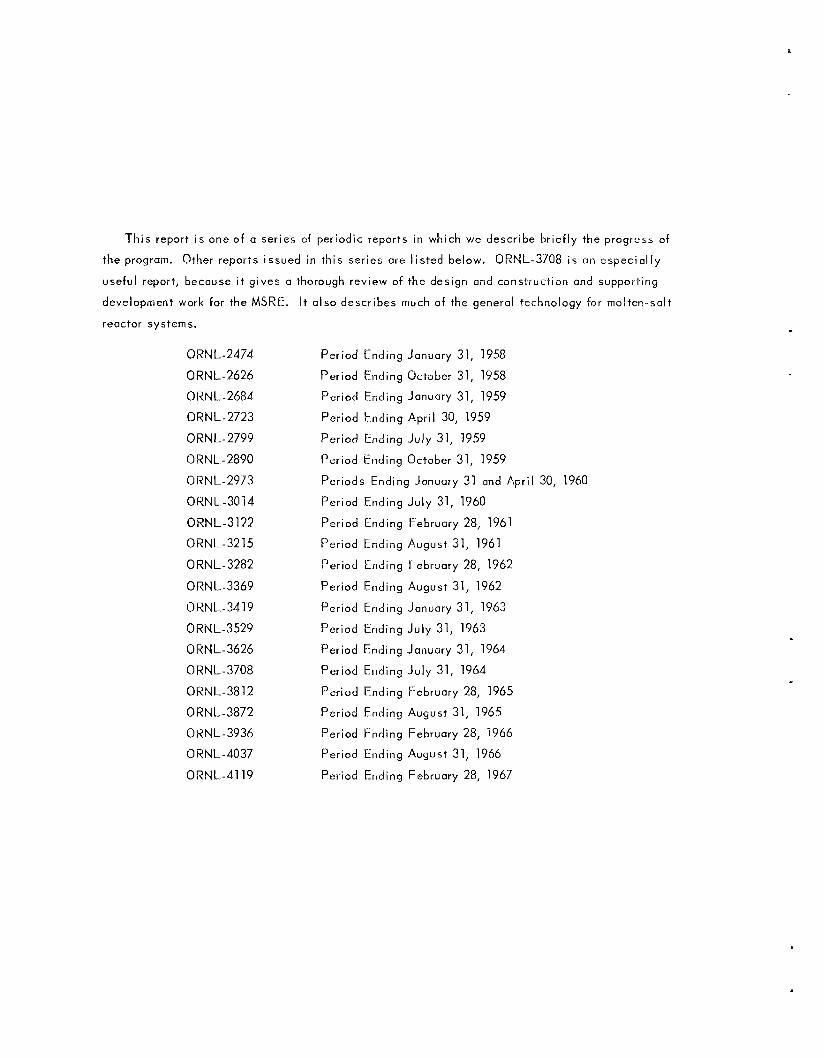
T h i s report i s one o f a ser ies of per iodic reports i n which we descr ibe br ie f ly the progress of
the program. Other reports issued i n th is series are l i s t e d below. ORNL-3708 i s an espec ia l l y
useful report, because i t g ives a fhorough review of the design and construct ion and supporting
development work for the MSRE. reactor systems.
It a lso descr ibes much o f the general technology for mol ten-so l i
0 RN L - 2 474 ORNL-2626 0 RN L-2684 O RNL- 2723 ORNL-2799 0 HN L-2890 0 RNL-2973 ORNL-30 14 ORNL-3122 ORNL-32 15 ORNL-3282 ORNL-3369 0 RNL-34 19 ORNL-3529 0 KN L- 3626 0 HNL-3708 ORN L-38 12 0 RN L-3872 0 RNL-3936 ORNL-4037 ORNL-4119
Per iod Ending January 31, 1958 Per iod Ending October 31, 1958 Per iod Ending January 31, 1959 Period Ending Apr i l 30, 1959 Per iod Ending J u l y 31, 19.59 Per iod Ending October 31, 1959 Periods Ending January 31 and Apr i l 30, 1960 Period Ending Ju l y 31, 1960 Per iod Ending February 28, 1961 Per iod Ending August 31, 1961 Period Ending February 28, 1962 Per iod Ending August 31, 1962 Per iod Ending January 31, 1963 Per iod Ending Ju l y 31, 1963 Per iod Ending January 31, 1964 Per iod Ending J u l y 31, 1964 Per iod Ending February 28, 1965 Per iod Ending August 31, 1965 Period Ending February 28, 1966 Period Ending August 31, 1966 Period Ending February 28, 1967
Contents
INTRODUCTION ..........................................................
........................................................... .................................................. ,
PART 1. MOLTEN-SALT REACTOR EXPERIMENT
1. MSRE OPERATIONS .................... ...................................................
1.1 Chronological Account of t ions and Maintenance .............................................................. 1.2 Reactivity Balance ..........................................................................................................................
Balances at Power ............ .................................................... Balances at Zero Power ..............................................................
.......................................
....................................... 1.3 Thermal Ef fec t s of Operation ..........................................................................................................
Radiation Heat ing ..................................... ...................................... Thermal Cyc le History ........................... Temperature Measurement .............. ................................. F u e l Salt Afterheat ..........................................................................................................................
1.4 Equipment Performance .......................................... Heat Transfer .............................
Main Blowers .......................................................... Radiator Enclosure .............................................. Off-Gas Systems ...................................................... Cooling Water Systems ....... ........................................................................................................
.......................................
..........................................................
Component Cooling System .................... .......................................................
Elec t r i ca l System ........................................................... Sal t Pump Oil Systems ....................................................................................................................
Heaters .................................................. Control Rods and [)rives ............................................ Sal t Samplers ........................................ Containment ......................................................................................................................................
2. COMPONENT DEVELOPMENT .............................. ..................................................................
2.1 Off-Gas Sampler ....................................................................................................................... 2.2 Remote Maintenance ......................... ......................................................
Preparations for Shutdown After Run 11 ........................................................................................ Evaluation of Remote Maintenance After Run 11 ........................................................................ Repair of Sampler-Enricher and Recovery of La tch ..........................................................
2.3 Decontamination Studies .................................................................................................................
1
3
13 13 19 19 21 22 22 22 22 24 25 2 5 26 26 27 29 29 30 31 31 31 31 33
36 36 36 36 37 37 40
... 111
iv
2.4 Development of a Scanning Device for Measuring t h e Radiation Leve l of Remote Sources ..............................................................................................................................
Experiment with a 5-curie 7Cs Gamma Source ................ ................................................. Gamma Scan of the MSRE: Heat Exchanger ................................................................................... Gamma Energy Spectrum Scan of the MSRE Heat Exchanger .....................................................
2.5 P u n p s ................. ....................................................................................................... Mark-2 F u e l Pum ....................................................................................................... Spare Rotary Elements for MSRE Fue l and Coolant Salt Pumps ................................................ Stress T e s t s of P u m p Tank Discharge Nozzle Attachment ................................. MSRE Oil Pumps .............. ........................................................................................................... Oil Pump Endurance T e s t ................................................................................................................
40 41 43 43 45 45 45 46 46 46
3 . INSTRUMENTS AND CONTROLS .............................................................................................................. 47
3.1 MSRE Operating Experience ........................................................................................................... 47 Control System Components ............................................................................................................ 47 Nuclear Instruments ......................................................................................................................... 47 Safety System ................................................................................................................................... 48
3.2 Conti01 System Design .................................................................................................................... 48
4 . MSRE REACTOR ANALYSIS ...................................................... .......
4.1 Introduction ........................................................................................................................................
4.2 Neutron Energy Spectra in MSKE and MSBR ................................................................................
4.3 Other Neutronic Charac te r i s t ics of MSRE with 2 3 3 U Fue l .............. Critical Loading, Rod Worth, and Reactivity Coefficients ........................................................ Fiss ion Rate and Thermal Flux Spatial Distributions ............................................................... Reactor-Average F luxes and Reaction Cross Sections .............................................................. Effec t of Circulation on Delayed-Neutron Precursors .............................................................. Samarium Poisoning Effec ts ................................................................................
4.4 MSRE Dynamics with * 31J Fue l ...................................................................................................
PART 2 . MSBR DESIGN AND DEVELOPMENT
.. 5 . DLSIGN ............................................................................................. .....................................
5.1 General .............................................................................................................................................
5.2 Cel l Arrangement ........................................................................................... ..............................
5.3 Reactor ..............................................................................................................................................
5.4 Fue l Heat Exchanger .......................... .......................................................................
5.5 Blanket Heat Exchanger ..................................................................................................................
5.6 Fue l Drain Tanks ................................ .....................................................................................
5.7 Blanket and Coolant Salt Drain Tanks ..........................................................................................
5.8 Steam Generator-Superheater and Reheater ................................................................................
50
50 50
54 54 55 55 58 60 61
63
63
65 71 76 76 79
79 81
6 . REACTOR PHYSICS .................................................................................................................................... 82 6.1 MSBR Phys ic s Analys is ...................................................... ....... ......... . . 82
. . Optimization of Reactor Parameters .............................................................................................. 82 Useful Life of Moderator Graphite .................................................................................................. 84 Flux Fla t ten ing .............................................................................................................................. 87 Temperature Coeff ic ien ts of Reactivity ........................................................................................ 88
V
7 . SYSTEMS AND COMPONENTS DEVELOPMENT ....................................................................................
7.1 Noble-Gas Behavior in the MSRR ...................................... ............................... ...
'7.2 MSBR F u e l Cell Operation with Molten Sa l t ................................................................................ 7.3 Sodium Fluoroborate Circulating Loop T e s t .... .............................................
7.4 MSBR Pumps .......................... ................................................................................................... Survey of Pump Experience la t ing Liquid Metals and Molten Sa l t s ................................ Introduction of MSBR Pump Program .............................................................................................. Fue l and Blanket Salt Pumps ....................................................... ..........................................
Water Pump Test Fac i l i ty .... .................................................................................................... Molten-Salt Rearing Tests ......................................... .............................................................
Other Molten-Salt Punips ..................................................................................................................
Coolant Salt . Pumps ........................................................................................................
Rotor-Dynamics Feas ib i l i ty Invest.igation ....................................................................................
PART 3 . CHEMISTRY
90 90
95 95 96 96 96 97 99 99
100 100 101
8 . CHICMISTRY O F T H E MSRE ................ ......... ................... 102
8.1 MSRE Sal t Composition and Purity ................................................................................................ 102 F u e l Salt .................................. ..................... 103 Coolant Sa l t ...................................................................................................................................... 103 F lush Salt ........................... .............................................................................................. 103 Implications of Current Ex in Future Operations .......................................................... 108
................................ ..........................
8.2 MSRE F u e l Circuit Corrosion Chemistry ........ .................................
8.3 Adjustment of the UF , Concentration of t h e Fue l Sa l t ..........................................
9 . FISSION PRODUCT BEHAVIOR IN T H E MSRE ...................................................................................... 116
9.1 F i s s i o n Products in MSRE Cover G a s .......................................................................................... 116 9.2 F i s s i o n Products in MSRE Fuel .................................................................................................... 119
9.3 Examination of MSKE Surveil lance Specimens After 24, 000 Mwhr ........ ............................... 121 Examination of Graphite .......................................................... .................................................. 1 2 1 Examination of I-Iastelloy N ...................................... .................................................. 124 F i s s ion Product Distribution in MSRE ..................... ....................................................... 125
9.4
9.5
Deposition of F iss ion Products from MSRE Gas Stream on Metal Specimens ........
Deposition of F i s s ion Products on Graphites in MSRE Pump Bowl .........................................
10.1 Oxide Chemistry of ThF,-UF, Mel t s .......................... ................................................. 136
Spectrophotometric Measurements with S i l ica C e l l s ................... ................... 139 10.3 Elec t r ica l Conductivity of Molten F luor ides and Fluoroborates ............ ...................... 140
11 . BEHAVIOR O F MOLYBDENUM FLUOKIDES ................................................................. 142
11.1 Synthes is of Molybdenum Fluor ides .............................................................................................. 142
1.31
10 . S'TUDIES WITH LiF-BeF2 MELTS .............................................................................. ................... 136
10.2 Containment of Molten F luor ides in S i l ica .................. ................................................. 137 Chemistry ........................................................................ ................... 137
11.2 11.3
Reaction of Molybdenum Fluor ides with Molten LiF-BeF, Mixtures ................
Mass Spectrometry of Molybdenum Fluor ides ........................................................
vi
12 . SEPARtZTION O F FISSION PRODUCTS ANI) OF' PROTACTINIUM FROM MOLTEN FLUORIDES .....................................................................................................................
12.1 Extraction of Protactinium from Molten Fluorides into Molten Metals ....................................
12.2 Stability of Protactinium-Bismuth Solutions Contained in Graphite ........................................
12.3 Attempted Electrolytic Deposition of Protactinium .............................................................
12.4 Protactinium Studies in the High-Alpha Molten-Salt Laboratory ................................................
Thorium Reduction in the P resence of an Iron Surface (Biillo P rocess ) ................................. Thorium Reduction Followed by Fil tration ............................................................................... Conclusion ......................................................................................................................................
MSBIi Fuel Reprocessing by Reductive Extraction into Molten Bismuth ................................
Reductive Extraction of Cerium from L iF-BeF , (66-31 Mole X) .into Pb-Bi
Reduction of Iron Dissolved i n Molten L iF-ThF , ............................. ...................................
12.5
12.6 . . Eutec t ic Mixture ...........................................................................................................................
148
148
149
151 1.53 153 153 154 154 154
156
13 . BEHAVIOR O F BF, AND FLUOROBORATE MIXTURES ..................................................................... 158 13.1 P h a s e Rela t ions in Fluoroborate Systems ................................................................................. 158 13.2 Dissociation Vapor P res su res in the NaBF,- N a F System .......................................................... 159
13.3 161 Apparent Mass Transfer of Nickel .................................................................................................. 163
13.4 Reaction of BF, with Chromium Metal at 650°C .................... .............................................. 163
13.5 Compatibility of BF', with Gulfspin-35 Pump Oil a t 150°F ........................................................ 164
Reactions of Fluoroborates with Chromium and Other Hastelloy N Consti tuents ..................
14 . DEVELOPMENT AND EVALUATION O F ANALYTICAL METHODS FOR MOLTEN-SALT REACTORS ......................................................................................................
14.1
14 .2 14.3 In-Line T e s t Facil i ty .............................................. .......................................................
Determination of Oxide in MSRE Salts ............................................................
Determination of U3' in Radioactive Fue l by a Hydrogen Reduction Method .......
14.4 Electroreduction of Uraniurn(1V) in Molten LilF-EeF,-ZrF, a t F a s t Scan R a t e s . . and Short Transit ion Times ..........................................................................................................
............... 14.5
14.6
14.7
Spectrophotometric Studies of Molten Fluoride Sa l t s ........................................
Analys is of Off-Gas from Compatibility Tests of MSRE P u m p Oi l with BF, ..........................
Development of a Gas Chromatograph for the MSKE Blanket G a s ..........................................
166
167
167
169
169 171 172 172
PART 4 . MOLTEN-SALT IRRADIATION EXPERIMENTS
15 . MOL'1'EN-SALT CONVECTION LOOP IN T H E ORR .............................................................................. 176
15.1 Loop Description . . . . . . . ................................................................................................................. 176
15.2 Operation ............................................................................................................................................ 177 15.3 Operating Temperatures ....... ..................................................................................... 179
15.4 Sa l t Circulation by Convection ..................................................................................................... 180
15.5 Nuclear Heat, Neutron Flux, and Salt Power Density ................................................................ 180
15.6 Corrosion .......................................................................................................................................... 181
vii
15.7 Oxygen Analysis ..............................................................................................................................
15.8 Crack in the Core Outlet P ipe .................................. ..................................................
15-9 Cutup of Loop and Preparation of Samples .................................................................................. 15.10 Metallographic Examination ...................................................................................................
15.11 Isotope Activity Calculation from Flux and Inventory History ..................................................
15.12 Isotope Activity Balance ............................................................................ .............................. 15.13 Uranium-235 Observed in Graphite Samples ..................... .......................................................
15.14 Penetration of F i s s ion Products into Graphite and Deposition onto Surfaces ........................
15.15 Gamma Irradiation of Fue l Salt i n t he Solid P h a s e .....................................................................
. PART 5 . MATERIALS DEVELOPMENT
16 . MSRE SURVEILLANCE PROGRAM ..... ................................................................................................
16.1 General Description of the Surveillance Facil i ty and Observat ions on Samples Removed ....................................................................................... ..............................
Mechanical Properties of the MSRE Hastelloy N Surveillance Specimens .............................. 16.2
1 7 . GRAPI-IITE STUDIES .................................................................................... .................
17.1
17.2 Graphite Surface Sealing with Metals ............................................................................................
17.3 Gas Impregnation of MSBR Graphites ............................................ .........................
Mateiials Procurement and Property Evaluat ion ............................
17.4 Irradiation of Graphite ...................... ..........................................................................
18 . HASTELLOY N STUDIES ..........................................................................................................................
18.1 Imprcivitig the Res is tance of Hastelloy N to Radiation Damage by Composition Modifications .......................... ............................................................................
18.2 Aging Studies on Titanium-Modified Hastelloy N ........................................................................ 18.3 P h a s e Identification Studies in Hastelloy N ............ .............................................
18.4 Hot-Ductility Studies o f Zirconium-Rearing Modified Hastelloy N ........ ...............................
18.5 Res idua l Stress Measurements in Hastel loy N Welds ..................................................................
18.6 Corrosion Studies ...................................................... ........................................................... File 1 Sal t s ................................................................................................................ Coolmt Sa l t s .................................................................................................................................... Equipment Modifications ............ ..............................................................................
18.8 Hastelloy N-Tellurium Compatibility ............................................................................................
19 . GRAPHITE-TO-METAL JOINING ............................................................................................. ........
18.7 Titanium Diffusion i n Hastel loy N .......................................................... ...............................
19.1 Brazing of Graphite to Hastelloy N ................................................................................................ Joint Design ...................................................... .............................................. Brazing Development ........................................................................................................................
19.2 Compatibility of Graphite-Molybdenum t3razed Joints with Molten Fluoride Sa l t s ..................
182
182
184
185 187 190
190
192
193
196
196
200
208
208
211
212
215
217
217
217
219
221
223
226 226 227 230
230
233
236
236 236 237
237
. . . Vlll
PART 6 . MOLTEN-SALT PROCESSING AND PREPARATION
20 . VAPOR-LIQUID EQUtLIRKTURI DATA IN MOLTEN-SALT MIXTURES ............................................ 239
21 . RELATIVE VOLATlLITY MEASUREMENT B Y 'THE TRANSPIRATION METHOD .......................... 2.13
22 . DISTILLA'TION OF MSKE FUEL CARRIER SALT .............................................................................. 243
23 . STEADY-STATE FISSION PRODOCT CONCENTRATIONS AND HEAT GENERA'TION IN AN MSBK AND PROCESSING PLANT ..........................................................................................
Heat Generation in a Molten-Salt Still ..................................................................................................
215
247
24 . REDUCTIVE EXTRACTION O F RARE EARTHS FROM FUEL SALT 748
2.5. MODIFICATIONS T O MSRE FUET. PROCESSING FACILITY FOR SHORT DECAY CYCLE .......... 251
26 . PREPARATION O F 2 3 3 U F -71.iF FUEL CONCENTRATE FOR THE MSRE .................................... 252
Process ...................................................................................................................................................... 252 Equipment and Operations ....................................................... ........................................................... 252 Status ........................................................................................................................................................ 253
Introduction
i
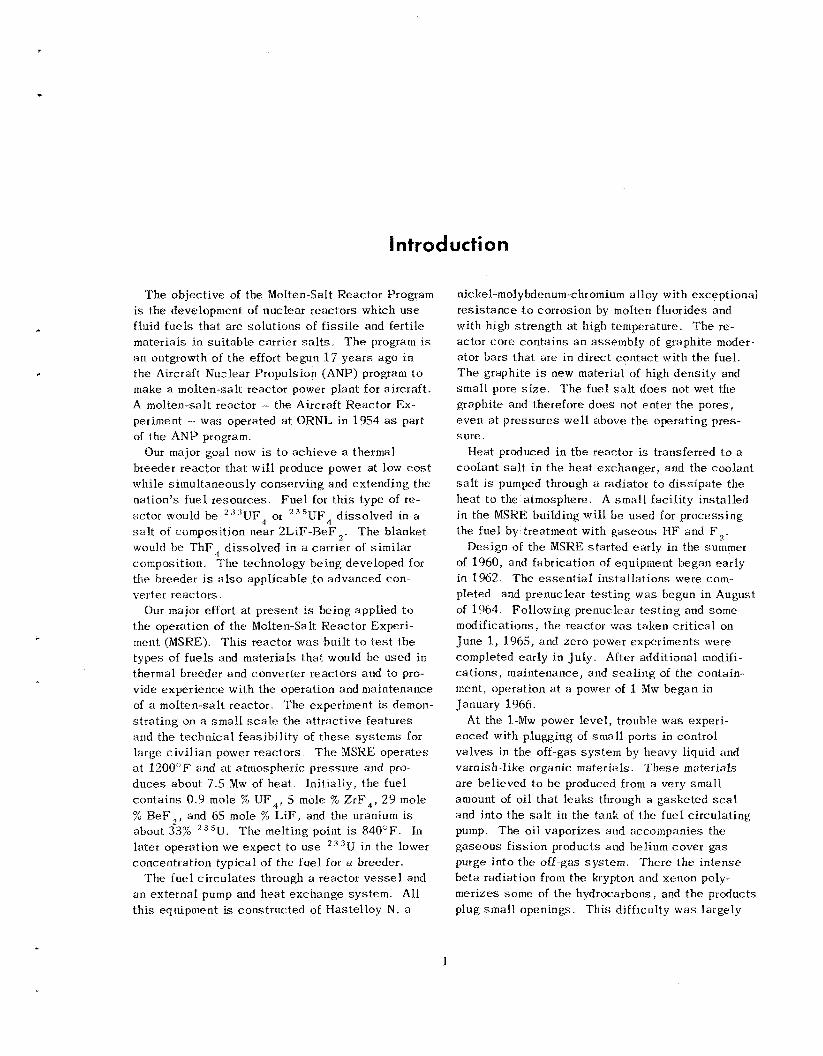
T h e objective of the Molten-Salt Reactor Program is the development of nuclear reactors which u s e fluid fue ls tha t are solutions of fissile and fert i le materials in su i tab le carrier s a l t s . T h e program is a n outgrowth of the effort begun 17 years ago in the Aircraft Nuclear Propuls ion (ANP) program t o make a molten-salt reactor power plant for aircraft . A molten-salt reactor - the Aircraft Reactor Ex- periment --- was operated a t ORNL in 19.54 as part of the ANI? program.
breeder reactor that will ptoduce power a t low cost while s imultaneous ly conserving a ntI e x tend in g the nation's fuel resources. Fuel for t h i s type of re- actor would be 2 3 3 U F or 235UF, dissolved in a >salt of composition near 2L iF-BeF2 . The blanket would be ThF , dissolved in a carrier of similar composition. The technology being developed for the breeder is a l s o applicable to advanced con- verter reactors.
Our major effort at present is being applied tu the operation of the Molten-Salt Reactor Experi- ment (MSRE). Th i s reactor was built t o t e s t the types of fue ls and materials tha t would be used in thermal breeder and converter reactors and to pro- vide experience with the operation and maintenance of a molten-salt reactor. The experiment is demon- s t ra t ing 011 a smal l scale the attractive features and the technica l feasibil i ty of these sys tems for large c iv i l ian power reactors. T h e MSRE operates a t 1200°F and at atmospheric pressure and pro- duces about 7.5 Mw of hea t . Init ially, the fue l contains 0.9 mule "/o UF,, 5 mole 76 ZrF, , 29 mole 76 BeF, , and 65 mole 76 LiF, and the uranium is about 33% 235U. The melting point is 84O0F. In later operation we expec t to use 233U in t he tower concentration typical of the fuel for a breeder.
The fuel c i rcu la tes through a reactor v e s s e l and an ex terna l pump and heat exchange sys tem. All t h i s equipment is constructed of Hastelloy N , a
Our major goal now is to achieve a thermal
4
nickel-molybdenum-chromium alloy with exceptional res i s tance to corrosion by molten fluorides and with high s t rength a t high temperature. 'The re- actor core contains a n assembly of graphite moder- ator bars tha t are i n d i rec t contact with the fue l . T h e graphite is new material of high dens i ty and smal l pore s i z e . The fuel s a l t d o e s not wet the graphite and therefore does not enter the pores, even a t p ressures w e l l above the operating pres- sure .
Heat produced in the reactor is transferred t o a coolant s a l t i n t he heat exchanger , and the coolant s a l t i s pumped through a radiator to d i s s ipa t e the heat t o the atmosphere. A sma l l facil i ty installed i n the MSRE building will be used for processing the fuel by treatment with gaseous H F and Fz.
Design of the MSKE s ta r ted early in the summer of 1960, and fabrication of equipment began ear ly in 1962. The e s s e n t i a l installations were com- pleted and prenuclear tes t ing was begun in August of 1964. Fol lowing prenuclear tes t ing and s o m e modifications, the reactor w a s taken cr i t i ca l on June 1, 1965, and zero-power experiments were completed ear ly i n July. After additional modifi- ca i ions , maintenance, and sea l ing of the contain- ment, operation a t a power of 1 Mw began in January 1966.
At the 1-Mw power level, trouble w a s experi- enced with plugging of small ports in control valves in the off-gas sys t em by heavy liquid and varnish-like organic materials. T h e s e materials a re believed to be produced from a very smal l amount of oil that l eaks through a gasketed s e a l and into the salt in the tank of the f u e l circulating pump. The o i l vaporizes and accompanies the gaseous f i ss ion products and helium cover gas purge i n t o the off-gas sys tem. There the in tense beta radiation from the krypton and xenon poly- merizes some of the hydrocarbons, and the products plug smal l openings. Th i s difficulty was largely
1
2
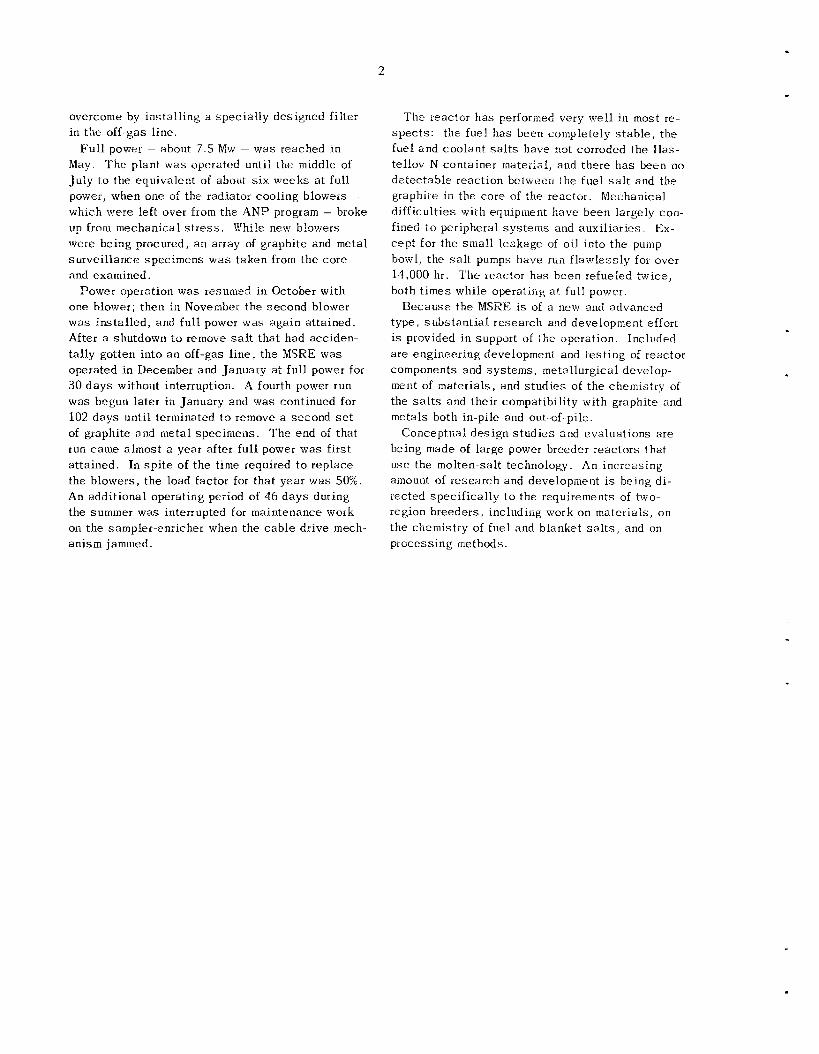
overcome by install ing a spec ia l ly designed filter i n the off-gas l ine.
F u l l powel - about 7.5 Mw - w a s reached in May. T h e plant w a s operated until the middle of July to the equivalent of about s i x weeks a t full. power, when one of the radiator cooling blowers - which were left over f r o m the A N P program - broke up from mechanical s t r e s s . While new blowers were being procured, an array of graphite and metal surve i l lance specimens w a s taken from the core and examined.
Power operation was resumed in October with one blower; then in November the second blower w a s ins ta l led , and full power was aga in attained. After a shutdowrn to remove s a l t that had acciden- tally gotten into a n off-gas l ine , t he MSRE was operated i n December and January a t full power for 30 d a y s without interruption. ‘4 fourth power run was begun later i n January and was continued for 102 days until terminated t o remove a second s e t of graphite and metal spec imens . T h e end of that run came almost a year after full power was first at tained. In s p i t e of the time required t o replace the blowers, t he load factor for that year was 50%. An additional operating period of 46 d a y s during the summer was interrupted for maintenance work on the sampler-enricher when the cab le drive mech- anism jammed.
The reactor h a s performed very well in most re- s p e c t s : the fuel h a s been completely s t ab le , the f u e l and coolant s a l t s have not corroded the Has- telloy N container material, and there h a s been no detec tab le reaction between the fue l s a l t and the graphite in the core of the reactor. Mechanical difficult ies with equipment have been largely con- fined t o peripheral sys t ems and auxi l ia r ies . Ex- cep t for the s m a l l l eakage of o i l into t h e pump bowl, the salt pumps have run f lawless ly for over 14,000 hr. T h e reactor has been refueled twice, both t imes while operating at full power.
Because the MSRE is of a new and advanced type, subs t an t i a l research and development effort i s provided in support of the operation. Included a r e engineering development and t e s t ing of reactor components and sys tems, metallurgical develop- ment of materials, and s tud ie s of the chemistry of the s a l t s and their compatibility with graphite and metals both in-pile and out.-of--pile.
Conceptnal des ign s tud ie s and evaluations a re being made of large power breeder reactors that u s e the molten-salt technology. An increasing amount of research and development i s being di- rected spec i f ica l ly t o the requirements of two- region breeders, including work on materials, o n the chemistry of fuel and blanket s a l t s , and on processing methods.
Summary
PART 1. MOLTEN-SALT REACTOR EXPERIMENT \
1. MSRE Operations
'There were t w o long runs a t fu l l power during t h i s report period. T h e first , run 11, began i n January and l a s t ed into May. After 102 consecut ive days of nuclear operation (over 90% of t h e time a t full power), t h e reactor w a s s h u t down t o retrieve and replace part of t h e graphite a n d metal specimens i n t h e core. T h e six-week shutdown also included scheduled maintenance and annual t e s t s of con- tainment, instruments, and controls. Run 22 in- cluded 12 days in which the reactor w a s a t full power continuously except for two brief periods after spur ious s c r a m s . T h e run ended when t h e fuel sampler-enricher drive mechanism jammed, making i t inoperative. T h e reactor w a s then shu t down, the d t ive was removed, a n d the sampler la tch , which had accidentally been seve red from the cab le , was retrieved from t h e fuel pump bowl.
During t h e long runs a t high power, in te res t focused primarily on reactivity behavior and on fuel chemistry. Slow changes in reactivity due to fission product ingrowth and uraniutn burnup fol- lowed expec ta t ions , and no anomalous e f fec t was observed ou t s ide t h e very narrow limits of pte- c i s ion of measurement (i0.02% c'jk/k). Over 2 kg of operation. T h e operation, us ing t h e sampler- enricher, demorist rated quick but smooth mel t ing and mixing in to t h e circulating fuel. Six additions of beryllium metal were made t o t h e fuel during operation t o maintain reducing conditions in t h e sa l t . Corrosion in t h e s a l t sys t ems w a s practically nil, as evidenced by chromium ana lyses and exami- nation of t h e co re specimens. S tudies of t h e be- havior of certain f i s s ion products continued.
Component performance, on t h e whole, w a s very good. There w a s no deterioration of hea t transfer
"U was added to t h e fue l during full-power
capabili ty or ev idence of unusual hea t generation in t h e reactor ves se l . reactor cell began giving anomalous readings during run 11, but all o ther thermocouples showed no tendency to become less accura te . T h e new off- gas fi l ter showed no inc rease in pressure drop and apparently remained qu i t e efficient. Restrictions tha t built u p s lowly a t t h e main charcoal bed in-- l e t s were effectively c leared by the u s e of built-in hea ters . While t h e reactor w a s down in May for sample removal, two conditions tha t had ex is ted f o r some time were remedied: tion indicator on a control rod drive and a leaking s p a c e cooler i n t h e reactor cell were replaced.
only de l ays in t h e experimental program due to equipment difficult ies were brief ones caused by t.he main blowers and a component ctmling pump. A main blower bearing w a s replaced in run 11, and shortly a f te r t h e s ta r t of run 12 a main blower motor mount w a s stiffened lo a l lev ia te a resonance condition. Also a t t h e s ta r t of run 12, low o i l pressure made a component coolant pump inopera- t ive until t h e relief va lve was replaced. Secondary containment leakage remained well within pre- scribed limits, and there was no leakage from pri- mary sys t ems during operation. During t h e six- month period, t h e reactor was c r i t i ca l 2925 hr (66% of t h e time), and t h e integrated power in- c r eased b y 2597 to a t o t a l of 5557 equivalent full- power hours.
Six thermocouples in the
an inoperative posi-
Until t h e sampler failure a t t h e end of run 12, t h e
2. Component Development
Extens ive preparations were made for remote maintenance in the May-June shutdown, including training of 30 craftsmen and foremen. Work pro- ceeded during the shutdown on two sh i f t s Pto- cedutes and too l s prepared i n advance worked well i n replacing core spec imens , repairing a control-rod
3
4
drive, replacing a reactor cell s p a c e cooler, and inspecting equipment in t h e reactor cell .
When t h e sampler became inoperative, prepara- t ions were f i r s t made for shielding and containment during replacement of t h e mechanism and retrieval of t h e latch. T h e mechanism w a s then removed, and a maintenance sh ie ld was s e t u p for t h e la tch retrieval. Various long, f lexible tools were de- signed and t e s t ed i n a rriockup before u s e in the sampler tube. T h e la tch was grasped readily, but difficult ies were encountered in bringing i t up until a tool was designed tha t enc losed t h e upper end of the latch. were heavily contaminated, and a sh ie lded carrier with d isposable l iner was devised to handle them. The sample capsu le had broken loose from t h e latch and cab le .and was left in t h e pump bowl a f te r an effort to retrieve i t with a magnet failed. The sampler repair and capsu le retrieval were accom- plished without spread of contamination and with very moderate radiation exposures.
A sampler manipulator w a s s u c c e s s h l l y decon- taminated for reuse in a t e s t of decontamination methods.
A scheme for iiiapping and identifying f i ss ion prodiict sou rces remotely was t e s t ed in t h e reactor cell during the May shutdown. A lead-tube colli- mator and an ionization chamber mounted in the movable maintenance sh ie ld were used to map gariima-ray sources in the hea t exchanger and ad- jacent piping; then a collimator and a gamma energy spectrometer were u s e d to charac te r ize t h e sou rce at various points. Resu l t s were promising.
Installation of the off-gas sampler w a s delayed when t h e va lve manifold had to b e rebuilt because of imperfect Monel-stainless s t e e l welds .
S t ress t e s t s on a Mark-l pump tank nozz le were completed. Resu l t s compared favorably with ca l - culated s t r e s s e s , and t h e design w a s judged a d e - quate. T h e Mark-2 replacement fuel pump tank for the MSRE w a s completed, and preparations for a t e s t with sa l t proceeded.
Oil pumps removed from t h e MSRE were repaired and tes ted . A replacement rotary element for t h e coolant s a l t pump w a s modified by s e a l welding a mechanical s e a l that might have become a path for oil leakage to t h e pump bowl.
Tools removed f rom the sampler tube
3. Instruments and Controls
During t h e May shutdown a complete functional check of instrumentation and control sys t ems w a s made. Preventive maintenance a t tha t t ime included
modifying 139 relays and replacing capac i tors i n 33 electronic control modules. T h e type of com- ponent failures tha t occurred did not compromise sa fe ty or c a u s e excess ive inconvenience. Four of t h e eight neutron chambers were replaced, one because of a shor t and three because of moisture inleakage.
Separate power suppl ies were ins ta l led for each sa fe ty channel to improve continuity of operation and preclude a s ing le compromising failure. Various other modifications t o c i rcu i t s o r com- ponents were made to provid2 more information, t o improve performance, o r t o inc rease protection.
4. MSWE Reoctar Analysis
As part of planning for future operation of t h e MSRE, computational s tud ie s were made of t h e neutronic properties of t h e reactor with 2 3 3 U in the fuel s a l t ins tead of t h e present 2 3 5 U (33% enriched). The neutron energy spectrum w a s coni- puted and compared in detail with that for a core- la t t ice design being considered for a molten-salt breeder reactor. T h e strong s imi la r i t i es ind ica te that t h e resu l t s of t h e MSRE experiment will b e useful in evaluating design methods for t h e MSBK. Other computations were made, with t h e following results. The crit ical loading mill b e 33 kg of 2 3 3 U F cornpared with 70 kp, of 2 3 5 U in t h e first cri t ical experiment. Control rod worth will b e higher by a factor of about 1.3. coefficients will a l s o be considerably larger than with 2 3 5 U fuel. T h e thermal-neutron flux will b e up by more than a factor of 2, and the s teady-s ta te samarium concentrations will consequently b e lower. S ince more samarium will b e left in t h e salt from 2 3 5 U operation, i t will a c t a t f i r s t as a burn- ab le poison, caus ing t h e reactivity to r i s e for severa l weeks desp i t e 233U bumup. F i s s ion power dens i t i e s and importance functions will b e similar to those for 235U fuel. T h e e f fec t ive delayed- neutron fraction i n the s t a t i c sys tem will be 0.0026, decreasing t o 0.0017 when fuel circulation s ta r t s . (Corresponding fractions for 235U a r e 0.0067 and
T h e dynamic behavior with 233U was also ana- lyzed from t h e standpoint of t h e inherent s tab i l i ty of t h e system. Because of t h e small delayed- neutron fraction, t h e neutron l eve l responds more sens i t ive ly to changes in reactivity, but t he re- sponse of the to ta l system is such tha t t h e margins of inherent s tab i l i ty a re greater with 2 3 3 U fuel.
T h e important reactivity
0.0046.)
5
PART 2. MSBR DESlGN AND DEVELOPMENT
5. Design
T h e conceptual design work on molten-salt breeder reactors during the p a s t s ix months h a s been concerned largely with a general advance in the design of cells, containment, piping, and com- ponents, and with s t r e s s analysis . In addition, major effort h a s been devoted to preparation and evaluation of a reactor design in which the average core power densi ty is reduced to 20 kw/li ter from the 40 kw/l i ler w e were using during the previous repoiting period. A t t h i s lower power density t h e core l i f e before replacement is required would be adequate even if t h e graphite behavior under irra- diation is no bet ter than tha t which h a s been achieved to date . The pe r fomance a t the lower power density is more nearly representat ive of current technology, and bet ter performance should be achievable a s better graphite is developed. Going from 40 to 20 kw/li ter i n c r e a s e s the capi ta l c o s t by $6/lrwhr (electrical). No new design work was performed on t h e s t e a m system, but all s a l t sys t ems (fuel, b lanket , and coolant) have been in- vest igated more thoroughly than has been done heretofore. Afterheat removal and t h e m a l sh ie ld cooling have been evaluated.
graphite and other s i n k s in the R.1SBIs. Work done to da te ind ica tes tha t the m a s s transfer coefficient fmm the circulating s a l t to the graphite is more important fhan t h e diifusion coefficient of xenon in graphite in minimizing t.he poisoning due to xenon migration to t h e graphite. In addition, the work h a s shown that removal of xenon from molten-salt fuels is strongly controlled by the mass transfer coefficient to entrained g a s bubbles as well a s by the surface area of those bubbles. Studies ind ica te that t h e xenon poison fraction i n the MSBR is greater than 0.5% with t h e parameter values con- s idered previously and that the poison fraction may be about 1% with t h o s e parameters. The xenon poisoning can be decreased s l ight ly by increasing the sur face area of once-through bubbles , decreased significantly by increasing the sur face area of re- circulating bubbles , decreased significantly by increasing the m a s s transfer coeff ic ient t o circu- la t ing bubbles, decreased proportionately by re- ducing t h e graphite surface area exposed to salt, and decreased s ignif icant ly i f t h e diffusion co- efficient of xenon into graphite can b e decreased to low7 ft '/hr or less. Similar s tud ies of the after- h e a t in the graphite from the disintegration of the radioactive noble g a s e s and their decay products show tha t t h e af terheat is affected by a variation of the parameters in very much the s a m e manner a s the xenon poisoning.
an early demonstration of t h e compatibility of a full-sized graphite fuel cell with a flowing sal t stream. 'The cell will include t h e graphite-to- graphite and t h e graphite-to-metal joi,nts.
A s part of a program to qualify sodium fluoro- borate (NaBF,) for u s e as a coolant for the MSBR, an ex is t ing MSRE-scale loop is being prepared to accept NaBF, a s the circulating medium under isothermal conditions. The principal a l terat ions are to the cover g a s system, to include the equip- ment necessa ry f o r handling and controll ing the required overpressure of BF,. The object ive wil l b e to iinc'over any p r o b l e m assoc ia ted with the circulation of NaBF, and to devise and tes t sui t - ab le solut ions o r corrective measures .
A report was i s s u e d of a survey of experience with liquid-metal and molten-salt pumps. An ap- proach to producing t h e breeder s a l t pumps, which invi tes the strong participation of U.S. industry, was evolved. T h e dynamic response and cr i t ical s p e e d s for preliminary layouts of t h e WSBF: fuel salt pump are being calculated, and a survey of fabrication methods appl icable to t h e pump is being
An experimental program was s ta r ted to provide
7. Systems and Campanents Development
An analyt ical model was developed to compute the s teady-state migration of noble g a s e s to the
6, Reactor Physics
Parametr ic s t u d i e s have been carried out which reveal the dependence of MSBR performance on such key design features as the average cure power density. They indica te tha t the power density may be reduced from 80 w/cni3 to 20 w/cm3 with a penalty not greater than 2%/year in annual fuel yield or 0.1 mill/kwhr (electrical) in power cost. At 20 w/cm3 the l i fe of t h e graphite will b e In e x c e s s of ten years .
Studies of power flattening in the MSRR core s h o w that a maxlmum-to-average power densi ty ratio of 2 or less c a n b e achieved with no loss of performance.
Ca lcu lahons of temperamre coeff ic ients of re- act ivi ty show that t h e large nega t ive component due to fuel expansion is dominant, and yield an overall temperature Coefficient of -4 3 Y IO '/"C.
6
made. molten-salt bparing and water pump t e s t fac i l i t i es for t he MSBR fuel s a l t pump. T h e pump with the molten-salt bearing was fitted with a new s a l t bearing and a modified gimbals support and was satisfactorily t e s t ed with oil .
Preliminary layouts a r e being made of
8. Chemistry of the MSRE
Resul t s of regular chemical ana lyses of MSRE: fuel, coolant, and flush s a l t s showed tha t after 40,000 Mwhr of power operation generalized corro- s ion i n t he fuel and coolant c i rcu i t s is practically absent and tha t t h e s a l t s are currently a s pure a s when charged into t h e reactor. Although s ta t i s t i - ca l ly satisfactory, fuel composition ana lyses a r e much l e s s s ens i t i ve to variations in uranium con- centration than i s t h e reactivity ba lance , and im- proved methods will be required for future MSR fuels whose uranium concentrations n e e d to be only 0 .25 that of t h e MSRE fuel s a l t .
A program for a d j u s h g t h e relative conceritra- tion of U3+/C1J to approximately 1.5% by addition of small amounts of beryllium metal to t h e MSRE fuel was completed. Specimeus of fuel s a l t t aken from t h e pump howl during t h i s program showed occas iona l temporary perturbation i n the chromium concentration, giving ev idence tha t t h e identity and concentrations of t h e phases present a t t h e sa l t -gas interface of t h e pump bowl a r e not neces- sari ly typ ica l of t h e s a l t in t he fuel circuit.
9. F i s s i o n Product Behavior in the MSRE
A second s e t of graphite and Has te l loy N long- term surveil lance specimens, exposed to fissioning molten s a l t in t he MSRE core for 24,000 Mwhr, was examined and analyzed. As f o r t h e first s e t , ex- posed for 7800 Mwhr, examination revealed no evidence of chemical damage to t h e graphite and metal. Very similar f iss ion product behavior was observed, with heavy deposition of t h e noble- metal fission products - "Mo, I3'Te, Io3Ru, Io6Ru , "Nb, and "'Ag - on both metal and graphite specimens. A refined method of sampling of the graphite sur faces showed tha t about 99% of t h e "Mo, 95Nb, '03Ru, and was deposited within t h e outer 2 mils of t h e surface. By con- t ras t , appreciable fractions of t h e ' 'Te, "Zr,
14'Ba, and "Sr penetrated SO mils or farther into the graphite.
Ten additional exposures o f metal specimens in the MSKE pump b o ~ l and five additional samplings of pump bowl cover g a s were carried out. The re-- su l t s from t e s t s under norinal operating conditions were similar t o t h o s e of previous t e s t s ; they showed heavy depos i t ions of noble meta ls on specimens exposed t o the cover g a s and the fuel phase. under unusual operating conditions: near ly a s much deposition occurred after reactor shutdown with the fue l pump stopped and with t h e reactor drained a s occurred under normal conditions.
Analys is of t h e t.ime dependence of f i ss ion product deposition on Hastelloy N indicated tha t there w a s a short-term iapid proccss tha t reached saturation i n about 1 min and a long-term process that proceeded a t s low constant rate for over 3000 hr. graphite specimens indicated tha t deposit ion rate decreased with exposure time for long exposures.
Of spec ia l in te res t were t h e observations
Resul t s from only three exposures of
10. Studies with LiF-BeF Melts
Equilibrium data have been obtained for t h e renction
U 4 '(f) + Th4 ' ( 0 ) .-...' .- Th4'(f) i U4+(o) ;
where ( f ) ind ica tes tha t the s p e c i e s is dissolved in molten 2 L i F . BrF2 and ( 0 ) ind ica tes that t he s p e c i e s is in t h e sparingly so luble oxide so l id solution (U, T h ) 0 2 . T h e s e da t a show that, over the interval 0.2 to 0.9 for m o l e fraction uranium in the oxide phase and 0.01 to 0.0'1 for mole fraction 'l'h4* in t h e molten fluoride, t he equilibrium con- s tan t is in e x c e s s of 1000. Uranium is strongly extracted from the fluoride phase t o the oxide so l id solution. It s e e m s very l ikely that protactinium is even more strongly ex t rac ted . If so , equilibration of a n L iF -BeF 2-ThF ,-UF ,-PaF e r (stable) (U,Th)02 so l id solution should remove protactinium. breeder fuel would, accordingly, b e possible.
Vitreous silica (SO,) h a s been shown to be a feas ib le container material for IAiF-ReF2 melts,
melt with the prop-
Recovery of 2 3 3 ~ a from a one-region
7
espec ia l ly when the sys tem is s t ab i l i zed by a s m a l l overpressure of SiF4. Preliminary measure- ments have shown tha t the solubili ty of S i F 4 in 2LiF I Bel?,, is moderately low (about 0.035 mole of Sip4 per kilogram of m e l t per atmosphere of SiF4) at 5 5 0 T and at l e a s t threefold less a t 700°C. N o evidence f o r s i l i con oxyfluorides h a s been ob- served. I t appears tha t , a t Least for temperatures near 500OC and for short t imes, an electrically in- sulat-ing and optically transparent container for EiF-BeF, so lu t ions is available.
Optical c e l l s of transparent. SiO, have been used to e s t ab l i sh , with a Cary model 14M spectrophotom- e te r , tha t so lu t ions of UF, i n 2LiF'. H e F , , under 400 mm of SiF4 were s t ab le for 48 hr a t tempera- tures up to 7OO0C, T h e s e s t u d i e s have led to a considerably more prec ise definition oE molar ab- sorptivity of tj"' a s a function of temperature and incident wavelength than had previously been poss ib le with windowless opt ica l ce l l s . spectrophotometric s t u d i e s with s i l i c a ce l l s , the solubili ty a t 550°C of Cr3' in 2LiF. EkF, was showti to b e at least 0.43 mole %.
Silica appara tus h a s a l s o been shown to b e feas ib le for s tud ie s of e lec t r ica l conductivity of 2LiE'-&F2, of the LiF'- 'fhF4 eu tec t ic mixture, and of NaBF,. Preliminary va lues obtained in th i s study are to b e refined i n t h e near future by u s e of an improved ce l l design which will provide a much longer current path length through the melts.
In similar
11. Behavior of Molybdenum Fluorides
Molybdenum hexafluoride, the only commercially available fluoride of t h i s element, h a s been used a s raw material for preparation of MoF5 and MoF,. Direct reduction of MoF6 by molybdenum metal in glaszj apparatus at 30 to 1DOO"C yie lds , as shown by other investigators, MoF, of goo6 quality. Dis- proportionation of MoF under vacuum at 200°C yie lds pure Mop, as the so l id residue; we have prepared seve ra l samples of t h e material by t h i s method, which seems not to have been described before. T h e MoF, reac ts on heating with I,iF to form at least two binary compounds; the optical and x-ray charac te r i s t ics of t h e s e materials have been determined, but their stoichiome try h a s not yet been es tab l i shed .
act rapidly with UF, in LiF-BeF, solution and with nickel i n contac t with such solutions. Molyh- denum trifluoride h a s been shown to be relatively
Molybdenum hexafluoride bas been shown to re-
s t ab le when hea ted t o 7 0 0 T under its vapor in sea l ed capsu le s of nickel o r copper. However, when such heating is done in the presence of 2LiF - ReF 2, t he MoF, reac ts readily with nickel, yielding NiF' and Mo; t h e reaction is less marked if the capsule is of copper. Molybdenum trifluoride h a s been shown to reac t completely at SOOOC with UF, in LiF. B e F , mixtures; the products are U F , and Mo.
Vaporization behavior of MoF3 has been shown, by examination with a time-of-flight m a s s spec- trometer, to b e complex and temperature dependent. The behavior observed may sugges t tha t the f r ee energ ies of formation (per fluorine atom) of t h e s e intermediate molybdenum fluorides a r e so nearly equal that t h e descr ip t ive chemistry of t h e s e sub- s t a n c e s is dominated by kinetic factors.
12. Separation of Fission Products and of Protactinium from Molten Fluorides
Very dilute so lu t ions of 233Pa in bismuth have been shown t o b e s t ab le for extended periods in graphite containers, but the protactinium appears to be strongly adsorbed upon any added metal or any precipitated phase . M o r e than 90% of the con- tained '' ,Pa h a s been successfu l ly transferred from L iF-BeF ,-ThF, blanket mixtures through a molten Hi-Sn metal phase and recovered in an IAF-NaF-KF s a l t mixture by adding T h reductant to the blanket mixture and oxidant WF to t he re- covery sa l t ; success fu l operation of this experi- mental assembly sugges t s tha t a redox t ransfer prowess for Pa should be ki3sible. More concen- trated solutions of 2 3 1 ~ a plus 2 3 3 ~ a in rea l i s t ic blanket mixtures continue to b e successfu l ly re- duced to insoluble so l id material by the addition of thorium metal. Passage of s u c h reduced mix- tu res through sintered n icke l filters produces a virtually protactinium-free fi l trate but fajts to loca l ize the Pa in a readily manageable form.
Preliminary at-tempts to reduce '.' 'Pa plus 233Pa solutions in simulated blanket mixtures to insoluble materials by electrochemical means were unsuccessfu l ; such reduction certainly seems feasible, and t h e experiments wil l continue.
Rare-earth fluorides in uranium-free L iF -BeF so lu t ions are readily reduced to the metall ic s t a t e and a re transferred to the molten bismuth upon contact with a molten al.loy of l i thium in bismuth. Pteliminary ev idence sugges t s tha t separa t ions of uranium from t h e rare ea r ths and, perhaps, of
8
uranium from zirconium may be poss ib le by t h i s reductive extraction technique. Material ba lances on the reductant m e poor in experiments to date; t h i s problem will receive additional attention in future experiments. U s e of a Pb-Bi alloy with 51 a t . % Bi a s a subs t i tu te for pure bismuth in similar extractions gave generally unsatisfactory results.
13. Behavior of BE, and Fluoroborate Mixtures
Recrystall ization of NaBF, and of KBE’, from dilute (usually 0 .5 M ) aqueous hydrofluoric ac id so lu t ions y ie lds preparations which melt a t higher temperatures and which are almost certainly more pure than those reported by previous investigators. T h e s e preparations, and oiir standard differential thermal ana lys i s and quenching techniques, have been used to examine t h e binary sys t ems NaF- N a B F 4 and KF-KBF, and the NaBF,-KBF, and NaF-KBF4 jo ins in t he ternary sys tem NaF-KF-BF 3. T h e NaP-NaHF, and the KF-KEF, sys t ems show s ingle s imple eu tec t ics ; phase diagrams which we consider t o b e correct, but which a re a t variance with da t a f rom other laboratories, a r e presented i n th i s report.
P re s su res of BF, in equjlibriurn with NaF-NaBI?, mixtures over t he composition interval 65 to 100 mole % NaBF, have been measured a t temperatures of in te res t t o t h e MSKI-;. Introduction of chromium metal ch ips into t h e system wi th t h e NaF-NaBF, eu tec t ic (92 mole ?L NaHI;’,) led to perceptible re- action. After the sample had been above SOOOC for 26 hr, the BF, pressure observed was twice that from t h e melt without added chromium. Subsequent examination of the materials revealed NaCrFd a s one of the reaction products with an additional un- identified black material also present. Other e x - periments with Hastelloy N, iron, and molybdenum showed l i t t l e or no visual. ev idence of a t tack ; t hese t e s t s (for which d issoc ia t ion pressure w a s not monitored) did show perceptible weight losses for both the Hastelloy N and iron spec imens . In addition, nickel v e s s e l s u sed in the routine de- composition pressure measurements showed shiny interior sur faces , which sugges t that some m a s s transfer had occurred.
650°C with essent ia l ly pure metall ic chromium in the fnim of thin flakes. mium sample increased linearly with square root of time; x-ray diffraction techniques have revealed the
Boron trifluoride g a s h a s been showii to react a t
‘Weight gain of the chro-
mixed fluoride CrF, .CrF , as a reaction product.
been exposed for 600 hr a t lSO°F to helium g a s containing 0.1 vol % BF3. In these t e s t s the g a s mixture was bubbled a t 1 liter/min through 1.S li ters of t h e lubricating oil . Some discoloration of the oil was noted, but there was no distinguishable i n c r e a s e in. v i scos i ty .
Gulfspin-35 pump oil ( the type used in MSRE) h a s
14. Development and Evaluation of Anicalytical Methods for Molten-Salt Reactor5
T h e determination of oxide in highly radioactive MSRE. fuel samples w a s continued. .The replace- ment of the moisture monitor ce l l was the first major maintenance performed s i n c e t h e oxide equip- ment was ins ta l led in the hot ce l l .
The U S + concentrations in the fuel samples run to da t e by the transpiration technique do not re- flect the beryllium additions which have been made to reduce the reactor fuel. T h i s may b e accounted for by an interference stemming from the radiolytic generation o f fluorine in t h e fue l samples . Th i s problem will receive further investigation. Expcri-- mental work is also being carried ou t to deveiop a method for the remote measurement of ppm concen- trations of I1E’ in helium or hydrogen gas streams.
Design work was continued on the experimental molten-salt t e s t loop which will bc used to eva lua te electrometric, spectrophotometric, and transpiration methods f o r t h e ana lys i s of flowing molten-salt s t reaiii s .
Controlled-potential voltammetric and chrono- potentiometric s tud ie s were carried out on t h e re- duction of U(1V) in molten fluoride s a l t s using a new cyc l ic voltammeter. It was concluded that the U(1V) + U(II1) reduction in molten LiF’-HeE’,- ZrF, is a reversible one-electron p rocess but tha t adsorption phenomena must be taken into account for voltarnmetric measurements a t f a s t s c a n rates or for chronopotentiometric measurements a t short transit ion t imes.
An investigation of t h e spectrum of U(V1) in molten fluoride s a l t s h a s been init iated. It was found that t h e spectrum of Na,UF, d isso lved in LAP-HeF, i n an SiO, ce l l with SiF, overpressure was identical to the spectrum of UO 2F disso lved under identical conditions. It appears tha t the equilibrium concentration of 0’- may b e sufficient to react with the components of the melt. An at- tempt t o use t h e SiO,-SiF, sys tem i n t h e spectro- photometric investigation of electrochemically
generated s p e c i e s in molten fluorides also met with difficult ies. T h e S i p 4 overpressure interferes with ca thodic voltammetric s tud ie s by caus ing very high ca thodic currents.
It is planned to in s t a l l a spectrophotometric facil i ty with a n extended opt ica l path ad jacent to a high-radiation-level hot c e l l to permit. t h e obser- vation of absorption spec t ra of highly radioactive materials. T h e bas i c spectrophotometer and asso- c ia ted equipment have been ordered.
carbon concent ra t ions o f a n He-BF, gas stream after contact. with MSriE pump oil . A thermal con- ductivity deteci.or w a s used t o monitor t h e BF, concentration in t h e test gas stream.
Ilevelopment studies a re be ing made on the de- sign of a g a s chromatograph to b e used for the cont inuous determination of sub-ppm, low-pprn, and high concentrations of permanent g a s impurities and wa te r in the helium blanket g a s of t h e MSRE. T h i s problem of ana lyz ing radioactive g a s samples prompted the des ign and construcfion of an all- metal six-way pneumatically ac tua ted diaphragm valve. a g l a s s body w a s des igned and constructed to per- mit the observation of t h e helium discharge. Ullder optimum conditions, th i s detector h a s exhibited a niinimum de tec tab le limit below 1. ppb of impurity. It ;3ppears to be poss ib le tha t t h e de tec tor will a l so operate in the l e s s - sens i t i ve mode necessary for the determination of high-level concent ra t ions o f impurities in the blanket gas .
Measurements were made of inc reases in hydro-
A helium breakdown voltage detector with
PART 4. MOLTEN-SALT IRRAOIATION E X PE RIM ENT S
15, Molten-Salt Convection Loop in the QRR
Irradiation of the second molten-salt convection Ioop i n beam hole HN-1 of t h e Oak Ridge Research Reactor was tenminated after t he development oE 8.2 x 10' (65.3-28.2-4.8-1.7 mole %) fuel. Average fuel power dens i t i e s up to 150 w per cubic centimeter of s a l t were a t ta ined i n the fuel channels of the core of MSRE-grade graphite.
'The experiment w a s terminated after radioactivity was de tec ted in t h e secondary containment sys t ems as a result of gaseous f i ss ion product leakage from a crack in the core outlet tube. Salt samples were removed routinely during irradiation, and t h e fuel
f i s s ions / cc in the 7X3iF-BeF2-ZrF,-UF,
9
salt was drained from t h e loop before removal froin the reactor beam hole.
Me tallurgical examination revealed a nonductile c rack in t h e Hastelloy N core out le t pipe. T h e loop was made from unmodified material, and w e be l ieve tha t t h e failure was caused by loss of strength and ductil i ty under operating conditions of high temperature ("-730'C) and irradiation (q.5 x 10' nvt).
the system w a s obtained by the examination of sam- p l e s of core graphite and loop metal. Some ad- herence of fue l salt to the graphite and entry into c racks in the graphite were found. Molybdenum and tellurium (and probably ruthenium) were largely deposited on graphite and m e t a l sur faces . Other i so topes , including l 3 'I, '%r, I4'Ba, and "Nb, which could have been transport-ed as gases , were found to have penetrated the graphite.
Solid MSR fuel salt (LiF- -BeF 2--%rF,-UF,, about 65-28-5-2 mole X) was subjec ted to very high- intensity gainma irradiation in a spent HFIR fuel element a t a temperature of 320°C to determine poss ib le radiation e f fec ts on the salic. and i t s coin- patibility with graphite and I-lastelloy N. Post- irradiation examinati.on did not reveal any signifi- can t e f fec ts .
T h e distribution of various f i ss ion products in
PART 5. MATERIALS DEVELOPMENT
16. MSRE Surveillance Program
T h e materials surve i l lance program for following the changes in t h e properties of the two major MSRE structural materials - graphite and Has te l - loy N - h a s been maintained. Graphite and metal specimens were removed for examination on July 28, 1966 (7820 Mwhr), and on May 9, 1967 (32,450 Mwhr). We plan to run various phys ica l and me- chanica l property tests on t h e graphite, but w e have not considered th i s a n urgent i t e m s ince t h e d o s e s a re qu i t e low (approximately 1 x 10'' neu- trons/cm2, E 0.18 &lev). Exterisive mechanical property t e s t s have been run on the Hastelloy N. I t s high-temperature creep--rupture l ife and rupture ductility were reduced, but these changes are quite comparable with what we have observed for Hastelloy N irradiated i n the OKK. 'There w a s a s l igh t reduction in the low-temperature duct.ility, which w e attr ibute to t h e irradiation-bduced pre- cipitation oE intergranular M,C.
10
A set of Hastelloy N specimens located outs ide the reactor core was removed on May 9, 1967, after about 11,000 hr of exposure to t h e cell environ- ment. There w a s some sur face oxidation, about 0.003 in . , but no ev idence of nitriding.
‘The surveil lance program h a s been expanded to include some hea t s of modified Hastelloy N, and specimens tha t contained 0.5% Ti and 0.4% Zr were removed from t h e core on May 9, 1967. The me chanical tes t ing h a s not been completed, but metal- lographic s tud ie s revealed no significant corrosion.
17. Graphite Studies
Much of our materials program is directed toward finding su i t ab le materials for future molten-salt reactors. In our present concept of a molten-salt breeder reactor, graphite tubes wi l l be t h e struc- tural element that s epa ra t e s t h e fue l and fert i le s a l t s . spec ia l properties, particularly with respec t to a s m a l l pore spectrum, low g a s permeability, and dimensional stabil i ty under high neutron doses . We are looking c lose ly a t many grades of graphite that a re available from commercial vendors. Sev- eral grades look promising, but none completely sa t i f i e s our requirements.
L o w g a s permeability in graphite seems very hard to obtain, and w e feel t ha t producing mono- l i thic graphite bodies with helium permeabili t ies of
c m '/set will b e quite difficult. However, we n a y be ab le to sa t i s fy t h i s requirement by surface-sealing techniques. Our in i t ia l efforts with pyrocarbon and molybdenum sea lan t s look very promising. The proof test will be t o demon- s t r a t e that graphite s e a l e d in th i s manlier retains i t s l ow permeability after neutron exposure.
t o be a major problem. We are analyzing very cri t ically a l l the da ta obtained to da t e i o a n effort to determine what t ypes of graphite appear most s tab le . W e have s ta r ted our own experiments in the IIF[I<, where w e can obtain d o s e s of 4 x nvt ( E > 0.18 M e v ) in one year.
‘This will require a graphite wi th very
T h e dimensional instabil i ty of graphite cont inues
18. Hostelloy N Studies
Although the Hastelloy N wil l not b e in the core, it will b e loca ted in peripheral areas where i t will receive rather high doses . We have found that t he
properties of th i s b a s i c alloy can be improved sig- nificantly by s l igh t modifications in the romposi- tion. :?educing the niolybdenum from 16 to 12% suppres ses the formation of M,C, and small amounts (approximately 0.5%) of either Ti, Z r , or I l f improve the r e s i s t ance to radiation damage The titanium-modified alloy looks very good, and we are proceeding further with i t s development. Experiments a re being run to determine the sta- bility of t h i s alloy a t e leva ted temperatures, and specimens aged a t 1200 and 1400°F actually show some improvement in ductility. copy s tud ie s show tha t ’Tic and T i 2 0 precipitates are present i n the “solution annealed” condition. The changes in distribution and quantity of t h e s e precipitates in the aged specimens will bc de-- termi ned.
S ince titanium can be leached from Hastelloy N by fluoride s a l t s in a manner analogous to chromium, wc must cons ider t he cotrosion r e s i s t ance of t h e titanium-modified alloy. control-led by the diffusion rate of titanium in Hastelloy N, and measuremerits we have made in- d ica te that titanium di f fuses a t a rate comparable with tha t of chromium a t 2000°F. Thus , our small titanium addition will probably not adversely affect the corrosion res i s tance of the alloy.
Our welding s t u d i e s have shown that Ti and Hf additions to Hastelloy N do not affect t he welda- bility adversely, but tha t Zr is qui te detrirricntal. However, the postirradiation ducti l i ty of the Zr- modified alloy is qui te high, and we have tried to find a su i tab le technique for joining th i s alloy. Since residual s t r e s s e s from welding c a n c a u s e dimensional changes and even cracking, we have developed a technique for measuring the- -,, s t r e s s e s . We now can ad jus t welding parameters and post- weld hea t treatments t o minimize t h e magnitude of the residual s t r e s s e s .
We have two thermal convection loops miming which contain an L,iF-E3eF2-%rE;,-Uf;’,-ThF, fuel s a l t . One loop i s constructed of Has te l loy N and h a s operated satisfactorily at 1300OF for 47,440 hr. The second loop i s constructed of type 3041, s ta in- less steel with removable hot-leg specimens of t h e same material. T h e loop h a s operated at 1250OF for 36,160 hr, and the removable specimens have indicated a corrosiori r a t e of 2 mils/year. Two loops have also been run using NaF-KF-BF3, which i s a poss ib le coolant s a l t . One loop, constructed of Croloy 9M, plugged in 1440 h i because of mass transfer and t h e deposit ion of iron c rys ta l s i n the
Our electron micros-
The process is likely
11
cold leg. T h e second loop, of Nastelloy N, w a s terminated as scheduled a f te r 8765 hi of operation, hut i t w a s partially plugged and cons iderable cor- rosion had occurred. Effort is be ing concentrated on the compatibility of Hastelloy N and t h e fluoro- borate salts.
Of t h e various f i ss ion products t ha t w ~ l l b e pro- duced in t h e WKHR, tellurium appears to b e the only one that may not b e compatible with IIastelloy N. W e have coa ted specimens with tellurium and annealed them for long periods ot time. There i s a very s l igh t penetration of tellurium into the metal, but the mechanical properties a re not affected adversely for the conditions investigated.
19. Graphite-to-Metal Joining
W e are investigating seve ra l joint des igns for brazing graphite to I ias te l loy N . One approach h a s proven success fu l , but we a r e trying to develop a cheaper and simpler t ype of joint . One promising
braze is the 60 Pd-35 Ni--5 Cr alloy, and w e have run corrosion t e s t s that confirm its compatibility with molten salts.
PART 6. MOLTEN-SALT PROCESSING AND PREPARATION
T h e concept of process ing the fuel s a l t con- tinuously by fluorination and distillal.jon pers i s t s essent ia l ly in i t s in i t ia l form. tion in th i s f lowsheet is the disti l lat ion of t h e carrier salt, and most of the efforl. i n th i s period h a s been concentrated here.
T h e cr i t i ca l opera-
20. Vapor-Liquid Equilibrium Data in Molten-Salt Mixtures
T h e relative vola t i l i t i es of Z r F 4 , NdF,, O F , , BaF2, YF3 , LaF,, and SrF, in the ternary system R E F ,-LiF-BeF ~ have been measured us ing an equilibrium s t i l l at 1000°C. Most va lues a re in close agreement with those predicted by Raoult’s law.
21. Relat ive Volat i l i ty Measurement by the Transpiration Method
Resu l t s from in i t ia l experiments u s ing the trans- piration method for measuring the vapor pressure of LiF-BeF, over the cange 920 to 1055°C con- formed to the correlation o f log vapor pressure v s 1 / T . ‘These da t a a r e a l s o i n good agreement with da ta obtained from equilibrium still measurements.
22. Dist i l lat ion of MSRE Fuel Carrier Salt
Equipment for demonsttat-ion of vacuum dis t i l l a - tion us ing NSRE fue l s a l t h a s been built and a s - sembled i n it.s supporting framework. It i s being ins ta l led in a t e s t facil i ty to perform nonradioactive experiments. ’This unit has been subjec ted to ex- t ens ive examination, and numerous dimensional measurements have been taken to afford a reference €or postoperational examinat ion. Only i f the unit appears to b e i n good condition after nonradio- ac t ive t e s t s wil l it b e ins ta l led a t t he MSKE for carrier s a l t dist i l lat ion delntitlstr, ‘1 t ’ ion.
23. Steady-State Fission Product Concen- trations and Heat Generation in an
MSBR and Processing Plant
A computer code that cons ide r s individual f i s s ion products has been prepared to provide information on f i ss ion product hea t generation in the various cornparleiits of a n MSR process ing plant. Th i s pro- gram a l lows for t h e generation arid removal of fis- sion pr0duct.s hy seve ra l different p rocesses which c a n differ according to their chemical nature. It h a s been used t o compute heat--generation curves for a fuel process ing s t i l l , and the re su l t s com- pare favorably with other programs based on gross fission product hea t da ta .
24. Reductive Extraction of Rare Earths from Fuel Salt
One a l te rna t ive to t h e disti l lat ion process for decotitaininatitig MSBK fuel s a l t uses t h e retiuclive extraction o f t h e rare ea r ths from the s a l t after
12
uranium h a s been recovered by fluorination. EX- perirnents have been performed us ing lithium dis- so lved in molteri bismuth a s a reductant. Although the resu l t s a r e complicated by an unexplained loss of metall ic lithium to the salt phase , t he distribu- tion of rare ear ths between the s a l t and metal phases can he correlated with the lithiuin metal concentration in the metal phase.
25. Modifications to MSWE Fuel Processing f a c i l i t y far o Short Deerry Cycle
Provis ions are being made for process ing the MSRE fuel s a l t for uranium recovery on the sho r t e s t poss ib le cyc le afler shutdown of the MSRE in early 1968. T h e flush s a l t Twill be processed first , and then the fuel s a l t will be treated with H,-HF to es tab l i sh the oxygen concentration. Allowing time for t h e s e operations, the fuel s a l t may b e fluorinat- e d after 35 days (init ial p lans ca l led for a 90-day coaling time). T h i s shorter cooling time requires some modification of t he processing facility a t the MSRE. T h e higher concentration of iodine requires improvement of t h e off-gas system, and the pres -
e n c e of molybdenum requires increased sh ie ld ing around the U F , product absorbers,
26. Preparation of 2 3 3 ~ ~ , - 7 ~ i ~ ~ u e i Concentrate fur the MSWK
Refueling and operating t h e MSRE with 2 3 3U fuel early in 1968 is planned; t h i s will require approximately 40 kg of 2 3 3 U as 2 3 3 U F - 7 L i F (27 and 73 mole X) eutec t ic s a l t . This fuel concen- trate will h e prepared in a c e l l i n t h e 'TURF build- ing because of t h e radiation from the 2 3 2 U daugii- t e r s in the 2 3 3 U T h e uranium will arrive as an oxide ia c a n s , which will be opened and dumped into a reaction vesse l . Lithium fluoride wi l l be added, and the mixture will bp treated with hydra- gen and finally H F to produce the eu tec t ic melt. Three 12-kg 2 3 3 U batches wi l l be prepared for t h e major additions to the barren MSRE s a l t and one 7-kg 2 3 3 U batch will be loaded into 60 enriching capsu le s . T h e engineering design is almost com- plete, and most of the equipment h a s been fabri- ca ted .
Part 1. Molten-Salt Reactor Experiment P. N. Haubenreich
In t h e six-month period reported here the promise of the MSRE as a prac t ica l and reliable reactor W' ' I . , , /" in a la rge measure, realized. From t h e be- ginning, operation of t h e reactor had strengthened our confidence in the basic technica l feas ib i l i ty of molten-salt reactors. At first , however, m e - chan ica l problems with the peripheral equipment did not allow the prac t ica l virtues of Lhe molten- salt sys tem to b e emphasized by a long period of sus ta ined operation a t high power. But the de l ays were not excess ive , and within a year a f te r t h e first operation a t full power, the reactor did c o m - plete a very sa t i s fac tory demonstration of s u s - tained operation. Between January and May 1967, there were 102 consecut ive days of nuclear opera-
1.
tion with remarkably few difficult ies; operation was terniinated only because of scheduled re- moval. of specimens from the core.
The f i r s t part of th i s report de t a i l s the exper ience with operation and maintenance of the MSHE. Then it covers development efforts directly related to the reactor. Finally there is a sec t ion re la t ing to a future experiment, namely, the predicted nuclear charac te r i s t ics of t h e MSRE with 2'r3U fuel. W e plan to s t r i p the present uranium from t h e fue l s a l t and rep lace it with 1968 i n a n experiment that promises to lend worth- while suppor t t o des ign ca lcu la t ions for 233U- fueled breeder reactors.
3U i n t he spring of
MSRE Operations
F'" N. Haubenreich
1 . 1 CHRONOLOGICAL ACCOUNT OF OPERATIONS AND MAINTENANCE
Robert Blumberg C, K. McGlothlan J. L. Ctowley K. 1%. Guyrnon M. Richardson 1'. H. Harley T. I,. Hudson A. I . Krakoviak
R. R. Minue
H. C. Roller
B. 11. Webster R. c. Stcffy
Run I1 began in January and continued into May h i 182 consecut ive d a y s of nuclear operation ( s e e Fig. 1.1). Eetwern February 1 and May 8, t h e rcactor w a s a t full poww (7.3 Mw) 93% of the t t m a The longes t interruption in full-power operation was four days , init ialed because of e x c e s s i v e vibration i n a bearing on a main blower. On this
occas ion the reactor operated a t 5.9 Mw on one blower for a day; then the power w a s lowered t.o I O kw for the bearing replacement and was he ld there for three d a y s to allow the xenon to s t r ip out for a spec ia l reactivity reasuremr:nt. Once the power was reduced to 10 kw for 7 Iir to permit replacement of the coolant off-gas fj.lter, and once one blower w a s off for 9 hr after unusual co ld (9°F) caused bearing vibrations. Twice , spurious scrams caused by f a l se signals produced brief interruptions (1 to 2 hr). 'I'hree times t h e power was lowered for periods from 6 to 38 hr for experimental purposes.
In addition to demonstratjng the capabili ty of the MSRE for sus ta ined operation, the lengt.hy period at high power in run 11. afforded use fu l information on long-term reactivity changes due to samarium
13
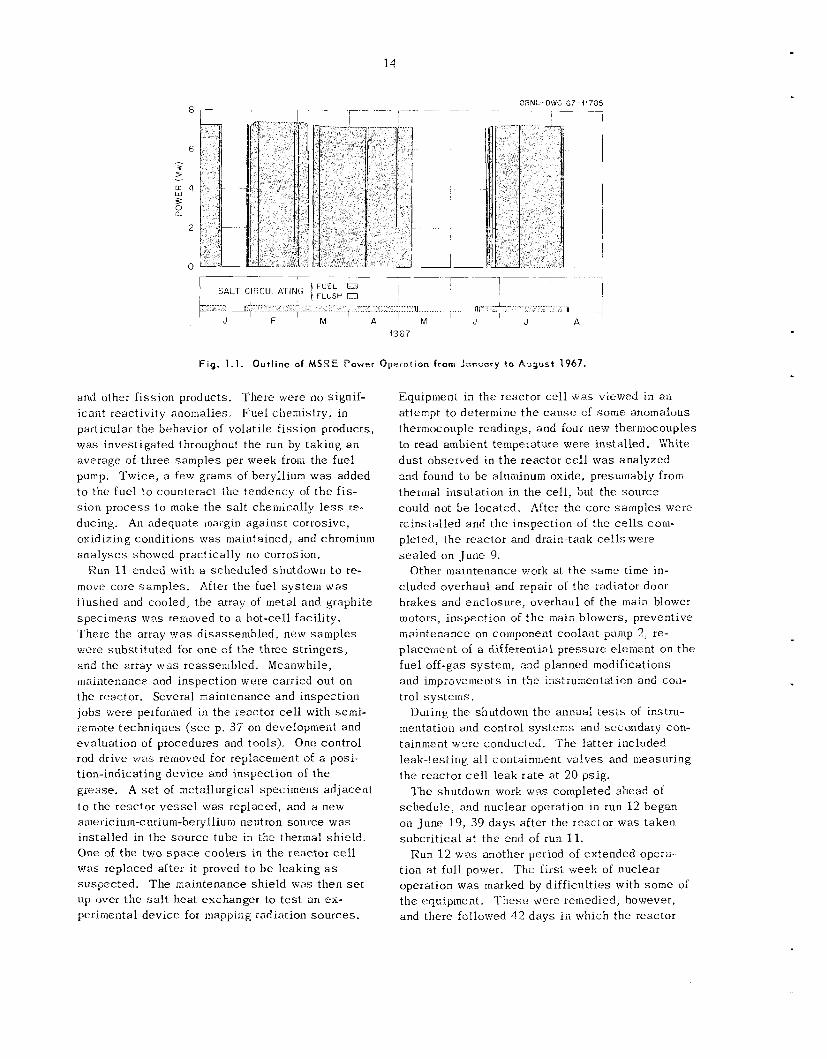
I I
n J F M A M ' J J A
Fig. 1 . 1 . Outline of MSRE fgower Opero t ion from January to August 1967.
and other f i ss ion products. There were no signif- icant reactivity anomalies. Fue l chemistry, in particular t he behavior of volatile f ission products, was investigated throughout t he iun by tak ing a n avcrage of three samples per week froiii the fuel pump. Twice , a few giams of beryllium was added to the fuel t o counteract the tendency of t h e fis- s i o n process to make the sa l t chemically l e s s re-. ducing. oxidizing conditions was iiiaintained, and chromium analyses showed practically 110 corrosion.
Run 11 ended with a scheduled shutdown to re- move core samples . Af te r the fuel sys tem w a s flushed and cooled, the array of metal and graphite spec imens was removed t o a hot-cell facil i ty. There the array was disassembled, new samples were subs t i tu ted for one of the three stringers, and the array was reassembled. Meanwhile, maintenance and inspection were carried out on the reactor. Several maintenance and inspection jobs were perforined in the reactor ce l l with s c m i - remote techniques ( see p. 37 on development and evaluation of procedures and tools). One control rod drive was removed for replacement of a posi- tion-indicating device and inspection of the grease. A set of metallurgical specimens ad jacent t o the reactor v e s s e l was replaced, and a new ainericiurn-curium-beryllium neutron source was installed in the source tube in the thermal sh ie ld . One of the two s p a c e coolers in the reactor c e l l was replaced after it proved to b e leaking a s suspec ted . T h e maintenance shield was thein s e t up over t he s a l t heat exchanger to t e s t an ex- perimental device for mapping radiation sources .
An adequate margin aga ins t corrosive,
Equipinent in t h e reactor ce l l w a s viewed in an attempt to deterniiiie t h e c a u s e of some anomalous thermocouple readings, and four new thermocouples to read ambient temperature were installed. White dus t observed in t h e reactor cell was analyzed and found to b e aluminum oxide, prestiinabiy from theimal insulation i n the ce l l , but the source could not be located., After the core samples were reinstalled and the inspection of the cells corn- pleted, the reactor and drain-tank cells were sea l ed on June 9.
Other maintenance work at t h e same time in- cluded overhaul and repair of the radiator door brakes and enclosure, overhaul of the main blower motors, inspection of t h e mair; blowers, preventive maintenance on coinponent coolant pump 2, re- placerncnt of a differential pressure element on t h e fuel off-gas sys tem, and planned modifications and improve~iients in the instrumentation and con- trol sys tems.
During the shutdown the annual t e s t s of instru- mentation and control sys tems and secondary con- tainment were conducted. The latter included leak-testing a l l containment va lves and ineasuring the reactor c e l l leak r a t e a t 20 psig.
'The shutdown work was completed ahead of schedule , and nuclear operation in run 12 began on June 19, 39 d a y s after the reactor was t aken subcrit ical a t t he end of run 11.
Run 12 w a s another period of extended opera-. tion at full power. The first week of nuclear operation was marked by difficult ies with s o m e of the equipment. T h e s e were remedied, however, and there followed 42 days iil which the reactor
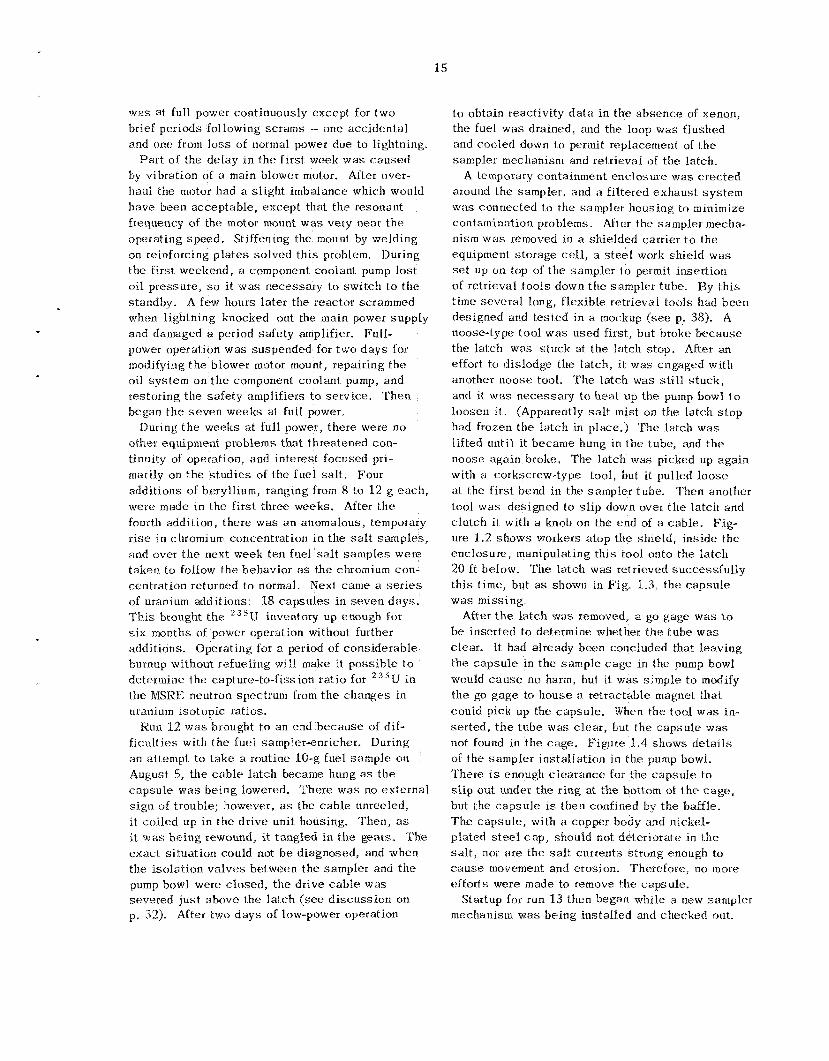
was a t full power continuously except for two brief periods fol.lowing scrams - one acc identa l and one from loss of normal power due to lightning,
P a r t of the de lay i n t h e f i r s t week w a s caused by vibration of a main blower motor. After over- haul the motor bad a s l igh t imbalance which would have been acceptable, excep t that t he resonant frequency of the motor mount w a s very near t h e operating speed . Stiffening the mount by welding on reinforcing p l a t e s so lved th i s problem. During t.he first weekend, a component coolant pump lost oil pressure , so i t was necessary t o swi tch to the standby. A few hours la te r the reactor scrammed when lightning knocked out the main power supply and damaged a period sa fe ty amplifier. Full- power operation was suspended for two d a y s for modifying t h e blower motor mount, repait ing the oil system on t h e cornportent coolant pump, and restoring the safe ty amplifiers to sew ice. T h e n begari t h e s e v e n weeks at full power.
other equipment problems tha t threatened con- tinuity of operation, and interest focused pri- marily on t h e s tud ie s of the fue l salt. Four additions of beryllium, ranging from 8 to 12 g each , were made in the first t h r e e weeks. After t.he fourth addition, there was a n anomalous, temporary r i s e i n chromium concentration i n the s a l t samples , and over t he next week t en fuel s a l t s amples were taken to follow the behavior as the chromium con- centration returned tn normal. Next came a s e r i e s of uranium additions: 18 capsu le s in seven days . This brought t he 2 3 s U irrventory up enough for six months of power operation without further additions. Operating for a period of cons iderable burnup without refueling will make i t poss ib l e to determine the capture-to-fission ra t io for 2 3 5 U i n t he MSKE neutron spectrum from t h e changes in uranium i.sotopic ratios.
Run 12 w a s brought to an end because of dif- f icu l t ies with t h e fuel sampler-enricher. During an attempt to t ake a routine 10-g fuel sample on August 5, t h e c a b l e la tch &came hung as t h e c n p s u k was be ing lowered. There was no ex terna l sign of trouble; however, as the c a b l e unreeled, it co i led up in t h e dr ive unit housing. Then , as it was being rewound, it tangled in the geiats.
exac t si tuation could not b e diagnosrtd, and when the i so la t ion va lves between t h e sampler and t h e pump bowl were c losed , t h e dr ive cable was severed j u s t above the la tch (see d i scuss ion on p. 52). After two d a y s of low-power operation
During t h e weeks a t full power, there were no
The:
to obtain reactivity data in the absence of xenon, t he fuel w a s drained, and the loop was flushed and cooled down to permit replacement of t h e sampler mechanism and retrieval of the latch.
A temporary containment enc losure was e rec ted around the sampler, and a filtered exhaus t system w a s connected to the sampler housing to minimize contamination problems. After the sampler rnecha- nism w a s removed in a shielded carrier to the equipment s torage cell, a s t e e l work sh ie ld was s e t up on top of t he sampler to permit insertion of retrieval tools down t h e sampler tube. I3y th i s time seve ra l long, f lexjble retrieval lools had been designed and tes led in a mockup (see p. 38). A noose-type tool w a s used first , but broke because the latch was s tuck at the latch s top , After an effort to dislodge the Iatch, it was engaged with another noose too?. T h e latch was s t i l l s tuck , and it w a s necessary to tieat up the pump bowl to loosen it. (Apparently s a l t m i s t on t h e latch s top had frozen the la tch in place.) T h e latch w a s l if ted until it became hung in t h e tube, and t h e noose aga in broke. The la tch was picked up aga in with a corkscrew-type t.001, but i t pulled loose a t the f i r s t bend in the sampler tube. Then another tool was designed to s l i p down over t h e la tch and c lu tch i t with a knob on the end of a cable . Fig- ure 1.2 shows workers a top the shield, inside t h e enc losure , manipulating th i s tool onto the la tch 20 ft below. The la tch was retrieved successfu l ly th i s t ime, but as shown in Fig. 1.3, t h e capsu le w a s missing.
After t h e la tch was removed, a go gage w a s to b e iriserted to determine whether the tube w a s clear. It had already been c:oncluded that l eav ing the capsu le in the sample c a g e in the pump bowl would caiise no harm, but if: was s imple to modify t h e go gage to house a retractable magnet that could pick up the capsule . When the tool was in- se r ted , t h e tube was c lear , but t h e capsu le w a s not found in the cage. Figure 1.4 shows de ta i l s of the sampler ins ta l la t ion in t h e pump bowl. There is enough c l ea rance for the capsu le to s l ip o u t under the ring at the bottom of t h e cage , but the c a p s u l e is then confined by the baffle. T h e capsule , with a copper body and nickel- plated s t e e l c a p , should not de le r io ta te i n the s a l t , nor a r e the salt currents s t rong enough to c a u s e movement and erosion. Therefore, no tnore efforts were made to remove the capsule.
mrxlianism w a s be ing installed and checked out. Startup for run 13 then began while a new sampler
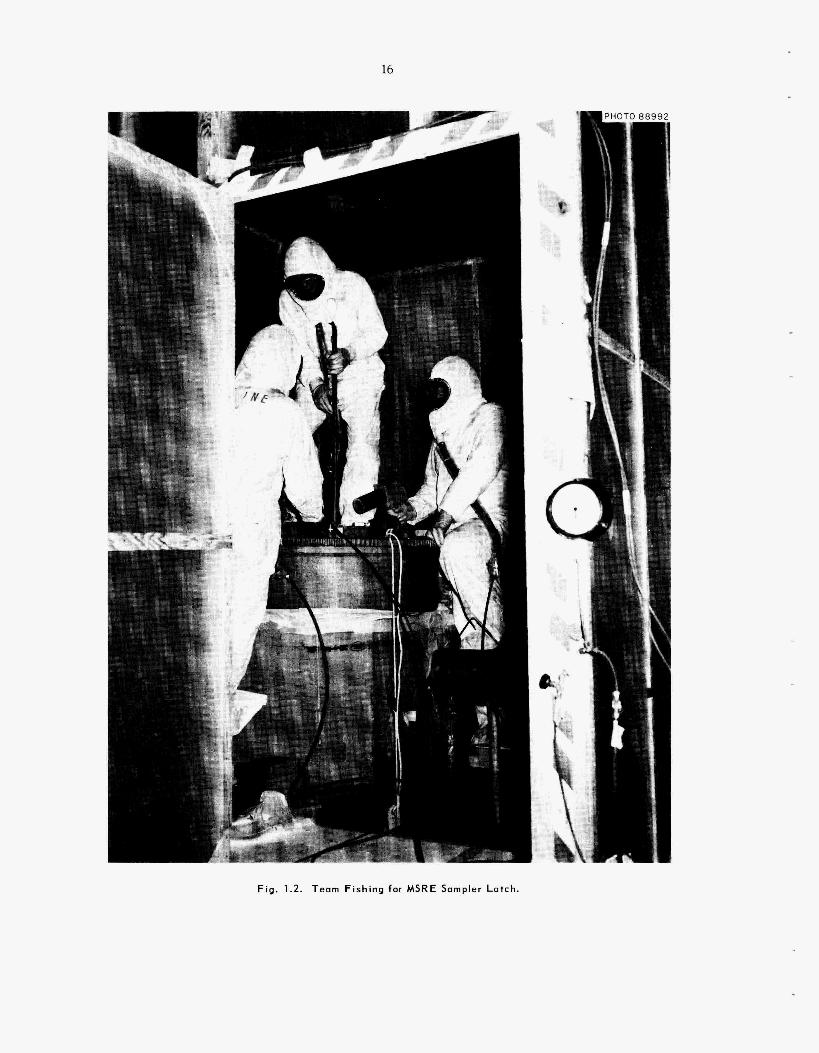
16
7 1
Fig. 1.2. Team Fishing for MSRE Sampler Latch.
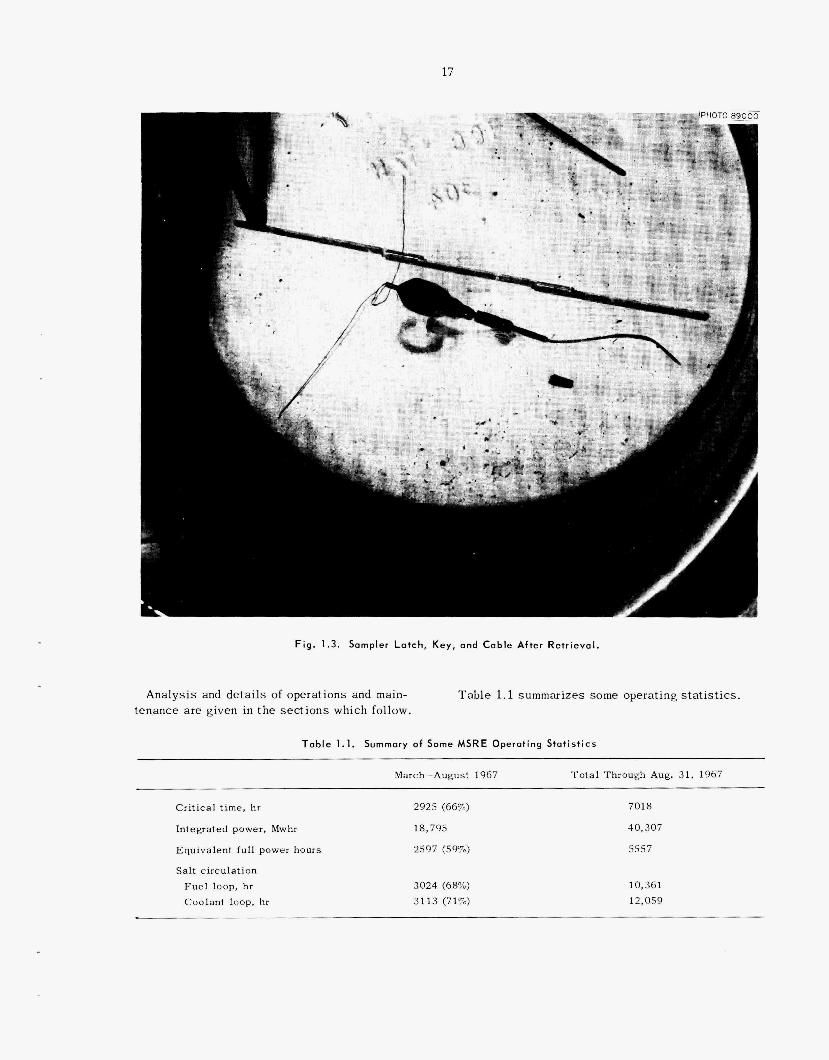
17
b
Fig. 1.3. Sampler Latch. Key, and Cab le After Retr ieval .
Analys is and d e t a i l s of operat ions and main- tenance a r e given i n t h e s e c t i o n s which follow.
T a b l e 1.1 summarizes some operating s t a t i s t i c s .
T a b l e 1.1. Summary of Some MSRE Operatirrg Stat ist ics
Tota l Through Aug. 31, 1967 March-August 1967
7018 CriticaI t i m e , hr 2925 (66%)
Integrated power, Mwhr 18,795 40,307
Equivalent full power hours
Salt circulation
5557 2597 (59%)
F u e l loop, hr 3024 (68%) 10,361 Coolant loop, hr 3113 (71%) 12,059
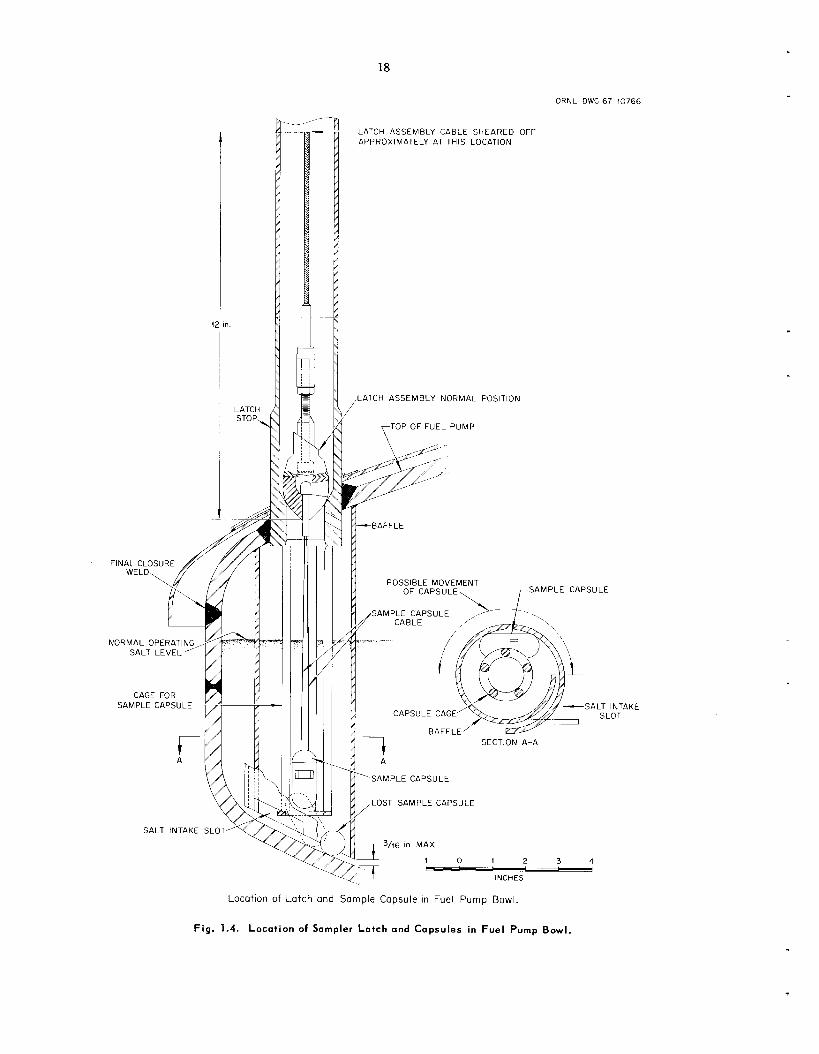
18
ORNL-DWG 67-40766
LATCH ASSEMBLY CABLE SHEARED OFF APPROXIMATELY AT THIS LOCATION
LATCH ASSEMBLY NORMAL POSITION
TOP OF FUEL PUMP
POSSIBLE MOVEMENT OF CAPSULE SAMPLE CAPSULE
NORMAL OPERATI SALT LEVEL
SALT INTAKE SAMPLE CAPSULE CAPSULE CAG SLOT
SAMPLE CAPSULE
LOST SAMPLE CAPSULE
SALT INTAKE SLOT
INCHES
Location of Latch and Sample Capsule in Fuel Pump Bowl
F i g . 1.4. Locat ion of Sampler L a t c h and Capsules in F u e l Pump Bowl.
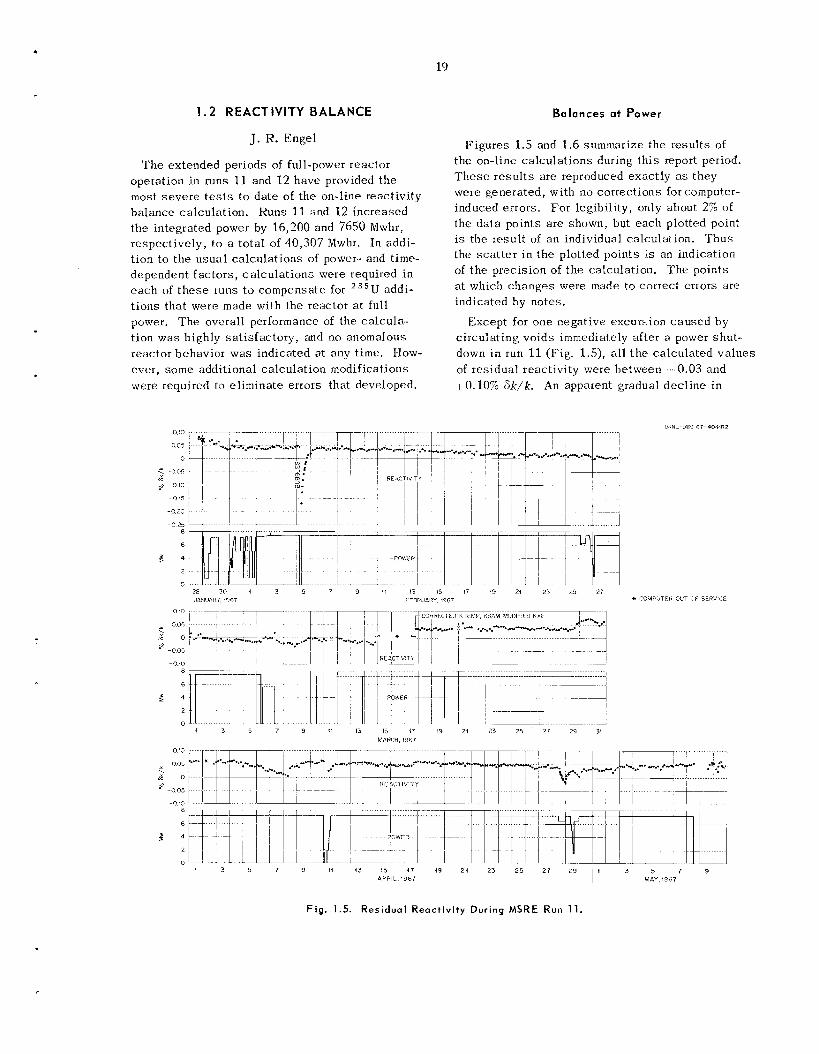
19
1 . 2 REACTlVlTY BALANCE
J. R. Engel
T h e extended periods of full-power reactor operation i n runs 11 and 12 have provided t h e most s e v e r e t e s t s to da te of t h e on-line reactivity ba lance calculation. Runs 11 and 12 increased the integrated power by 16,200 and 7650 Mwhr, respectively, to a to ta l of 40,307 Mwhr. In addi- t ion to the usua l ca lcu la t ions of power- and time- dependent fac tors , ca lcu la t ions were required in each of t h e s e runs t o compensate for 235U addi- t ions tha t were made with the reactor at full power. T h e overall performance of the ca lcu la- t ion w a s highly sa t i s fac tory , and no anomalous reactor behavior was indicated a t any time. How- ever, s o m e additional calculation modifications were required to eliminate errors that developed.
Balances a t Power
Figures 1.5 and 1 .6 summarize the results of the on-line ca lcu la t ions during th i s report period. T h e s e r e su l t s a re reproduced exac t ly as they were generated, with no corrections for computer- induced errors. For legibility, only about 2% of the da t a points a r e shown, but each plotted point is the result of a n individual calculation. T h u s the sca t t e r i n t he plotted points is an indication of the precision of the calculation. The points a t which changes were made to correct errors are indicated by notes.
Except for one negative excursion caused by circulating voids immediately after a power shut - down i n run 11 (Fig. l.S), all t h e ca lcu la ted va lues of res idua l reactivity were between -0.03 and t 0.10% 8 k / k . An apparent gradual dec l ine in
Fig . 1.5. Residual React iv i ty During M S R E Run 11.
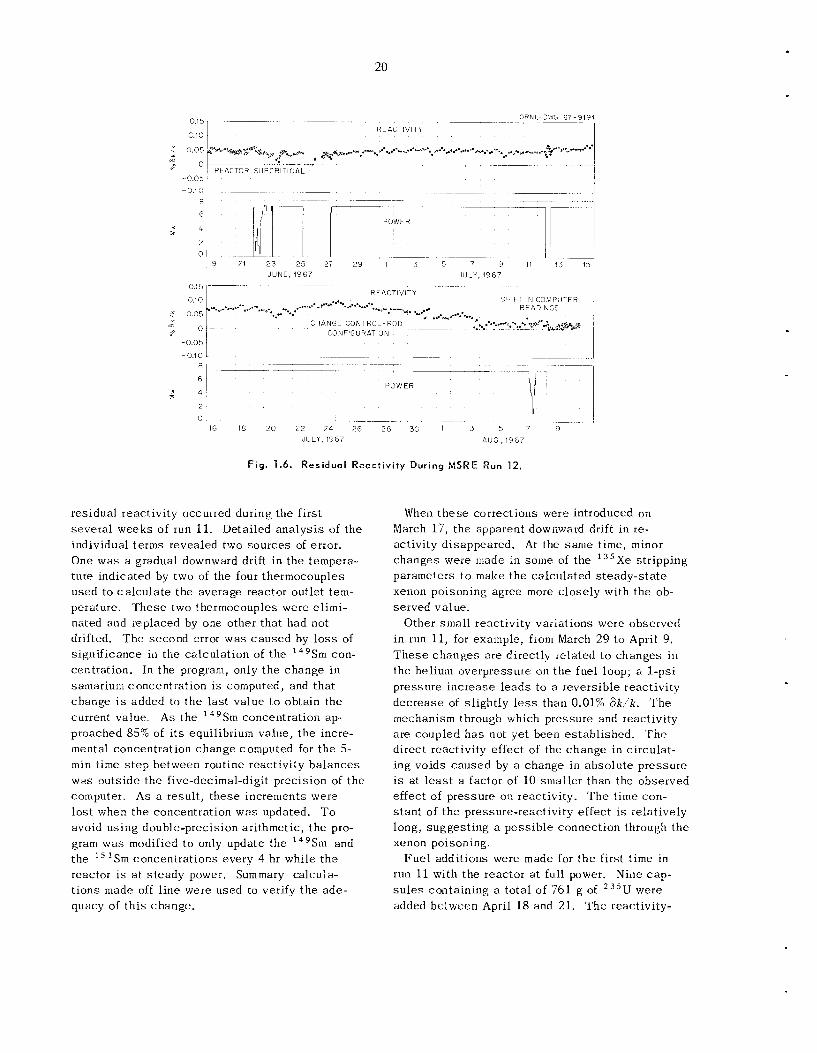
20
ORNL- DWG 67- 9191 -~ ~~
R E A C T I V I T Y
P O W E R
- - ~~
16 18 20 22 24 26 28 3 C 1 3 S 7 9
JULY, 1967 nus, 1967
Fig . 1.6. Residual React ivi ty During MSRE Run 12.
residual reactivity occurred during the first severa l weeks of r u n 11. Detailed ana lys i s of t h e individual terms revealed two sources of error. One was a gradual downward drift in the tempera- ture indicated by two of the four thermocouples used to ca l cu la t e t he average reactor outlet tem- perature. These two thermocouples were elimi- nated and replaced by one other that had not drifted. T h e second error was caused by l o s s of significance in the calculation of the 14'Sm con- centration. In the program, only the change i n samarium concentration i s computed, and tha t change is added to t h e las t value t o obtain the current value. As the I4'Sm concentration ap- proached 85% of i t s equilibrium value, t h e incre- mental concentration change computed for t he 5- miri time s t e p between routine reactivity ba lances was outside the five-decimal-digit precision of t he computer. A s a result , t hese increinents were lo s t when the concentration was updated. To avoid us ing doubl e-precision arithmetic, the pro- gram was modified to only update the 14'Srn and the 'Sm concentrations every 4 hr while t h e reactor i s a t s teady p o ~ ~ i . Summary calcula- t ions made off l ine were used to verify t h e ade - quacy of t h i s change.
When t h e s e corrections were introduced on March 1'7, the apparent downward drift in re - activity disappeared. At the same time, minor changes were made in some of the ' 3 5 X e stripping parameters t o make the calculated s teady-s ta te xenon poisoning agree more c lose ly with the ob- served value.
Other small reactivity variations were observed in run 11, for example, from March 29 to April 9. T h e s e changes a re directly related t o changes in the helium overpressure on t h e fuel loop; a 1-psi pressure increase l eads to a reversible reactivity decrease of sl ightly l e s s than 0.01% 6 k / k . The mechanism through which pressure and reactivity a re coupled h a s not yet been established. direct reactivity effect of the change in circulat- ing voids caused by a change in absolu te pressure i s a t l e a s t a factor of 10 smaller than the observed effect of pressure on reactivity. T h e time con- s t an t of t he pressure-reactivity effect i s relatively long, sugges t ing a poss ib le connection through the xenon poisoning.
F u e l additions were made for t he first time in run 11 with the reactor a t full power. Nine cap- s u l e s containing a total of 761 g of 2 3 5 U were added between April 18 and 21. T h e reactivity-
T h e
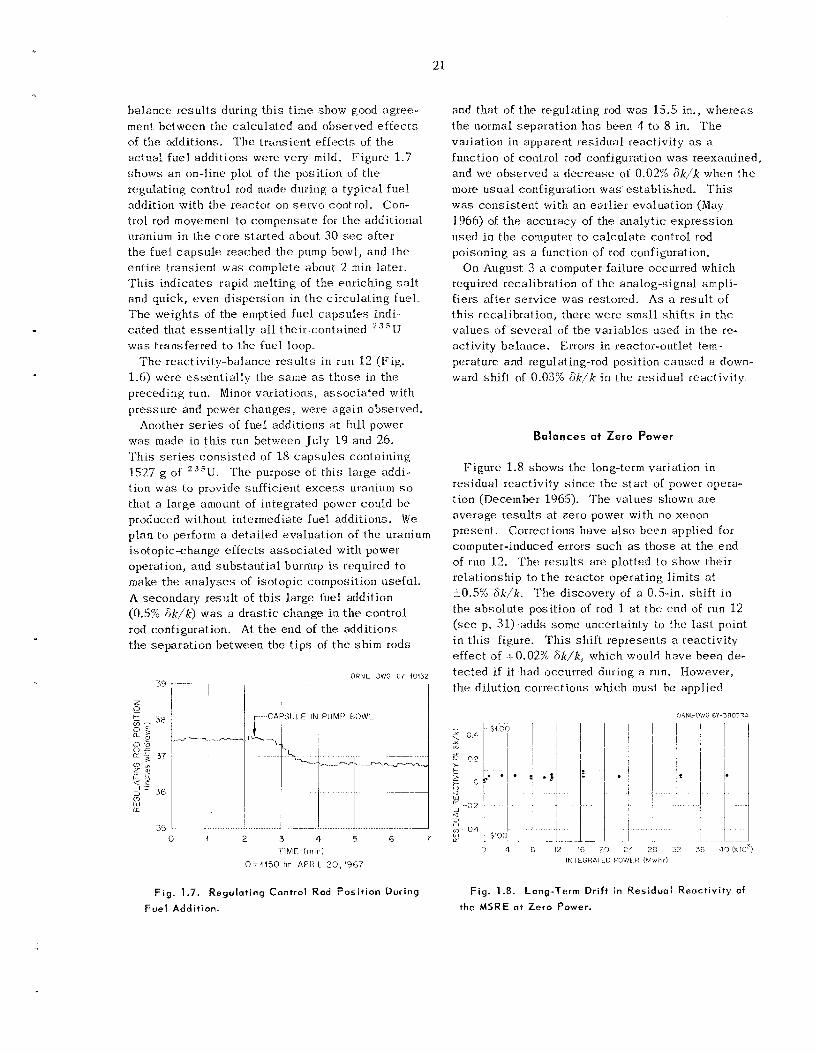
21
ba lance resu l t s during th i s time show good agree- ment between the ca lcu la ted and observed e f f ec t s of the additions. T h e t rans ien t e f fec ts of the ac tua l fue l addi t ions were very mild. Figure 1.7 shows a n on-line plot of the position of the regulating control rod made during a typical fue l addition with the reactor on se rvo control. Con- trol rod movement. t o compensate for t h e additional uranium in the co re s ta r ted about 30 sec after the fuel c a p s u l e reached the pump bowl, and the entire transient was complete about 2 min later. 'This ind ica tes rapid melting of t h e enriching salt and quick, even dispersion in the circulating fuel. T h e weights of the emptied fuel c:ilpsules indi- ca ted that e s sen t i a l ly a l l the i r contained z n s U was transferred to the fuel loop.
T h e reactivity-balance resu l t s in run 12 (F ig . 1.6) were essent ia l ly the same as those in t h e preceding run. Minor variations, assoc ia ted with pressure and power changes , were aga in observed.
Another s e r i e s of fuel additions a t full power was made in t h i s run between July 19 and 26. 'This s e r i e s cons i s t ed of 18 capsu le s containing 1527 g of ' j S U . 'The purpose o f th i s large addi- tion was to provide sufficient e x c e s s uranium s o that a large amount of integrated power could be produced without intermediate f u e l additions. We plan to perform a detailed evaluation of the uranium isotopic-change e f f ec t s a s soc ia t ed with power operation, and subs tan t ia l burnup is rtquired to make the ana lyses of isotopic composition useful. A secondary result of t h i s large fuel addition (0.5% Sk/k) was a dras t ic change in t h e control rod configuration. At t h e end of the additions the separa t ion between the t i p s of t h e shim rods
I- ;-- OHNL-DWG E l - 10132
r~~~~ CAPSIJLE IN PUMP BOWL
0 4 2 3 4 5 6 7
TlMF (minl
0=1150 hr CPML 20.1'367
Fig . 1.7. Regulating Control Rod Posi t ion During
Fue l Addition.
and that of the regulating rod was 15.5 in., whereas the normal separa t ion h a s been 1 to 8 in. T h e variation in apparent residual reactivity a s a function of control rod configuration was reexamined, and we observed a decrease of 0.02% 8 k / k when the more usua l configuration was established. T h i s was cons is ten t with a n earlier evaluation (May 1966) of t h e accuracy of the imalytic expression used i n the computer to ca lcu la te control rod poisoning as a function of rod configuration.
On August 3 a computer failure occurred which required recalibration of the analog-signal ampli- f ie rs after s e rv i ce was restored. As a result of t h i s recalibration, there were small shifts i n t h e va lues of severa l of the var iab les used in t h e re- activity balance. perature and regulating-rod position caused a down- ward sh i f t of 0.03% 6k/k i n the residual reactivity.
Errors in react or-outlet tem-
Balances a t Zero Power
Figure 1.8 shows the long-term variation in residual reactivity s ince the s t a r t of power opera- t ion (December 1965). 'rile va lues shown a r e average r e su l t s a t zero power with no xenon present. Corrections have a l so been applied for computer-induced errors such as those a t the end of run 12. T h e resu l t s a re plotted t.o show their relationship to t h e reactor operating l imits a t 10.5% 6k/k . The discovery of a 0.5-in. shift i n the absolu te position of rod 1 at the end of run 12 ( see p. 31) add:; some uncertainty to the last point i n th i s figure. effect of i-0.0275 6 k / k , which would have been de- tec ted if i t had occurred during a run. However, the dilution corrections which must be applied
T h i s shift represents a reactivity
Fig. 1.8. Long-Term Dri f t in Residual React iv i ty of
the M S R E a t Zero Power.
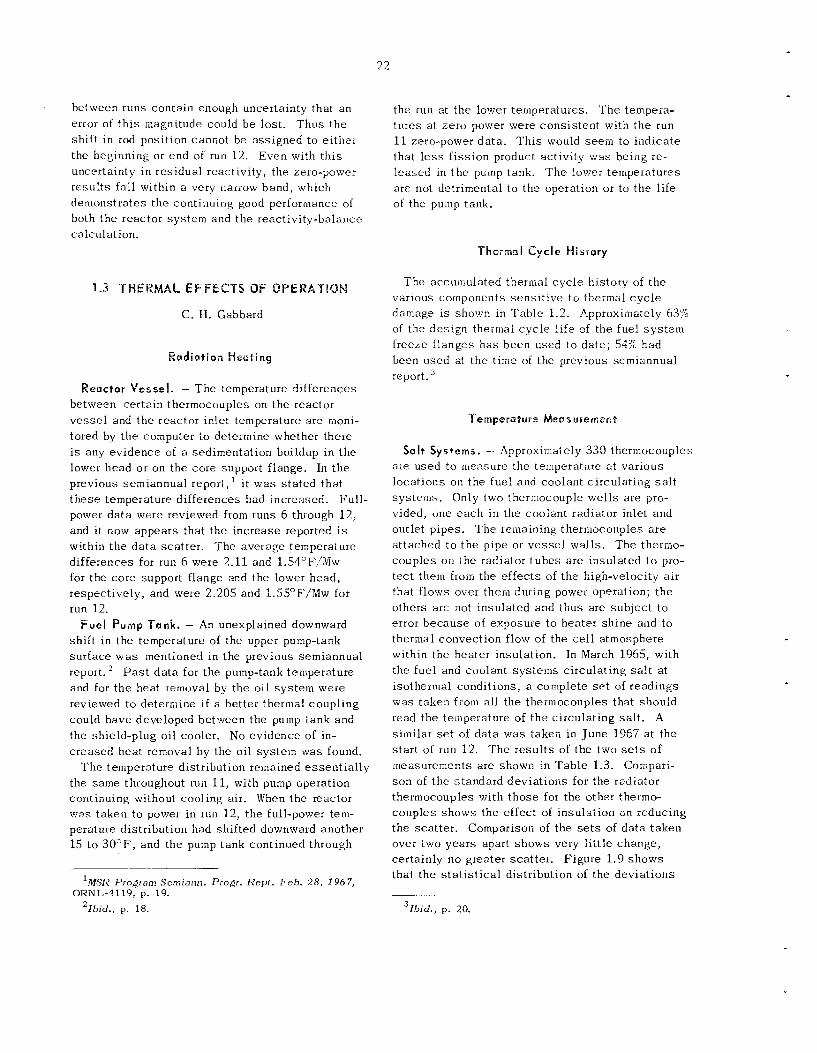
22
between runs contain enough uncertainty that an error of t h i s magnitude could be lost. Thus the shift i n rod position cannot he assigned to e i ther the beginning or end of run 12. uncertainty in residual reactivity, the zero-power resu l t s fall within a very narrow band, whicii derrionstrates t he continuing good performance of both the reactor system and the reactivity-balance calcitlation.
the run at t he lower temperatures. T h e tempera- tu res a t zero power were cons is ten t with the r u n 11 zero-power da ta . Th i s would seein to ind ica te that less f i ss ion product activity was being re- leased in t h e pump tank. T h e lower temperatures are not detrimental to the operation or to the l ife of the pump tank,
Even with t h i s
Thermal Cycle History
MAL EFFECTS OF OPERATION
C. H. Gabbard
Radiat ion Heating
Reactor Vessel. - The temperature differences between certain thermocouples on the reactor v e s s e l and the reactor inlet temperature are moni- tored by the computer io determine whether there is any ev idence of a sedimentation buildup in the lower head or on the core support flange. In the previous semiannual report, ' i t was s ta ted that t hese temperature differences had increased. power da t a were reviewed from runs 6 through 12, and it now appears that the increase reported is within the da t a sca t te r . The average temperature differences for run 6 were 2.11 and 1.51°F/Mw for the core support flange and the lower head , respectively, and were 2.205 and P.5S°F/Mw for run 12.
F u e l Pump Tank. - An unexplained downward shift i n the temperature of the upper pump-tank sur face w a s inentioned in the previous semiannual report. and for t h e heat removal by the oil sys tem were reviewed to determine if a better thermal coupling could have developed between the pump tank and the shield-plug oil cooler. No evidence of in- c reased heat removal by the oil sys tem was found.
the same throughout run 11, with pump operation continuing without cooling air. When the reactor was taken to power in run 12, the full-power tem- perature distribution had shifted downward another 15 t o 30°F , and the pump tank continued through
Full-
P a s t da t a for the pump-tank temperature
T h e temperature distribution remained essent ia l ly
' M S X Program Semiann. Progr. R e p t . Feb. 28; 1967,
' Ibid. , p. 18.
ORNL-4119, p. 19.
The accumulated thermal cycle history of t he various components sens i t ive to thermal c y c l e damage is shown in Table 1.2. Approximately 63% of the des ign therinal cyc le l ife of the fue l sys t em freeze flanges h a s been used to da te ; 54% had been used at t he time of the previous semiannual report.
Temperature Meosurernent
Sa It Systems. -- Approxiinately 330 thermocouples are used to tne'asure the temperatiire a t various locations on the fuel and coolant circulating s a l t sys tems. Only two thermocouple we l l s are pro- vided, one each i n the coolant radiator inlet and outlet pipes. T h e remaining thermocouples a r e attached to the pipe or vessel walls. The thermo- couples on the radiator t ubes a re insulated to pro- tec t them from the e f fec ts of t he high-velocity a i r that flows over them during power operation; t he others a re not insulated and thus are subjec t to e r r o r because of exposure to heater sh ine aild t o thermal convection flow of the ce l l atmosphere within the heater insulation. In March 1965, with the fue l and coolant sys tems circulating s a l t a t isothermal conditions, a complete s e t of readings w a s taken f r o m a l l t he thermocouples that should read the temperature of t he circulating sa l t . A similar s e t of da t a w a s taken i n June 1967 a t the s ta r t of run 12. T h e resu l t s of the two s e t s of measurements a re shown in 'Table 1.3. Compari- s o n of t he standard devia t ions for the radiator thermocouples with those for the other thermo- couples shows the effect of insulation on reducing the sca t te r . Comparison of the s e t s of da t a taken ovei two years apart shows very l i t t l e change, certainly n o greater sca t te r . Figure 1.9 shows that t he s t a t i s t i ca l distribution of the devia t ions
31bid., p. 20.
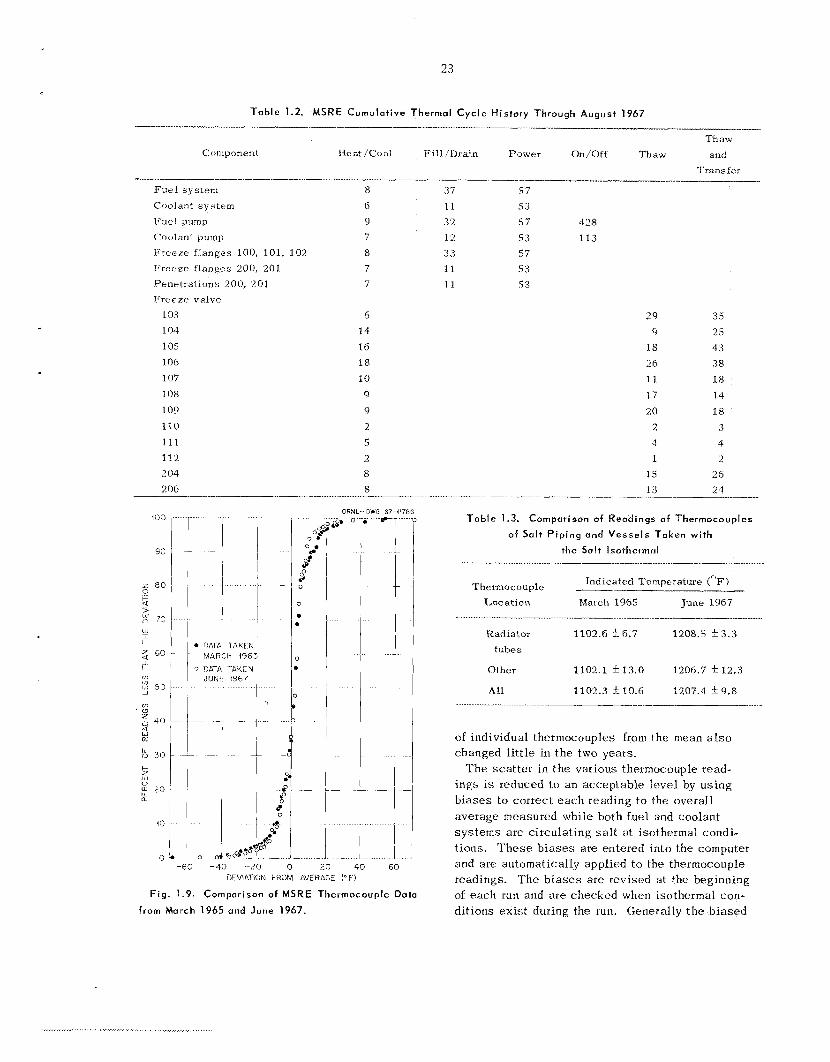
23
T a b l e 1.2. M S R E Cumulotive Thermal Cycle History Through August 1967 ___ - II_- -
Thaw CotiLponent IIeat/Cool Fill/Drain Power On/Off Thaw a d
Trans f e r -_ Fue l s y s t e m a Coolant sys tem 6
Fue l pump 9
Coolant pump 7 Freeze flanges 100, 101, 102 8
Freeze flanges 200, 201 7 Penetrations 200, 201 7
103 6
104 14 1 05 16 106 18 107 10
108 9 109 9 110 2
111 5 112 2 2 01 8
8 2 06
Freeze valve
.--. ~
Fig. 1.9. Comparison of MSRE Thermocouple Data
from Morch 1965 and June 1967.
3 7 57 11 53 32 5 7 428 1 2 53 I13 3 3 57 11 53 1 1 5 '4
29 35
4 25 18 43 26 38
11 18
17 14 20 15
2 3
4 4 1 2
15 26
24 1.3 - - -
T a b l e 1.3. Comparison of Readings o f Thermocouples
o f Salt P i p i n g and Vessels Taken with
the Salt lsothermol
Indicated Temperature ("F) Thermocouple _______
Location March 1965 June 1967
Radiator 1102.6 56.7 1208.5 * 3 . 3 tubes
Other 1102.1 113.0 1206.7 k12 .3
All 1102.3 t 10.6 1207.4 f9.8
of individual thermocouples from t h e mean also changed l i t t l e in t h e two years.
'The sca t t e r i n t h e various thermocouple read- ings is reduced to an acceptab le leve l by us ing b i a ses to correct e a c h reading t o the overall average measured while both fuel and coolant sys t ems a re circulating s a l t at isothermal condi- tions. T h e s e b i a s e s a re entered into the computer and arc automatically applied t o the thermocouple readings. The b i a s e s a re revised at the beginning of each run and a re checked when isothermal con- dit ions ex is t during the run. Generally t h e b iased
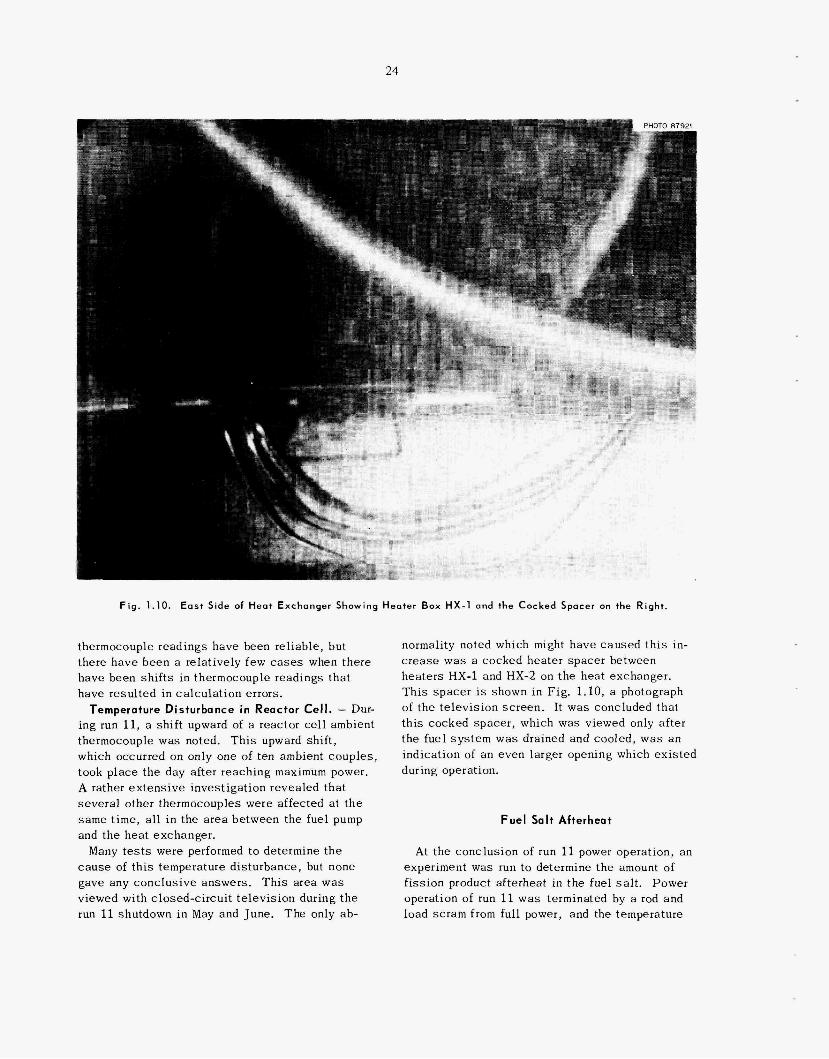
24
F i g . 1.10. East Side of Heat Exchanger Showing Heater Box HX-1 ond the Cocked Spacer on the Right.
thermocouple readings have been reliable, but there have been a relatively few cases when there have been sh i f t s in thermocouple readings tha t have resul ted in calculat ion errors.
Temperature Disturbance in Reactor Cell. - Dur- ing run 11, a shif t upward of a reactor cell ambient thermocouple was noted. Th i s upward shift , which occurred on only one of ten ambient couples , took p lace t h e day after reaching maximum power. A rather ex tens ive inv tion revealed that s eve ra l other thermoco were affected at t h e same time, all i n the area between the fuel pump and the hea t exchanger.
Many t e s t s were performed to determine t h e c a u s e of t h i s temperature d urbance, but none gave any conclus ive answers. Th i s area was viewed with closed-circuit te levis ion during the run 11 shutdown i n May and June. The only ab-
normality noted which might have caused t h i s in- c r e a s e w a s a cocked heater spacer between hea ters HX-1 and HX-2 on the hea t exchanger. Th i s space r is shown in Fig. 1.10, a photograph of the te levis ion screen. It w a s concluded that
cocked spacer , which was viewed only after t he fuel sys tem w a s drained and cooled, was a n indication of an even larger opening which ex is ted during operation.
Fuel Salt Afterheat
At the conclusion of run 11 power operation, an experiment was run to determine the amount of f iss ion product afterheat in the fuel salt. Power operation of run 11 w a s terminated by a rod and load s c r a m from full power, and the temperature
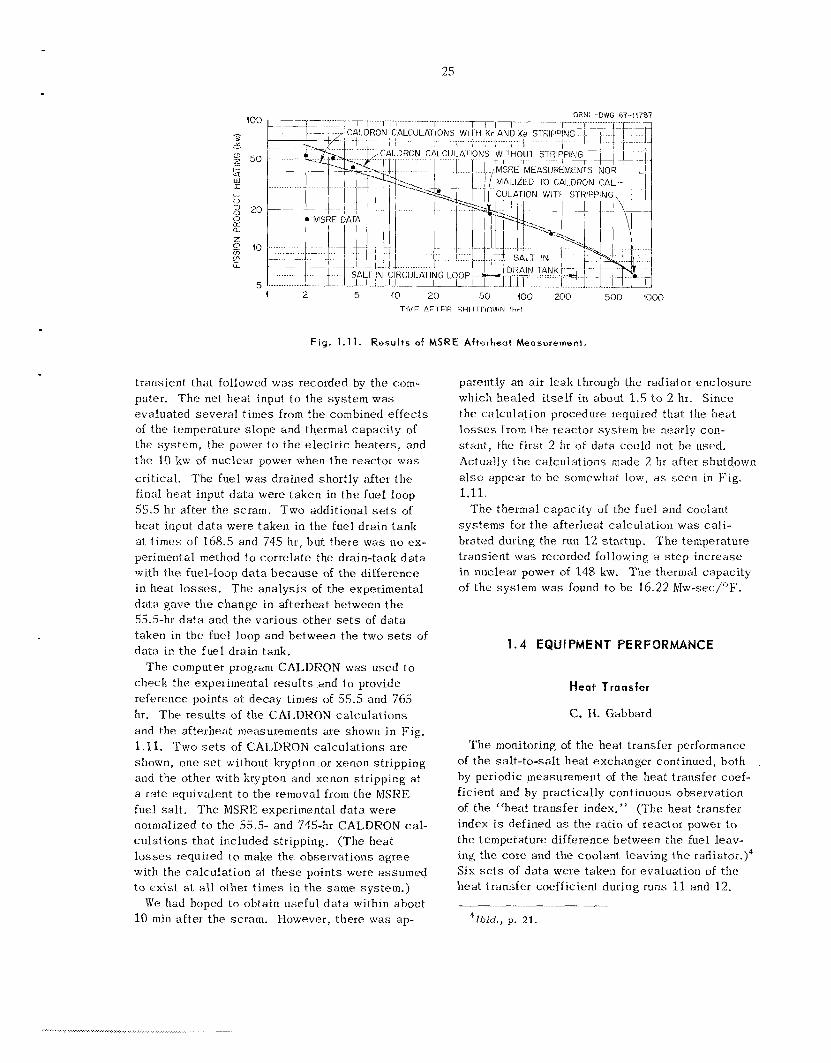
25
ORNL - DWG 67-11787
1 MSRE MEASIIREMfNIS NOR
50 1GO 200 500 1000 4 2 5 10 20 TIMF AFTFR SUI lTTln\Alkl fhrl
Fig. 1 .11 . R e s u l t s of MSRE Aftarheat Meosurernenr.
transient that followed w;~c; recorded by the com- puter. T h e net heat input to the sys t em was evaluated seve ra l t imes f rom the combined e f f ec t s of the temperat.ure s lope and thermal capac i ty of i.he sys tem, the power t o the e lec t r ic hea te rs , and t h e 10 kw oE nuclear power when t h e reactor was cri t ical . The fuel was drained shortly after t h e final hea t input da t a were taken in t h e Euel loop 55.5 hr after the scram, Two additional sets of hea t input da t a were taken in the f u e l drain tank a t t i m e s of 168.5 and 745 hr, but there was no ex- perimetatal method to correlate the drain-tank da ta with the fuel-loop d a t a b e c a u s e of the difference in heat l o s ses . T h e ana lys i s of the experimental daiita gave t h e change in afterheat between t h e 55.5-hr d a t a and t h e various other s e t s of d a t a taken in the fuel loop and between the two sets of da ta in t h e fuel drain tank.
T h e computer program CALDRON was used to check the experimental resu l t s and t o provide reference points a t decay t imes of 55.5 and 765 hr. ‘The r e su l t s of the CALDRON calcu la t ions and the afterheat measurements a re shown in Fig. 1.11. ’Two s e t s of CALDKQN ca lcu la t ions a r e shown, one s e t without krypton or xenon stripping and the other with krypton and xenon stripping a t a ra te equivalent t o the removal from the MSKE fuel s a l t , T h e MSKE experimental da t a were normalized to the 55.5- and 745-hr CALDRON cal- cu la t ions tha t included stripping. (The heat l o s s e s required to make the observations ag ree with the ca lcu la t ion a t t hese points were assumed to e x i s t a t all other t imes in the s a m e system.)
W e had hoped to obtain useful d a t a within about 10 min a f t e r t he scram. However, there was ap-
parently an air leak through the radiator enclosure which hea led itself in about 1.5 t o 2 hr. Since the calculation procedure required that the hea t losses froin the reactor system b e nearly con- s tan t , the first 2 hr of data could not be used. Actually t h e ca lcu la t ions made 2 hr after shutdown a l s o appear to be somewhat low, as s e e n in Fig. 1.11.
T h e thermal capac i ty of the fuel and coolant sys tems for the afterheat calculation was ca l i - brated during the run 12 startup. T h e temperature transient was recorded following a s t e p increase in nuclear power of 148 kw. The thermal capac i ty of the sys tem was found to be 16.22 Mw-sec/”F.
1 . 4 EQUIPMENT PERFORMANCE
Heat Transfer
C. W. Gabbard
T h e monitoring of the hea t transfer performance of the salt-to-salt heat exchanger continued, both by periodic measurement of the heat transfer coef- ficient and by practically continuous observation of the “heat transfer index.” (The heat transfer index is defined as the ra t io of react or power to the temperature difference between the fuel leav- ing the core and the coolant leaving t h e radiator.)4 Six s e t s of da t a were taken for evaluation (if t he hea t transfer coefficient during rutis 11 and 12.
41bid., p. 21.
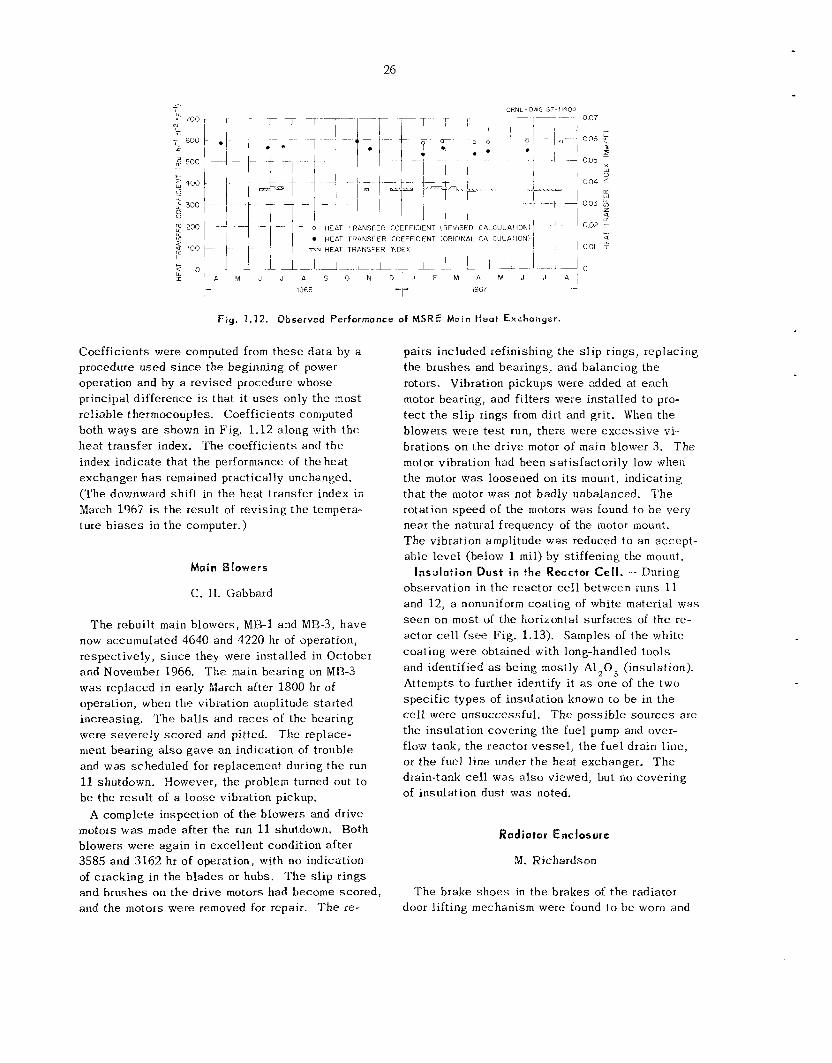
26
- -
C H E A T T R A N S F E R C O E F F I C I E N T ( R E h S F D C A C l J L A l ION) H E A T T R A N S C E R CCJFFFICIENT [ O Q I G I N A L C A L C U L A T I O N ! - H E A T TRANSFER INDFX
1067 T 1966 r F i g . 1.12. Observed Performonce of MSRE Main Heat Exchanger.
Coefficients were computed f rom these da t a by a procedure used s i n c e the beginning of power operation and by a revised procedure whose principal difference is that i t u s e s only the most reliable thermocouples. Coefficients computed both ways a re shown in Fig. 1.12 along with t h e hea t transfer index. T h e coefficients and t.he index indicate that the performance of the hea t exchanger h a s remained practically unchanged. (The downward shift in t he heat transfer index in March 1967 is t h e result of revising t h e tempera- ture b i a s e s in t h e computer.)
M a i n Blowers
C. 1-1. Gabbard
T h e rebuilt main blowers, M U - 1 and Me-3, have now accumulated 4640 and 4220 hr of operation, respectively, s ince they were installed in October and November 1966. The main bearing on MB-3 was replaced in early March after 1800 hr of operation, when the vibration amplitude s ta r ted increasing. The ba l l s and r aces of the hearing were severe ly scored and pitted. T h e replace- ment bearing also gave a n indication of trouble and was scheduled for replacement during the run 11 shutdown. However, the problem turned out t o b e the result of a loose vibration pickup.
A complete inspection of the blowers and drive motors was made after the run 11 shutdown. Both blowers were again i n excellent condition a f te r 3585 and 3162 hr of operation, with no indication of cracking i n the b lades or hubs. T h e s l ip r ings and brushes on t h e drive m o t o r s had become scored , and the motors were removed for repair. T h e re-
pairs included refinishing the s l i p rings, replacing the brushes and bearings, and balancing the rotors. Vibration pickups were added a t e a c h motor bearing, and fi l ters were installed to pro- t ec t t he s l i p rings from dirt and grit. When the blowers were t e s t run, there were excess ive v i - brations on t h e drive motor of main blower 3. T h e motor vibration had been sa t i s fac tor i ly low when the motor was loosened on i t s mount, indicating that the motor was not badly unbalanced. ‘The rotation speed of the motors was found to b e very near t he natural frequency of the motor mount. T h e vibration amplitude was reduced to an accept- able level (below 1 m i l ) by stiffening the mount.
I n s u l a t i o n Dust i n t h e Reactor Cell. -- During observation in t h e reactor ce l l between runs 11 and 12, a nonuniform coating of white material was s e e n on most of the horizontal sur faces of t he re- actor cel.1 (see Fig. 1.13). Samples of the white coa t ing were obtained with long-handled too ls and identified as being mostly A120, (insulation). Attempts to further identify it as one of the two spec i f ic t ypes of insulation known to b e in t he cell were unsuccessful. the insulation covering the fuel pump and over- flow tank, t he reactor v e s s e l , t he fue l drain l ine, or the fuel l ine under the heat exchanger. T h e drain-tank cell was also viewed, but no covering of insulation dus t was noted.
T h e poss ib le sou rces a re
R a d i a t o r Ene losura
M. Richardson
T h e brake s h o e s in the brakes of the radiator door lifting mechanism were found to b e worn and
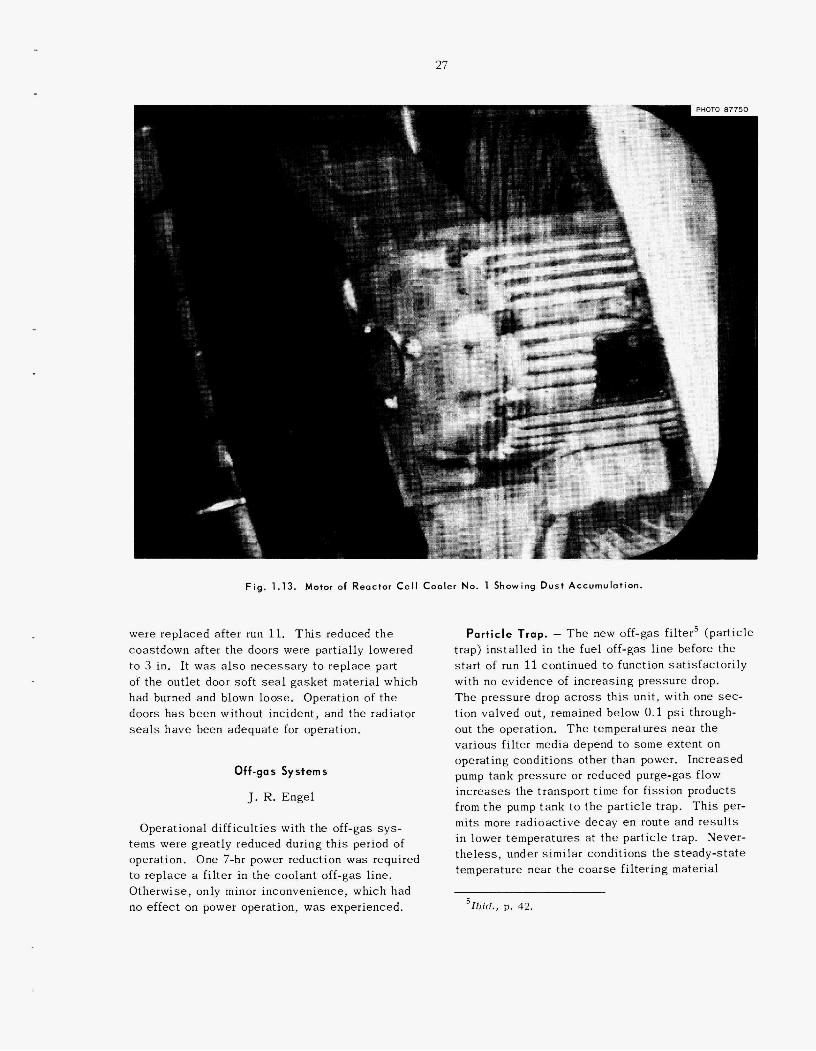
27
PHOTO 87750
were replaced after run 11. This reduced t h e coastdown after the doors were partially lowered to 3 in. It was a l s o necessary t o rep lace part of the outlet door soft seal gaske t material which had burned and blown loose. Operation of t he doors h a s been without incident, and the radiator seals have been adequate for operation.
Off-gas Systems
J. R. Engel
Operational difficult ies with the off-gas s y s - t e m s were greatly reduced during t h i s period of operation. One 7-hr power reduction was required to replace a fi l ter i n the coolant off-gas line. Otherwise, only minor inconvenience, which had
er operation, was experienced.
Fig. 1.13. Motor of Reactor Cell Cooler No. 1 Showing D u s t Accumulation.
Part ic le Trap. - T h e new off-gas filter' (pa trap) ins ta l led in the fuel off-gas l ine before the s t a r t of run 11 continued to function sa t i s fac tor i ly with no evidence of increasing pressure drop. T h e pressure drop ac ross th i s unit, with one sec- tion valved out, remained below 0.1 ps i through- out the operation, T h e temperatures near the various fi l ter media depend to some extent on operating conditions other than power. Increased pump tank pressure or reduced purge-gas flow increases the transport t i m e for f i ss ion products from t h e pump tank t o the particle trap. Th i s per- m i t s more radioactive decay e n route and r e su l t s in lower temperatures a t the particle trap. Never- t he l e s s , under similar con ons the s teady-s ta te temperature near the coa r se filtering material
Ibid., p. 42. 5
I
28
(Yorkmesh) was % 275°F when t h e particle t rap was f i r s t used and -380'F near t h e end of run 12. T h e temperatures decrease rapidly when the re- actor power is reduced, however, and the zero- power s teady-s ta te temperatures a re e s sen t i a l ly unchanged. T h e s e e f fec ts indicate the accumula- tion of some material, presumably organic, on t h e fi l tering media tha t enhances the retention of short-lived f i ss ion products.
charcoal beds in holding up noble-gas f i ss ion products h a s continued to be satisfactory. T h e gradual development of restrictions a t the in le t ends of the b e d s h a s a l s o continued, but t h i s h a s not limited the reactor operation in any way, s i n c e effective measures can be taken t o reduce the restriction when necessary.
Run 11 was s ta r ted in January 1967 with t h e charcoa l bed sec t ions 1A and 1B in se rv ice with an init ial p ressure drop of 2.5 ps i at normal off- g a s flow. T h e pressure drop increased very slowly, reaching 7 p s i on March 29, two months after the s ta r t of the run, At tha t t i m e the s tandby beds, 2A and 2B, were put in service, and the restricted sections were valved out. The pressure drop ac ross t h e s e sec t ions built up from 2.6 to 9 p s i in only t e n days. W e then cleared the res t r ic t ions from all four sec t ions by forcing c l ean helium through sec t ions 2A and 2B in the normal flow direction and heating the inlet ends of s ec t ions 1A and 1B with previously ins ta l led6 e lec t r ic heaters. T h e s e operations did not require a re- actor shutdown but only a temporary lowering of the water leve l in the charcoal bed pit to a l low the hea ters t o function.
After t he res t r ic t ions in both s e t s of beds had been c leared , s ec t ions 1A and 1B were put back in service. In t h e ensuing three weeks the pres- sure drop increased from 2.4 t o 3.5 psi. At tha t t ime, w e decided to increase the helium purge flow by 1 liter/min to see i f t he xenon poisoning would b e affected by lower concentrations in t h e fuel pump gas space . To accommodate the higher g a s flow without a n increase in fuel pump pres- sure , s ec t ions 1A and 1B were valved out and 2A and 2B were put in service. T h e next day sec t ion 1A had to be reopened t o keep the fuel pump pres- su re a t 5 psig. T h e normal purge flow was re- stored after three days , and, jus t before the power shutdown a t the end of run 11, the partial restric-
Main Charcoal Beds. - T h e performance of t he
61bid., pp. 30-31.
t ions in a l l four beds were again removed by heat- ing sec t ions 1A and 1B and forward blowing sec- t ions 2A and 2B.
Owing to the s u c c e s s of the hea ters in c lear ing the restrictions from sec t ions 1A and lB, w e in- s ta l led similar hea te rs a t the in le t s of s ec t ions 2A and 2B during the shutdown between runs 11 and 12. T h e differential pressure transmitter tha t s e n s e s charcoal bed pressure drop directly was also replaced. T h i s instrument had failed earlier, possibly because of the pressure differ- e n c e s imposed during blowouts of the charcoal beds. However, all t h e s e pressure differences were within the specified overrange capabili ty of the instrument.
Power operation in run 12 was s ta r ted with sec- tions 1A and 1B i n service. T h e gradual increase in pressure drop made it necessary t o change t o sec t ions 2A and 2B after about three weeks. T h e pressure drop ac ross the second sec t ions reached an unsatisfactory leve l after only s i x days. Then the res t r ic t ions were c leared from all four s ec t ions by heating the inlet ends. T h e remainder of run 12 was completed with sec t ions 1A and 1B in se rv ice .
T h e development of flow restrictions a t t he char- coa l beds appears to be related to the accumula- tion of vola t i le organic matter on t h e s t e e l wool packing a t the bed inlets. Phys ica l variations in th i s packing probably account for t h e different t imes required t o plug various individual sec t ions . T h e experience in runs 11 and 12 ind ica tes tha t the restrictions c a n b e effectively removed by electrically hea t ing the inlet ends of t h e beds. Presumably, t h i s heating dr ives the volati le matter off the steel wool packing in the in le t s and moves it farther downstream where the flow a reas a r e larger. There is no ev idence from the charcoal temperatures that t h i s mater ia l has reduced t h e f i ss ion product retention capabi l i ty of the charcoal. Since the heating operations do not a f fec t reactor performance, there a re no p lans at present to make further modifications a t the charcoal beds.
Coolant Off-gas System. - Very s low plugging of the coolant off-gas system at the f i l t e r tha t precedes the coolant-loop pressure control va lve h a s been encountered throughout t he reactor opera- tion. T h e originally installed filter was replaced in February 1965, during the preoperational check- out of the system. Subsequent replacements were made in March and September 1966 and on March 1, 1967. T h e replacement on March 1, 1967, re- quired a reactor power reduction for 7 hr t o permit
personnel access to the area where the filter i s located. By the end of run 11 (May 1967) the filter w a s plugged aga in , and periodic venting of t h e coolant system through an auxiliary l ine (L-536) was required to keep the loop overpressure below 10 psig.
During the shutdown between runs 11 and 12, the filter w a s replaced again, and a minor piping modification w a s made to permit the coolant o f f - g a s activity monitoring to monitor gas vented through line 536. Be€ore th i s change , any activity r e l ease would have been de tec ted and stopped by another monitor on the combined fuel and coolant off-gas, but identification of the source of t he activity would have been more difficult. No activity h a s ever been de tec ted in the coolant off -gas.
Cooling Water Systems
A. 1. Krakoviak
T h e cooling water sys t ems performed sa t i s - hc to r i ly during th i s report period. T h e sys t ems functioned relatively trouble f ree except for a few Leaks. In July a 15-gpd leak from the treated water sys t em was detected and was traced to a faulty pressure-relief valve in the l ine lead ing to one of t he reactor c e l l coolers. Replacement of the farilty relief va lve restored the sys tem to normal oper- ‘i t . Ion.
have occurred in t h e reactor c e l l s p a c e coolers a t the brazed jo in ts on t h e b ra s s tubing headers. During the scheduled shutdown a t t he end of run 11, both s p a c e coolers were leak-tested. One cooler (KCC-1) leaked less than 125 cm3/day and was not replaced; however, t h e other (RCC-2), which leaked a t t he r a t e of 9 Ii ters/day, was re- placed with a cooler whose headers and nipples were fabricated of copper. Copper weldments were used on the new cooler instead of the brazed jo in ts .
Radiation leve ls around the removed unit were sufficiently low tha t it could be d isassembled directly. T h e radiator was t h e most radioactive component, with readings up t o 1000 rniIlirerns/hr a t contact. (The radiation was very sof t and caused no contamination problem.) T h i s unit was discarded. However, t h e fan motor w a s retained
Space Coolers. - A s reported p r e v i ~ u s l y , ~ l eaks
71bid., p. 32.
for poss ib le future use , and the new fan, motor, and radiator were mounted on t h e original frame for installation in t h e ce l l .
Reactor Cell Annulus. -- Sometime prior t o or during run 11, the f i l l line t o the biological sh ie ld plugged, and water additions t o the reactor cell annulus were made through the level measuring line. Since the plug in the f i l l l ine could not he c leared , t he overflow pipe from the cell arinulus was modified t o a l s o serve as a f i l l line.
automatically from a feedwater tank (FWT) to a steaiii dome if cooling of a fuel drain tartk (FD) is required a f te t a fuel drain. During run 12, sr!iall amounts of water Erom FWT-1 had randomly ap- peared in the s t e a m dome of FD-1, caus ing a tem- perature dec rease in t h e fuel drain tank. To en- su re that t h i s drain tank remained available for a poss ib le emergency drain, the water was removed from t h e feedwater tank , which i s now in normal se rv i ce after having a faulty temperature swi tch replaced.
Steam Dome Feedwater Tanks. - Water is dumped
Component Cooling System
P. 11. Ilerley
Although some difficult ies were encountered, the component cooling sys tem operated satis- factorily during th i s report period. T h e two main blowers (CCP-1 and CCP-2) operated 1536 and 2375 hr tespectively; CCP-2 has operated for a total of 3340 hr without a failure.
T h e discharge check valve o n CCP-2 w a s re- placed and t h e be l t drive was tightened a s part of t h e prevenf.ive maintenance program. There w a s no indication o€ any significant aging of the s i l i - cone rubber in t h e removed check valve.
Trouble was encountered in t h e CCP-1 oil cir- culating sys tem. F i rs t , a loose tubing connection caused the l o s s of ‘\2 gal of oil during run 12; th i s irregularity w a s eas i ly repaired. Then, Fol- lowing t h e run 12 shutdown, intermittent law-oil- pressure alarms again occurred. An investigation indicated no significant 10s:; of oil, but a s low oil- pressure r e sponse was observed when the blower was started. T h e suspec ted oil pump and pressure- relief va lve on CCP-1 were replaced with spa re units t o correct the trouble. T h e removed pressure- relief va lve was found to be re1 ieving before the normal oil pressure developed. In sp i te of these
30
di f f icu l t ies i n t h e system, there was sufficient lubrication, and no noticeable damage was ob- served.
Although the temporary strainer in t h e CCP dis - charge l i ne worked satisfactorily, a more efficient strainer, which had been on order for a year, w a s received and installed in the line. Over a n eight- month period the temporary strainer accumulated -30 to 50 g of black, dry powdery material that appeared to be dust from abrasion of t h e drive be l t s . The new stiainer, however, h a s a 100-mesh screen and a 0.2-psi pressure drop as compared with a %6-in. pore s i z e and a 0.5-psi pressure drop in t h e old strainer.
T h e improved performance of the blower be l t drives, which have not needed replacing during t h e pas t nine months, is attributed t o l e s s frequeiit stait ing and s topping of the blowers as well a s t o the reinforced motor support. During early opera- tion, t he blowers were alternated twice a month; now one blower i s operated continuously during a run.
‘The s t a in l e s s s t e e l strainer which was removed had been in contact with condensa te containing dilute HNO, while in se rv i ce ( see “Containment,” p. 33). After being decontaminated, t h e strainer w a s examined and was found to be in vety good condition. The sur face was slightly e tched , but no more than would be caused by the decontamina- tion process.
Blower CCP-3, which cools out-of-containment freeze va lves , fa i led on April 19 after m o r e than 5000 hr of operation. A bearing galled and damaged the drive shaft . Operation continued without inter- ruption by using air from the se rv ice air compres- sor . Blower CCP-3 h a s been repaired and c a n no:v b e used when required.
Salt Bump Oil Systems
A. I. Krakoviak
T h e lubricating oil sys tems for both sa l t pumps have been i n continuous se rv ice except during the planned oil change during the shutdown after run 11. At th i s time the o i l w a s sampled, drained, and replaced with new oil. The oil, which had been in se rv i ce s ince August 1966, showed no signifi- can t change in i t s physical or chemical properties.
During t h e s teady full-power operation in run 11, very good ba lances were obtained on the oil sys - tem inventory changes, indicating l i t t le or no l o s s
by leakage into the pump bowl. T h e measured amounts removed for ana lys i s and accumulated in the ca tch t anks actually sl ightly exceeded the ob- served dec reases in supply reservoir contents. In March and April the difference was 65 c m 3 in the fuel pump system and 210 cm3 in the coolant pump s y s t e m
T h e oil leakage through the lower s e a l of the fuel-pump shaft had previously accumulated a t the rate of 5 cm3/day; it h a s now decreased to * 1 cm3/day. The leakage pas t the lower seal of the coolant s a l t pump averaged 17 cm3/day during run 11 arid 30 cm3/day during run 12; t he present ac- cumulation rate i s 15.
Automatic s iphons were originally installed on the oil collection tanks from both pumps to meas- ure and d i spose of s e a l leakage without manual draining to keep the leve l in t h e sens i t i ve (reduced cross-sec t iona l a rea) range of the level-measuring l eg of the collection tanks. T h e s e siphons have failed to funct-ion properly a t the low oil l eakage ra tes that actually occurred. The oil simply flows over the high point of t he siphon tube, much like a liquid flowing over a weir, without bridging the tube t o form a siphon. T h e overflow points for t he coolant pump and fuel pump o i l collection t anks were reached in March and April respectively. For the remainder of run 11 the only indicators of leakage rate were the supply reservoirs, which are much less sens i t i ve than the leakage co l lec- t ion t anks , After run 11 t h e collection t anks were drained, and the average leakages for the la t te r part of the run were determined by measuring the total accumulated oil leakage. The collection tanks were drained again after run 12, and periodic drainings a re planned to keep the oil level. below the siphon (overflow) level. (3ecause there is a high radiation field at the collection tanks, during power operation the draining operations must be performed only when the nuclear power is low. If high leakage ra tes (500 to 1000 cm3/day) develop, t he antomatic s iphons a re expected to function as de signed,
Although the o i l from the coolant pump seal when sampled had a dark appearance, spectro- graphic and infrared spectrophotometric ana lyses showed no significant difference between t h e seal leakage o i l and a sample of unused oil. The dark appearance and the somewhat increased leakage rate pas t t h e s e a l could be a n indication of ab- normal wear a t t h e Graphitar-stainless s t e e l rotary seal. of the s a l t pump. T h e soinewhat lower
3 1.
accumulation rate a t present ind ica tes that t h e seal may have resea ted itself.
Electrical System
T. L. Hudson
Power t o t h e MSRE e lec t r ica l sys tem is suppl ied from the OKNJL subs ta t ion by either of two 13.8- kv TVA power Isnes, a preferred l ine or a n alter- nate. During t h i s report period, while operating on t h e preferred feeder, there were two unscheduled e lec t r ica l interruptions when the reactor w a s a t power, During a thunderstorm on June 2.5, t he reactor operation was interrupted by the loss of both feeders. Two amplifiers were damaged on the reactor period safe ty sys tem, Approximately 32 hr later, the reactor was returried to cr i t ica l opera- tion after t he period safety amplifiers had been repaired. On July 12, the other interruption was caused by t h e l o s s of the preferred feeder during another thiinder:;torm. Einergency power f r o m t h e d i e se l generators was i n serv ice within 2 min, and low-power nuclear operation was resumed in about 13 min. After repairs had been completed on the preferred feeder, full-power operation was resumed in approximately 5 hr.
Difficulty was experienced in run 12 when re- s tar t ing main blower 1. T h e breaker tripped off the blower during the s ta r t ing sequence for s eve ra l attempted s ta r t s . On a later occas ion , the breaker tripped severa l l i m e s before main blower 1 w a s started. T h i s erratic behavior w a s explained when a loose gaske t was found in one of :he time- delay orifj.ces when t h e breaker was checked in August, T e s t s have been made that indicate t h e to ta l time of the s ta r t ing sequence is too long when compared with maximum time de lay of the breaker overload element. Therefore, the total t.ime of t he s ta r t sequence will b e reduced from 25 to 12 sec.
Heaters
T. L. Hudson
The last of s i x heat ing elements i n heater HX-I failed on October 28, 1966. Satisfactory hea t cx- changer temperatures were maintained without th i s heater, even with the fuel loop empty. However, continuous circulation of the coolant s a l t w a s rnclintained until after run 11, so t he f u l l e f fec t of the hea ter failurc could not b e detetmined. T e s t s
were performed with both the fuel and coolant loops empty after run 11 to determine the need for t h i s heater i n preheating the system from a cold condition. When helium circulation was stopped i n the fuel sys tem, t h e temperature distribution was sa t i s fac tory for a f i l l without heater IIX-1 operating. However, with h e l i u m circulation in the fuel system, “cold” helium was introduced possibly from the fue l pump -- and one temperature decreased to below 800°F. Since satisfactory tempera.tures could be achieved without i t , t h e failed heater w i ~ ~ not replaced.
and was replaced with a spa re heater (CRI-3C). During the shutdown after run 11 f.he e lec t r ica l l ead to hea ter CR5-IB was repaired, and the hea ter was placed back in service. ceramic bushings were also replaced at th i s time.
Radiator heater CK6-413 fa i led on March 30, 1967,
Several broken
Control Rods and Drives
M. Richardson
Performance of the control rods and drives h a s been within the operating l imits th i s period. N o mechanical failures of the rods or drives have occurred. T h e fine-position synchro of rod 2, which had failed during t h e previous period, w a s replaced prior to the beginning of run 12. T h e drive u n i t for t h i s rod w a s inspected a t the s a m e time and found to be in excellent condition. The grease in t h e drive unit appeared unchanged after a total radiation d o s e of about 10’ rads and there- fore was not replaced.
After run 12, routine checks of absolu te rod posit ion using the single-point indicators i n the rod thimbles revealed an apparent upward sh i f t of 0,s in. for rod 1. Since there w a s a n equivalent shifi i n t he upper and lower limit swi t ches , i t is believed that this shift was caused by slippage of t he drive cha in on one of the sprockets after a rod scram. T h e exac t time of the shift is not known because , between the absolute positron measurements, there were control rod scrams be- fore and after run 12.
Salt Samplers
K. B. Gallaher
Fuel Sampler-Enricher. -- T h e fue l sampler- enricher wcls used intensively during th i s report period with only a few minor difficult ies until the
32
failure tha t brought run 12 to a n end. Between March 1 and August 5 there were 11.1 operations, as follows:
Salt samples 71 Freeze-valve samples of cover g a s 6
1 Bery l l ium additions 6 Uranium additions 27
Exposure of graphite t o salt and cover g a s
Of t h e sa l t samples, 14 were 50-g samples and 2 were taken in spec ia l three-compartment capsu le s . T h e spec ia l samples a re described in t h e sec t ion “Reactor Chemistry,” T h e s e operations brought t he total , s i n c e the sampler-enricher was ins ta l led in March 1965, to 114 uranium enrichments and 279 samples and spec ia l exposures.
reactor cri t ical , provided information on mixing between s a l t i n the sample enc losure and the main circulating stream. Response of the ie- activity (Fig. 1.7) revealed a time constant c l o s e to that for mixing between the pump bowl and t h e main stream, indicating rapid melting of the en- riching s a l t and good circulation through the sample enclosure.
boot assembly w a s replaced after a small l eak appeared i n one ply of the boot. T h e arm was quite contaminated (300 r/hr a t 3 in.), but i t w a s successfu l ly decontaminated and saved for pos- s ib l e future u s e (see p. 40). At the s t a r t of run 12, one ply of t he boot was ruptured when ex- c e s s i v e differential pressure was inadvertently applied, and again t h e assembly V J ~ S replaced. T h i s t i m e a slightly different boot was used. T h e new boot was thicker and more durable (at t he expense of ease of manipulation), and the outs ide was coated with a white p las t ic spray which ef- fectively improved viewing in the sampler by de- c reas ing light absorption.
dropped whi le i t was be ing removed from the 1-C area with the manipulator. T h e capsu le fell onto the ga te of the operational valve, where i t w a s retrieved by a inagnet lowered on a cable.
Enriching capsu le s occasionally jammed iii t he transport container until t he difficulty was elimi- nated by increas ing the length of the cavity in the d isposable portiori t o give more room for the long capsu le and attached key.
T h e uranium additions, t he first made with the
Near t h e end of run 11 the manipulator arm and
One of the beryllium addition capsu le s was
T h e neoprene s e a l s on the 1-C access port be- gan to show increased leakage , possibly due to radiation damage. F i s s ion products, mostly t h e s p e c i e s found in cover-gas sarnples, produced radiation l eve l s i n a rea 3A of s eve ra l hundred rads per hour.
area was reduced a factor of 10 by using the manip- ulator t o wipe down sur faces with damp sponges. In run 12, increased leakage from t h e buffer zone between t h e seals on the 1-C access port was met by increas ing the size of the helium supply flow restrictor so that a satisfactory buffer pressure could b e maintained. Operation of the pneumatic clamps on the 1-C access door occasionally re - su l ted in gaseous f i ss ion products being vented through the operator vent line. A small charcoal filter was added to prevent t h i s activity f r o m reach;-ng the s tack .
As described on p. 15, a s i tua t ion developed on August 5 that led to a shutdown of t he reactor and replacement of the 1-C assembly. It now appears that the trouble started when the latch hung a t the maintenance valve. Indications were that both isolation va lves were fully open and that the capsule key was hanging properly in the latch a t the outset; so the exac t c a u s e of the hangup i s not known. But there is convincing ev idence that t he drive cab le was severed by the operational- valve ga t e while t h e latch was a t the maintenance valve. T h e length of the latch and remaining drive cab le (Fig. 1.3) equa l s the d is tance from the maintenance valve up to the ga te of the operational valve, and the cab le end appeared t o have been cut. It was believed that the operational va lve w a s practically c losed before subs tan t ia l res i s t - ance was felt, but i t would have been easy to mistake the torque and motion involved in shear - ing the c a b l e and sea t ing the va lve for simply sea t ing t h e valve. (The tiandwlieel torque re- quired to shea r t h e cable was subsequently ca l - culated t o b e l e s s than 100 in.-lb.)
Once before, i n December 1965, t he latch ap- parently hung up at one of the isolation va lves , caus ing the drive cable t o coil up i n t he 1-C area and in the drive unit. Following that occas ion , the travel of the va lve g a t e s on opening was in- c reased slightly, and when the 1-C assembly w a s removed after t he recent trouble, the va lve ga t e s were observed to completely c lear t h e sample tube. T h e va lves were a l so observed to function reli- ably, so no changes were made.
Before run 12, t he radiation in t h i s
33
T h e retrieval of t he sample la tch would have been facil i tated had i t been magnetic. Therefore, f.he replacement la tch was made of magnetic typte 430 s t a i n l e s s s t e e l ins tead of type 304 s t a i n l e s s s t ee l . Another change in t he replacement unit was the addition of a s l eeve to bridge the 2-in. gap between the cab le drive ree l and the floor of the drive compartment. T h i s wi11 prevent the cab le from escap ing into th i s compartment if i t meets res i s tance while be ing unreeled.
As explajried on p. E, the detached capsu le is posit ively confined by the baffle so that it cannot. e scape . Swirl ve loc i t ies observed in the bowl of the prototype s a l t pump were l e s s than 0.1 fps , indicating tha t continual movement of the loose capsu le is very unlikely. Nor should the capsu le corrode. T h e body of t he capsu le is copper, and the c a p is mild s t ee l with a thin nickel plating that probably l eaves some ferrous metal exposed. On exposure to t.he molten s a l t , the copper-iron- nickel assemblage in contact with the chromium- containing Hastelloy of the baffle and lower head will temporaiily cons t i tu te a n electrochemical cell, in which C r 0 from the Wastelloy su r faces will b e oxidized to Cr2 + and reduced once aga in to Cro metal on the capsule surface. T h i s re- action s lows down as the chromium activity in the capsu le sur face approaches that of the Hastelloy sur faces . Eventually the transfer diminishes to the ra te at which the chromium c a n diffuse into the capsu le metal. 'The amount of chromium tha t can b e transferred in th i s way will have negligible effect on nearby Hastelloy surfaces. The con- c lus ion is, therefore, that no i l l e f f ec t s will re - su l t from the presence of the c a p s u l e in the pump bowl.
C o o l a n t Sampler . - During th i s report period, s even 10-g samples were i so la ted from the coolan t s a l t pump, bringing the to ta l with t h i s sampler to 60. There were no operating difficult ies and no maintenance was required.
F u e l Processing Sampler . - T h e sh ie ld ing around the fue l process ing sampler w a s finished, complet-ing the ins ta l la t ion of th i s sampler. T h e nylon guide in t h e removal a rea and the manipula- tor arm were subsequently removed for use in t h e fue l sampler. Other spa res are now on hand but will not b e ins ta l led until near time for u s e of the process ing facil i ty.
Containment
I?. 11. Harley R. c. Steffy
Secondary C o n t a i n m e n t . -- During run 11, the containment cell inleakage was measured to b e cu 10 scf /day with the cell at .- 2 ps ig . Th i s de- termination was made by monitoring the ce l l pres- su re with t h e Hook gage (a sophis t ica ted water manometer) and by measuring ,711 known purges in to and out of the containment cell . T h e cell p tessure arid system purges remained virtuaIly constant, with s m a l l p ressure osc i l la t ions occur- ring as the outs ide temperature fluctuated. T h e s c osc i l la t ions were particularly not iceable during the colder months.
Between May 16 and June 13, an ex tens ive contaitirrient check was made. Thi r teen block va lves out of a total of 160 were found to be leaking and were repaired. F ive were instrument air block va lves , three were in the cover-gas {helium) sys tem, and five were in the treated- water syst.em. age was aging elastomer O-rings; a few, however, had s c a l e , metal f i l ings, o r dirt on t h e sea t ing sur faces . None of the va lves leaked excess ive ly , and seven of them a re backed by a c losed sys tem. Two o thers a re in u s e .:0.1"/, of the time arid are normally backed by c losed hand valves.
T h e most common c a u s e of leak-
At the beginning of run 12, the secondary con- tainment v e s s e l l eakage was checked with t.he containment cell at 20 psig. At th i s pressure t h e cell leaked only "u 28 scf/day. The cell w a s then evacuat.ed to - 2 psig, and reactor filling opera- t ions were started.
As during earlier runs, there was a water leak in t h e c e l l during tun 12 (this leak is d i scussed later iri the section). As a result of the water leak the first determinations placed the cell leak rate at -270 scf/day. However, as soon as t h e c e l l air became saturated, t he indicated l eak rate dropped to t 2 0 scf/day. Th i s took only about s even days. For the major part of run 12, t h e indicated ce l l l eak r a t e remained essent ia l ly cons tan t at '̂ 14 scf/day..
For both runs 11 and 12, t he (:ell l eak ra te va lues were well below the 85 scf /day permissible (extrapolated from acc ident conditions a t a 39- psig cell pressure).
34
Although the Hook gage h a s been the primary means of determining the cell leak ra te , an on- l i ne oxygen analyzer (Beckman model F3) was installed a t the MSRE with the expectation tha t i t could b e used as a means of calculating t h e ce l l leak r a t e as well as keeping t rack of t h e cell oxygen content. Cel l oxygen content is held >3% t o prevent nitriding of the Hastelloy N and <5% t o eliminate the possibil i ty of combustion in the ce l l i n case of a n oil leak,
To obtain consisteri t da t a from the analyzer, we have found i t necessary to ca l ihra te the in- strument every 8 hr. In sp i t e of t h i s calibration frequency the indicated oxygeii content often changes 0.2 or 0.3% between readings taken every 4 hr. Since a 0.1% change in oxygen corresponds to -60 scf of air , it i s evident that only da t a taken on a long-term b a s i s a r e meaningful.
analyzer indicated a negative cell leak rate (the cell was leaking out instead of in). A poss ib le explanation for t h i s negative ce l l l eak is that something is combining with the oxygen in the cell . If i t is assumed that the Hook gage is cor- rect , then % 3.7 scf /day of oxygen must be re- moved from the ce l l atmosphere to explain t h e oxygen results. Oxidation of a smal l amount of oil on hot sur faces could eas i ly consune th i s amount of oxygen. Additional investigation will be required t o reso lve t h e discrepancy between the two methods of ce l l leak-rate measurement.
t o t he atmosphere during th i s report period con- s i s t e d of 3.99 m c of iodine and <0.23 mc of particulate matter. The largest s ing le re lease w a s 1 m c of iodine, released while removing graphite samples from the reactor core on May 15. Other measurable r e l e a s e s included 0.7 m c of iodine activity while preparing to remove t h e broken sample-cable latch and 0.05 mc of iodine re leased when the Fuel Storage Tank was vented to the s t ack prior t o modification of the fuel process ing piping.
Venti lotion. - No difficult ies were encountered with the ventilation f a n s during the past s i x months. T h e ventilation discharge fi l ters showed a n in- c r e a s e in ,Ai-’ f r o m 1.13 to 1.85 in. H,O ac ross the roughing filter section. There was no increase a c r o s s the absolu te fi l ter section. T h e annual filtering efficiency t e s t of the absolu te fi l ters in the ventilation discharge was performed on June
During both runs 11 and 12, d a t a from t h e oxygen
Activity Releases. - T h e to ta l activity re lease
5, 1967. Resu l t s o f the standard U O P (dioctyl phthalate) t e s t for t he three banks of fi l ters were 99.994, 99.998, and 99.979%; the minimum ac- ceptab le efficiency is 99.95%.
Contamination experience i n the vent house during maintenance operations8 and the prepara- t ions for t h e off-gas sampler led to severa l re- v i s ions in the ventilation piping in that area. A new G-in. l ine was installed between the main ventilation l ine and the instrument and valve box of the reactor off-gas sys tem in the immediate vicinity of the particle traps. The ex is t ing vent l ine from the valve box was iricreased f r o m 2 in. t o 4 in. i n diameter, and a &in. branch w a s in- s ta l led to vent the off-gas sampler box. T h e s e l i nes will improve the ventilation of the affected a reas and redrice t h e r e l ease of contaliiination during maintenance when the a r m s are open to t he atmosphere.
runs 11 and 12, it appeared that the atmosphtii-e i n the reactor and drain-tank cells increased in humidity for t h e first few days after the contain- ment was s e a l e d , until finally moisture began to condense in cooler points in the component cool- ing system. Condensate w a s drained daily f i o m the in le t s of t he component cooling blowers and the she l l of t h e air cooler a t the discharge of the blowers. During runs 11 and 12 the total conden- s a t e co l lec ted was 100 a-nd 50 gal, respectively, averaging about 0.9 gpd.
At l ea s t part of the inleakage in run 11 w a s f rom a s p a c e cooler (KCC-2) in the reactor ce l l which was definitely leaking before i t was re- placed a t t h e end of that run. T h e sourcc of the leakage during run 12 was not located, not even as t o whether i t was i n t he reactor or diaiil-tank ce l l , s ince no water appeared in t he sump i n either ce l l in run 11 or 12.
To determine whether t he leak might be in t h e nuclear instrument penetration, t h e water for shielding and cooling th i s penetration was sp iked with 6 kg of D 2 0 during run 12. Analys is of t h e condensa te showed no de tec tab le increase in deuterium content above t h e normal water concen- tration. was such tha t a leak of 0.01 gpd in to the con- tainment from t h e instrument penetration would have been detectable.
Moisture in Reactor Cell Atmosphere. - In both
l‘he sens i t iv i ty of t h e deuterium ana lyses
‘lbid. , p. 38.
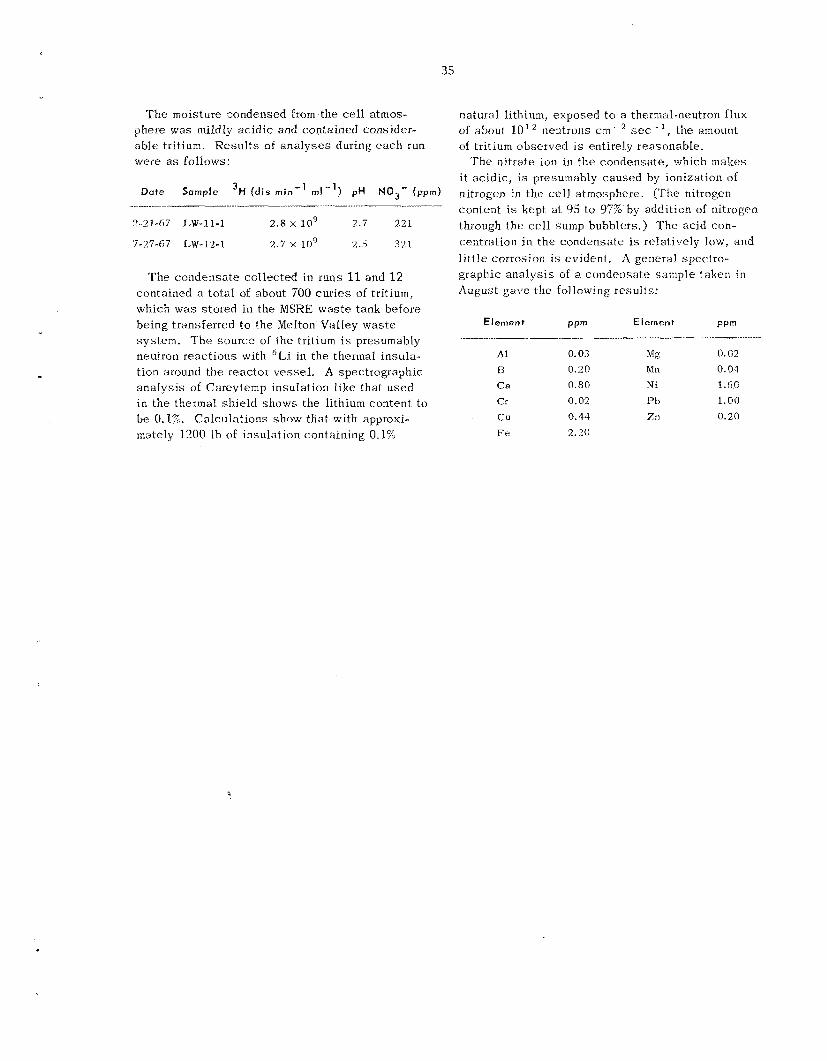
35
T h e moisture condensed from the cell atmos- phere was mildly ac id ic and contained considcr- ab le tritium. Resu l t s of ana lyses during e a c h run were as follows:
Dute Sample 3H (dis min- ' m l - ' ) pH N O g - (ppm)
2-21-67 Lw"l1-1 2.8 l o 9 2.7 221
7-27-67 LW-12-1 2.7 x l o 9 2.5 321
'The condensa te collected i n runs 11 and 12 contained a total of about 700 cu r i e s of tritium, which was s tored in the MSHE was te tank before being transferred to the Mellon Valley was te sys tem. The source of t he tritium is presumably neutron reac t ions with 'Li in the thermal insula- tion around the reactor vesse l . A spectrographic ana lys i s of Careyternp insulation l ike that used in the thermal sh ie ld shows the lithium content to he 0.1%. Calculations show tha t with approxi- mately 1200 lb of insulation containing 0.1%
natural lithium, exposed to a thermal-rieutron flux of about 10'' neutrons C I T J - ~ set.-', the amount of tritium observed is entirely reasonable.
i t ac id ic , is presumably caused by ionization of nitrogen in the ce l l atmosphere. (The nitrogen content is kept at 95 to 97% by addition of nitrogen through t h e ce l l sump bubblers.) T h e acid con- centration in t h e conderisate is relatively low, and l i t t l e corrosion is evident. A general spec t ro- graphic ana lys i s of a condensa te sample taken in August gave the following resul ts :
T h e nitrate ion in the condensate, which makes
Element P Pm E lernent PPm
A1 0.03 b k 0. (i2 13 0.20 Mn 0.04 Ca 0.80 xi 1.60 Cr 0.02 Pb 1.00 c u 0.44 Zn 0.20
F c 2.20
Dunlap Scott
R. B. Gallaher A. N. Smith
The sys tem developed for sampling and analyz- ing the fuel off-gas was described in the l a s t progress report. During th i s report period, in- s ta l la t ion of all peripheral equipment was com- pleted, but the installation of the actual sampling, mechanism was delayed. (Per iphera ls include shielding, external tubing and connection points, power and instrument wiring, pane ls , and instru- ments.)
During final inspection and checkout of the sainpling mechanism, a failure was detected in a Monel-to-stainless-steel weld. Further de ta i led radiographic inspection revealed some other welds, mostly Monel to s t a i n l e s s s t ee l , that were judged to be marginal or unacceptable for primary reactor containment. Therefore, the mechanism was modified t o eliminate man.y of t h e dissirnilar- metal welds (by substi tuting s t a in l e s s s t e e l va lves for Monel in the valve manifold) and t o reduce mechanical s t r e s s e s a t the welds. The valve substi tution eliminated brazed joints at the valve bodies, and other minor modifications were made to improve the containment integrity of the assembly and the sample transport bottle. 'The sampler w a s reassembled, with a l l welds ful.ly certif ied, but installation was deferred because of other work during the shutdown following run 12.
2.2 REMOTE MAINTENANCE
Robert Blimberg
During th i s report period the trend for more re- m o t e rnairitenance to be handled routinely was ac-
' M S R Program Semiann. Progr. H e p t . Feb . 28, 1967, OKNL-4 119, pp. 41-42.
celerat.ed, hut development e f for t s remained con- siderable and varied.
considerable effort was spen t in advance on de- velopment of procedures, preparation of too ls and equipment, and training of maintenance personnel. A s a result , most of the remote maintenance work during th i s shutdown was handled by the normal maintenance forces. Development personnel also participated and afterward reevaluated procedures and tools. The next shutdown w a s unscheduled. Although s o m e equipment and genera l t echniques already developed for other j obs proved t o b e adaptable, intensive work w a s required to develop too ls and procedures for retrieving the sample 1 a t c h.
T h e shutdown in May and June w a s planned, and
Preparations for Shutdown After Run 11
At t h e beginning of MSKE operation, when tools and procedures for all remote maintenance jobs were s t i l l being tes ted and revised, development personnel provided direct guidance and much of the actual work. Rut the work planned for t h e shutdown after run 11 cons is ted mainly of jobs for which tools and procedures had already been proved. Therefore, the contribution of t he develop- n e n t group shifted more toward training main- tenance personnel, helping plan the operations, and putting +.he maintenance equipment in readiness .
The training program cons is ted of a se r i e s of lec tures ~ demonstrations, and practice se s s ions conducted by members of the maintenance develop- ment group and attended by s o m e 30 people, in- cluding 5 craft sk i l l s and their supervision. 'The lec tures covered health phys ics , sa fe ty considera- t ions, general requirements of a l l remote main- tenance, remote maintenance strategy used a t t h e
36
37
MSRE, de ta i l s of some of the equipment, and de- sc r ip t ions of spec i f ic problems. T h e demonstra- t ions involved t h e viewing equipment, t h e remote c ranes , t h e portable maintenance sh ie ld , and some of t he long-handled tools. core sample removal and replacement se rved both to train personnel and t o shake down the equipment.
T h e planning part of the preparation involved the writing or updating of step-by-step procedures fGr each job. T h e s e procedures were used to draw up l i s t s of requiied tools, equipment, and material, and to es t imate time and manpower requirements. Poss ib l e problem a r e a s were recognized €or prior tes t ing and mockup practice. Before the shutdown began, the procedures were used to provide informa- tion to the foremen and the working crews.
A large effort was required to put a l l t h e physical equipment into readiness. of new equipment; cleaning, maintenance, and repair of ex is t ing equipment; and procurr?rnerit of some spec ia l items. Numerous long-handled too ls , containers €or hot pulls, materials for contamina- tion control, handling equipment, and devices for shielding, lighting, and viewing were prepared.
Prac t ice s e s s i o n s on
T h i s meant fabrication
Evaluation of Remote Maintenance After Run 11
T h e maintenance work during th i s ::hutdown was done on a two-crew, two-shift-per-day bas i s , Al- though there were drawbacks, such as spreading more thinly the knowledgeable personnel and lo s t motion a t sh i f t change, the' work proceeded safe ly and smoothly. Radiation leve ls were about the s a n e as a t the last shutdown and did not require any changes in procedure. Some bothersome de- !ays wete caused by breakdowns of the c ranes and maintenance sh ie ld , but the schedule was not seriously affected. Comments on individual j obs follow.
Removing and replacing the sample array i n t he core was the most difficult t a s k of the shutdown, involving as i t did an extremely in t ense source of radiation and contamination. T h e standpipe above the reactor access flange contained the assembly and maintained an inert atmosphere on it. Before the operation a new charcoal f i l ter w a s ins ta l led iri the vent l ine from the standpipe t o prevent iodine re leases . The procedure used previously was changed to minimize the t ime of exposure for the uncontained sample within the stkindpipe and to provide complete containment
and shielding during the transfer of the sample from the standpipe to the sh ie lded carrier. Two unanticipated s i tua t ions arose. The bushing which supports the sample assembly arid which i s sup- posed to s t ay locked in posit ion in the v e s s e l outlet strainer actually came out on the sample basket. After visually ascertaining that the s t ra iner w a s not damaged, a new bushing was inserted. Ulieri difficulty was encountered la te r in obtaining a sa t i s fac tory seal while replacing the reactor access flange, four bol t s were re- placed, and all the threads on the nut:; were c leaned by tapping. T h i s permitted an increase in gaske t loading which eliminated the leak.
a control rod drive went smoothly.
through the portable maintenance sh ie ld and then was removed by us ing the c rane , television, and remotely operated maintenance-shield s l ide from the maintenance control rooin. A new unit, reas- sembled on the old frame, was reinstalled the same way without excess ive difficulty.
The metallurgical spec imens which hang in t h e reactor v e s s e l furnace were replaced without dif- ficulty. The carrier for the core samples w a s used to transport the specimens to the hot cell. 'The f resh neutron source was transferred f rom a carrier and p laced in the source t.ube (,on top of the original source) without incident..
Visual inspection in the ce l l was by use of a periscope, binoculars, and remote television. Thermocouple junction boxes were t e s t ed , and four thermocouples were plugged into a spare dis- connec t box by using long-handled tools through the maintenance shield.
As a result of the experience during th i s shut- down, procedures were reviewed and revised where desirable, and some tools and equipment were revised or overhauled. The television camera mounts were changed for greater flexibility, and revisions were made to the track and to the roller and guide bearings on the maintenance shield.
Iiemoval, repair, inspection, and replacement of
T h e leaking east s p a c e cooler was disconnected
Repair of Sampler-Enricher and Recovery of Latch
After the failure of the sampler-enricher drive unit, a lead carrier was built , and detailed pro- cedures for t he removal of the de l ec t ive unit were prepared and reviewed. T h e ac tua l removal of th i s component was without incident.
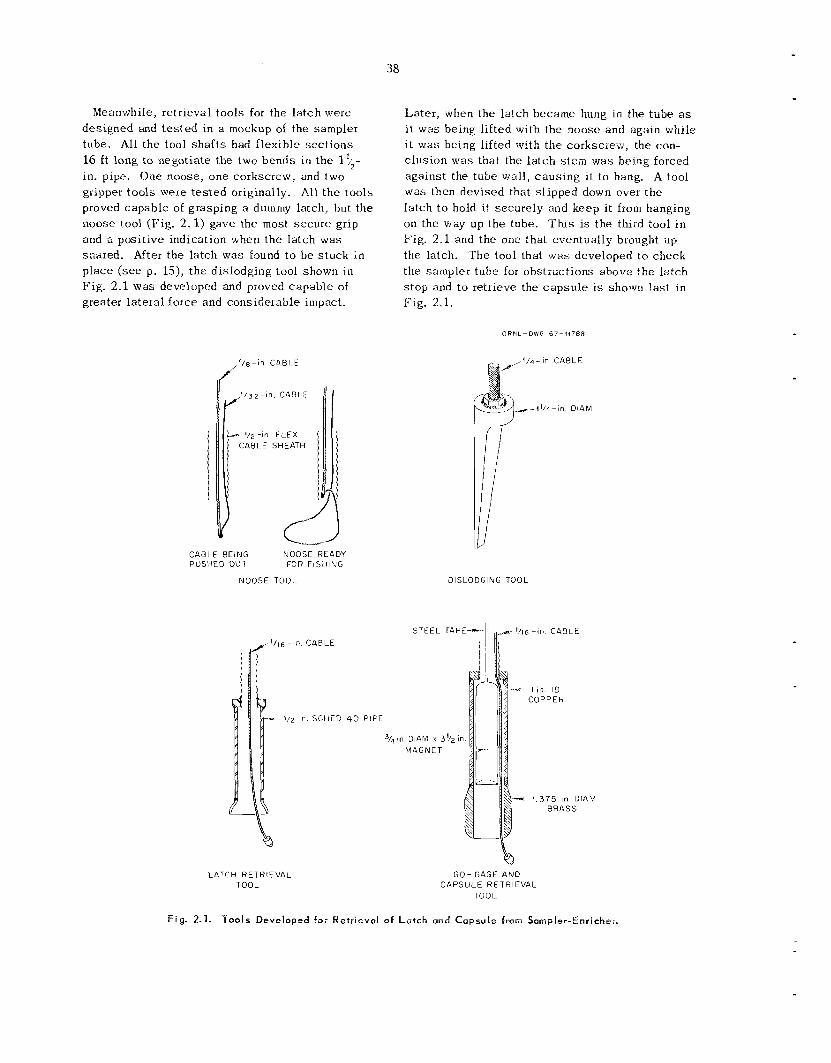
38
Meanwhile, retrieval tools for the l a t ch were designed and t e s t ed in a mockup of the sampler tube. All the tool sha f t s had flexible sec t ions 16 Et long to negotiate the two bends in t he l f /2- in. pipe. One noose, one corkscrew, and two gripper too ls wehe tes ted originally. All t he tools proved capable of grasping a dummy latch, but the noose tool (Fig. 2.1) gave the most secure grip and a posit ive indication when the latch was snared. After the latch was found t o be s tuck i n p lace ( see p. 15), t he dislodging tool shown in Fig. 2.1 was developed and proved capable of greater lateral force and considerable impact.
I CABLE SHEATH
CABLE BEING NOOSE READY PUSiHEO OllT FOR FiSI I ING
NOOSE TOOL
' / e In
LATCH RETRIEVAL TOOL
SCHEO 40 PIPE
3/4
Later , when the la tch became hung in the tube as i t was being lifted with the noose and again while i t was being lifted with the corkscrew, the con- c lus ion w a s that the la tch s t e m was being forced against the tube wall , caus ing i t t o hang. A tool was then devised that sl ipped down over the latch to hold i t securely and keep it f rom hanging on the way up the tube. This is the third tool i n Fig. 2.1 and the one that eventually brought up the latch. T h e tool that was developed t o check the sampler tube for obstiuctions above the la tch s t o p and t o retrieve the capsu1.e is shown l a s t i n Fig. 2.1.
O R N L - D W G 6 7 - t t 7 8 8
OlSLODGiNG TOOL
STEEL rAPE--dI , , N ~ / I ~ - I ~ CABLE
D l 4 M h 34/2
MAGNET-
- - I in. I D COPPER
- - ( . 375 in DlAPrl BRASS
GO- GAGE AND CAPSULE RETRIEVAI.
TOOL
F i g . 2.1. Too ls Deve loped 60; Hetrievol of Loach and C a p s u l e from Sample- enricher^
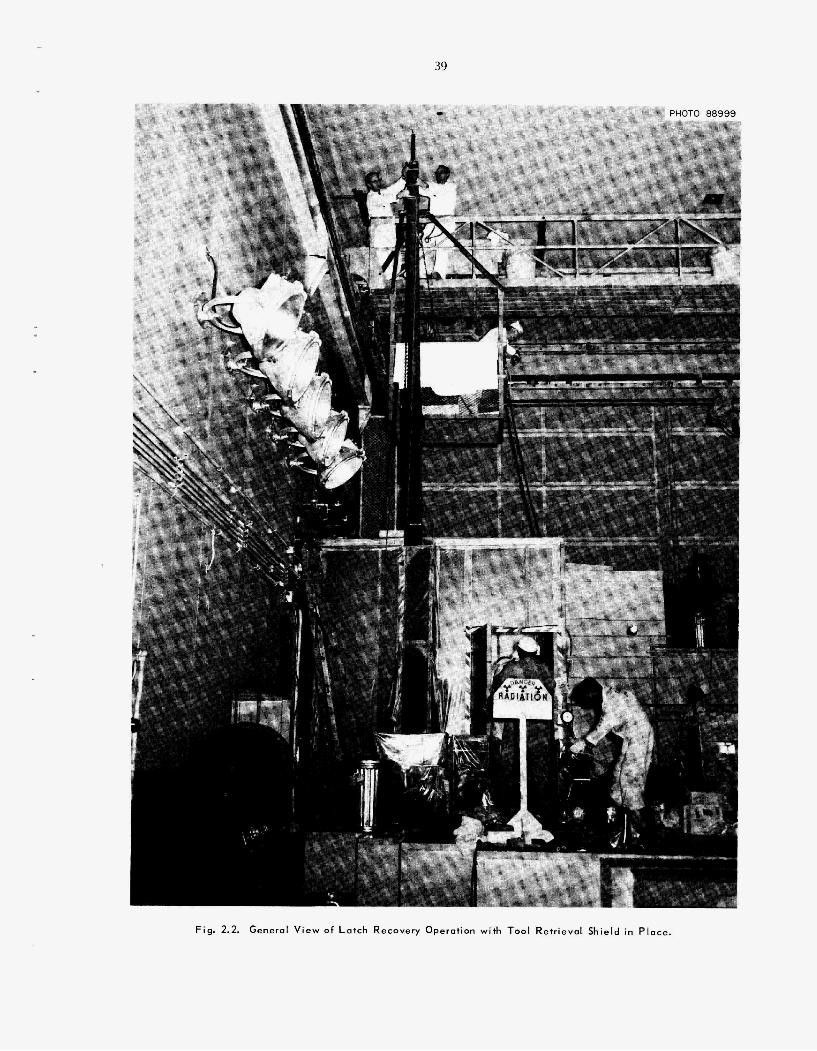
39
Fig. 2.2. General V i e w of L a t c h Recovery Operotion with Tool Retr ieval Shield i n P lace.
40
Some de lays were encountered in the retrieval operation because of the necess i ty of building sh ie lded car r ie rs into which t o pull t he contami- nated tools. A s a result a very convenient ar- rangement was developed. A hollow lead cylinder, 24 ft long with 1- to 11/2-in. wal l s , strapped to a s t e e l I-beam formed the body of t he carrier. A 24-ft length of l>2-in. pipe, with a ga t e valve at t h e lower end, fitted into the sh ie ld and could eas i ly b e dropped out at t h e burial ground with the contaminated tool s a fe ly contained inside. F igure 2.2 shows the containment enclosure around the restricted work a rea , with the sh ie lded carrier suspended from t h e c rane bridge. T h e workers on the bridge a re in posit ion to pull a tool out of the sampler tube with a cab le dropped through a seal on the upper end of the pipe liner. T h i s system was used for f ive hot pulls, with no spread of contamination or e x c e s s i v e radiation.
When the replacement sampler drive unit w a s installed, some difficult ies were encountered in fi t t ing up pipe and tubing connections, but con- tainment jo in ts were made up leak-tight.
T h e procedures and too ls developed for t h i s shutdown proved effective. T h e tool retrieval sh ie ld , i n particular, was a useful development.
t ion prevented spread of ac t iv i ty outs ide t h e restricted work zone, and the h ighes t quarterly d o s e for any worker was only 300 millirems. In view of the in t ense sou rces involved, this record a t t e s t s t o the e f fec t iveness of the controls.
Measures for control of contamination and radia-
2.3 DECONTAMINATION STUDIES
T. H. Mauney
T h e maintenance scheme for molten-salt breeder reactors proposes that components which c a n be eas i ly decontaminated will b e repaired and reused as spa re parts. A s a n a id in eva lua t ing t h i s proposal, a study was s ta r ted t o determine t h e e f fec t iveness of decontamination procedures i n reducing the activity of contaminated par t s from t h e MSRE.
T h e first item used in t h e study w a s t h e manip- ulator hand which had been used in t h e sampler- enricher sys tem during months of power operation, unti l it was replaced b e c a u s e of a leak in the boot. When removed from the sampler-enricher, the unit w a s contaminated by mixed f i ss ion prod- uc t s to a l eve l of approximately 300 r/hr at 3 in.
It was necessa ry t o f i r s t remove the two-ply p l a s t i c boot which had provided f i ss ion product containment for t h e manipulator while in use. S ince the ORNL facil i ty used for routine decontami- nation can handle only up t o 50 r/hr of gamma radiation, it was necessary t o u s e a facility at the High-Radiation -Level Analytical Laboratory. T h i s facil i ty w a s equipped with remote handling equipment and high-pressure sp rays which were used in t h e procedure.
T h e decontamination began with spraying the manipulator hand with a 500-psi j e t of detergent. T h e unit was then soaked in seve ra l solutions. After t h e radiation leve l was reduced to less than 3 r/hr, t he manipulator was removed to a laboratory hood and hand scrubbed with a wire brush and another detergent. T h e radiation leve l w a s finally reduced from the in i t ia l reading of -300 r/hr to a final leve l of 300 mr/hr, which was low enough to permit controlled direct contac t for repair. T h e de ta i led resu l t s of t he various treatments in re- ducing the radiation leve l are shown in Tab le 2. 1.
One of the complicating fac tors affecting t h e decontamination of t he manipulator hand was the presence of many crev ices i n the l inkages and p ins which could not b e reached by the jet spray. Extending the cleaning time per s t e p might have resulted in greater decontamination factors. Fur- ther s tud ie s will b e made of t h i s effect as other components become available.
T h e decontamination of the manipulator hand served a dual purpose. It not only helped de- termine t h e e f fec t iveness of decontamination procedures in reducing t h e activity of MSRE con- taminated components, but a l s o made available a t a decontamination cos t of $300 a spa re part that would have c o s t about $2000 t o duplicate.
2 .4 DEVELOPMENT OF A SCANNING DEVICE FOR MEASURING THE RADIATION
LEVEL OF REMOTE SOURCES
Robert Blumberg T. H. Mauney Dunlap Scott
A method for locating and eva lua t ing concentra- t ions of radioactive materials in a r e a s having high background radiation would b e useful in fol- lowing t h e deposit ion of f i s s ion products i n com- ponents of circulating fuel reac tors and in chemi- cal process plants. Loca t ion of unusual depos i t s would aid in understanding the operation of t h e
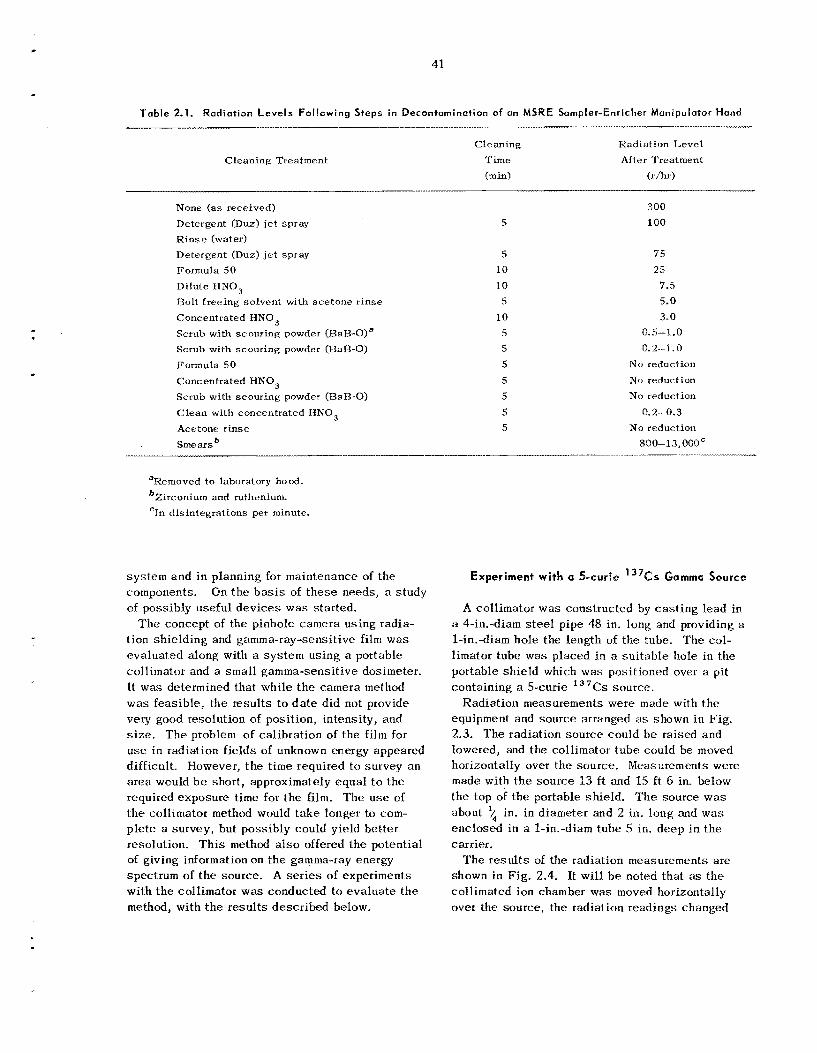
c
41
T a b l e 2.1. Radiat ion L e v e l s Following Steps i n Decontamination of an MSRE Sampler-Enricher Manipulator Hand _____I____
Cleaning Radiation Level Cleaning Treatment Time Ntri Treatment
(min) (r/hr)
None (as received) Detergent (Duz) je t Spray Rinse (water) Detergent (Duz) j e t spray Formula 5 0 Dilute HNO, Bolt freeing solvent with acetone t inse Concentrated HNO, Scrub with scouring powder ( & I B - O ) ~ Scrub with scouring powder (BaB-0) Formula 5 0 Concentrated HNO, Scrub with scouring powder (Ran-0) Clean with concentrated HNO, Acetone r inse smears '
5
5 10
10 5
1 0 5 5 5 5 5 5 5
300 100
75
25 7.5 5.0 3.0
0..5--1.0
0.2-1 .o No reduction No reduction No reduction
0.2-0.3 N o reduction 800-13, O0OC
aRemoved t o laboratory hood. bZirconium and rutlienium. CIn disintegrations per minute.
sys t em and in planning for maintenance of the components. of possibly useful devices was s tar ted.
tion shielding and gamma-ray-sensitive f i lm w a s evaluated d o n g with a system using a portable collimator and a small gamma-sensit ive dosimeter. It was determined that while t h e camera method was feasible , the resul ts to d a t e did not provide very good resolution of posit ion, intensity, and size. The problem of calibration of the f i lm for u s e in radiation f ie lds of unknown energy appeared difficult. However, the t i m e required to survey an a rea would b e short, approximately Equal t o the required exposure t i m e for the film. The u s e of the collimator method would take longer to com- plete a survey, but possibly could yield bet ter resolution. T h i s method also offered the potential of giving information on the gamma-ray energy spectrum of t h e source. A s e r i e s of experiments with the coll imator was conducted to eva lua te the method, with t h e resu l t s descr ibed below.
On t h e b a s i s of t h e s e needs, a s tudy
The concept of the pinhole camera using radia-
Experiment with a 5-curie 137@s Gamma Source
A collimator w a s constructed by c a s t i n g lead in a 4-im-diam s t e e l pipe 48 in. long and providing a 1-in.-diam hole the length of thc tube. The col- limator tube was placed in a su i tab le hole in the portable sh ie ld which was posit ioned over a pit containing a S-curie I3'cs source.
Radiation measurements were made with the equipment and source arranged as shown in Fig. 2.3. The radiation source could b e raised and lowered, and the collimator tube could be moved horizontally over the source. Weasurcments were made with the source 13 f t and 15 f t 6 in. below the top of the portable shield. T h e source w a s about f /4 in. in diameter and 2 in. long and w a s enclosed in a 1-in.-diam tube 5 in. deep in the carrier.
shown in Fig. 2.4. It will b e noted that as the coll imated ion chamber was moved horizontally over the source, the radiation readings changed
T h e r e s u l t s of the radiation measurements are
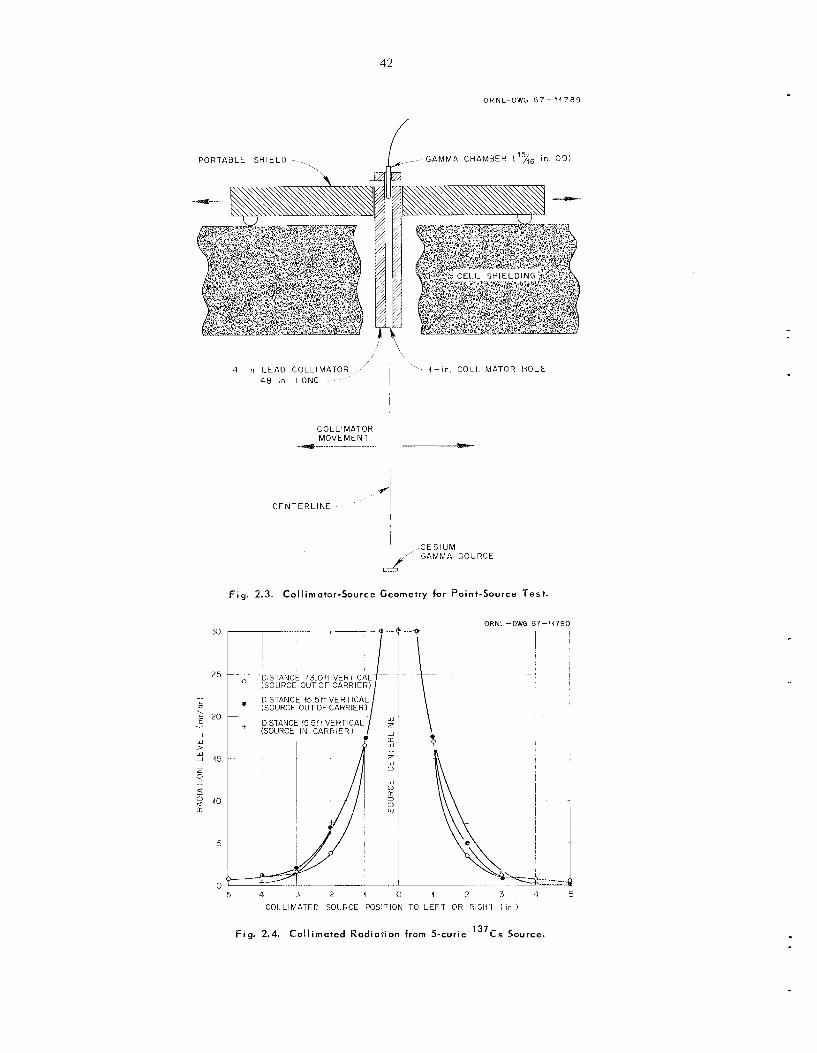
42
O R N L - D W G 6 7 - 11789
PORTABLE SHIELD GAMMLI CHAMBER ( 1 % 6 i n O D )
--e -4 ..
4 - i n L E A D COLLIMATOR 48 i n LONG 1 ‘ ~ 4 - i n COI I IMATOR HOL:
COLLIMATOR MOVEMENT --, -
C E N T E R L I N E
, C E S I U M J GAMMA SOURCE
Fig .
I 4
2.3. Collimator-Source Geometry for Point-Source Test .
O L
-
0
a
DISTANCE 13 O f t (SOURCC OUTOF CARRIER)
DISTANCE i5 5 f i VEHl lCAL (SOURCE OUTOF CARRIER)
DISTANCE 15 5 f t VERTICAL (SOURCE I N CARRIER)
5 4 3 2 1 0 i 2 3 4 5
COLLIMATED SOURCE POSITION TO L E F T OR RIGHT ( i n
Fig . 2.4. Col l imated Radiat ion from 5-curie 137C5 Saurce.
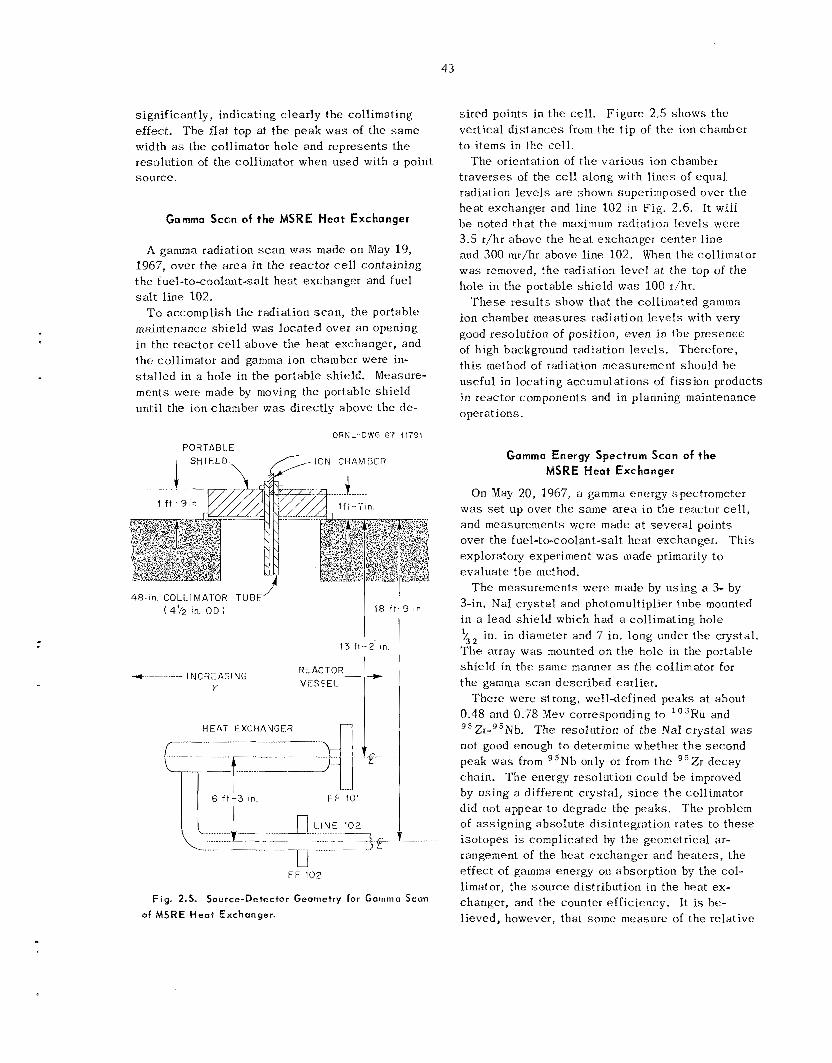
43
significantly, indicating c lear ly the collimating effect. The flat top at t he peak w a s of the s a m e width as the collimator ho le and represents t h e resolution of the collimator when used with a point source.
Gamma Scan of the MSRE Heat Exchanger
A gamma radiation s c a n w a s made on May 19, 1967, over the a r e a i n the reactor cell containing the fuel-to-coolant-salt heat exchanger and fuel salt l ine 102.
To accomplish the radiation s c a n , the portable maintenance sh ie ld was loca ted over an opening in the reactor c e l l above the heat exchanger, and the collimator and gamma ion chamber were in- s t a l l ed in a hole in the portable shield. Measure- m e n t s were made by moving the portable sh ie ld until the ion chamber w a s directly above t h e de-
OR N L- 0 WG 6 7- l I791 PORTAB1.E , [/ ION CI iAMBFi i
/ 48-in. C O L L I M A l - O R TUBE ( 4V3. in. O D )
-.) ~~ - - INCREASING Y
I 18 i t -9 i n
I 13 ft-2 in. 1
HEAT EXCHANGER
6 f t - 3 in. FF 101
FF 102
Fig. 2.5. Source-Detector Geometry for Gamma Scan
of MSRE H e a t Exchanger.
sired points in the cell . vertical d i s t ances from the t i p of the ion chamber to i tems in the cell .
The orientation of t h e various ion chamber t raverses of the ce l l along with l i nes of equa l radiation leve ls are shown superimposed over t h e hea t exchanger and l ine 102 in Fig. 2.6. It wilI b e noted tha t the maximum radiation leve ls were 3.5 r/hr above the hea t exchanger center l ine and 300 mr/hr above l ine 102. When the collimator was removed, t he radiation leve l a t the top of the hole in the portable sh ie ld was 100 r/hr.
T h e s e resu l t s show that t he collimated gamma ion chamber measures radiation leve ls with very good resolution of posit ion, even in the presence of high background radiation levels. Therefore, t h i s method of radiation measurement should b e useful in loca t ing accumula t io t~s of fission products i n reactor components and in planning maintenance operations.
F igure 2.5 shows t h e
Gamma Energy Spectrum Scan of the MSRE Heat Exchanger
On May 20, 1967, a gamma energy spectrometer w a s set up over t he same a rea in the reactor ce l l , and measurements were made a t s eve ra l points over the fuel-to-coolant-salt heat exchanger. exploratory experiment w a s made primarily to eva lua te the method.
T h e measurements were made by us ing a 3- by 3-in, NaI c rys ta l and photomultiplier tube mounted in a lead sh ie ld which had a collimating hole '/32 in. in diameter and 7 in. long under the crystal. T h e array w a s mounted on the hole in the portable sh ie ld in the s a m e manner as the collimator for t h e gamma s c a n descr ibed earlier.
0.48 and 0.78 Mev corresponding to I o 3 R u and "Zr-95Nb. The resolution of the NaI c rys t a l was not good enough to determine whether t h e second peak w a s from g 5 N b only or from t h e "Zr decay chain. T h e energy resolution could b e improved by using a different crystal , s i n c e t h e collimator did not appear t o degrade the peaks. T h e problem of ass igning absolu te disintegration r a t e s to t h e s e i so topes is complicated by the geometrical ar- rangement of the heat exchanger and hea ters , i he e f fec t of g a m m a energy on absorption by t h e col- limator, the source distribution in the heat ex- changer, and the counter efficiency. It i s be- l ieved, however, that some measure of t h e re la t ive
Th i s
There were strong, well-defined peaks a t about
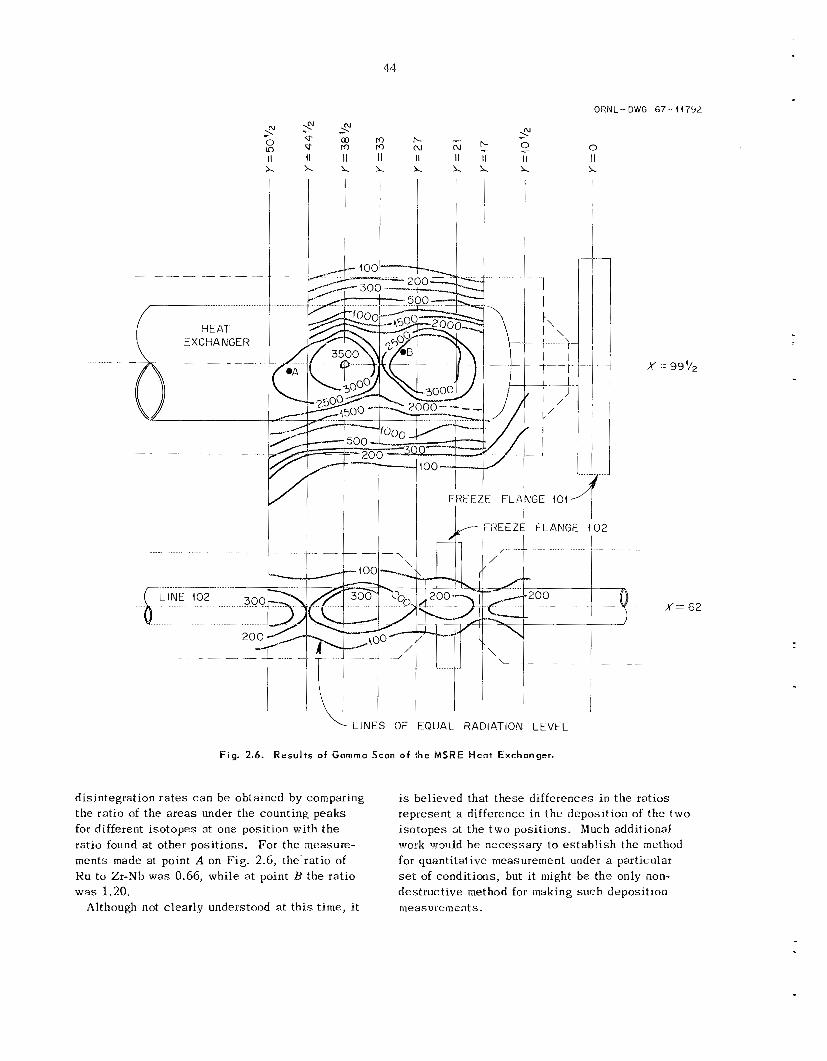
ORNL-DWG 67-44792
.- 0 In II 1
( HEAT EXCHANGER
0 I1 1
x 99'/,
FREEZE FLANGE 402 I 1
x= 62
'-. LINES OF EQUAL RADIATION LEVEL
Fig. 2.6. R e s u l t s of Gamma Scan of h e MSRE Heat Exchanger.
disintegration r a t e s c a n be obtained by comparing the ratio of t he a reas under the counting peaks for different i so topes at one position with the ratio found a t other posit ions. For the measure- ments made at point A on Fig. 2.6, the 'ratio of Ru to Zr-Nh was 0.66, while a t point B the ra t io w a s 1.20.
Although not clearly understood at t h i s t ime, i t
is believed that t hese differences i n t h e ratios represent a difference in the deposit ion of the two i so topes at the t w o posit ions. Much additional work would h e necessary to e s t ab l i sh the method for quantitative measurement under a particular s e t of conditions, but i t might be the only non- destructive method for making such deposit ion measurements.
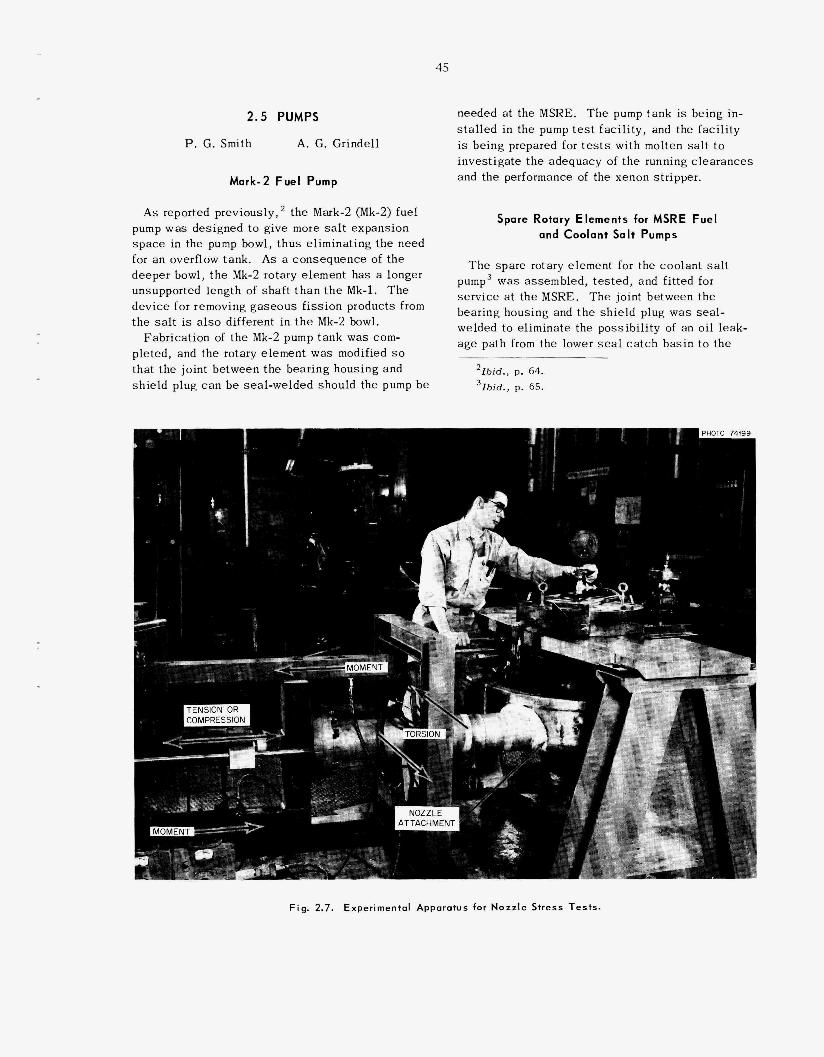
45
2.5 PUMPS
P. G. Smith A. G. Grindell
Mark-2 Fuel Pump
As reported previously, the Mark-2 (Mk-2) fuel pump was designed to give more salt expansion s p a c e in the pump bowl, thus eliminating the need for a n overflow tank. As a consequence of the deeper bowl, t h e Mk-2 rotary element has a longer unsupported length of shaf t t h a n t h e Mk-1. The device for removing gaseous f i ss ion products f rom the s a l t is a l s o different in t h e Mk-2 bowl.
Fabrication of the Mk-2 pump tank was com- pleted, and the rotary element was modified so that the joint between the bearing housing and shield plug can be seal-welded should the pump be
needed at the MSRE. T h e pump tank is being in- s ta l led in the pump t e s t faci l i ty , and the faci l i ty is being prepared for t e s t s with molten sa l t to invest igate the adequacy of t h e running c learances and the performance of the xenon stripper.
Spare Rotary Elements for MSRE Fuel and Coolant Salt Pumps
T h e spare rotary element for the coolant s a l t pump3 w a s assembled, tes ted , and fitted for se rv ice at the MSRE. The joint between the bearing housing and t h e shield plug was sea l - welded to eliminate the possibi l i ty of an oil leak- a g e path f rom the lower s e a l ca tch basin to the
'Ibid. , p. 64. 3Zbid., p. 65.
1 s i
NOZZLE ~
Fig. 2.7. Experimental Apparatus for N o z z l e Stress Tests .
46
pump tank. It is now available, a long with a spa re fue l pump rotary element, for s e rv i ce in the MSRE. intended service.
conditions. Based on our present knowledge, t h e nozzle attachment appears t o b e adequate for t h e
Stress Tests of Pump Tank Discharge Nozzle Attachment
T h e s t r e s s t e s t s of the d ischarge nozzle on the Mk-1 prototype pump tank3 were completed, and the tank assembly w a s transferred t o the Metals and Ceramics Division for examination. A photo- graph of the experimental apparatus is shown in Fig. 2.7. Strain da ta were obtained under a pres- s u r e of 50 p s i i n the tank and a moment of 48,000 in.-lb applied to the nozzle. T h e measured s t r a ins were converted into s t r e s s e s by use of conventional relationships. For comparison, t h e s t r e s s e s were ca lcu la ted by means of t he CERL- I1 code, which is written for a nozz le attached
MSRE Oil Pumps
Two oi l pumps were removed from se rv ice a t t h e MSRE, one b e c a u s e of e x c e s s i v e vibration and the other because of an e lec t r ica l short i n t he motor winding. T h e one with e x c e s s i v e vibration had one of two balancing d i s k s loose on the shaf t . T h e loose d isk w a s reattached, and the rotor, in- cluding shaft assembly and impeller, was dy- namically balanced. T h i s pump h a s been reas- sembled, h a s circulated oil up t o 145OF, and is ready for s e rv i ce a t the MSRE. T h e pump with t h e shorted motor winding h a s been rewound, reas- sembled, and is circulating oil.
radially to a spher ica l she l l . The ac tua l configura- tion is a nonradial nozzle a t tached to a cylindri- cal she l l near t he junction of the she l l t o a formed head. The computer code underestimated t h e ex- perimentally measured pressure s t r e s s e s by a factor of about 4.6 and overestimated the moment s t r e s s e s by about 3.5 times. When the s t r e s s e s a re combined, the code-calculated s t r e s s e s a r e higher than the measured s t r e s s e s for t h e test
Oil Pump Endurance Test
T h e oil pump endurance t e s t 4 w a s continued, and the pump h a s now run for 35,766 hr, circulat- ing oil at 160°F and 70 gpm.
41bid., p. 66.
..
3. Instruments and Controls
L C . Oakes
3.1 MSRE OPERATING EXPE RI ENCE
C. E. Mathews J . L. Redford R. W. Tucker
Instrumentation and control sys t ems continued to perform their intended functions. Component fail- u t e s did not compromise safe ty nor c a u s e e x c e s s i v e inconvenience in t h e reactor operation. A moderate amount of ma in tmance w a s required, as descr ibed in the s e c t i o n s tha t follow.
Control S y s t e m C o m p o n e n t s
T h e 48-v dc relays continued to suffer damage because of heat developed in t h e resistors built into the operating c o i l c i rcu i t s . Because of t h i s problem, redesigned r e l a y s had been procured and s o m e had been instal led. After severa l months, some of these a l s o showed s i g n s of detenoration Therefore, following run 11, all 139 r e l a y s operat- ing from the 48-v d c system were modified by r e - placing t h e bmlt-in res i s tors with externally mounted resis tors . T h i s w a s done with t h e relays in p lace , without disconnect ing control c i rcul t wiring, thus avoiding t h e possibi l i ty of wiring mistakes inherent in relay replacement. N o trouble was experienced after the modificatlon.
Component fa i lures were as follows. T h e coil in a solenoid valve for t h e main blower 3 backflow damper developed an open circuit. T h e fine-position synchro on rod drive 2 developed an open circui t in the s ta tor winding and w a s replaced at the shutdown in May. The fue l overflow tank level transmitter was replaced af ter a ground developed in t h e feed- back motor. The ground was subsequently found
'MSR Program Semiann. Progr. Rept. Feb. 28, 19G7, ORNL-4119, p. 71.
and corrected. The span and zero se t t ings of t h e differential pressure transmitter (PdT-556) acmss the main charcoal b e d s shif ted drastically. Al- though the pressure capabi l i ty had never been ex- ceeded, t h e diaphragm had apparently suffered damage. Thus, when a new transmitter w a s in- s ta l led in June, hand va lves were ins ta l led in the l i n e s connecting to t h e off-gas system to b e used in protecting against unusual pressures during system operat ions. The 1-kw 48-v-dc-to-120-v-ac inverter, which suppl ics ac power to o n e of the three safe ty channels , fa i led during switching of the 48-v dc supply. I t w a s repaired by replactrnent of two power t ransis tors . Only one thermocouple (YE-FP-10B) failed due to an open circui t . (See p. 22 for d i scuss ion of thermocouple performance.) Water was admitted t o t h e s t e a m dame on fuel drain tank 1 on severa l occas ions before t h e c a u s e was found to b e an intermittent faul t i n a control module. A freeze-flange temperature control module failed because of e x c e s s i v e condenser leakage. At t h e next shutdown, a l l s i m i l a r condensers were checked, and 33 were replaced b e c a u s e of leakage.
Nuclear Instruments
Four of t h e eight neutron chambers had to be replaced. The f iss ion chamber for wide-range counting channel 1 w a s replaced b e c a u s e of a short circuit from thc high-voltage lead to ground. T h e f i ss ion chamber for wide-range counting channel 2 was replaced after moisture penetrated t h e protec- t ive cover on t h e cable . Moistute Leakage into the cable to the BF, chamber required t h a t the cable and chamber be replaced. T h e output of the ion. chamber in safe ty channel 2 decreased drast ical ly during a nonoperating period, and t h e chamber was replaced prior to resumption of operatlons. T h e
47
48
trouble proved t o b e a failure in a g l a s s s e a l t ha t allowed water t o en ter t h e magnesia insulation in the cable , which i s an integral part of t h e chamber.
Safety System
A period safe ty amplifier failed when lightning struck t h e power l i ne to t h e reactor s i t e , and a replacement amplifier fa i led as i t was being in- s ta l led . The field-effect t rans is tor in th i s t ype of amplifier i s suscep t ib l e to damage by transient voltages, and i t w a s found that under some condi- t ions, damaging t rans ien ts could b e produced when the amplifier is removed f rom or inser ted into t h e sys tem. A protective c i rcu i t was designed, tes ted , and ins ta l led 011 t h e spare unit; in t h e interim, a different and more s t ab le field-effect transistor was ins ta l led . T h e module replacement procedure h a s been modified to reduce the possibil i ty of damage incurred on installation of t h e module.
Experience a t other s i t e s with t h e type of flux safe ty amplifiers u s e d in t h e MSKE had shown that t he input transistor could b e damaged, caus ing erroneous readings, i f t h e input s igna l became too large too rapidly. Therefore, a protective network of a res i s tor and two d iodes w a s added t o t h e input circuit nf each of t h e s e amplifiers.
Two relays in t h e safe ty relay matrices failed, both with open coil c i rcu i t s . A chattering contac t on the fuel pump m o t o r current relay caused safe ty channel 2 to tr ip severa l t imes before t h e problem was overcome by paralleling two contac ts on the same relay. A defective swi tch on t h e core outlet temperature a l so caused seve ra l channel t r ips and one reactor s c r a m before t h e trouble was identified and the switch was rep laced
Four rod scrams, a l l spurious, occurred during operation in t h e report period. Two were caused by general power fa i lures during e lec t r ica l storms. Ancther occurred during a routine t e s t of t h e safe ty system when a n operator acc identa l ly failed to r e se t a tr ipped channel before tripping a second channel. 1 h e o ther scram, a l s o during a routine t e s t , came when a spurious s igna l from t h e switch on t h e core outlet temperature tripped a channel while another channel was tripped by t h e t e s t .
: ?
TWBL SYSTEM DES3GN
P. G. Herndon A s experience showed t h e need or desirabil i ty of
more information for t h e operators, improved per-
formance, o r increased protection, t h e instrumenta- tion and controls sys t ems were modified or added to. During t h e report period there were 25 design change reques ts directly involving instruments or controls. Six of t h e s e required only changes in p rocess swi tch operating s e t points. Fourteeri reques ts resulted in changes in instruments o r controls, one was cance led , and t h e remaining four were not completed. T h e more important changes a re described below.
T h e s ingle T32-v d c power supply formerly sew- ing t h e nuclear s a fe ty and controls instrumentation was replaced with three independent power supp l i e s , one for each safe ty channel. Each obta ins +32-v d c from 110-v ac , but t h e ac power sou rces arc dif- ferent. One is the normal building ac system. Another is 110-v ac from a 50-kw s t a t i c inverter powered by t h e 250-v d c sys tem. T h e third comes from a 1-kw inverter operating on t h e 48-v d c s y s - tem. Thus continuity of control circuit operation is ensured in t h e event of a s ing le power supply or power source failure. It also increased the re- l iabil i ty of t h e protection afforded by the safe ty system by ruling out the possibil i ty that malfunc- tion of a s ingle voltage-regulating circuit could compromise more than one channel. (Before t h e change, on one occas ion , a failure in part of t h e regulating circuit caused i t s voltage output t o in- c r ease from 32 t o SO v, and only a second regulator in se r i e s prevented th i s i nc rease from being im- posed on a l l t he safe ty circuits.)
To prevent t h e reactor from dropping out of the “Run” control mode when a s ing le nuclear sa fe ty channel i s de-energized, t h e “nuclear s a g bypass” interlocks were changed from three series-connected contac ts to a two-of-three matrix.
Ci rcu i t s were ins ta l led to annunciate loss of power to the control rod drive c i rcu i t s . minds the operator that h e cannot imrnediately r e - turn to power simply by manually withdrawing t h e rods after t h e controls have dropped out of t h e “Run” inode.
A wiring error in a safe ty circuit was discovered and corrected. Interlocks had recently been added in t h e “load scram” channels to drop t h e load wheri t he control rods scram. A wiring design error r e - su l ted in t h e s e interlocks being bypassed by a safe ty jumper. Although t h e c i rcu i t s were wired th i s way for a t h e before being discovered, t h e s c r a m interlocks were a lways operative during power operation, s i n c e t h e reactor cannot go into the “Operate” mode when any safe ty jumper is inserted.
Th i s re-
T h e rate-of-fill interlocks, including the pneu- matic instrument components i n t h e drain-tank weighing system, were removed from the control circuits for the fuel drain tank helium supply valve. Experience had shown tha t t h e s e interlocks, in- tended t o limit the ra te a t which fuel could b e transferred to t h e core , were not required, s i n c e physical restrictions in the helium supply posi- tively prevent fi l l ing a s fast as t h e design s e t point on the interlock.
Four new photoengraved graphic pane ls incorpo- rating recent circuit changes were ins ta l led on the control and safe ty circuit jumper board. The main control board graphics were a l so revised to show changes in the fuel off-gas system.
Test circuits were originally provided to check the operability of electronic safe ty instruments on fuel loop pressure and overflow tank level. These were revised t o m a k e it poss ib le t o observe t h e va lue of t he t e s t s igna l current a t which the re- l ays operate.
ment on the upper seal g a s flow from the coolant The measuring range of the matrix-type flow ele-
pump w a s increased from 5 to 12 l i t e r d h r . This w a s to keep t h e instrument 011 s c a l e a t pump bowl pressures higher than originally anticipated. A new capillary flow element was designed to replace t h e element tha t measures the reactor cell evacuation rate, raising the range from 1 to 4 liters/min.
To avoid reducing the reactor system helium supply pressure below t h e minimum limit when large quantit ies of helium are required for fuel processing, t he fuel processing system helium supply l i ne w a s removed from the 40-psig supply header and reconnected upstream to t h e 250-psig main supply header. P re s su re regu la t ing instru- ments were ins ta l led .
To provide more information to the operator, 20 additional pairs of thrrmocoiiple lead wires were ins ta l led between t h e vent house and t h e da t a logger. Connections at t h e patch panel were made available by removing unused lead wires from some radiator thermocouples. A new conduit €or t h e s e lead wires was also ins ta l led between t h e vent house and the existing cab le trough in t h e coolant drain cel.1.
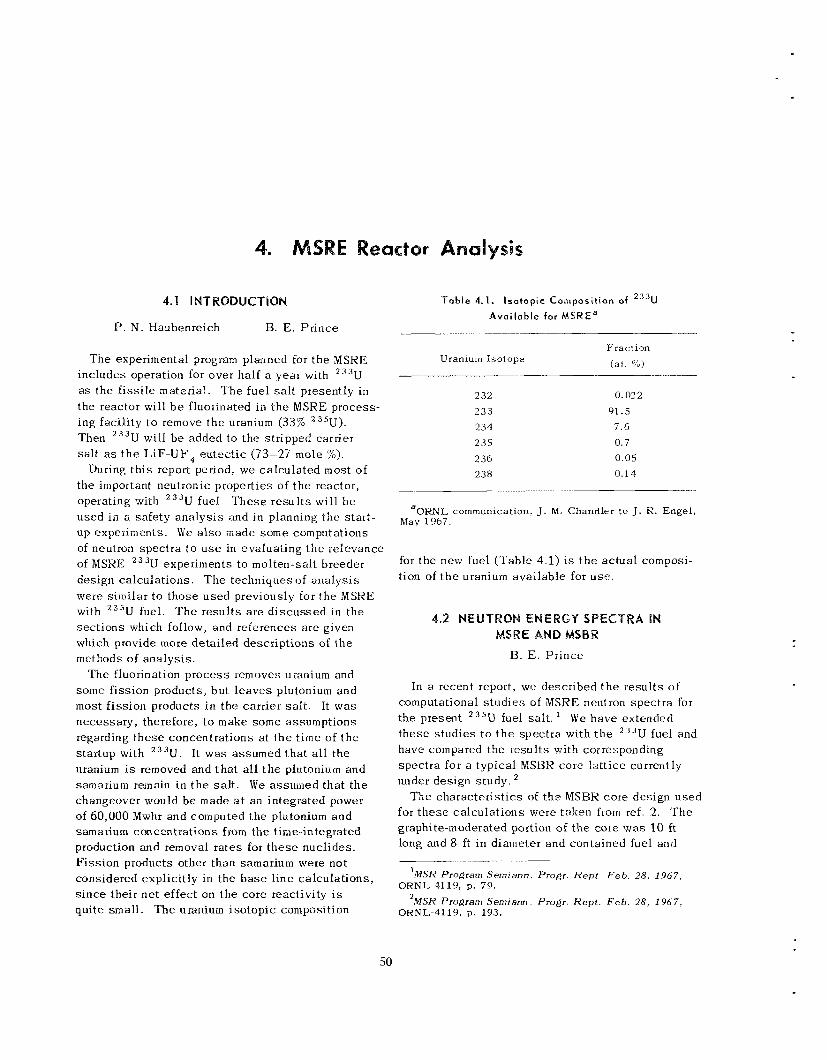
P. N . Haubenreich B. E. Pr ince
The experimental program planned for t h e MSKE includes operation for over half a year with 2 3 3 U as the f i ss i le material. 'The fue l s a l t presently in the reactor will b e fluorinated in t h e MSRE process- ing facil i ty t o remove t h e uranium (33% 35U). Then 2 3 3 U will b e added to the stripped carrier s a l t as t h e LiF-UF, eutec t ic (73-27 mole %).
the important neutronic properties of t h e reactor, operating with 2 3 3 U fue l . T h e s e r e su l t s will b e used in a safe ty ana lys i s and i n planning t h e s ta r t - up experiments. W e also made s o m e computations of neutron spec t ra t o u s e in evaluating t h e relevance of MSXE 2 3 3 U experiments to molten-salt breeder design ca lcu la t ions . T h e techniques of ana lys i s were similar t o those used previously for t h e MSRE with 2 3 5 U fuel. T h e resu l t s a r c d i scussed in the sec t ions which follow, and references a r e given which provide more de ta i led descriptions of t h e methods of ana lys i s .
T h e fluorination p rocess removes uranium and some fission products, but l e a v e s plutonium and most f i ss ion products i n the carrier s a l t . It was necessary , therefore, to make some assumptions regarding t h e s e concentrations a t t h e t ime of t h e s ta r tup with 2 3 3 U . It was assumed t h a t all t he uranium i s removed and tha t all t h e plutoniiim and samarium remain i n t h e sa l t . We assumed tha t t h e changeover would b e made a t an integrated power of 60,000 Mwhr and computed t h e plutonium and samarium concentrations from t h e time.-intep,rated production and removal r a t e s for t h e s e nuclides. F iss ion products other than samarium were not considered explicit ly in t h e b a s e l i n e ca lcu la t ions , s ince their ne t effect on t h e core reactivity i s quite s m a l l . T h e uranium iso topic composition
During t h i s report period, we ca lcu la ted most of
Table 4.1. I so top ic Composit ion of 233U Avai lab le for MSRE3
Fraction ( a t . % j Uraniuin Isotope
232 233 234 235 236 238
0.022 91.5
7 .6 0.7 0.05
0.14
aOKNL communication, J. M . Chandler to J . R . Engel, May 1967.
for t he new fuel ('Table 4 1) is t h e ac tua l composi- tion of t h e uranium avai lab le for u s e .
B. E. P r ince
In a recent report, we described t h e resu l t s of computational s tud ie s of MSRE neutron spec t ra for t he present 235U fuel salt. t h e s e s tud ie s t o t h e spec t ra with t h e 2 3 3 U fuel and have compared the resu l t s with corresponding spec t ra for a typical MSBR core la t t ice currently under design s tudy .
for t h e s e ca lcu la t ions were taken from ref. 2. 'The graphite-moderated portion of t h e core was 10 ft long and 8 ft in diameter and contained fuel and
W e have extended
The charac te r i s t ics of t h e MSBK core design used
' M S K Program Semiann. Progr. K e p t . Feb. 28, 1967, ORNL-4119, p. 79.
' M S R Program S e m i a m . Progr. K e p t . Feb. 28, 1967, ORNL-4119, p. 193.
50
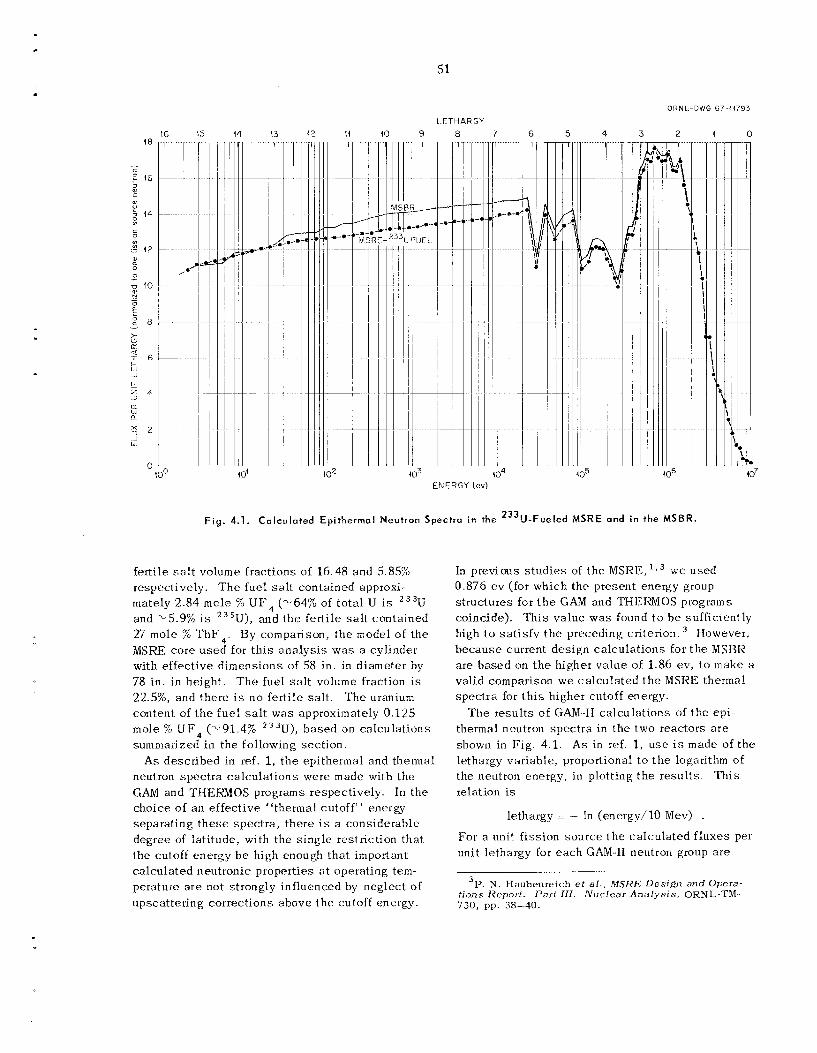
51
44 (3
ORN!.-DWG 67-14793
LLETHARGY 9 8 7 16 15 42 I 1 5 4 1 0 .I-- ' I
i ENERGY Lev)
F i y . 4.1. Calculated E p i t h e r m a l Neutron Spectra in the 233U-Fweled M S R E and in the MSBR.
In previous s t u d i e s of t h e MSRE, l S 3 w e used 0.876 ev (for which t h e present energy group s t ruc tures for t h e GAM and THEICiiOS programs coincide). This va lue w a s found t o b e sufficiently high t o sa t i s fy t h e preceding criterion. However, because current des ign ca lcu la t ions for t h e MSBR a re based on t h e higher va lue of 1.86 ev , t o make a valid comparison w e ca lcu la ted t h e MSKE thermal spec t ra for t h i s higher cutoff energy.
The resu l t s of GAM-I1 ca lcu la t ions of t h e epi- thermal neutron spec t ra in the two reactors a r e shown in F ig . 4.1 . As in ref. 1 , u s e i s made of t h e lethargy variable, proportional t o t h e logarithm of the neutron energy, in plotting t h e r e su l t s . relation i s
T h i s
lethargy : - In (energy/lO MeV) . For a unit f i s s ion source t h e ca lcu la ted f luxes per unit 1et.hargy for each GAM-I1 neutron group a re
fert i le salt volume fractions of 16 .48 and 5.85% respectively. mately 2.84 m o l e % U F 4 (-64% of to ta l IJ i s 23iU and -5.9% is 235Uj , and the fertile s a l t contained 27 mole % ThF, . By comparison, t h e model of t h e Msm core u s e d for t h i s ana lys i s w a s a cylinder with e f fec t ive dimensions of 58 in . in diameter by 78 in. in height. T h e fuel s a l t volume fraction is 2 2 3 6 , and there i s no fert i le salt. T h e uranium content of t h e fue l s a l t was approximately 0.125 m o l e "/o U F 4 (.~,91.4% 2331J), based on ca lcu la t ions summarized in the following sec t ion .
neutron spec t r a ca lcu la t ions were made with the GAM and TIIEl?MOS programs respectively. In t he choice of a n e f fec t ive "thermal cutoff" energy separa t ing t h e s e spec t r a , there is a considerable degree of lati tude, with the s ing le restriction tha t the cutoff energy b e high enough tha t important ca lcu la ted neutronic properties a t operating t e m - perature a r e not strongly influenced by neglec t of upscattering corrections above t h e cutoff energy.
T h e fuel s a l t contained approxi-
As descr ibed in ref. 1, t h e epithermal and thermal
3P. N. Haubenrelrh et a1 , M S R E , D e s l g n and Opera tions Report Part I I I Nrzcfear Analys i s , ORNL TM 730, pp. 38-40.
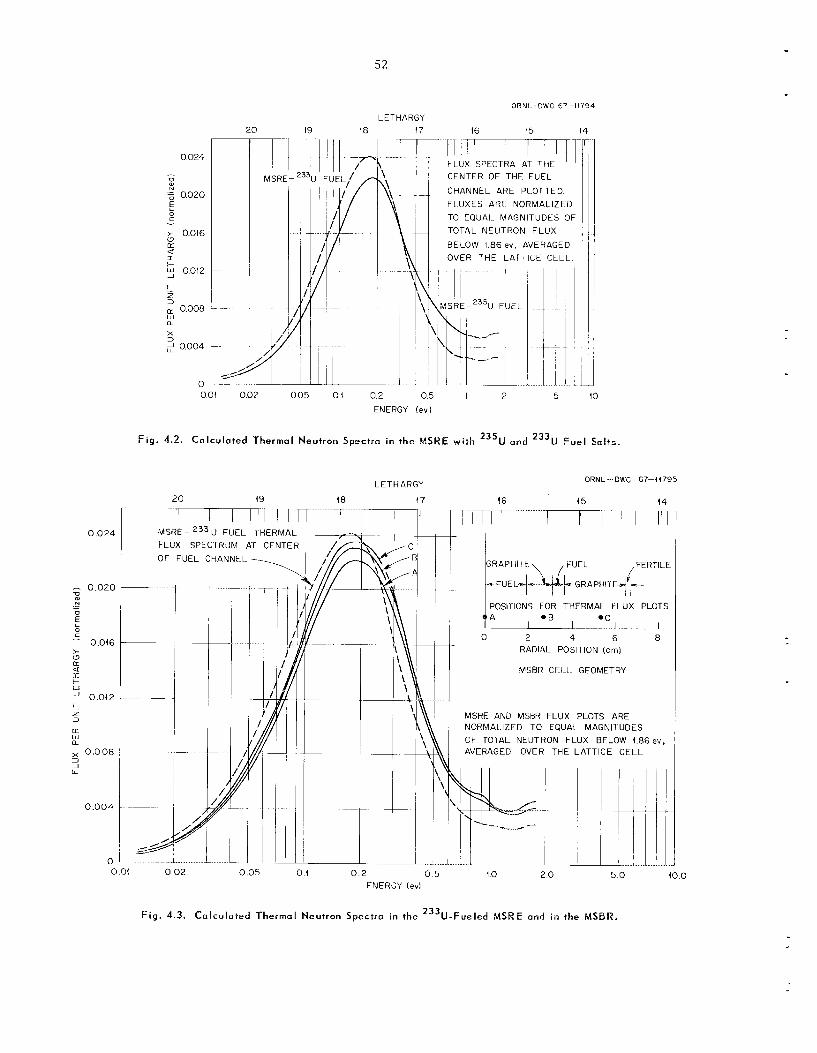
52
ORNL -DWG 67-f l994
LETHARGY 20 19 18 17 16 15 I4
0 024
I
U N
0 0020 E c 1
> 0.016
a c) n I 5 0012 'z
n 0000 7 3
w
X 3
a
2 0004
0
FLUX SPECTRA 4T THE CENTER OF THE F U E L
CHANNEL ARE P L O T T E D FL IJXES Al?F N O R M A L I Z F D TO EQUAI M A G N l T U D t S OF TOTAL NEUTRON F L U X
BELOW 186 ev, AVERAGED OVER T H E L A T i l C t C E L L
' '
I
L L 001 002 005 01 02 0 5 1 2 5 I O
ENERGY (evl
Fig. 4.2. Calculated Thermal Neutron Spectra in the MSME with 235U and 2 3 3 Y F u e l Salts..
ORNL DWC 67-ii795 L E T H A R G Y
20 19 48 17 46 45 14
II I
-
00?4 -
1 0 020 __- V N
0
c 0 c
- - E
- 0 Oi6 ~
>. (3
cc a
_I oo i2 -
1 k w
c z 3 n L L 1 a
-
x 0.008 - 3 1
LL
000.1 ~
~~
M S R E - 2 3 3 U F U E L THERMAL -L- 1 FERTILE
.C 1- 1-A 0 2 4 6 8
RADl4L POSITION (cm)
MSRR CEILL GFOMETRY
I
T t
I j! L
MSRE AND MSfiR FLUX PLOTS ARE NCRMAL.IZE0 TO EQUAL MAGNITUDES OF TOTAL NELJTRON FLUX BELOW 1.SGev, AVERAGED OVER THE LATTICE C E L L
.. I . I
0 01 0 0 2 0 05 04 0 2 0 5 i o 2 0 5.0 ENERGY (ev)
10.0
Fig . 4.3. ca lcu la ted Thermal Neutron Spectra in the 233U-Fueled MSRE and in the MSBR.
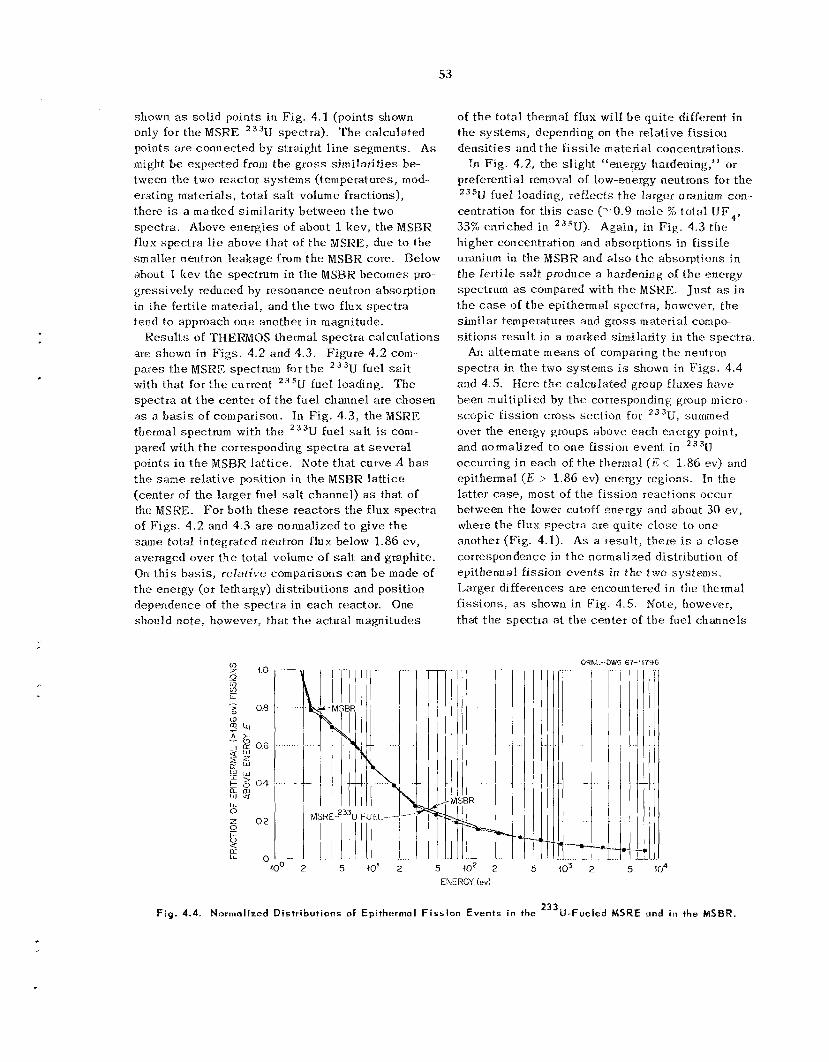
53
shown as so l id points in F ig . 4.1 (points shown only for the MSRE 3U spectra). T h e calculated points are connected by straight line segments . A s might be expected from the gross similari t ies be- tween the two reactor sys t ems (temperatures, mod- erating materials, to ta l s a l t volume fractions), there i s a marked similari ty between t h e two spec t ra . Above energ ies of about 1 kev, the NISBK flux spec t ra lie above tha t of the MSIIE, due to the smaller neutron leakage from t h e MSBR core. Below about I ltev the spectrum i n the MSRR becomes pro- gressively reduced by resonance neutron absorption i n t he fertile material, and t h e two flux spec t ra tend to approach one another in magnitude.
are shown in Figs. 4.2 and 4.3. Figure 4.2 coni- pares t h e MSRE spectrum for t h e 2 3 3 U fuel salt with that for t h e current 235U fueI loading. T h e spec t ra at t h e center of t h e fue l channel are chosen as a b a s i s of comparison. In Fig. 4.3, the MSRE thermal spectrum with the 2 3 3 ~ fuel salt is com- pared with t h e corresponding spec t ra at seve ra l points in t h e MSBR la t t ice , Note that. curve A h a s t h e s a m e relative position in the MSBR la t t ice (center of the larger fuel salt channel) as that of the MSKE. For bo1.h t h e s e reactors the flux spec t ra of Figs. 4.2 and 4.3 are nonnal ized t o give t h e same total integrated neutron flux below 1.86 ev, averaged over t h e total volume of s a l t and graphite. On t h i s bas i s , relative comparisons can b e made of t h e energy (or lethargy) dist1ibutions and position dependence of t he spec t ra in each reactor. One should note, however, that t h e ac tua l magnitudes
Result.:; of TIIEriMOS thermal spec t r a ca lcu la t ions
of t h e to ta l thermal flux wi.11 b e qui te different i n the sys tems, depending on t h e relative fission dens i t ies and t h e fissile material concentrations.
In Fig. 4.2, the sl ight “energy hardening,” or preferential removal of low-energy neutrons f o r t he 235U fuel loading, reflects t he larger uranium con- centration for t h i s c a s e (-0.9 mole % to1.A U F , , 33% enriched in 235U). Again, in F ig . 4.3 t h e higher concentration and absorptions in f i s s i l e uranium in the MSBR and a l s o t h e absorptions i n the ferti le s a l t produce a hardening of t h e energy spectrum as compared with t h e NISRI.:. J u s t us in t he c a s e of t h e epithermal spec t ra , however, t he similar temperatures and gross material compo- s i t ions result in a marked similarity i n t h e spec t ra .
An a l te rna te means of comparing t h e neutron spec t ra in the two sys t ems is shown in F igs . 4.4 and 4.5. Here the ca lcu la ted group f luxes have been multiplied by t h e corresponding group micro- scopic fission cross section for 2331J, summed over the energy groups above each energy point, and normalized t o one f i ss ion event in 2 3 3 ~
occurring i n each of the thermal (E< 1.86 ev) and epithermal ( E > 1.86 ev) energy regions. In the latter ca se , most of the f i ss ion reactions occur between the lower cutoff energy and about 30 ev , where t h e flux spec t ra are qui te c lose to one another (Fig. 4.1). As a result , there is a c lose correspondence in t h e normalized distribution of epithermal fission even t s in t h e two sys tems. Larger differences are encountered in the thermal f i ss ions , as shown in Fig. 4.5. Mote, however, that the spec t ra a t t he center of the fuel channels
’ 2 5 10‘ 2 5 io2 2
ENERGY (evl 5
ORUl.--DWG 67-11796
-7-
1G3 2
-m
5
Fig. 4.4. Normal i zed D i s t r i b u t i o n s of Epithermal F iss ion Events in t h e 233U-Fueled MSRE and in the MSBR.
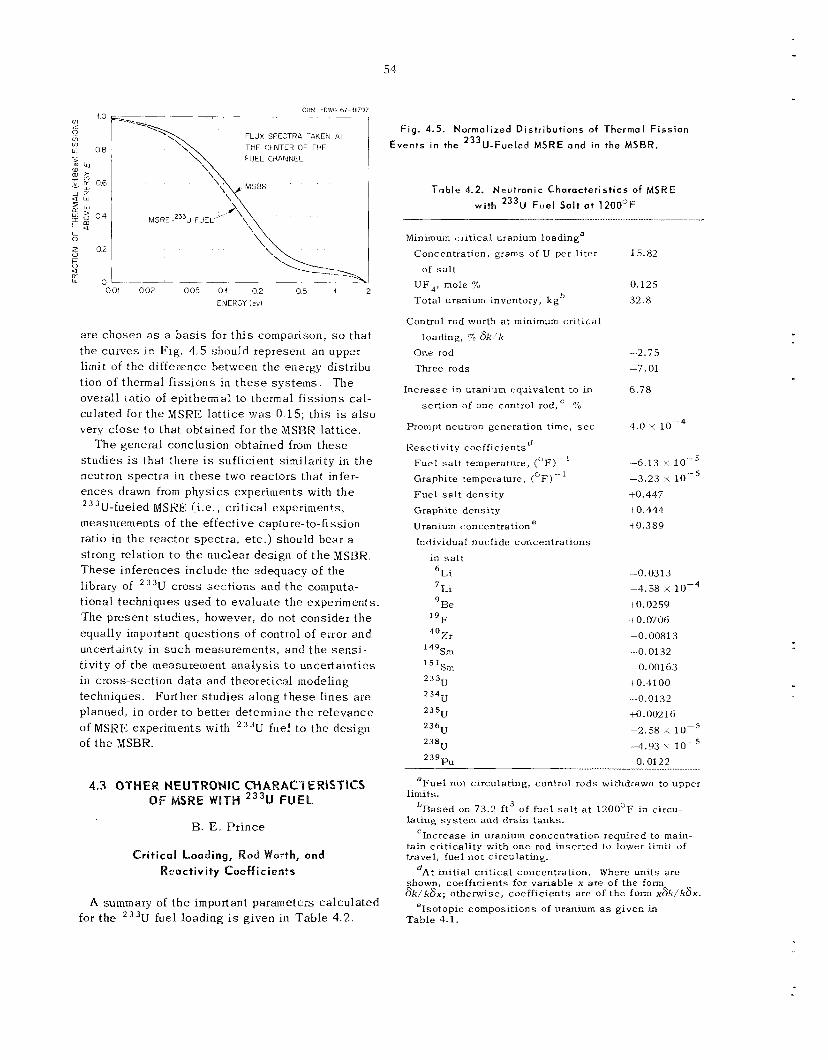
54
O W D h G 67-(1797
Fig. 4.5. Normal ized Distributions of Thermal F i s s i o n FLUX SPECTRA TAKEhI 4T THE CENTER OF THE FUEL CHbNNCL
Events in the 233U-Fueled MSRE and in the MSRR.
Table 4.2. Neutronic Character ist ics of MSRE with 2 3 3 ~ Fuel Sal t a t 1 2 0 0 0 ~
4 w
U J 5 0 4 Z m
___ I -- __ - & w
MSRE-233U FUEL' \
Minimum I i i t ical uranium loadinga 4
ILL 0
Concentratlon, grams of U per liter 15.82 2 0 2 0
: oI--___-p-- 001 002 005 O i 0 2 0 5 .I 2 UF4, mole Yo 0.125 of s a l t u
Lz
E N E R G Y l e v ) Total uranium inventory, kgb 32.8
a re chosen a s a b a s i s for t h i s comparison, so tha t the curves in Fig. 1.5 should represent an upper limit of the difference between the energy distribu- tion of thermal f i s s ions in t h e s e sys tems. overall ratio of epithermal to thermal f i ss ions ca l - culated for t h e MSRE la t t ice w a s 0.15; th i s i s a l so very c lose to that obtained for t h e MSBR la t t ice .
T h e general conclusion obtained from these s tud ies i s that there i s sufficient similarity in t h e neutron spec t ra in t h e s e two reactors tha t infea- ences drawn from phys ics experiments with t h e 233U-fueled MSKE (i.e., c r i t i ca l experiments, measurements of t h e effective capture-to-fission ratio in the reactor spectra, e t c . ) should bear a strong relation t o the nuclear design of t h e MSBK. T h e s e inferences include the adequacy of the library of 2 3 3 U c ross sections and the computa- t ional techniques used to eva lua te the experiments. The present stuc'ies, however, do not consider t h e equally important ques t ions of control of e x o r and uncertainty i n s u c h measurements, and t h e s e n s i - tivity of the measurement ana lys i s to uncertainties in cross-section da ta and theoretical modeling techniques. Further s tud ie s along t h e s e l i nes a re planned, in order to better deteiinirie t h e relevance of MSKE: experiments with 2 3 3 U fuel to the design of t h e MSBR.
The
Control rod worth a t minimum crit ical loading, Yo 8 k : k
One rod 'Three rods
Increase in uranium equivalent to in- sert ion of one control rod, ' ?&
Prompt neutron generation time, s e c
Reactivity coefficients Fuel s a l t temperature, (OF)-
Graphite temperature, ( O F ) - - '
Fue l s a l t density Graphite density Uranium concentration e Individual nuclide conceiitrations
in s a l t Li Li
1 g F
40%*
1 4 9 s m
l s ' S m
Be
2 3 3 u
234-u
2 3 5 u
236u
23SU
23gPu
-2.75 -7.01
6.78
4.0 x
-6.13 X
-3.23 +0.417 +o. 444 t 0.389
-0,0313 -4.58 x t0.0259 '0.0706
-0.008 1 3
---0.0132 -0.00163 +0.4100 -0.0132 +O .002 16 -2.58 x 1 0 c 5 4 . 9 3 x l o r 5
t 0.0122
aFuel not circulating, control rods withdrawn to upper
bBased on 73.2 ft '? of fuel s a l t a t 1200'F in circu-
'Increase in uranium concentration required to main-
limits.
lating system aut1 drain tanks.
tain cri t icali ty with one rod inserted l o lower limit d f travel, fuel not circulating.
shown, coefficients for variable x are of the foim 8 k / k 8 x ; otherwise, coefficients are of the form &k/k8x.
Table 4.1.
4.3 OTHER NEUTRONIC CHARACTEWSTICS SRE WITH 233u FUEL
B. E. P r ince
Critical Loading, React ivi ty Coefficients dAt init ial cri t ical concentration. Where units are
eIsotopic compositions nf uranium a s given in A summary of t h e important parameters ca lcu la ted for the 233U fuel loading is given in Table 4 .2 .
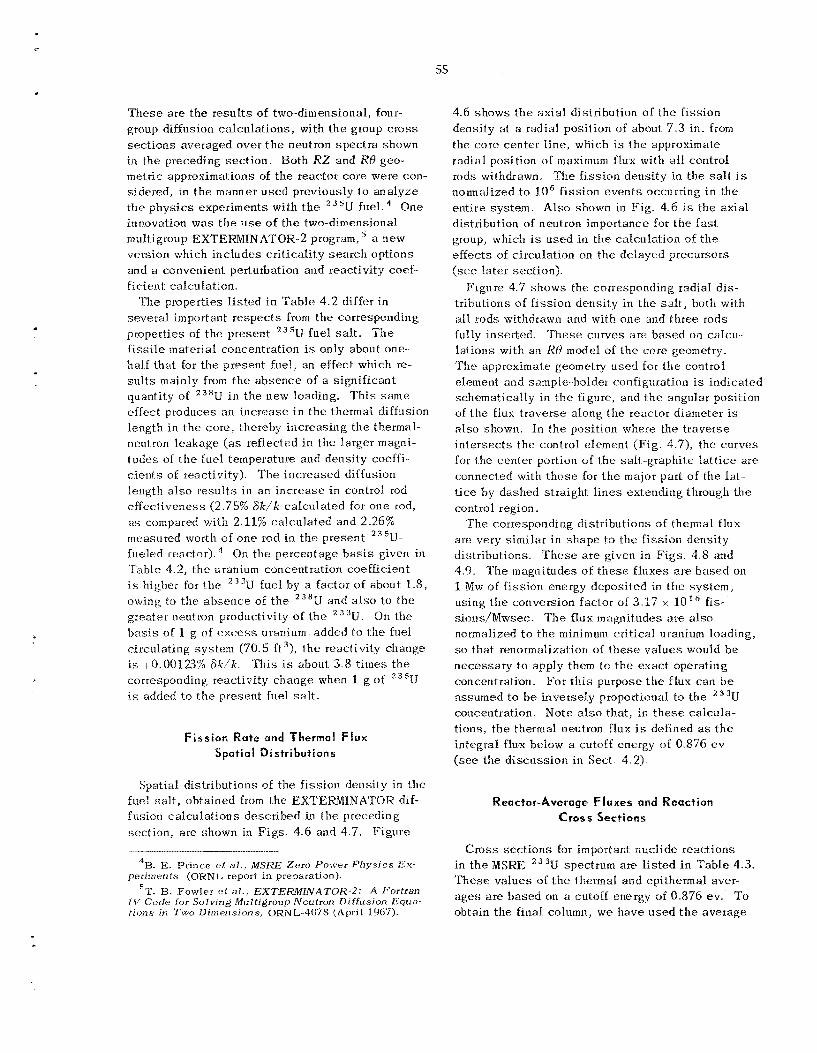
55
These are the resu l t s of two-dimensional, four- group diffusion ca lcu la t ions , with the group c ross
4.6 shows t h e axial distribution of t h e f i ss ion density a t a radial posit ion of about 7.3 in. from
~~
sec t ions averaged over t h e neutron spec t ra shown in the preceding sec t ion . Both RZ and RH geo- metric approximations of t h e reactor core were con- sidered, in the. manner used previously to ana lyze the phys ics experiments with t h e 23 'U fuel. innovation was t h e u s e of t h e two-dimensional mukigroup EXTERMINATOR-2 program, a tiew version which inc ludes cri t icali ty sea rch options and a convenient perturbation and reactivity c o d - ficient calculation.
several important respec ts from t h e corresponding properties of t he present 235U fuel salt. T h e f i s s i l e material concentration is only about- one-- half that for t h e present fuel, an effect which re- s u l t s mainly from t h e absence of a significant quantity of 238U i n t h e new loading. 'This same e f fec t produces an increase in t h e thermal diffusion length in the core , thereby increas ing t h e thermal- neutron leakage (as reflected in the larger magni- t udes of t h e fuel temperature and density coeffi- c ien ts of reactivity). length a l s o resu l t s in an increase in control rod e f fec t iveness (2.75% Sk/k ca lcu la ted for one rod, as compared with 2.11% ca lcu la ted and 2.26% measured worth of one rod in t h e present 235U- fueled reactor). On the percentage b a s i s given in Table 4.2, t he uranium concentration coefficient is higher for t h e 233U fuel by a factor of about 1.8, owing to the absence of t h e 238U and a l s o to t h e greater neutron productivity of t h e 23"U. Oil the basis of 1 g of e x c e s s uranium added to the fuel circulating system (70.5 f t '1, t he reactivity change is i-~3.U01'23w% 6,k/k. This i s about 3.8 t imes t h e corresponding reactivity change when 1 g of 2 3 5 U is added t o t h e present fuel salt.
One
The properties l.isted in Tab le 4.7. differ in
The increased diffusion
f i s s i o n Rate and Thermal Flux Spatial Distributions
the core center l ine, which is the approximate radial posi tjon u t maximum flux with all control rods withdrawn. The f i ss ion dens i ty in the salt is noimaI.ized t o IO6 f i ss ion events occurring in the entire system. A l s o shown i n Fig. 4.6 is the axial distribution of neutron importance for t he fast group, which is used in t h e calculation of t h e effects of circulation on the delayed precursors (see la te r section).
Figure 4.7 shows the cosresponding radial d i s - tributions of f i ss ion density in the salt, both with all rods withdrawn arid with one and f.hree rods fully inser ted . 'These curves are based on ca lcu- lations with an IZO model of t he core geometry. T h e approximate geometry used for the control element and sample-holder configuration i s indicated schematically in the figure, and t h e angular position of t he flux t raverse along t h e reactor diameter i s a l so shown. In the position where the t raverse in te rsec ts t he control element (F ig . 4.7), the curves for t he center portion of t h e salt-graphite la t t ice are connected with those for t he major part of the l a t - tice by dashed straight l i nes extending through the control region.
The corresponding distributions of thermal flux are very similar i n shape to the f i ss ion density distributions. T h e s e a r e given i n Figs. 4.8 :md 4.9. T h e magnitudes o f t h e s e f luxes are based on 1 Nw of f i ss ion energy deposited in t h e sys tem, using the conversion factor of 3.17 x 10 * ' fis- s.ions/Mwsec. T h e flux magnitudes a re also normalized t o the minimum critical uranium loading, so tha t renormalization of t h e s e va lues would be necessary to apply them to t h e exac t operating coiicentration. For this purpose t h e flux can b e assumed t o b e inversely proportional to the 230U concentration. Note a l s o that, in t h e s e calcula-- t ions, t he thermal neutron flux is defined as t h e integral flux below a cutoff energy o f 0.876 e v ( s e e the d iscuss ion in Sect. 4.2).
Spatial distributions of the f i ss ion density in the fuel :salt, obtained from the EXTEIZIMINATOR dif- fusion ca lcu la t ions described in the preceding wction, a re shown in F igs . 4 6 and 4 7. Figure
Reactor-Average Fluxes and Crass Sections
Cross sec t ions for important nuclidc reactions i.._._._...I_
'B. E. Prince ct a1 , MSRE Zero Power Physlcs Ex- in t h e MSKE 2 3 3U spectrum are l i s t ed in Table 4.3. T h e s e va lues of t h e thermal and epithermal aver- ages a r e based on a cuto€f energy of 0.8'96 ev. To obtain the final column, we have used t h e average
periments (ORNL report in preparation). "'T. 113. Fowler et al., EXTERMlNATOK-2: A Fortran
117 Code for Solving Miilt igrorrp Neutron Diffusion Equs- lions in Two L)irnc?risions, OKNL-4078 ( A p r i l j.967).
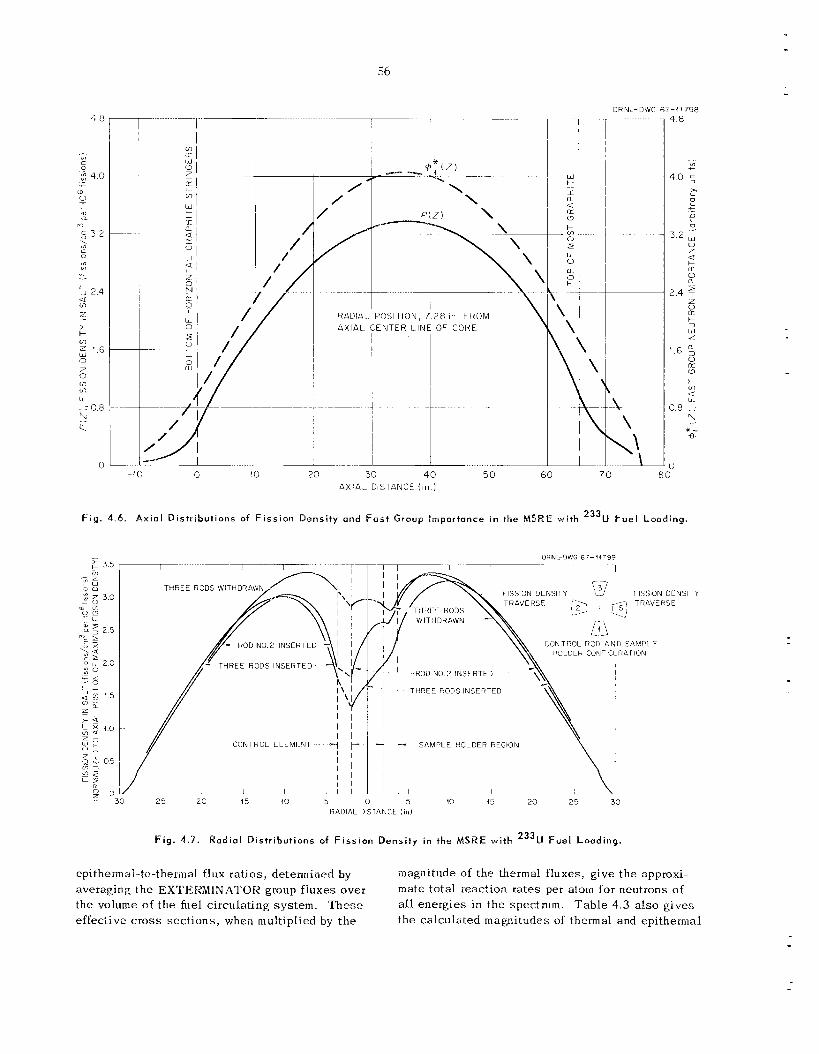
ORNL-DWG 67-44798
56
-10 0 20 30 40 5 0 60 7 0 A X I A L DISTANCE (In.)
Fig. 4.6, Axiol Distributions of F iss ion Density ond Fast Group lmportance i n the MSRE wi th 233U F u e l Looding,
- OPNL-OWG 61-11799
DENS1 T Y \\TRAVERSF /2 ,GI TRAVEKhE
2 0 15 io 5 0 5 10 ( 5 20 25 30 RADIAL 3ISTANCE ( in)
F i g . 4.7. Rodiol Distributions of F iss ion D e n s i t y in the MSRE with 2331J Fuel Looding.
epithermal-to-thermal flux ra t ios , determined by averaging t h e EX’rEI<MPNATOR group f luxes over the volume of the fuel circulating system. T h e s e effective cross sec t ions , when multiplied by t h e
magnitude of the thermal fluxes, give t h e approxi- mate to ta l reaction rates per atoll1 for neutrons of a l l energies in the spectrum. Tab le 4.3 also gives the ca lcu la ted magnitudes of thermal and epithemial
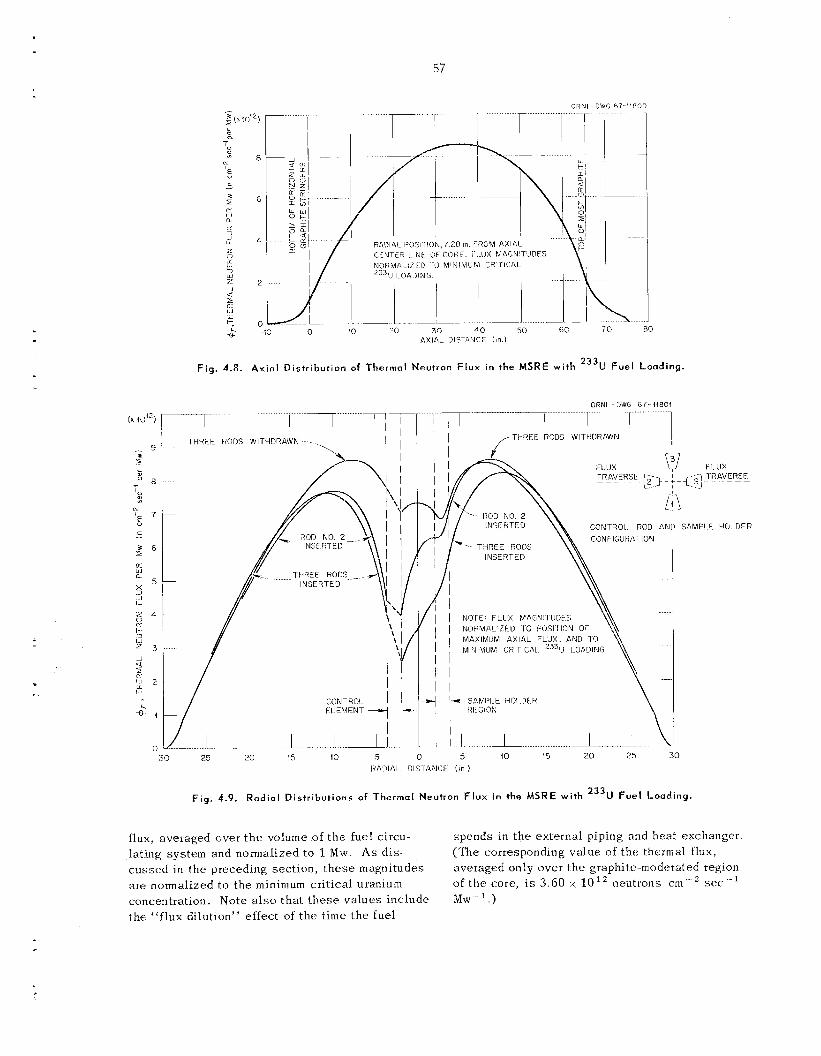
. r .
Fig. 4.8. Axio l Dis tr ibut ion of Thermal Neutron F l u x in t h e MSRE w i t h 233U F u e l Loading.
~
~
~
CONTRCL I I ELEMENT -7 i-
! i ........ I I
L...l ............. I ........ 1 ...... 1 1
........ ..........
THREE RODS WITHDRAWN -
ORNL -DWG 67--11904 ...... .... ................
I ,,- ThREE HODS !4ITI-!ORAWN
30 75 20 15 40 5 0 5 10 15 70 75 30
RADIAL D l S l ANCE ( in )
Fig. 4.9. R a d i a l D i s t r i b u t i o n s of Thermal Neutron F lux in t h e MSRE w i t h 233U Fuel Loading.
flux, averaged over t h e volume of t h e fuel circii- lating system and normalized t o 4 blw. A s d i s - cussed in t h e preceding section, t h e s e magnitudes are normalized t o t h e minimum cr i t ica l uranium concentration. Note also tha t t h e s e va lues inc lude Mw.-'.) the "flux dilution" effect of t h e t ime t h e fuel
spends i n t h e external pipirig and hea t exchanger. (The corresponding va lue of t h e thermal flux, averaged only over t h e graphite-moderated region o f t h e core, is 3.60 x lo1' neutrons c m " sec..'
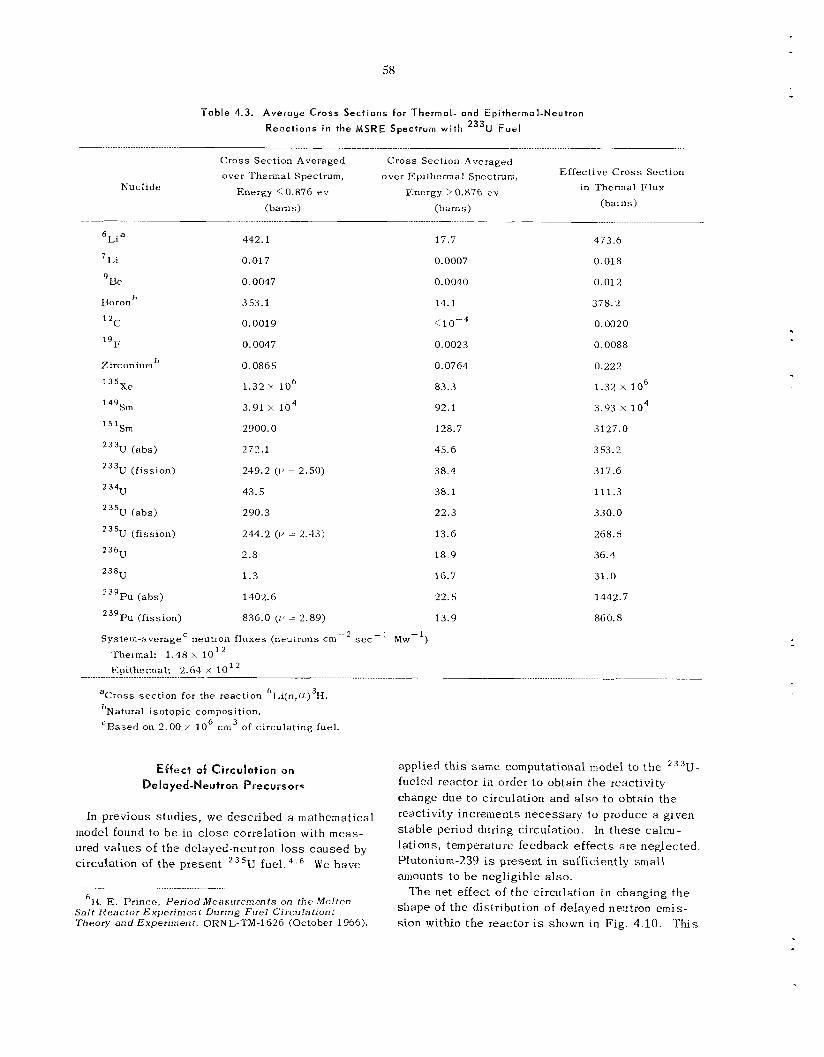
58
T a b l e 4.3. Averoge C r o s s Sections for Thermal- and Epithermol-Neutron
Reoct ions in the MSRE Spectrum w i t h 233U Furl ................. ....... -. . .................... I_-__ - -
Cross Section Averaged over Thermal Spectrum,
Energy <0.876 e v
Cross Section Averaged over Epithermal Spectrum,
Energy > 0.876 ev
Effective Cross Section in Thermal Flux
(barns) Nuclide
(barns) (barns) .................... . __ .................... .-__
6Lia 412.1 17.7 473.6
Li 0.017 0.0007 0.018
'Be 0.0047 0.0040 0.012
2C 0.0019 <lo- ' 0.0020
Boron 353.1 14.1 378.2
0.0047
Zirconium 0.0865 1 35xe
l g F
1.32 X l o 6 149%" 3.91 x l o 4 l ' l ~ m 2900.0
233U (abs) 272.1
2 3 3 ~ (fission) 249.2 (V - 2.50)
43.5 2 34u
235U (abs) 290.3
2 3 5 ~ (fission) 244.2 (11 ~ 2.43)
2.8
1.3
236u
238"
2 3 g P u ( a h ) 1402.6
2 3 9 ~ u (fission)
Systern-averagec neutron fluxes (neutrons
836.0 (1) : 2.89)
s e c - l Mw-l) Thermal: 1 .48 x l o1 ' Epithermal: 2.64 x 10'
0.0023
0.0764
83.3
92.1
128.7
45.6
38.4
38.1
22.3
13.6
18.9
16.7
22.5
13.9
0.0088
0.222
1.32 X l o 6 3.93 x 10'
3127.0
353.2
317.6
111.3
330.0
268.5
36.4
31.0
1442.7
860.8
................ ............................. ........................... ~ ____ -. ._I__.
a c r o s s sect ion for the reaction 6J2i(n,a)3H. bNatural isotopic composition. 'Rased on 2.00 x l o 6 cm3 of circulating fuel.
Effect of C i r c u l a t i o n o n
De la yed-N eu tron Prec u r s a r s
In previous s tud ies , we described a mathematical model found to b e in c l o s e correlation with rneas- ured va lues of t he delayed-neutron loss caused by circulation of t h e present 2 3 5 U W e have
~ ....................
6B. E. Prince, Per iod Measurements on the Molten Sal t Reactor Experimenf During F u e l Circulation: 7heory a n d Experiment, ORNL-'TM-1626 (October 1966).
applied t h i s s a m e computational model to t h e 2 3 3 U - fueled reactor in order t o obtain t h e reactivity change due to circulation and also to obtain the reactivity increments necessary to produce a given s tab le period during circulation. In t h e s e ca lcu- lations, temperature feedback e f f ec t s a re neglected. Plutonium-239 is present in sufficiently smal l amounts to b e negligible also.
T h e net effect of t h e circulation i n changing t h e shape of t h e distribution of delayed neutron e m i s - s ion within t h e reactor is shown in Fig. (1.10. 'This
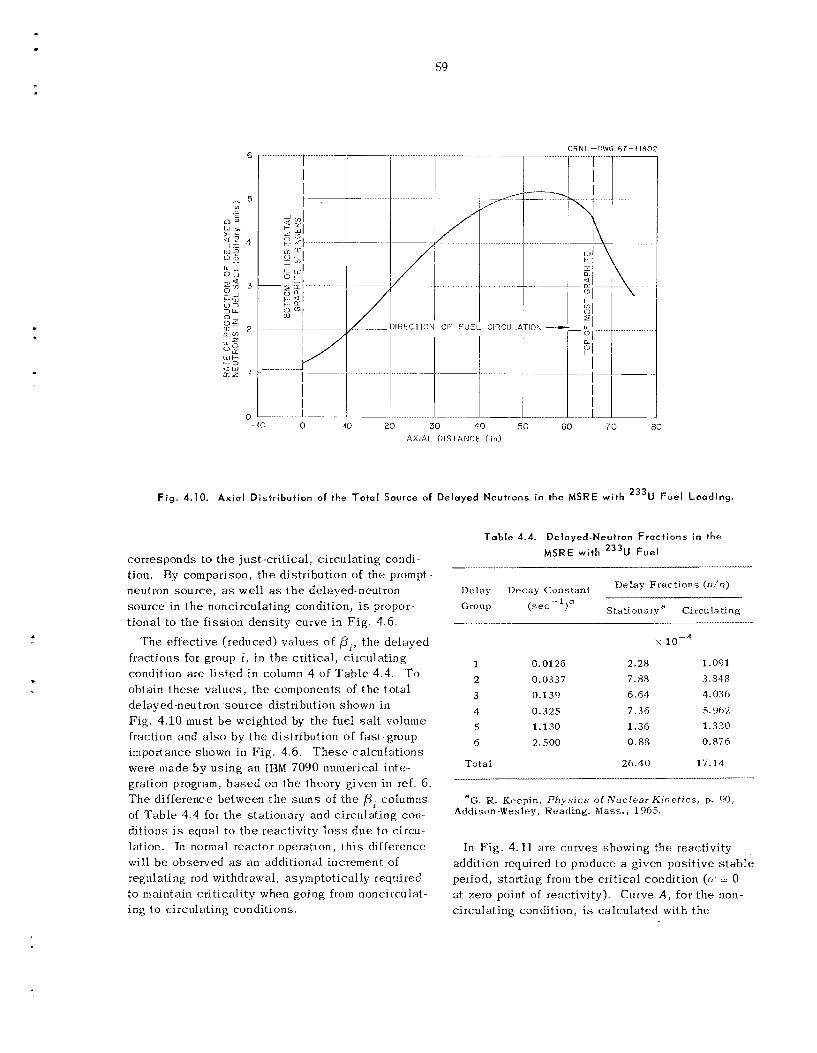
59
.
Fig. 4.10. Axia l Distr ibut ion of the Total Source af Delayed Neutrons in the MSRE wi th 233U F u e l Loading.
corresponds to t h e just-cril.ica1, circulating condi- tion. By comparison, t h e distribution of the prompt - neutron source , as wel l as t h e delayed-neutron source in t h e noncirculating condition, i s propor- t ional to t h e f i ss ion density curve in F ig . 4.6.
T h e effective (reduced) va lues of pi, t h e delayed fractions for group i, in t h e cri t ical , circulating condition are l i s t ed i n column 4 of T a b l e 4.4. To obtain t h e s e va lues , t h e components of t h e to ta l delayed-neutron source distribution shown in F ig . 4 .10 must b e weighted by the fuel salt volume fraction and a l so by t h e distribution of fast-group importance shown in Fig. 4.6. These ca lcu la t ions were made b y us ing an IHM 7090 numerical inte- gration program, based on the theory given in r e f . 6. T h e difference between t h e sums of t h e p i columns of Tab le 4 .4 for t h e stationary and circulating con- dit ions i s equal to t h e reactivity loss due to circu- lation. In normal reactor operation, t h i s difference will b e observed a s an additional increment of regulat.ing rod withdrawal, asymptotically required to maintain cri t icali ty when going from noncirculat- ing to circulating conditions.
Tuble 4.4. Delayed-Neutron Fract ions in the
MSRE with 233U Fue l
s
1 0.0126 2.28 1.091
2 0.0337 7.8.5 3.548 3 0.139 6.64 4.036
4 0 . 3 2 5 7.36 5.9b2
5 1.130 1.36 1.330
6 2.500 0.85 0.876
Total 26.40 17.14
aG. R. Keepin, Physics of Nuclear Kinet ics , p. 90, Addison-Wesley, Reading, Mass., 1965.
In F ig . 4.11 a r e curves showing the reactivity addition requited to produce a given posit ive s t ab le period, s ta r t ing from t h e c r i t i ca l condition (01 = 0 at zero point of reactivity). Curve A , for t.he non- circulating condition, is ca lcu la ted with the
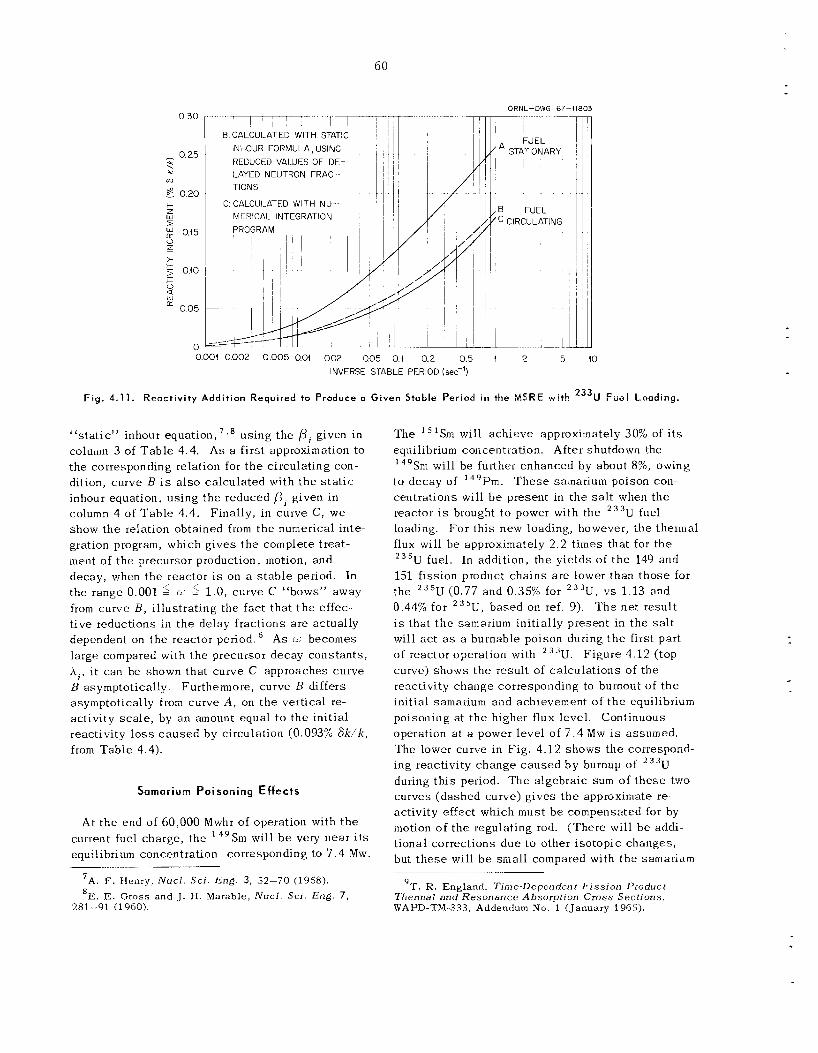
6 0
ORNL-DWG 67-11803 0 30
- 0 25 ?
E 020
-t us
+ z W 3 E 0.15
z V
> 5 010 c V
W [L a
0 05
n
I ' ; I l l ~ 1 7 B CALCULATED WITH STATIC
INHOUR FORMULA, USING RCCUCED VALUES OF DE- LAYED NEUTRON FRAC TIONS
C CALCIJILATFD WITH NU MERICAI. INTEGRATION /
/
- 0001 0002 0005 0.01 002 005 01 0.2 0 5 1 2
INVERSL STABLE PERIOD (set?)
ING
I
i 1- 1
5 40
F i g . 4.11. Reactivity Addit ion Required to Produce a Given Stable Period in the MSRE wi th 233U F u e l Loading.
"static" inhour equation, 7 s 8 us ing the ( r j l given in column 3 of Tab le 4.4. A s a first approximation to the corresponding relation for t h e circulating con- dition, curve B i s a l so ca lcu la ted with t h e s t a t i c inhour equation, using the reduced p , given in column 4 of Tab le 4 .4 . show t h e relation obtained from t h e numerical inte- gration program, which g ives t h e complete treat- ment of t he precursor production, motion, and decay, when t h e reactor i s on a s t ab le period. In t he rangc 0.001 5 0) 5 1.0, curve C "bows" away from curve B, i l lustrating the fact that t h e effec- tive reductions in t h e delay fractions are actually dependent on t h e reactor period.6 As w becomes large compared with t h e precursor decay cons tan ts , A, , i t can be shown that curve C approaches curve B asymptotically Furthermore, curve B differs asymptotically from curve A , on t h e vertical re- activity sca le , by a n amount equal to the init ial reactivity l o s s c a u s e d by circulation (0.093% 6 k / k , from Table 4.4).
Finally, in curve C, w e
Samarium Poisoning Effects
At t h e end of 60,000 Mwhr of operation with t h e current fuel charge, t he ' 49Sm will b e very near its equilibrium concentration corresponding to 7 .4 Mw. ~. . .. . . ..
7A. F. Henry, N u c l . SCI . E n g . 3, 52-70 (1958). 'E. E. Gross and J. H . Marable, N u c l S a . Eng. 7,
281-91 (1960).
The ' 'Sm will ach ieve approximately 30% of its equilibrium concentration. After shutdown the 149Sm will b e further enhanced by about 8%, owing to decay of '"Pm. T h e s e samarium poison con- centrations will be present in t h e s a l t when t h e reactor i s brought t o power with the 2 3 3 U fuel loadjng. For th i s new loading, however, t he thermal flux will b e approximately 2.2 t imes that for t h e 2 3 5 U fuel. In addition, the y ie lds of t h e 149 and 151 fission product cha ins a r e lower than those for the 2 3 5 U (0.77 and 0.35% for 2 3 3 U , v s 1.13 and 0.44% for 2 3 5 U , based on ref . 9). T h e ne t result i s that t h e samarium init ially present in t h e s a l t will a c t as a burnable poison during t h e first part of reactor operation with 2 3 3 U . Figure 4.12 (top curve) shows t h e result of ca lcu la t ions of the reactivity change corresponding to burnout of t h e init ial samarium and achievement of t h e equilibrium poisoning a t t h e higher flux level. Continuous operation a t a power leve l of 7 . 4 Mw is assumed. The lower curve in F i g . 4.12 shows t h e coirespond- ing reactivity change caused b y burnup of 2 3 3 U during t h i s period. 'The algebraic sum of t h e s e two curves (dashed curve) g ives t h e approximate re- activity effect which must b e compensated for by motion of t he regulating rod. (There will b e addi- t ional corrections due to other i so topic changes, but t h e s e will b e small compared with t h e samarium
........
'T. R. England. Time-Dependent F i s s ion Product ?'hemal a n d Resonance Absorption Cross Sections. WAPD-TM-333, Addendum No. 1 (January 1965).
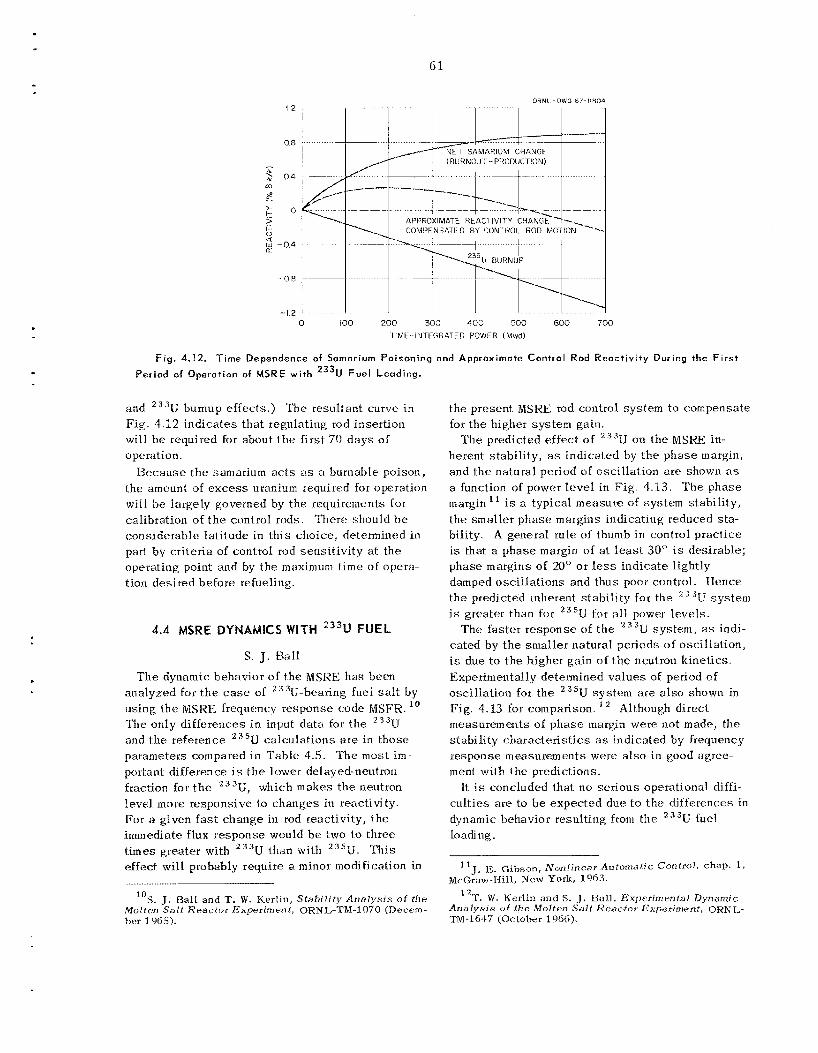
61
DRNL -DWG 67-11801 12
0.0
- $ 04
z
?
Lo
...
I- <>
;s -04 01
- 0 8
-1.2 0 100 200 300 400 500 600 700
1 IME-.iNTEGRATED PC);NER ( W w d
Fig. 4.12. Time Dependence of Samarium Poisoning and Approximate Control Rod React iv i ty During t h e F i r s t Period of Operation of MSRE with 233U Fue l Loading.
and 23R1J burnup effects.) The resultant curve i n F ig . 4.12 ind ica tes tha t regulating rod insertion will b e required for about t h e first 79 d a y s of operation.
B e c a u s e t h e samarium a c t s as a burnable poison, t h e amount of e x c e s s uranium required for operation will b e largely governed by t h e requirements for calibration of t h e control rods. There should h e cons iderable lati tude in th i s choice, determined in part by cri teria of control rod sens i t iv i ty at the operating point and by t h e maximum time O C opera-. t ion des i red before refueling.
4.4 MSRE DYNAMICS WITH 233u FUEL S . J . Ball
T h e dynamic behavior of t h e NKRE h a s been ana lyzed for t h e case of 2,"3U-bearing fuel salt by using the MSHE frequency response (:ode MSFR. The o n l y differences in input da t a for t h e 233U and t h e reference 2 3 s U ca lcu la t ions are in those parameters compared in Tab le 4.5. T h e m o s t i m - port.ant difference is t h e lower delayed-neutron fraction for t h e 233U1 which makes t h e neutron leve l mote respons ive to changes in reactivity. For a given f a s t change in rod reactivity, t h e immediate flux response would be two to three t i m e s greater with 2 3 3 U than with 235U. ?'his effect will probably require a minor modification in
' O S . J. Ball arid T. W. Krrlin, Stabi l i ty Ar infys i s o f thr Molten Sal t React3r Experiment, ORNl,-TR.I-1070 (Decem- b e r 19665).
the present MSRE rod control sys tem tu compensate for the higher sys tem gain.
T h e predicted e f fec t of 2 3 3 U on t h e MSKE in- herent s tab i l i ty , as indicated by t h e phase margin, and t h e natural period of osc i l la t ion a re shown as a function of power l eve l in F ig . 4.13. T h e phase margin l 1 i s a typical measure of sys tem stabil i ty, t he smal le t phase margins indicating reduced s ta - bility. A general rule of thumb in control prac t ice is that a phase margin of at least 30" is desirable; phase margins o f 20" or less indica te lightly damped osc i l la t ions and thus poor control. Hence t h e predicted inherent s tab i l i ty for t he "U system is greater than for 2 3 5 ~ for a11 power leve ls .
The fas te r response oE t h e 233W sys tem, as indi- ca ted by t h e smaller na tura l periods of osc i l la t ion , is due to the higher gain of t h e neutron k ine t ics . Experimentally determined va lues of period of osc i l la t ion for t h e 2 3 s U system ate also shown in Fig. 4.13 for comparison. ' measurements of p h a s e margin were not made, t he stabil i ty cha tac te r i s t ics as indicated by frequency response measurements were a l so in good agree- ment with t h e predictions.
It is concluded that no se r ious operational diffi- cu l t ies a r e to b e expec ted due to t h e differences in dynamic hehavior result ing from t h e 233U fuel loading.
Although direct
"J. E. Gibson, Nonlinear Automatic ContrOf, chap. 1,
"T. W. Kar l in and S . J. Bell, Experimentaf Dynamic Arialysis of the Mol ten Sa l t Reactor Experiment, ORNrd-
McGraw-Hill, New York, 1963.
T M - 1 6 4 7 (October 196b)-
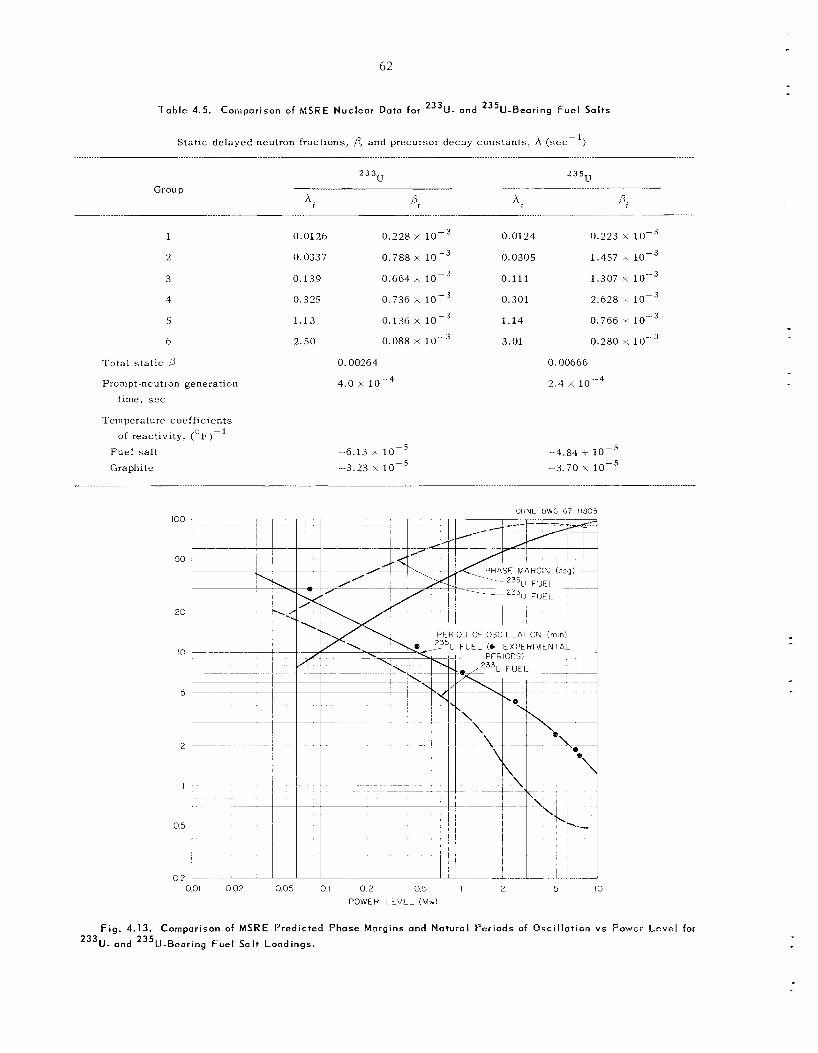
62
Table 4.5. Comparison of MSRE Nuclear Data for 233U- and 235U-Bearing Fuel Salts
Static delayed-neutron fractions, b, and precursor decay constants , (sec- ’) .......... .......... ......... ......... ..... .................. ..........
2 3 5 u ...... ...........
u 2 3 3
Group ‘i ”; A l Pi
1
2
3
4
5
6
Total s ta t ic ,3
Prompt-neutron generation time, s e c
Temperature coefficients of reactivity, (OF)- ’
Fue l salt Graphite
0.0126 0.228 x
0.0337 0.788 x l o p 3 0.139 0.664 l o p 3
0 325 0.736 x l o p 3 1.13 0.136 X
2.50 0.088 x
0.00264
4.0 Y 10
-6.13 x l o p 5 -3.23 x l o p 5
0.0124 0.223 X l o r 3
0.0305 1.457 x
0.111 1.307 x
0.301 2.628 x
1.14 0.766 x l o r 3 3.01 0.280 x l o p 3
0,00666
2.4 x
-4.84 + lo-’ -3.70 l o r 5
ORNL DWG 67 11805
0 2 0 5 POWEP LEVEL (Mw)
OOf 002 0 0 5 01 I 2 5 IO
F i g . 4.13. Comparison of MSRE Predicted Phase Margins and Natural Periods of Osci l lat ion vs Power L e v e l for
233U- and 235tJ-Bearing Fuel Salt Loadings.
Part 2. MSBR Design and Development R B. Briggs
The primary objective of the engineering design and development ac t iv i t ies of the MSR program is to d e s i g n a molten-salt breeder experiment (MSBE) and develop the components and sys tems for that reactor. The MSBE is proposed to be a model of a large power breeder reactor and t o operate a t a power leve l of about 150 M w (thermal).
A reference design of ii 1 0 0 0 - M ~ (electrical) molten-salt breeder reactor power plant is to pro- vide the b a s i s for most of the cri teria and for much of lhe design of the MSBE. W e have been spending mosi of our effort on the reference des ign . Sev- e ra l concepts were described in ORNL-4037, our progress report for the period ending August 1966, and in OKNL-3996, which w a s publ ished in August 1966. W e se lec ted the modular concept - four 250- Mw (electrical) reactors p e r 1000-Mw (electrical) s ta t ion - that h a s fissile and fert i le materials in separa te s t reams a s being the most promising for irnmediate development and have proceeded with moie detailed study of a plant based on that con- cept . Initial resu l t s of t hose s tud ie s were re- ported in ORNL-4119, our progress report for the
period ending February 1967. During this report period, we continued to examine the de ta i l s of the reference plant and i t s equipment. We also sum- marized the objectives and program for dcvelop- ment of the MSBE in OHNL-TM-1851.
activity has been concerned largely with support of the design and with planning. T h e development program was outlined in ORNL-TM-1855 and in ORN L-TRiI-1856. Salt circulation h o p s and other t e s t fac i l i t i es a re being modified for t e s t s of the sodium fluoroborate coolant s a l t , models of graph- i te fuel cells for the reactor, and molten-salt bear- ings and other c ruc ia l components of the fuel cir- culation pump, Essent ia l ly no experimental work has been done yet.
We plan to complete e s sen t i a l parts of the ref- e rence design during the next report period and to bpgin l o design the MSRE. Experimerital work will begin a l s o hut will b e limited to a Eew of the more obvious important problems. Desiyg and development on a large s c a l e are planned to s t a r t early in FY 1969.
To da te , the component and sys t ems development
5. Design E. s. Uet t i s
5.1 GENERAL
E . S . Bet t i s R. C. Robertson
The design program during the pas t period h a s primarily been directed toward refinement and modification of the previously reported concepts for the reactor and other major equipment and re - visions t o the ce l l layouts and piping.
The major effort was redesign of the reactor to accommodate the new data on radiation effects i n graphite. New approaches were tried to arrivc a t a core design which could cornpcnsate for dimen- s iona l changes in the graphite, but i t was finally decided to simply double the volume of the core to lower the power dens i ty from 40 to 20 kw/liter and thereby a s su re a s t ab le core life of a t l ea s t t e n years . It was a l s o decided to include pro- visions for replacing the complete reactor ves se l
63
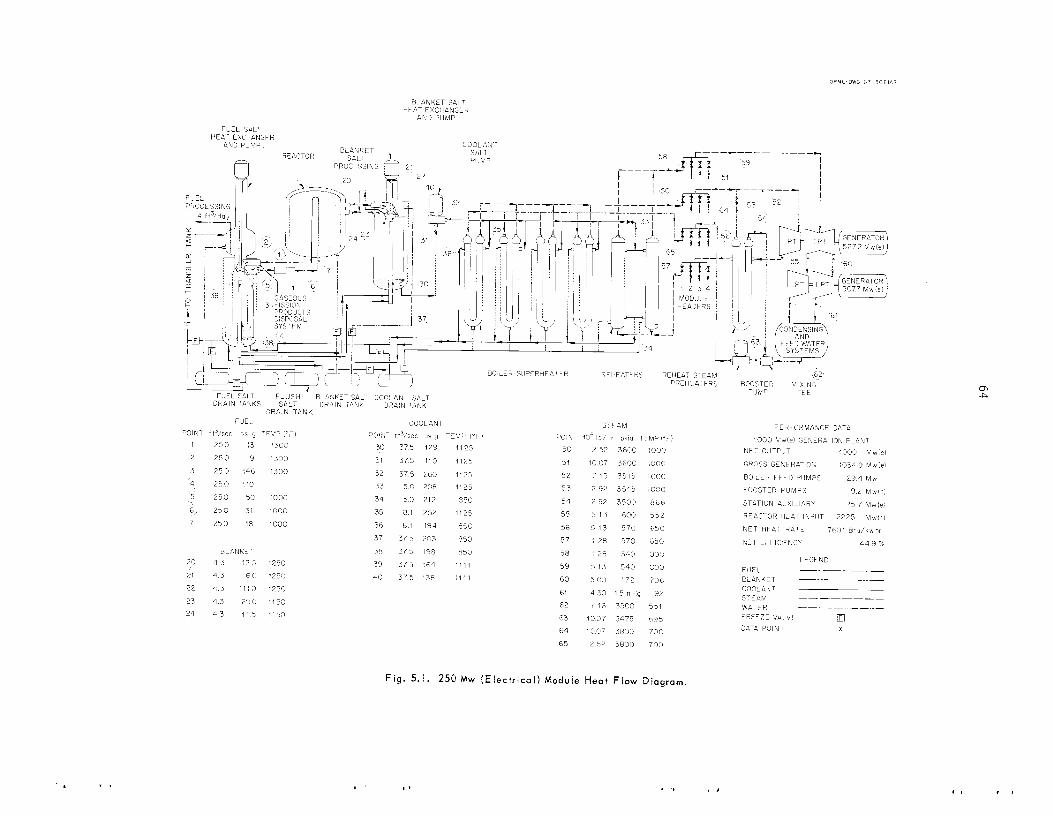
64
c
lr
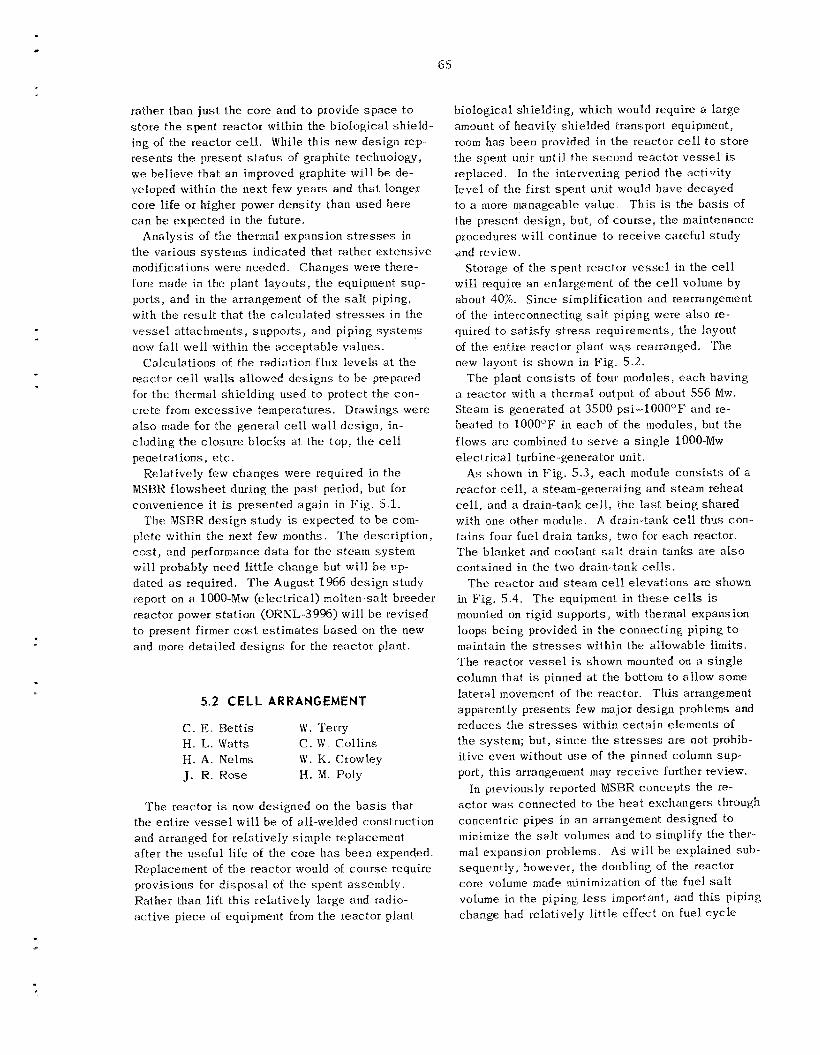
65
rather than ju s t the core and to provide s p a c e t o s tore the spent reactor within the biological sh ie ld- ing of the reactor cell. While th i s new design rep- resents the present s t a t u s of graphite technology, we be l ieve that a n improved graphite will b e de- veloped within the next few yea r s and tha t longer core l ife or higher power dens i ty than used here c a n b e expected in the future.
Analys is of the thermal expansion s t r e s s e s in the various sys t ems indicated that rather ex tens ive modifications were needed. Changes were there- fore made in the plant layouts, t he equipment sup- ports, and in the arrangement of the s a l t piping, with the resu l t t ha t the ca lcu la ted s t r e s s e s in the v e s s e l atta.chments, suppor ts , and piping sys tems now fall well within the acceptab le va lues .
Calculations of the radiation flux leve ls a t t he reactor ce l l wal l s allowed des igns to be prepared for the ihermal shielding used t o protect t he con- c re te from excess ive temperatures. Drawings were also made for the general cell wal l des ign , in- cluding the c losure blocks a t the top, t he cell penetrations, e t c .
Relatively few changes were required in the MSBH flowsheet during i.he pas t period, but for convenience it is presented aga in in F ig . 5.1.
p k t e within the next few months. T h e description, cost, and performance d a t a for the s team system will probably need l i t t l e change but will b e up- dated as required. T h e August 1966 des ign study report on a 1000-Mw (electrical) molten-salt breeder reactor power s ta t ion (ORNL-3996) will b e revised to present firmer cost estimates based on the new and more de ta i ied des igns for the reactor plant.
The MSBR des ign study is expec ted to b e com-
5.2 CELL ARRANGEMENT
C. E. Be t t i s W . 'Terry H. L. Watts €1. A. Nelms J. I?. Rose
C. W. Col l ins W. E<. Crowley 11. M. Poly
'The reactor is now des igned on the b a s i s that the en t i re v e s s e l will b e of all-welded construction and arranged for relatively s imple replacement after the useful life of the core h a s been expended Replacement of the reactor would of course require provisions for d i sposa l of the spen t assembly . Rather than lift th i s relatively large and radio- ac t ive p iece of equipment from the reactor plant
biological shielding, which would require a large amount of heavily sh ie lded transport equipment, room h a s been provided in the reactor cell to s to re the spent unit unti l the second reactor v e s s e l is replaced. In the intervening period the activity leve l of the first spen t unit would have decayed to a more manageable va lue . T h i s is the b a s i s of the present des ign , but, of course , the maintenance procedures wi l l continue to receive carefu l study and review.
Storage of the spen t reactor v e s s e l in the c e l l v r i l l require an enlargement of the c e l l volume by about 40%. Since simplification and rearrangement of the interconnecting s a l t piping were also r e - quited to sa t i s fy s t r e s s requirements, the layout of the entire reactor plant was rearranged. The new layout is shown in Fig. 5.2.
a reactor with a thermal output of about S56 Mw. Steam is generated a t 3500 psi-lOOO°F and re- heated to 1000°F in e a c h of the modules, but the flows a re combined to s e r v e a s ingle 1000-Mw elec t r ica l turbine-generator unit.
reactor ce l l , a steam-generating and s t eam reheat ce l l , and a drain-tank ce l l , t he last be ing shared with one other module. A drain-tank cell thus con- ta ins four fuel drain tanks, two for each reactor. The blanket and coolant s a l t drain tanks a re also contained in the two drain-tank cells.
T h e reactor arid s t eam c e l l e leva t ions a re shown in F ig . 5.4. T h e equipment in t h e s e cells is mounted on rigid suppor ts , with thermal expansion loops being provided in the connecting piping to maintain the s t r e s s e s within the allowable limits. T h e reactor v e s s e l is shown mounted on a s ingle column that i s pinned a t the bottom to allow some lateral movement of the reactor. This arrangement apparently presents few major des ign problems and reduces the s t r e s s e s within cer ta in e lements of the system; but, s i n c e the s t r e s s e s a re not prohib- i t ive even without u s e of t h e pinned column sup- port, t h i s arrangement rnay rece ive further review.
In previously reported MSRR concepts the re- ac tor was connected to the hea t exchangers through concentric p ipes in a n arrangement designed to minimize the s a l t volumes and t o simplify the ther- mal expansion problems. A s wil l be explained sub- sequently, however, t he doubling of the reactor core volume made minimization of the fue l s a l t volume in the piping less important, and th i s piping change had relatively l i t t le e f fec t on fue l cyc le
The plant c o n s i s t s of four modules, each having
As shown in Fig. 5.3, each module cons i s t s of a
66
O R N L - DWG 67-10640A
172 t i t i"
4 t i
3 f i 1 A
45f :
I A
4f1
148 f l
40 i t
I
3 f r 3 f t 411 4 f t 3 fi 3 f t - 2 3 t 1 6 1 n W - 2 3 f t - , - 2 3 - t 6 1 n Y t- mi - 2 3 t t 6 1 1 - y 2 O ' r - 2 3 f t 6 1 7 - - 1 110ft I
L ' 1- - I---, I- -) INSTRUMENTArION CELL r1-1 17 &A ..
........... ~ . . 1107 CELLS
OFF-GAS PROCESS ROOM
, - 178 f t r-l
4 i t
COOLANT DUMP TANKS
COOLANT PUMP
REPEATERS
STEAM GENERATORS
BLANKET DUVD TANKS
FUEL DUMP lANK>
BLANKET HEAT EXCHANGER
PRIMARY HEAT EXCHANGE9
REACTOR
OFF-GAS PROCESS ROOM
Fig. 5.2. Reactor S a l t S y s t e m Layout. P l a n and p ip ing for ru 1000 Mw ( e l e c t r i c a l ) unit .
c o s t s . T h e concentric piping was a l s o found to present s t r e s s problems a t certain temperatures of operation. For t h e s e reasons the piping was changed to provide sepa ra t e reactor in le t and out- let l ines for the fue l and blanket s a l t streairis. The separa te piping will also simplify the main- tenance procedures with remotely operated tooling.
The coolant, or secondary, s a l t piping in the steam c e l l was also modified t o include thermal expansion loops and to include fixed supports for the equipment. T h e location of the coolant s a l t circulating pump was changed in order to gain the necessary flexibility in the piping.
Radiation shielding, formed of 3-in.-thick steel p la tes , l ines the reactor cell to protect the con-
crete from excess ive temperatures due t o absorbed radiation. This thermal sh ie ld was designed to attenuate a flux of 1 x l o ' * 1-Mev gammas sec- and a s su res a concrete temperature of l e s s than 200OF. A s shown in F ig . 5.5, the mounting columns for the components a r e fitted with double bellows seals where they penetrate the thermal shield. It may a l s o b e noted tha t t he columns are supported on shock mounts to provide the requi- s i t e protection aga ins t s e i smic disturbances.
T h e wal l s of the reactor cell present the most S ~ K ~ O U S design problem. They a r e exposed to gamma flux heating and to an ambient temperature as high as 1150°F ins ide the cell, they must b e leak-tight t o maintain containment integrity, and
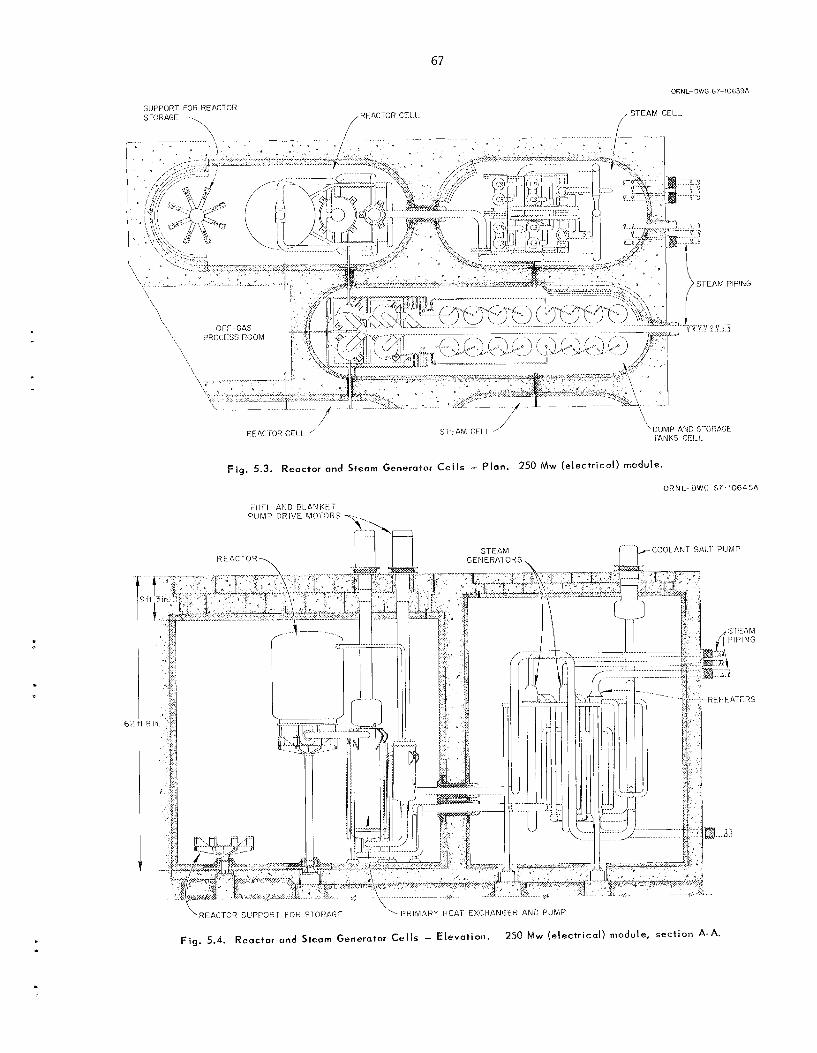
A.
9
.
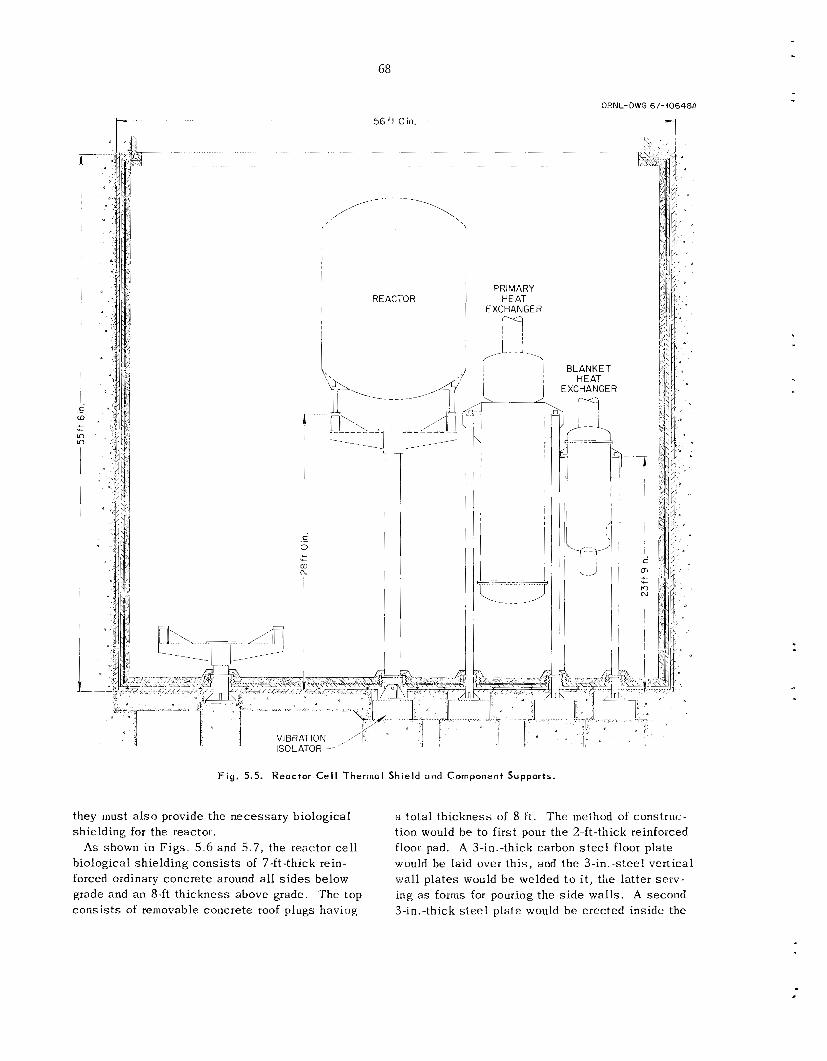
68
56f t Oin.
ORNL-DWG 67-406484
-1
F i g . 5.5. Reactor C e l l Thermal Shield ond Component Supports.
they must a l s o provide the necessa ry biological shielding for the reactor.
biological shielding cons i s t s of 7-ft-thick rein- forced ordinary concrete around a l l s i d e s below grade and an 8-ft th ickness above grade. 'The top cons i s t s of removable concrete roof plugs having
a to ta l th ickness of 8 ft. T h e method of constriic- tion would be to first pour the 2-ft-thick reinforced floor pad. A 3-in.-thick carbon s t e e l floor plate would b e laid over th i s , and the 3-in.-steel vertical wall p la tes would b e welded t o i t , the latter s e r v - ing as forms for pouring the s i d e wal l s . A second 3-in. -thick steel plate would be erected inside the
A s shown in F i g s . 5.6 and 5 .7 , the reactor ce l l
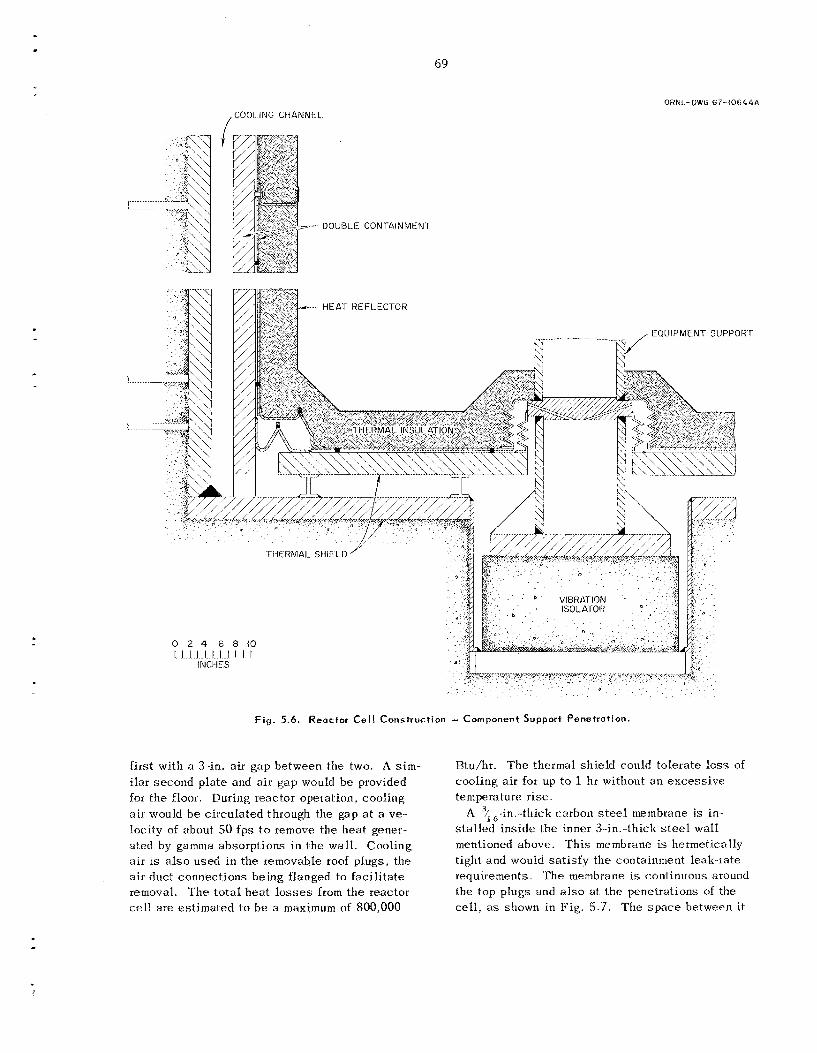
69
0RhlL-OWG 67-40644A COOLING C H A N N E L /
0 2 4 6 8 1 0 L L L L L L U 1
INCHES
Fig . 5.6. Reactor Cel l C o n s t r u c t i o n - Component Support Penetration
first with a %in. air gap between the two. A s im- ilar second p la te and a i r gap would b e provided for the floor. During reactor opetai ion, cooling a i r would b e circulated through the gap a t a ve- locity of about 50 fps t o remove the hea t gener- a ted by gamma absorptions in the wal l . Cooling air is also used i n the removable roof plugs, the air duct connections being flanged to fac i l i t a te removal. T h e to t a l heat losses from the reactor cell are es t imaled to be a maximum of 800,000
Btu/hr. T h e thermal sh ie ld could tolerate loss o f cooling a i r for up to 1 hr without an excess ive temperature rise.
A 3/,,-in.-lhick carbon steel membrane is in- s t a l l ed ins ide the inner 3-in.-thick s t e e l wal l mentioned above. Th i s membrane i s hermetically tight and would sa t i s fy the containment leak-rate requirements. The membrane is continuous around the top plugs and also a t the penetrations of the ce l l , a s shown in Fig. 5.7. The s p a c e between it
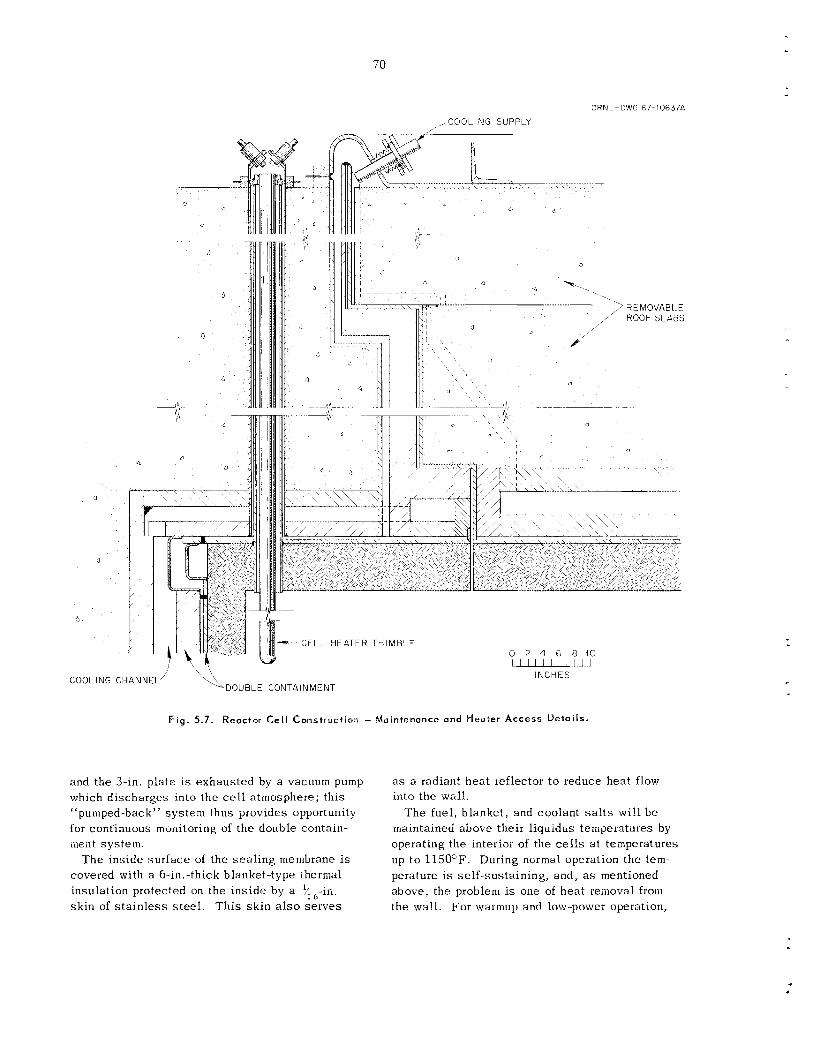
70
,COOLING SUPPLY
ORNL- DWG 67-10637A
I \ I N C H E S <DOUBLE C O N T A I N M E N T
COOLING CI -1ANNEL
Fig. 5.7. Reactor Cel l Construction - Maintenance and Heater Access Detai ls .
and the 3-in. plate i s exhaus ted by a vacuum pump which d ischarges into the c e l l atmosphere; th i s “pumped-back” sys tem thus provides opportunity for continuous monitoring of t he double contain- ment system.
The inside sur face of the sea l ing membrane is covered with a 6-in.-thick blanket-type thermal insulation protected on the in s ide by a Vl6-in. sk in of s t a i n l e s s s t ee l . T h i s sk in also se rves
as a radiant hea t reflector t o reduce hea t flow into the wall.
The fuel, blanket, and coolant s a l t s wi l l bc maintained above their liquidus temperatures by operating the interioi of the cells a t temperatures up t o 1150°F. During normal operation the tem- perature is self-sustaining, and, as mentioned above, the problem is one of hea t removal from the wall . Fo r warmup and low-power operation,
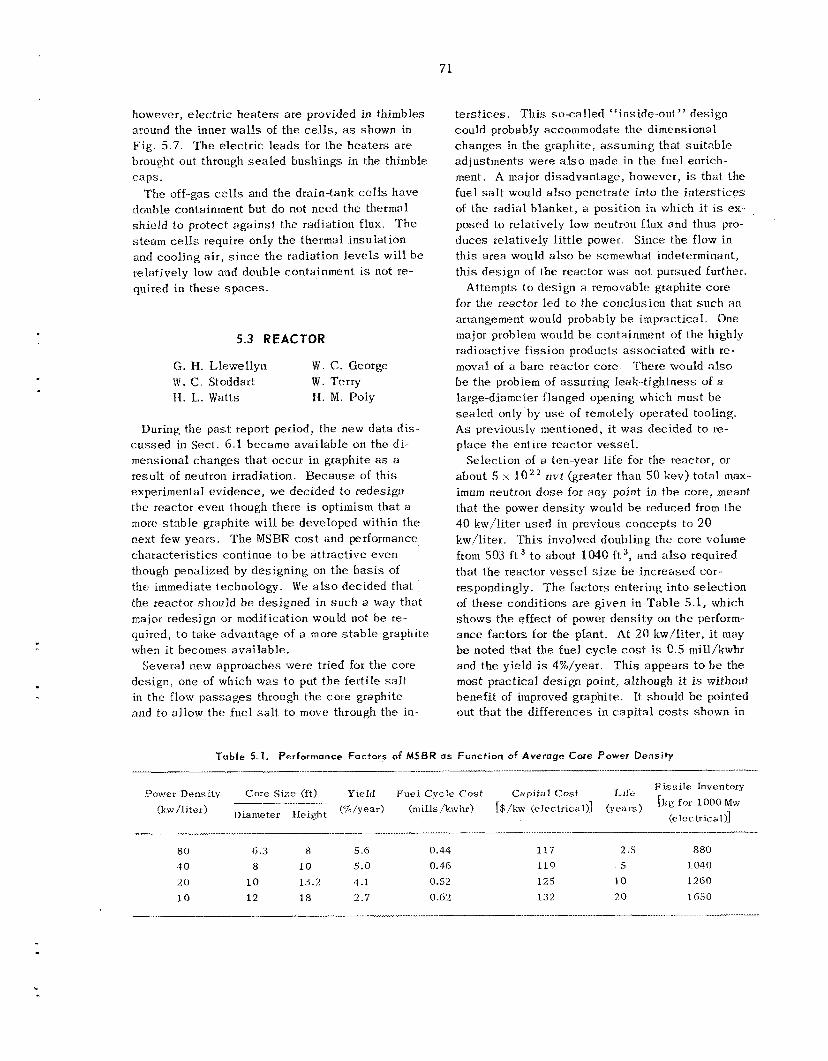
71
however, e lec t r ic hea te rs a r e provided in thimbles around the inner wa l l s of the c e l l s , as shown in Fig. 5.7. T h e e lec t r ic l e a d s for t he hea ters a r e brought out through s e a l e d bushings i.n the thimble caps .
The off--gas cells and the drain-tank cells have double containment but do not need the thermal sh ie ld tQ protect aga ins t t he radiation flux. ’The steam cells require only t h e thermal insulation and cooling a i r , s i n c e the radiation l eve l s will b e relatively low and double containment i s not re- quired in these s p a c e s .
5.3 REACTOR
G. EL Llewellyn W. 6 . Stoddart W . Terry H. L. Watts
W . C. George
w. M. Poly
During the past report period, the new da ta d is - c u s s e d in Sec t . 6.1 became ava i lab le on the di- mensional changes tha t occur in graphite as a result of neutron irradiation. Because of this expe r imenh l ev idence , we dec ided to redesign the reactor even though there is optimism tha t a more s t ab le graphite wi l l be developed within the next few years . T h e MSBR cost and performance charac te r i s t ics continue to b e a t t rac t ive even though penalized by des igning on t h e b a s i s of the immediate technology. W e also decided that the reactor should b e des igned in s u c h a way that major redesign or modification would not b e re- quired, to t ake advantage of a more s t a b l e graphite when i t becomes ava i lab le .
Several new approaches were tr ied for t he core des ign , one of which was to put t h e fert i le s a l t in the flow passages through the core graphite arid to a l low the fue l s a l t to move through the in-
te rs t ices . T h i s so-ca l led “inside-out” des ign could probably accommodate t h e dimensional changes in the graphite, assuming that su i tab le adjustments were also made in the fuel etirich- ment. A major disadvantage, however, is tha t the fuel s a l t would also penetrate into t h e in te rs t ices of the radial blanket, a posit ion in which it IS ex- posed to relatively low neutron flux and thus pro- duces relatively l i t t l e power th i s area would also b e somewhat indeterminant, th i s des ign of the reactor was not pursued further.
Attempts lo des ign a removable graphite core for the reactor led to the conclusion that s u c h an arrangement would probably b e impractical. OnP major problem would b e containment of the highly radioactive f i ss ion products a s soc ia t ed with re- moval of u bare reactor co re There would also b e t h e problem of assur ing leak-tightness of a large-diameter flanged opening which must b e s e a l e d only by u s e of remotely operated tooling. As previously mentioned, i t w a s dec ided to re- p lace the en t i re reactor ves se l .
Selection of 0 ten-year life for the reactor, or about 5 ‘i 10” nvt (greater than 50 kev) total max- imum neutron d o s e for any puint in the co te , meant that t he power dens i ty would b e reduced from the 40 kw/liter u sed in previous concepts t o 20 kw/liter. ‘]This involved doubling the corc volume f rom 503 ft to about 1040 f t 3, and also required that the reactor v e s s e l s i z e be increased cor- respondingly. T h e factors entering in to se lec t ion of t hese conditions a r e g iven in Table 5.1, which shows the e f fec t of power dens i ty on the perform- ance fac tors for the plant. At 20 kw/liter, i t may b e noted that the fue l c y c l e cost is 0.5 niill/kwhr and the yield is 4%/year. T h i s appears to b e the m o s t practical des ign point, although i t is without benefit of improved graphite. It should be pointed out tha t the differences in cap i t a l costs shown i n
Since the flow in
Tuble 5.1. Performance Factors of MSBR as Function of Average Core Power Density I____._
F is 5 ile Inventory [kg for 1000 blw
(e lei- trica 1 ) I Power Density Core Size (ft) Yield Fuel Cycle Cost Capi ta l Cost I.ilb
!kw /liter) u iame ter He iL:h t !.%/year) (mills /kwhr) [$/kw (electrical)] (years )
80 6 .3 8 5.6 0.44
40 8 10 5.9 0.46
2 o 10 13.2 4.1 0.52 10 12 18 2.7 0.62
117 2.5 880 119 5 1 w0 125 10 1260 I 3 2 29 1650
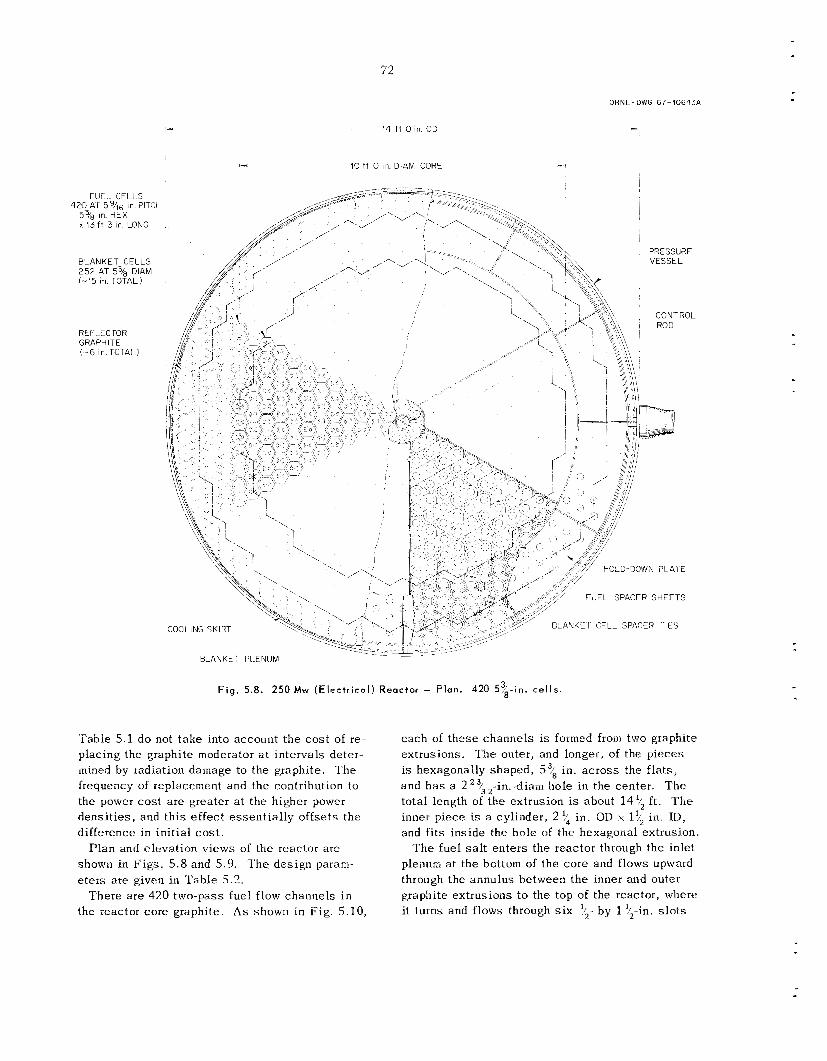
c
72
14 f t 3 i n OD
10 f t 0 i l l . D lAM CORE
FUEL. CEL1.S 420 A r 59/,6 in PlrCH
x 13fl 3 in LONG 5?8 in. HEX
BLANKET CELLS 252 AT 53/8 DlAM (-15 in TOTAL)
REF LEC rofi ( - 6 in TOTAL1 GRAPHITE
F i g . 5.8. 250 Mw (E lec t r ica l ) Reactor - Plan. 420 53i-i". c e l l s .
Table 5 .1 do not t ake into account t he cos t of re- placing the graphite moderator a t intervals deter- mined by radiation damage to the graphite. T h e frequency of replacement and the contribution to the power cos t a r e greater a t the higher power dens i t ies , and th i s e f fec t e s sen t i a l ly offsets the difference in init ial cos t .
shown in F igs . 5 . 8 and 5.9. T h e des ign pararn- e t e i s a r e given in Table 5.2.
There a re 420 two-pass fuel flow channels i n the reactor core graphite. As shown in F ig . 5.10,
P l an and elevation views of the reactor are
each of t h e s e channels i s formed from two graphite extrusions. T h e outer, and longer, of the pieces is hexagonally shaped , 5?8 in. ac ross the f la t s , and h a s a 2 "/, ,-in. -diam hole in the center. T h e total length of the extrusion is about 141i ft . The inner p iece is a cylinder, 2 in. OD x 1'/2 in. 111, and f i t s inside the hole of the hexagonal extrusion.
T h e fuel s a l t en te rs the reactor through the inlet plenum a t the bottom of the core and flows upward through the annulus between the inner and outer graphite extrusions to the top of the reactor, where it turns and flows through s i x V2- by 1 ?,-in. slots
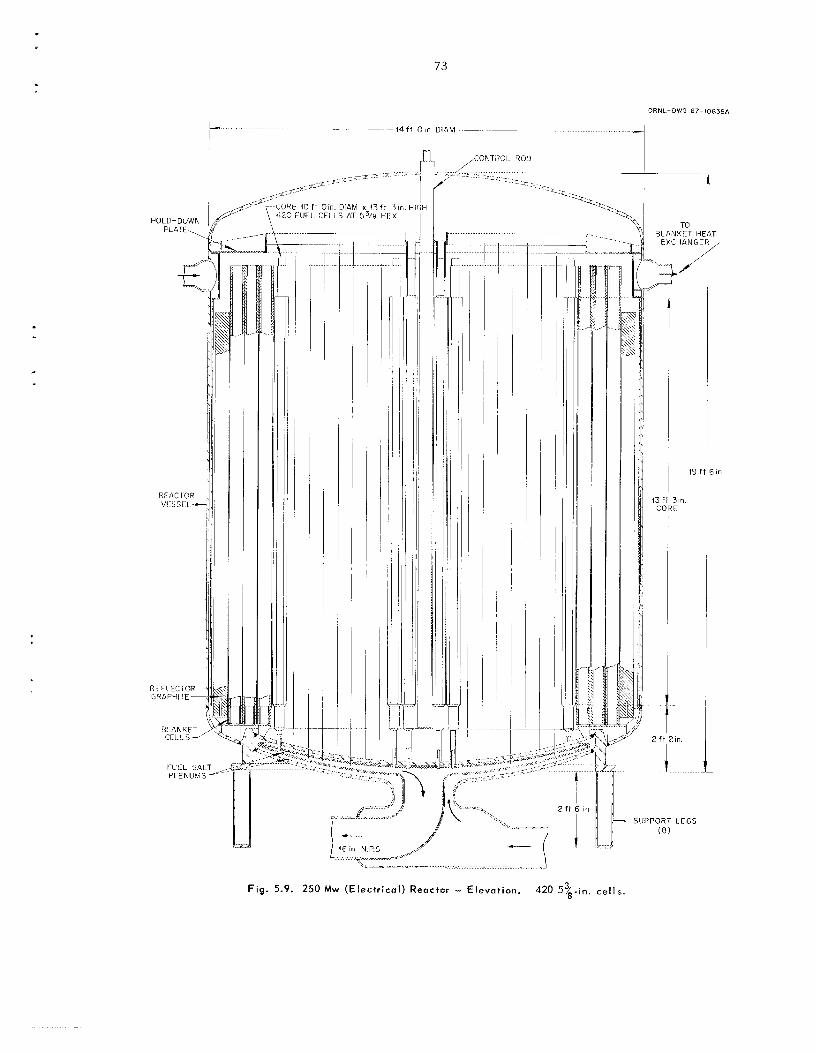
I.
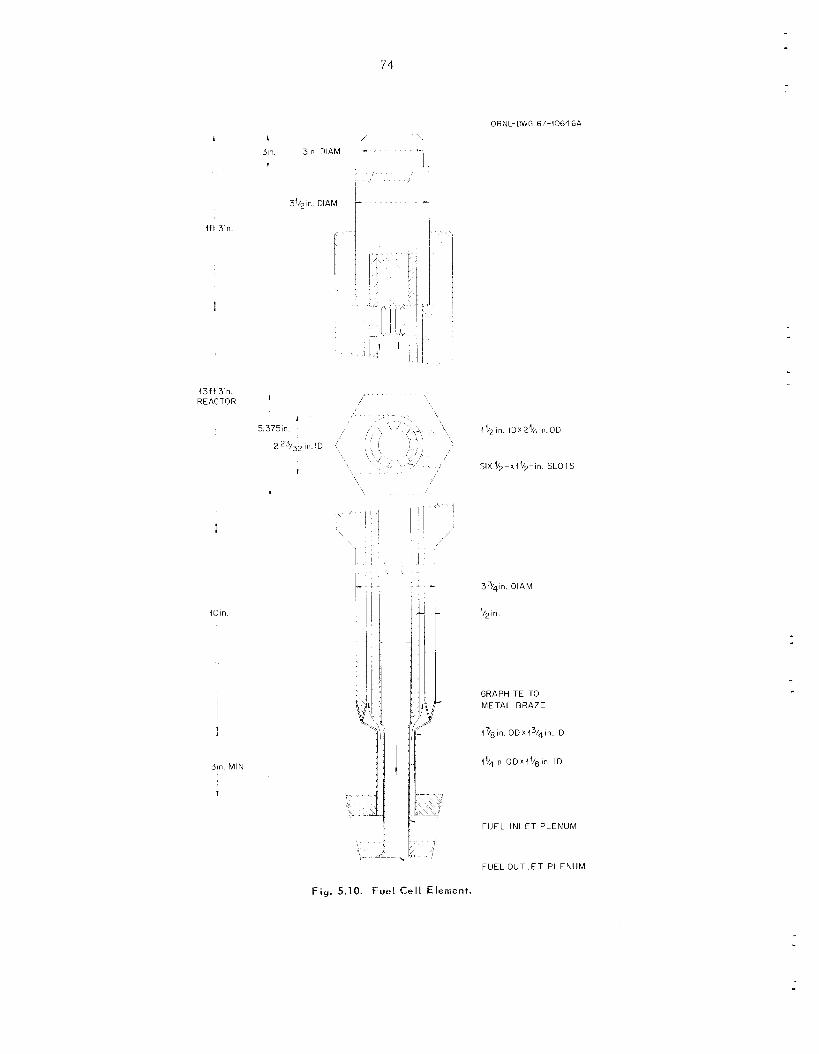
74
I
43ft 3in REACTOR ’
1 5 375 in
t
2 2 3 1 ~ ~ in ID \ ! \ , t
c
1
t
40in.
!
3in. MIN
I
I
ORNL-DWG 67-10646A
i
-, SIX1/2-x14/2-in SLOTS
4 33/41n. D l A M
GRAPHITE TO M E T A L BRAZE
47/,in ODx13/4(n ID
1‘14 in. 0 D x 1 ‘/e in. I D
FUEL INLET PLENUM
i
FUEL OUT1 E T P L E N U M
F i g . 5.10. Fuel Cell Element.
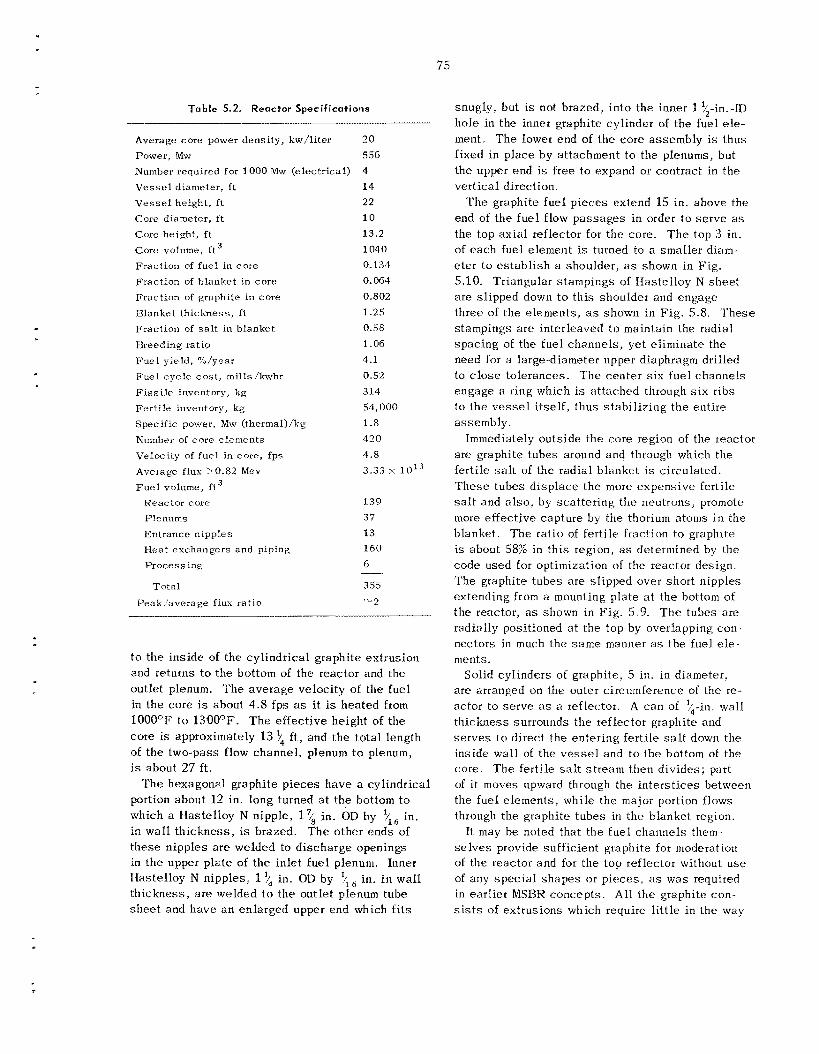
75
Toblc 5.2. Reactor Specifications
Average core power density, kw/liter Power, Mw Number required for 1000 Mw (electrical) V e s s e l diameter, f t Vctssel height, Et Core diameter, f t Core height, f t Core volume, it ' Fraction of fuel i n core Fraction of blanket in core Fraction of graphite in core Blanket thickness, f t Fraction of s a l t in blanket Breeding ratio Fuel yield, %/year Fuel cyc le cos t , inills/kwhr Fissile inventory, kg Ferti le inventory, kg Specific power, Mur (thermal)/kg Nurrrber of core elements Velocity of fue l in core, fps Average flux >@.82 Mev F u e l volume, ft'
React or cure Plenums Entrance nipples Heat exchangers and piping Processing
Total
Peaklaverage flux ratio
20 556
4 14 22 10 13.2 1040 0.134 0. of34 0.802 1.25 0.58 1.06 4.1 0.52
314 54,000 1.8 420 4.8 3.33 1013
139 37 13 160 6
355 '"2
t o t he ins ide of the cylindrical graphite extrusion and returns to the bottom of the reactor and the outlet plenum. T h e average velocity of the fuel in t he core i s about 4.8 fps as it is hea ted Erom l O O O O F to 1300°F. T h e ef fec t ive height of the core is approximately 13 of the two-pass flow channel, plenum to plenum, is about 27 ft.
portion about 12 in. long turned a t t he bottom to which a Hastelloy N nipple, 1% in. OD by 1/16 in. in wal l th ickness , is brazed. T h e other ends of these nipples a r e welded to d ischarge openings in t he upper p la te of t h e in le t fuel plenum. Inner Hastelloy N nipples, 1 2 in. OD by t 6 in. i n wal l th ickness , a r e welded t o t h e outlet plenum tube s h e e t and have a n enlarged upper end which f i t s
f t , and the to ta l length
'The hexagonal graphite p i eces have a cylindrical
snugly, but is not brazed, into t h e inner 1 %-in.-ID hole in the inner graphite cylinder of the fuel e l e - ment. T h e lower end of the core assembly is thus fixed in p lace by attachment to the plenums, but the upper end is free to expand or contract in the vertical direction.
T h e graphite fue l p i eces extend 15 in. above the end of the fue l flow passages in order t o se rve a s the top ax ia l reflector for t he core. T h e top 3 in. of each fuel element is turned to a smaller diam- e te r t o e s t ab l i sh a shoulder, as shown in F ig . 5.10. Triangular stampings of Hastelloy N shee t a r e sl ipped down t o th i s shoulder and engage three of the e lements , as shown in F ig . 5.8. T h e s e stampings a re interleaved t o maintain the radial spac ing of the fuel channels , ye t eliminate the need for a large-diameter upper diaphragm drilled to close tolerances. The center s ix fuel channels engage a ring which is a t tached through s i x ribs to the v e s s e l i t se l f , thus s tab i l iz ing t h e entire ass emb ly .
are graphite tubes around and through which the fert i le s a l t of the radial blanket is circulated. T h e s e tubes d isp lace the more expens ive fert i le s a l t and also, by sca t te r ing the neutrons, promote more effective capture by the thorium atoms i n the blanket. The ratio of fert i le fraction to graphite is about 58% in th i s region, as determined by the code used for optimization of the reactor design. The graphite tubes a re sl ipped over short nipples extending from a mounting plate a t t he bottom of the reactor, as shown in F ig . 5.9. T h e tubes a re radially positioned a t the top by overlapping con- nectors in much the same manner as the fuel e l e - ments.
Solid cylinders of graphite, 5 in. i n diameter, a r e arranged on the outer circumference of the re- actor to se rve as a reflector. A can of ?4-in, wall th ickness surrounds the reflector graphite and se rves to direct the entering fert i le s a l t down the inside wal l of t he v e s s e l and to the bottom oE the core . T h e fert i le s a l t s t ream then d iv ides ; part of it moves upward through the in te rs t ices between the fue l elements, while the major portion flows through the graphite tubes in the blanket region.
It may be noted that t he fue l channels them- s e l v e s provide sufficient graphite for moderation of the reactor and for t he lop reflector without u s e of any s p e c i a l s h a p e s o r p ieces , ;is was required in earlier MSHR concepts . All t h e graphite con- s i s t s of extrusions which require l i t t l e in the way
Immediately outs ide the cure region of the reactor
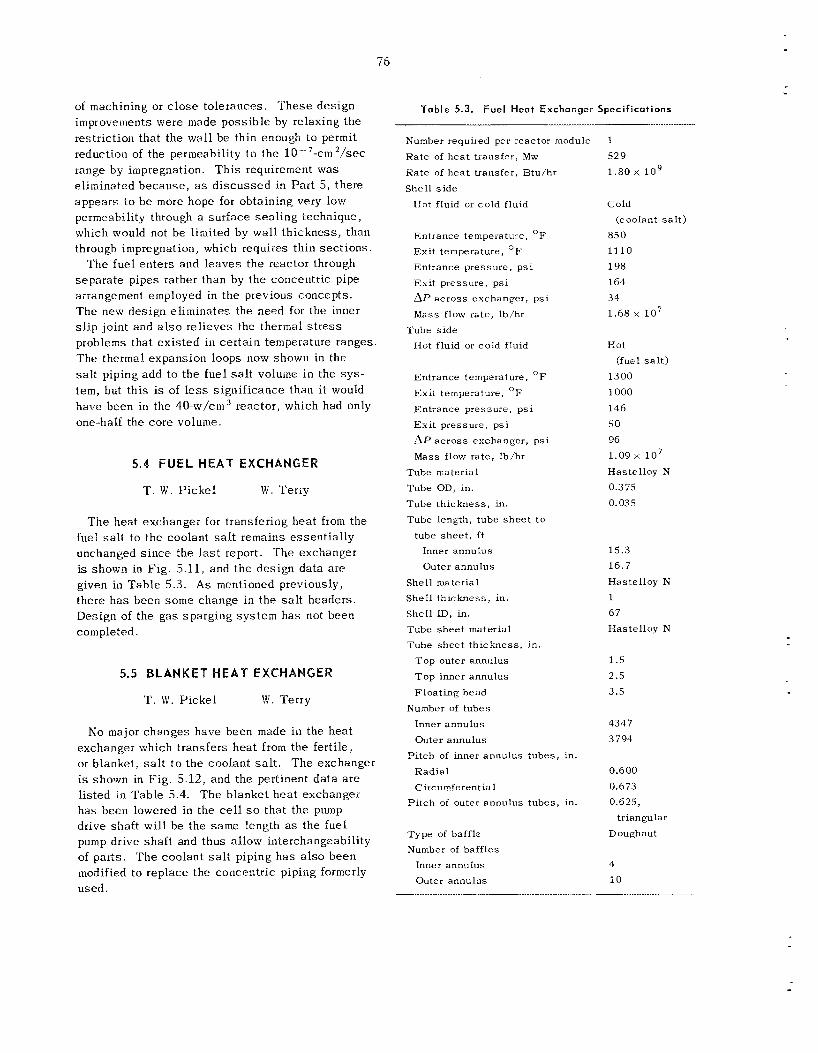
76
of machining or close tolerances. T h e s e des ign improvements were made poss ib le by relaxing the restriction that the wal l be thin enough to permit reduction of the permeability to the 10 -7-cn1 2 / s e ~ range by impregnation. T h i s requirement was eliminated because , a s d i scussed in Par t 5, there appears io b e more hope for obtaining very low Permeability through a surface sea l ing technique, which would not b e limited by wal l th ickness , than through impregnation, which requires thin sec t ions .
T h e fuel en ters and l eaves the reactor through separa te pipes rather than by the concentric pipe arrangement employed in the previous concepts. The new design eliminates the need for the inner s l i p joint and a l s o re l ieves the thermal s t r e s s problems that ex is ted in cer ta in temperature ranges. The thermal. expansion loops now shown in the s a l t piping add to the fue l s a l t volume in the s y s - tem, but th i s is of less significance thao it would have been in the 40-w/cm3 reactor, which had only one-half the core volume.
T. W . P i cke l W. Terry
T h e heat exchanger for transfering hea t from the fuel s a l t t o t he coolant s a l t remains essent ia l ly unchanged s ince the l a s t report. The exchanger i s shown in F ig . 5.11, and t h e design data a re given in Tab le 5 . 3 . As mentioned previously, there h a s been some change in the s a l t headers. Design of the g a s sparg ing sys t em has not been completed.
5.5 BLANKET HEAT ~ X ~ ~ A ~ G ~ ~
T. W . P i cke l W . Terry
No major changes have been made iil the hea t exchanger which transfers hea t from the fert i le, or blanket, s a l t t o the coolant salt . The exchanger i s shown in F ig . 5.12, and the pertinent da t a a r e l isted in Table 5.4 . The blanket hea t exchanger has been lowered in the c e l l so that the pump drive shaf t will be the s a m e length as the fuel pump drive shaf t and thus allow interchangeability of parts. T h e coolant s a l t piping h a s a l so been modified to replace the concentric piping formerly used.
Table 5.3. Fuel Heat Exchanger Specif icat ions
Number requiied p e r reactor module I Rate of heat transfer, Mw Rate of heat tiansfer, Btu/hr Shell s ide
Hot fluid or cold fluid
Entrance temperature, O F
Exi t temperature, OF Entrance pressure, p s i Exi t pressure, p s i AI' across exchanger, ps i M a s s flow rate, lb/hr
Tube s ide Hot fluid or cold fluid
Entrance temperature, O F
Exi t temperature, OF Entrance pressure, p s i Ex i t pressure, p s i AP ac ross exchanger, p s i Mass flow rate, lb/hr
Tube material Tube OD, in. Tube thickness , in. Tube length, tube shee t t o
tube shee t , ft Inner annulus Outer annulus
Shell material Shel l thickness , in. Shell ID, in. Tube shee t material Tube shee t thickness , in.
Top outer annulus T o p inner annulus Float ing head
Number of tubes Inner annulus Outer annulus
Pi tch of inner annulus tubes, in. Radial Circumferential
Pi tch of outer annulus tubes , in.
Type of baffle Number of baffles
Inner annulus Outer annulus
52 9 1.80 x i o 9
Cold (coolant s a l t )
85 0 1110 198 164 31 1.68 l o 7
Hot (fuel s a l t )
1300 1000 146 50 96 1.09 l o 7 Hastelloy N 0.3 75 0.03 5
15.3 16.7 Hastelloy N 1 67 Hastelloy N
1 .5 2.5 3.5
4317 3791
0.600 0.673 0.625,
triangular Doughnut
4 10
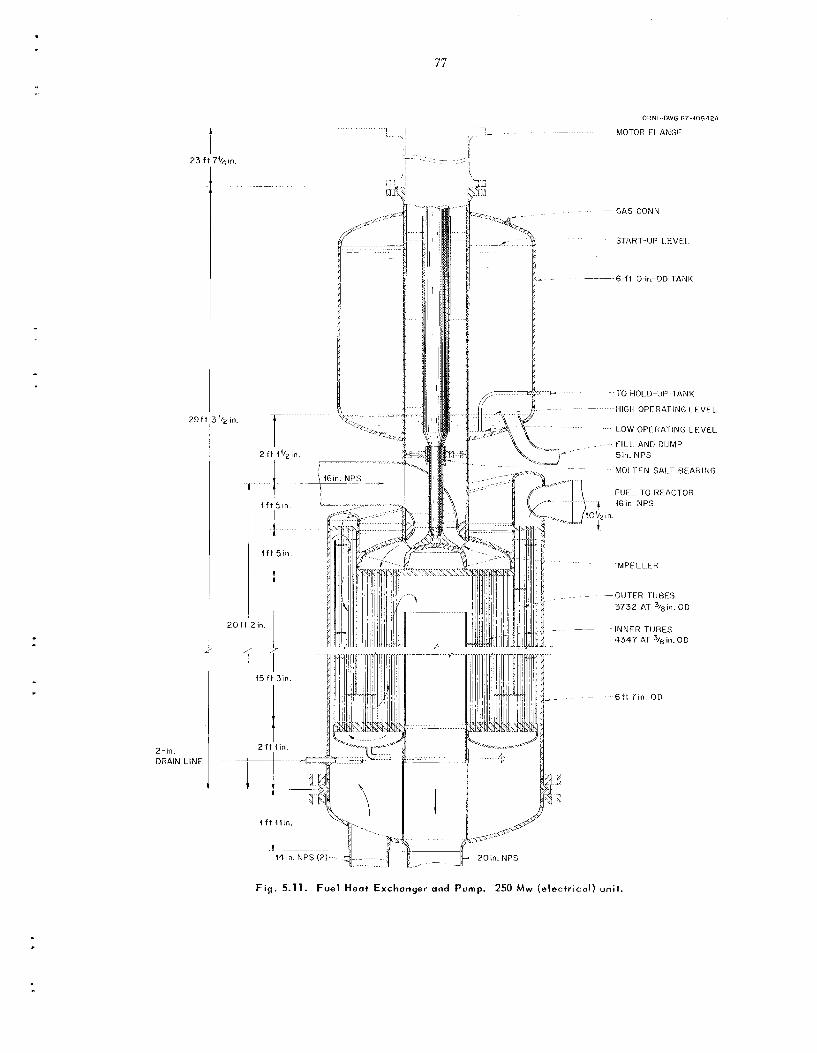
77
23 I
20 f
‘ i i f t s i n .
-1 f f t sin. +
in. i
2-in. DRAIN LINE 1
ORNL DWG 67 1 0 6 4 Z A
-1 ~ MOTOR FI APiGF
‘i - ,- b b
- il
i .i -,: ., .... -...-.-,. .
F i g . 5.11. Fuel Heat Exchanger and Pump. 250 Mw (electrical) uni t .
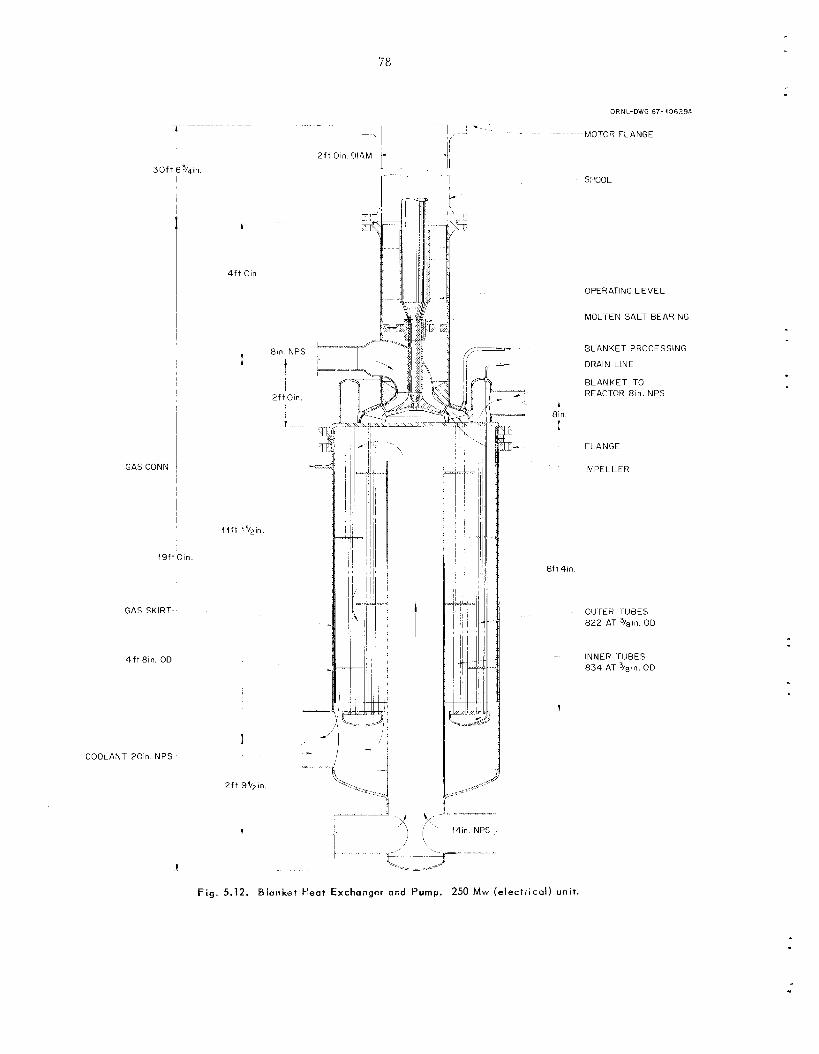
78
GASCONN I
1 9 f t Oin
GAS SKIRT
4 f t 8in. OD
COOLANT 20in NPS 1
8113 NPS I
2 f t O i n
1
, ~
ORNL-DWG 67-40679.1
PAOTOR FLANGE
S?OOL
OPERATING L E V E L
MOL-TEN SALT BEARING
B L A N K E T PROCESSING
DRAIN LINE
B L A N K E T TO REACTOR 8 in NPS
I 8 in
I i FLANGE
I IMPELLER
8 f t 4in
ou mi 1 UBES 822 AT 3/8~n. OD
INNER rUBES 834 AT 3/8in OD
1
Fig, 5.12. Blanket Heat Exchanger and Pump. 250 Mw (e lectr ical ) unit .
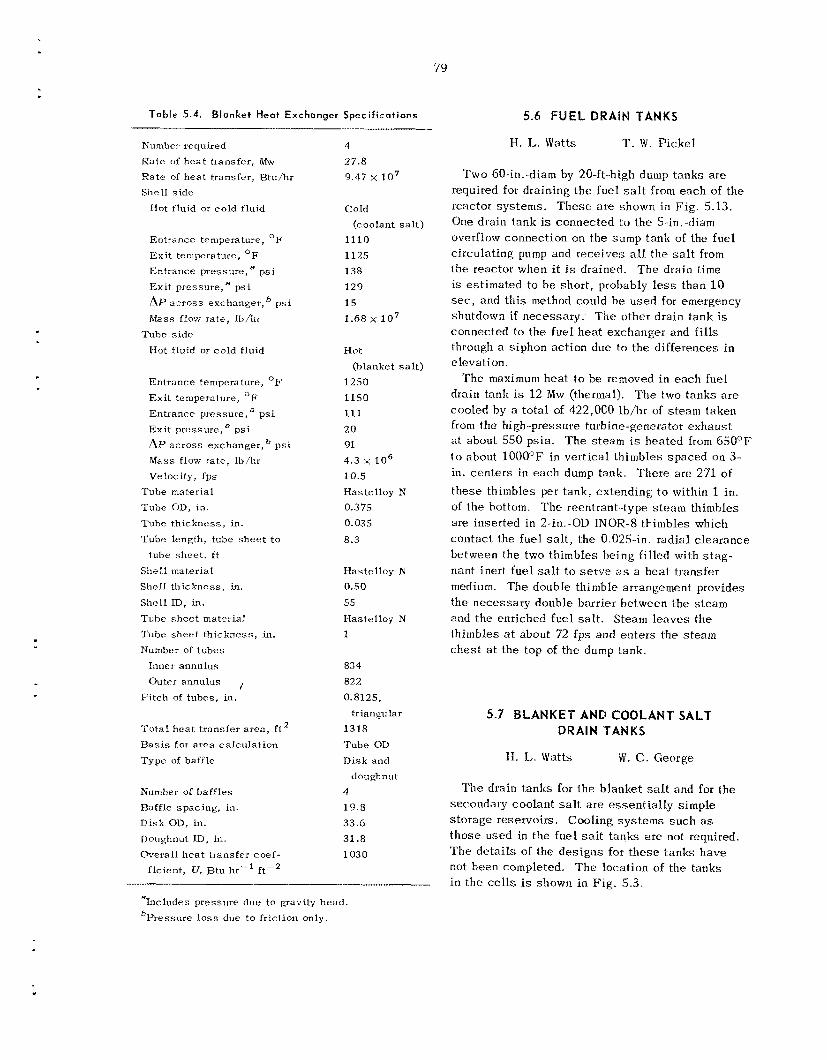
79
Table 5.4. Blanket Heat Exchanger Specifications
Number required Rate of hea t transfer, Nw E a t e of hea t transfer, Btu/hr Shell s ide
Hot fluid or cold fluid
Entrance temperature, O F
Exi t temperature, O F
Entrance pressure, a ps i Exit pressure,a psi
Ai’ across exchanger, p s i M a s s flow rate, I b / h
Tube s ide Not f luid or cold fluid
Ent rsnce temperature, “F Exi t temperature, OF Entrance pressure,” p s i Exit pressure,a p s i i\P across exchanger, psi Mass flow rate, Ib/hr Velocity, fps
Tube material Tube OD, in. Tube th ickness , in. T u b e length, tube shee t t o
tube shee t , f t Shell materiel Shell thickness, in.
Shell ID, in. Tube shee t material Tiibe shee t thickness, in. Number of tubes
Inner annulus Outer annulus 1
Pi tch of tubes, in.
Total heat transfer a rea , f t 2 Basis for area calculation Type of baffle
Number of baffles Rafkle spacing, in. Disk OD, in. Doughnut ID, in. Overall hea t transfer coef-
f icient, U, &tu hr-’ f t-2
4 27.8 9.47 107
Cold (coolant s a l t )
1110
1125 138
129
15 1.63 x 10’
Hot (blanket salt)
1250 1150
111
20 91
4.3 x 10⁶ 10.5
Hastelloy N 0.375 0.035
8.3
Hastelloy N 0.50 55
Hastelloy N 1
83 4 822
0.8125,
triarigiilar 1318
Tube OD Disk and
doughnut 4 19.8
33.6
31.8 1030
aIncludes pressure due to gravity head. bPressnre lo s s due to friction only.
5.6 FUEL DRAIN TANKS
H. L. Watts T. W. P i cke l
Two 60-iti.-diam by 20-ft -high dump tanks are required for draining the fuel s a l t from each of the reactor sys tems. T h e s e ate shown in F ig . 5.13. One drain tank is connected to the 5-in.-diam overflow connection on the sump tank of the fue l circulating pump and rece ives all tht3 salt from the reactor when it is drained. The drain t ime is estimated to b e short , probably less than 10 sec, and th is method could be used for emergency shutdown if necessary . The other drain tank is connected to the fuel hea t exchanger and fills through a s iphon ac t ion due to the differences in elcvat i on.
The maximum hea t to be removed in each fuel drain tank is 12 M w (thermal). The two tanks a re cooled by a total of 422,000 lt)/hr of s team taken from the high-pressure turbine-generator exhaus t at about 550 psia. ‘The s team is heated from G O O F
t o about 1000OF in vertical thimblcs spaced on 3- in. cen ters in each dump tank. There are 271 of these thimbles per tank, extending t o within 1 in. of the hot tom. The reentrant -type s team thimbles are inserted in 2-in.-OD INOR-8 thimbles which contact the fuel s a l t , the 0.025-in. radial clearance between the two thimbles being filled with s t a g - nant inert fuel salt t o se rve as a heat transfer medium. The double thimble arrangement provides the necessary double barrier between the s team and the enriched fuel salt. Steam leaves the thimbles a t about 72 fps and en ters the steam ches t at the top of t he dump tank.
5.7 BLANKET AND COOLANT SALT DRAIN TANKS
H. L. Watts W. C . George
The drain tanks for the blanket s a l t and for the secondary coolant s a l t are essent ia l ly simple s torage reservoirs. Cooling sys tems such a s those used in the fuel s a l t tanks a re not required. ‘The de ta i l s of the des igns for t h e s e tanks have not been completed. T h e location of the tanks i n the cells is shown in Fig. 5.3.
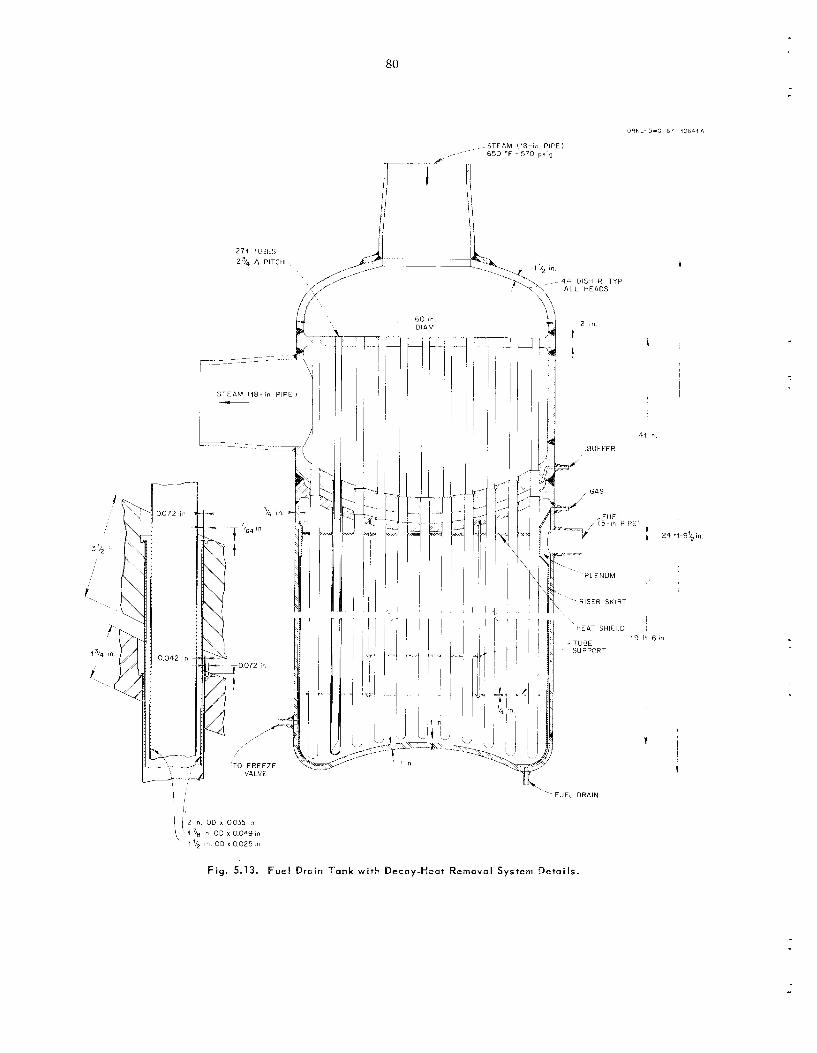
80
ORNL- D W G 67 ~ io644 A
271 T I R E S
2%. A PITCH
STEAM ( l a n PIPE i L-
GlSL1 R T Y P L HEADS
FUEL DRAIN
1 1 ' 2 i n OD x 0035 in
\\ ' 4 '/s in OD x 0.043 In
i n O D x 0 . 0 2 5 t n
41 in
F i g . 5.13. F u e l Drain Tank w i t h Decay-Heat Remova l System Deta i ls .

81
5.8 STEAM GENERATOR-SUPERHEATER The init ial concepts have changed l i t t le , however, AND REHEATER and the design work h a s consis ted primarily of
detai l ing tube s h e e t s , supports , headers , e t c . Detai ls of this equipment will be covered in sub- sequent reports.
C. E. Bet t is T. W. Pickel Some work was continued on the design of the
s team generator-superheater and on the reheater.
A. M Perry
6.1 MSBR PHYSICS ANALYSIS
0. L. Smith
Optimization of Reactor Parameters
H. T. Kerr
T h e two principal ind ices by which the perfor- mance of t he Molten-Salt Breeder Reactor is cus- tomarily evaluated a r e the c o s t of power and the annual fuel yield, tha t i s , the annual fractional in- crease in the inventory of fissionable material. These are used as figures of merit in a s s e s s i n g the influence of various des ign parameters or the effect of des ign changes that may be contemplated, and, in fact , we customarily combine them into a com- posite figurc of merit,
F = y i lOO(C +~ x>-1 ,
in which 1 7 is the annual fuel yield in percent per year, C is that part of the power c o s t which de.- pends on any of the parameters considered, and X i s a n ad jus tab le cons tan t , having i10 physical s ig- nificance, whose value merely determines the rela- t ive sens i t iv i ty of F to y and C. S ince a large num- ber of reactor parameters a r e usually involved, we make u s e of a n automatic s ea rch procedure, carried out on a n IBM 7090 computer, which finds that com- bination of the variable desigu parameters that rnax- i m i z e s t h e figure of merit, F , subjec t to whatever constraints may be imposed by the fixed va lues of other des ign parameters not allowed to vary. Th i s procedure, ca l led OPTIhfERC, incorporates a mul- tigroup diffusion calculation ( synthes iz ing a two- space-dimensional description of t h e flux by a l - ternating one-dimensional flux calculations), a determination of the f i s s i l e , fert i le, and fission product concentrations cons is ten t with the proc-
e s s i n g ra tes of the fuel and fert i le s a l t s t reams, and a method of s t e e p e s t gradients for optiiiiizing the va lues of the variabies. By choosing different va lues for the constant X in t he figure of merit, F , we c a n generate a curve showing t h e minimum cos t a s soc ia t ed with any a t ta inable value of the fuel yield, and by carrying out the optimization proce- dure for different, s u c c e s s i v e fixed values of se- lected design parameters, w e can generate families of s u c h curves of C v s y. (In OPTIMEKC any of s o m e 20 parameters may either be a s s igned fixed va lues or be allowed to vary within spec i f ied limits subjec t t o the optimization procedure.)
One of the des ign parameters which has a sig- nificant influence on both yield and power c o s t is the power density in the core. (Actually, the core dimensions for a given total power a r e the param- e t e r s used.) T h e performance of the reactor is better a t high power dens i t ies . At t he same time, the useful l ife of the graphite moderator, which i s dependent on the total exposure to f a s t neutrons, is inversely proportional t o the power density ( s e e next section). It i s necessary , therefore, t o de- termine the effect of power density on performance with cons iderable care.
In F ig . 5.1 the fuel-cycle c o s t is used because it conta ins , in fac t , most of the variation of power cos t with the parameters being varied. It may b e s e e n from Fig . 6.1 that a reduction ii1 power density from 80 to 20 w/cm3 involves a fuel-cycle c o s t penalty of about 0.1 mill/kwhr (electrical) and a reduction in annual fuel yield of perhaps 1.5%. Ihe re is, of course , also an increase in capi ta l cos t (cf. Chap. 5), but this is essent ia l ly offset by a reduction in the c o s t of replacing the graphite and reactor v e s s e l a t intervals determined by ra- diation damage to t he graphite. The combined penalty for having to replace the graphite, com- pared with a high-power-density core not requiring replacement, is about 0.2 mill/kwhr (electrical) ,
,,
82
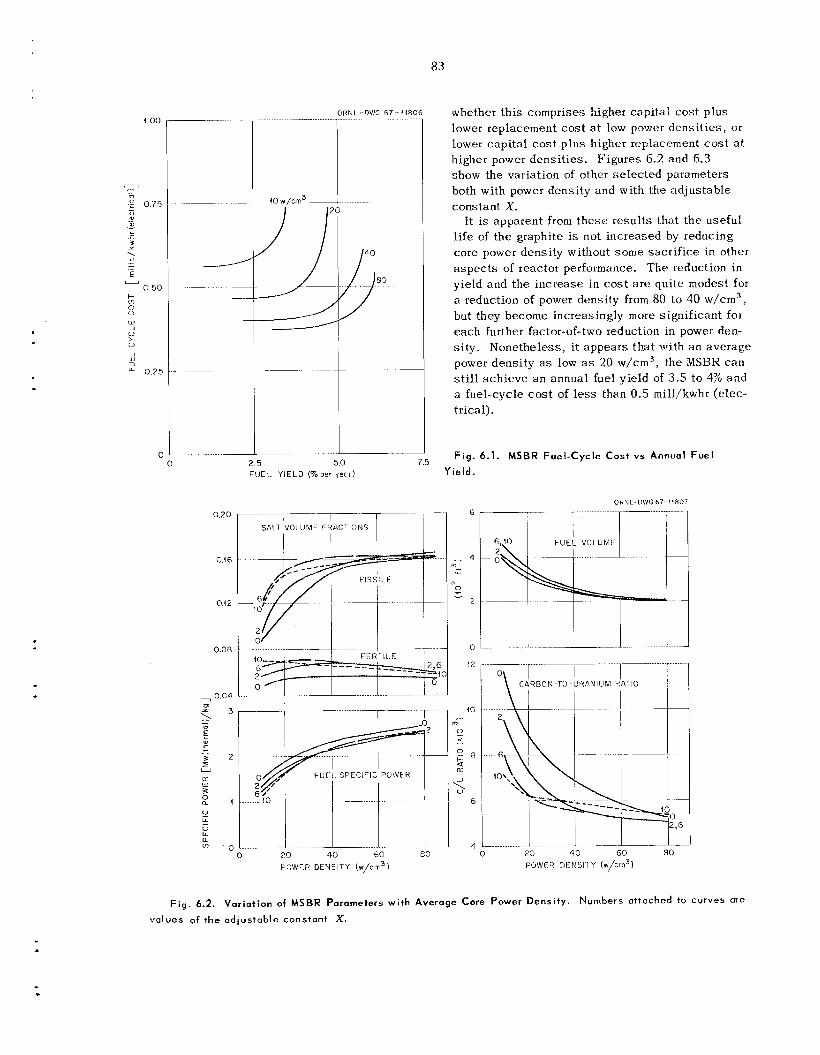
83
ORNL--DWG 67-411 - .........
2 5 5 0
FUEL YIELD (%per y e a r )
.............
SALT VOLUME FRACTIONS
7.5
r
whether th i s comprises higher capi ta l cost plus lower replacement c o s t a t low power dens i t i e s , or lower capi ta l c o s t p lus higher replacement c o s t a t higher power dens i t ies . F igures 6.2 and 6.3 show the variation of other s e l ec t ed parameters both with power dens i ty and with the ad jus tab le constant X .
It is apparent from t h e s e resu l t s that t he usefu l l ife of the graphite is not increased by reducing core power dens i ty without some sacr i f ice in other a s p e c t s of reactor performance. T h e reduction in yield and the increase in cost a r e quite modest for a reduction of power density from 80 t o 40 w/cm3, but they become increasingly more significant for each further factor-of-two reduction in power den- s i ty . Nonethe less , it appears tha t with a n average power dens i ty as low as 20 w/cm3, the MSBR can still ach ieve a n annual fuel yicld of 3.5 t o 4% and a fuel-cycle cost of less than 0.5 mill/kwhr (elec- trical).
F i g . 6.1. MSBR Fue l -Cyc le Cost vs Annual F u e l
Yield.
ORNL-DWG 67- 14807
......... .......... 3
6 ........
.... ...... 0 2 0 40 60 BO
POWER DENSITY (w/cm3 )
......., ~ ....... - I
I---- ,z ...,...
ON-10-URANIUM n'ATI0 1
0 20 40 60 80
POWE H DENSITY (w/cm3)
F i g . 6.2. Variot ion of MSBR Parameters w i th Average Core Power Dens i ty . Numbers attached to
values of the adiustable constant X.
curves are
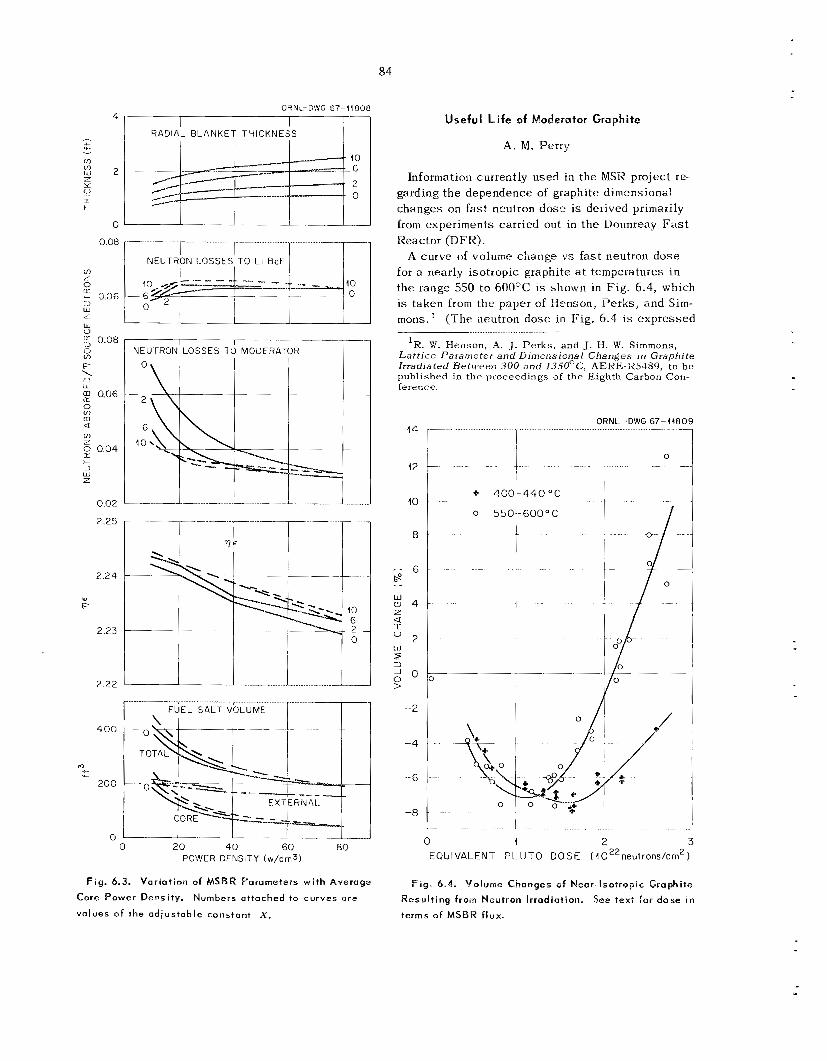
ORNL-DWG 67-14808 4 I I I I I
84
Useful Life 04 Moderator Graphite
A . M. Perry
0 ' I I I I I
V S; 0.06
2.25
2.24
v F
2.23
2.22
I I I
NEUTRON LOSSES TO M O D E R A T O R r-
1 1 I O 20 40 60 80
POWER DFNSITY (w/crnJ)
Fig. 4.3. Var ia t ion of MSBR Parumeters wi th Average
Core Power Density.
values of the adiustoble constant X .
Numbers attached to curves a r e
Information currently used in the MSR project re- garding the dependence of graphite dimensional changes on f a s t neutron d o s e is derived primarily from experiments carried out in t h e llounreay F a s t Reactor (DFR).
A curve of voliirne change vs fas t neutron dose for a nearly isotropic graphite a t temperatures i n the range 550 to 6OOOC is shown in F ig . 6.4, which is taken from the paper of Henson, Perks , and Sim- mons.' (The neutron dose in Fig. 6.4 is expressed
....................
'R. '3'. Henson, A. J. P e r k s , a n d J. H. W. Simmons , Lat t ice Parameter and Dimensional Changes in Graphite Irradiated Between 300 and 1350°C, AEKE-XS489, to be published in the proceedings of the Eighth Carbon Con- ference.
10 :: ' -2 t
OR NL- DWG 67- 1 48 09
I I I
* 400-440"c
0 5 5 0 - 6 0 0 ° C I
0 1 2 3 EQUIVALENT P L U T O D O S E (40 '~neutrons/cm')
F i g , 4.4. Yolrsme Changes of Near-Isotropic Graphite See text for dose in Result ing from Neutron Irradiation.
terms of MSBR flux.
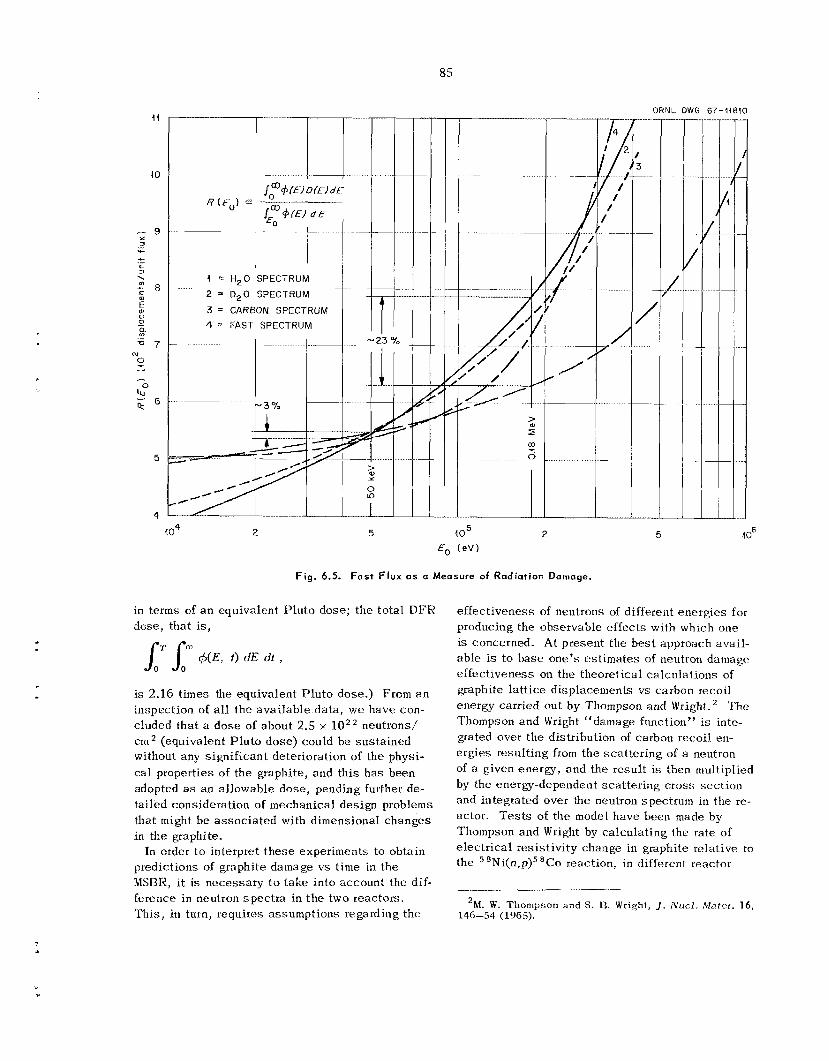
ORNL DWG 67-11810 ----------
I = H,O SPECTRUM 2 = D 2 0 SPECTRUM 3 = CARBON SPECTRUM 4 = FAST SPECTRUM
5 1 o6 2 5
Fig. 6.5. Fast Flux os a M e a s u r e of Radiation D a m o g e .
in terms of a n equivalent P lu to dose; the total D F R dose, tha t is,
ef fec t iveness of neutrons of different energ ies €or producing the observable e f fec ts with which one is concerned. At present the bes t approach avail- able is to base one’s es t imates of neutron damage effectiveness on the theoretical ca lcu la t ions of graphite la t t ice displacements vs carbon recoil energy carried o u t by Thompson and Wright. Thompson and Wright “damage function” is inte- grated over t he distribution of carbon recoil en- e rg ies result ing frotn the sca t te r ing of a neutron of a given energy, and the resu l t is then multiplied by the energy-depcndcnt sca t te r ing c ross sec t ion and integrated over the neutron spectrum in the re- actor. T e s t s of the model have been made by Thompson and Wright by ca lcu la t ing the rate of e lec t r ica l resist ivity change in graphite relative to the * N ~ ( n , p ) ~ ‘Co reaction, in different reactor
T h e is 2.16 times the equivalent P lu to dose.) From a n inspection of a l l the ava i lab le da ta , we have con- cluded tha t a dose of about 2.5 x cn i without any significant deterioration of the physi- cal properties of the graphite, and th i s h a s been adopted as an allowable dose, pending further de- tailed consideration of mechanical design problems that might be a s soc ia t ed with dimensional changes in the graphite.
In order t o interpret t hese experiments to obtain predictions of graphite damage vs t i m e in the MSBR, i t is necessary to take in to account the dif- ference in neutron spec t ra in the two reactors. T h i s , in turn, requires assumptions regarding the
neutrons/ (equivalent P lu to dose) could be sus ta ined
’M. W. Thompson and S. €3. Wright, J. N u c l . Mater. 16, 146-54 (1965).
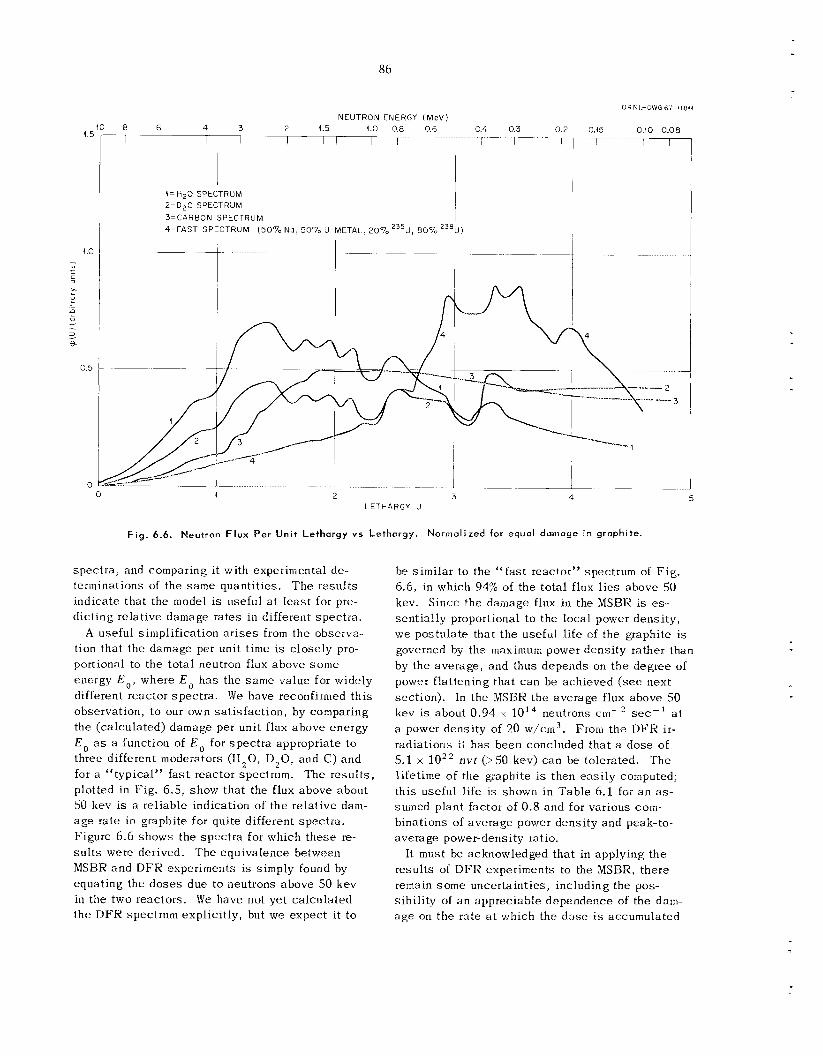
86
O R N I - O W G 61-44844
O.(O 0.08
I I 8 6 4 7-
NEUTRON ENERGY ( M e V ) 3 2 40 0 8 0 6 - I 1
I
! 4 = H 2 0 SPECTRUM 2=D20 SPECTRUM 3=C4RBON SPECTRUM 4=FAST SPECTRUM (50% Na, 50% U-METAL, ~ o % * ~ ~ U , 80% 23aU)
0 4 0 3 0 7 015 1 - 1 - ry -
spec t ra , and comparing it with experimental de- terminations of the same quantit ies. The resu l t s indicate that the model is useful a t l ea s t for pre- dicting relative damage ra tes in different spec t ra .
A useful simplification a r i s e s from the observa- tion that the damage per unit t i m e i s c lose ly pro- portional to the total neutron flux above some energy E , , where E o h a s the s a m e value for widely different reactor spec t ra . We have reconfirmed th is observation, t o our own sa t i s fac t ion , by comparing the (calculated) damage per unit flux above energy E , as a function of E , for spec t ra appropriate to three different moderators (H20, D L O , and C) and for a “typical” f a s t reactor spectrum. The resu l t s , plotted i n Fig. 6 .5 , show that the flux above about 50 kev i s a reliable indication of the relative dam- a g e rate in graphite for quite different spec t ra . Figure 6.6 shows the spec t ra for which these re- s u l t s were derived. The equivalence between MSBR and DFR experiments i s simply found by equating the d o s e s due to neutrons above 50 kev in the two reactors. We have not yet ca lcu la ted the DFK spectrum explicit ly, but we expect i t t o
be similar t o the “ fa s t reactor” spectrum of Fig. 6.6, in which 94% of the to ta l flux l i e s above 50 kev. S ince the damage flux in the MSBR i s es- sent ia l ly proportional to the local power dens i ty , we postulate that the useful life of the graphite is governed by the maximum power density rather than by the average , and thus depends on the degree of power flattening tha t can be achieved ( s e e next section). In the hlSBR the average flux above 50 kev i s about 0.94 x 10¹⁴ neutrons cm-’ sec-’ a t a power density of 20 w/cm3. radiations i t has been concluded tha t a dose of 5.1 x 10‘’ nvt (> 50 kev) can be tolerated. The l ifetime of the graphite i s then eas i ly computed; th i s useful l ife i s shown i n Table 6.1 for a n as- sumed plant factor of 0.8 and for various c o m - binations of average power dens i ty and peak-to- average power-density ratio.
It must be acknowledged tha t in applying the results of D F K experiments to the MSBX, there remain some uncertainties, including the pos- sibil i ty of an appreciable dependence of the d a ~ a g e on the rate a t which the dose is accumulated
F r o m the D F R ir-
4 4 2 3 5 0
LETHARGY U
F i g . 6.6. Neutron Flux Per Un i t Lethargy v s Lethargy. Normal ized for equal dunioye i n graphite.
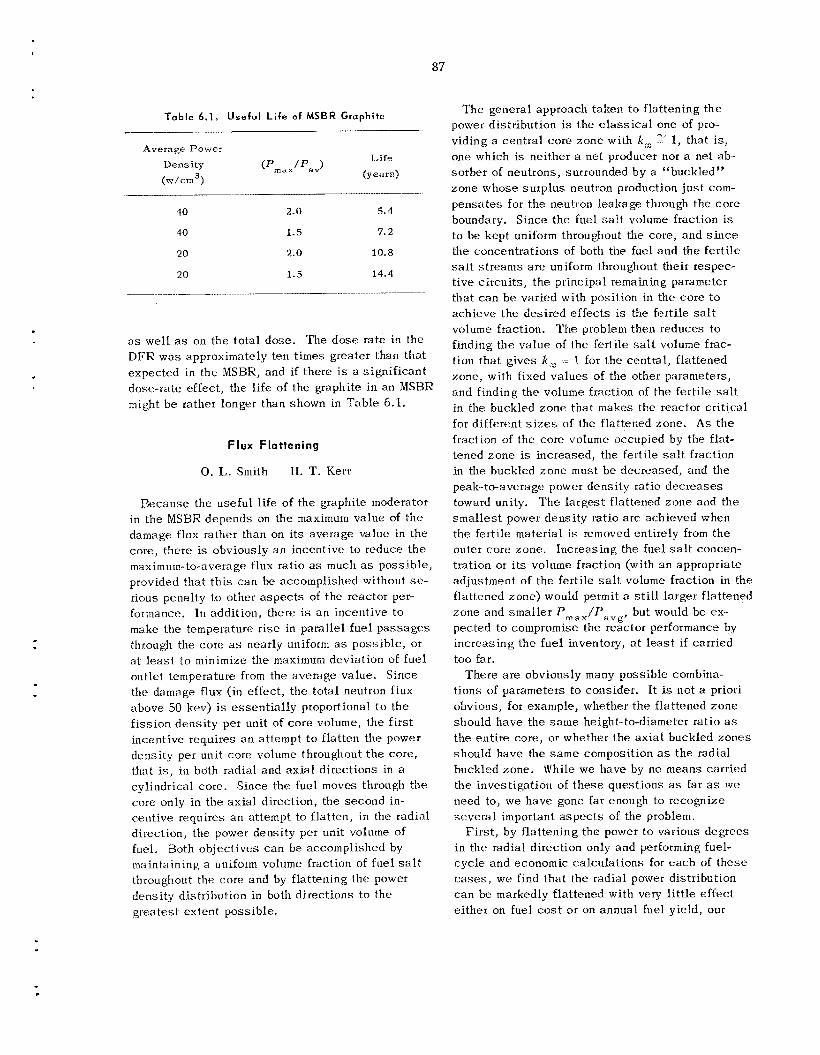
87
Table 6.1. Useful Life of MSBR Graphite
Average Power
Dens i ty Life
(w/crn3!
40 2.0 5. I
40 1.5 7.2
20 2.0 10.8
20 1.5 14.4
a s well as on the total dose . The dose rate in the DFR w a s approximately ten times greater than tha t expected in the MSBR, and if there is a s igni f icant dose-rate effect , the l ife of the graphite in an MSBR might be rather longer than shown in Table 6.1.
Flux Flattening
0. L. Smith H. T. Kerr
Eecause the useful life of the graphite moderator in the MSBR depends on the maximum value of t he damage flux rattier than on its average value in the core, there is obviously an incentive to reduce t h e maximum-to-average flux ratio as much as poss ib le , provided tha t t h i s can be accomplished without se- rious penalty to other a spec t s of the reactor per- formance. In addition, there is a n iilcentive to make the temperature rise in parallel fuel pas sages through the core as nearly uniform a s poss ib le , or at least t o minimize the maximum deviation of fuel outlet temperature from the average value. Since the damage flux (in effect , the total neutron flux above 50 kev) is essent ia l ly proportional t o the f i ss ion dens i ty per unit of co re volume, the f i r s t incentive requires a n attempt t o flatten the power density per unit core volume throughout t he core, that is, in both radia.1 and ax ia l directions in a cylindrical core. Since the fuel moves through the core only in the ax ia l direction, the second in- centive requires a n attempt to flatten, in the radial direction, the power density per unit volume of fuel. Both objec t ives c a n be accomplished by maintaining a uniform volume fraction of fuel s a l t throughout the core and by flattening the power density distribution in both directions t o the greatest extent possible.
The general approach taken to flattening the power distribution is the c l a s s i c a l one of pro- viding a cent ra l core zone with I<, .-.- 1, that is , one which is neither a ne t producer nor a net ab- sorber of neutrons, surrounded b y a “buckled” zone whose surp lus neutron production ju s t com- pensa tes for the neutron leakage through the core boundary. Since the fuel s a l t volume fraction is to be kept uniform throughout the core, and s i n c e the concentrations of both the fue l atid the fe r t i l e s a l t s treams a re uniform throughout their respec- t ive c i rcu i t s , t he p r i m ipal remaining para me te r that can be varied with position in the core t o achieve the desired effects is the fertile salt volume fraction. The problem then reduces to finding the va lue of the fertile salt volume frac- tion tha t gives k , --= 1 for the central , flattened zone, with fixed va lues of the other parameters, and finding the volume fraction of the fert i le s a l t in the buckled zone tha t makes the reactor c r i t i ca l for different s i z e s of the flattened zone. As t h e fraction of the core volume occupied by the flat- tened zone is increased, the fertile s a l t fraction in the buckled zone must be decreased, and the peak-to-average power density ratio dec reases toward unity. The la rges t flattened zone and the smallest power density ratio a r e achieved when the fertile material is removed entirely from the outer core zone. Increasing the fuel s a l t concen- tration or its volume fraction (with an appropriate adjustment of the fert i le s a l t volume fraction in the flattened zone) would permit a s t i l l larger flattened zone and s m a l l e r Pmax/Pavg, but would be ex- pected t o compromise the reactor performance by increasing the f u e l inventory, at least i f carried too far.
There a r e obviously many possible combina- tions of parameters to consider. I t is not a priori obvious, for example, whether t he flattened zone should have the same height-to-diameter ratio as the entire core, o r whether the ax ia l buckled zones should have the s a m e composition as the radial buckled zone. While we have by no means carried the investigation of these ques t ions as far as we need to, we have gone fat enough to recognize seve ra l important a spec t s of the problem.
F i r s t , by flattening the power to various degrees in the radial direction only and performing fuel- cyc le and economic ca lcu la t ions for each of t hese c a s e s , we find tha t the radial power distribution can be markedly flattened with very l i t t l e e f fec t e i ther on fuel c o s t or on annual fuel yield, our
-,
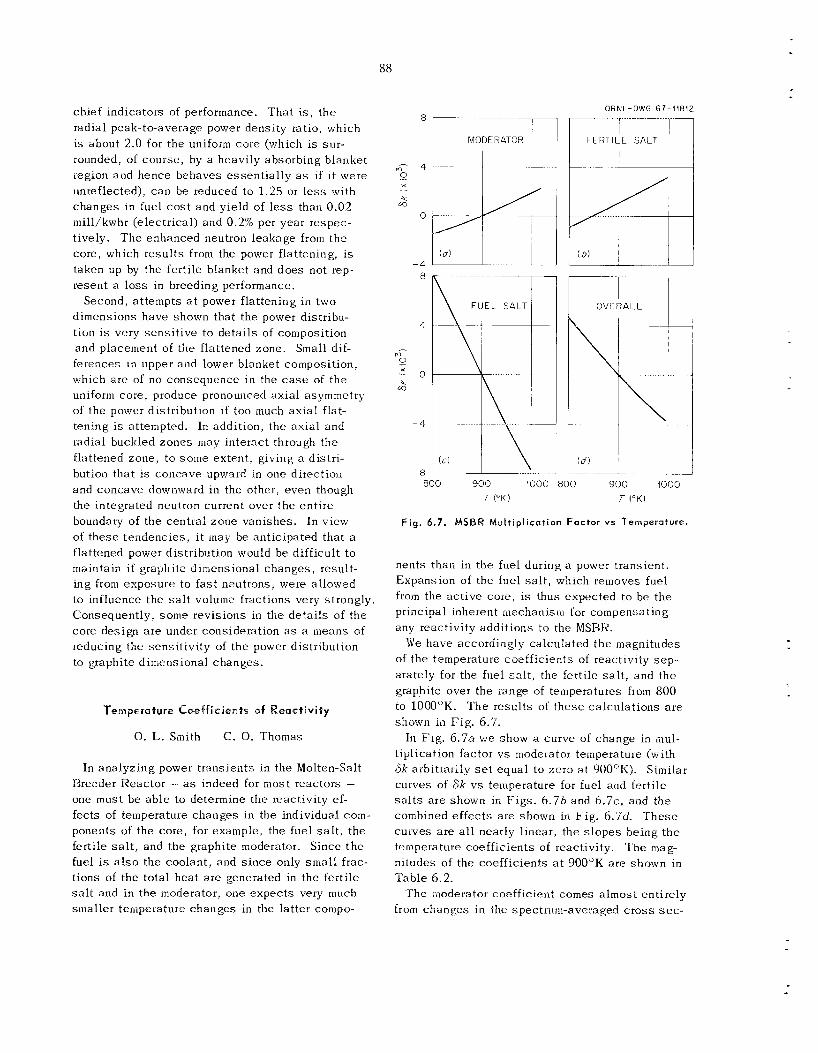
88
chief indicators of performance. That i s , the radial peak-to-average power density ratio, which i s about 2.0 for the uniform core (which i s su r - rounded, of course , by a heavily absorbing blanket region and hence behaves essent ia l ly as if it were unreflected), can be reduced to 1.25 or l e s s with changes in fuel c o s t and yield of l e s s than 0.02 mill/kwhr (electrical) and 0.2% per year respec- tively. T h e enhanced neutron leakage froin the core, which resu l t s from the power flattening, is taken up by the fert i le blanket and does not rep- resent a lo s s in breeding performance.
Second, attempts a t power flattening in two dimensions have shown that the power distribu- tioil is very sens i t i ve t o de ta i l s of composition and placement of the flattened zone. Small dif- ferences in upper and lower blanket composition, which are of no consequence in the case of t he uniform core, produce pronounced ax ia l asymmetry of the power distribution if too much ax ia l flat- tening is attempted. In addition, the ax ia l and radial buckled zones may interact through the flattened zone, to some extent, giving a distri- bution that i s concave upward in one direction and concave downward in the other, even though the integrated neutron current over the en t i re boundary of the central zone vanishes. In view of these tendencies , i t may be anticipated that a flattened power distribution would be difficult to maintain if graphite dimensional changes , result- ing from exposure to f a s t neutrons, were allollied to influence the s a l t volume fractions very strongly Consequently, s o m e revisions in the de ta i l s of the core design a r e under consideration as a means of reducing the sensit ivity of the power distribution to graphite dimensional changes.
Temperature Coefficients ob React ivi ty
0. L. Smith C. 0. Thomas
In ana lyz ing power transients in the Molten-Salt Breeder Reactor ... as indeed for most reactors - one must b e ab le to determine the reactivity ef- fects of temperature changes in the individual com- ponents of the core, for example, the fuel s a l t , t he fertile s a l t , and the graphite moderator. Since t h e fuel is a l s o the coolant, and s ince only sma l l frac- tions of the total hea t are generated in the fert i le s a l t and i n the moderator, one expec ts very much smaller temperature changes in the latter compo-
I
m 0 x ._ -t a
8
4
I
m 0 x o t a
-4
-8
OR N L- DWG 6 7- 1 I8 I2 . . . . . . . . . . . . . -
MObERATOR r1
800 900 1000 800 900 (000 T (OK) r ( O K )
Fig. 6.7. MSBR Mult ipl icat ion Factor vs l e m p e r o t u r e .
nents than in the fuel during a power transient. Expansion of the fuel s a l t , which removes fuel from the ac t ive core, i s thus expected to be the principal inherent mechanism for compensating any reactivity addi t ions to the MSBK.
W e have accordingly calculated t h e magnitudes of the temperature coefficients of reactivity sep - arately for the fuel s a l t , the fertile s a l t , and the graphite over the range of temperatures from 800 to 1000°K. T h e results of these ca lcu la t ions are shown in Fig. 6.7.
In Fig. 6.7a we show a curve of change in mul- t iplication factor v s moderator temperature (with 6k arbitrarily s e t equal to zero a t 900OK). Similar curves of Bk v s temperature for fuel and fert i le s a l t s a r e shown in F igs . 6.7b and 6.7c, and the combined e f f ec t s are shown in Fig. 6.7d. T h e s e curves a r e a l l nearly linear, the s l o p e s being t h e temperature coefficients of reactivity. T h e mag- nitudes of the coefficients a t 900OK are shown in Table 6.2.
'The moderator coefficient c o m e s almost entirely from changes in the spectrum-averaged cross sec-
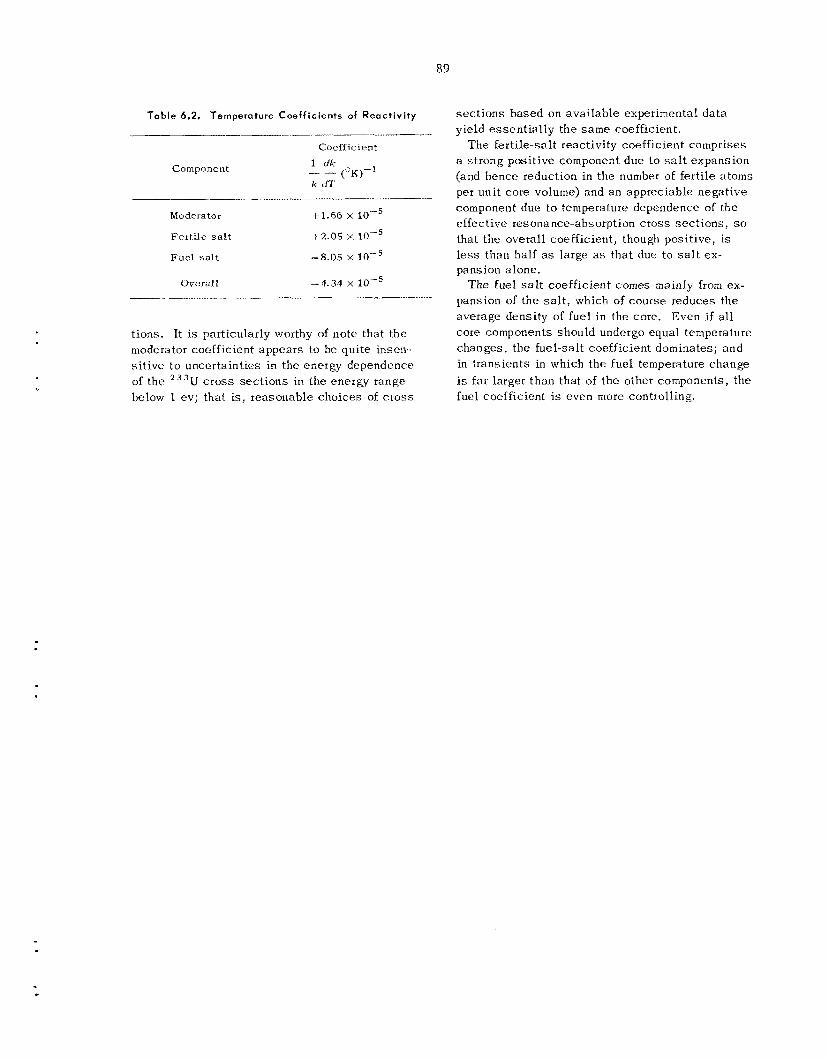
T a b l e 6.2, Temperature Coef f ic ients of React iv i ty
Component
Coefficient 1 dk
k dI _I ("K)-'
Moderator +1.66 x
F u e l salt --8.0s x
Overall -4.34 x
Fertile salt -t 2 .05
t ions. It is particularly worthy of note that t he moderator coefficient appears to be qui te insen- s i t i ve to uncertainties in the energy dependence of the 2 3 3 U cross sec t ions in the energy range below 1 ev; that i s , reasonable choices of c r o s s
sec t ions based on ava i lab le experimental da t a yield e s sen t i a l ly the s a m e coefficicnt.
The fert i le-salt reactivity c o e f f m e n t comprises a s t rong posit ive component due to salt expansion (and hence reduction in the tiumbpr oE fert i le atoms per unit core volume) and a n appreciable nega t ive component due to temperature dependence of the effective resonance-absorption cross sec t ions , so that the ovcrall coefficient, though posit ive, is less than half as large as tha t due to s a l t ex- pansion a lone .
pansion of the s a l t , which of course reduces t h e average density of fuel in the core. Even if a l l core components should undergo equal temperature changes , t he fuel-salt coefficient dominates, and in t rans ien ts in which the fuel temperature change is far larger than that of the other components, t he fuel coefficient is even more controlling.
The fuel s a l t coefficient c o m e s mainly from ex-
Dunlap Scott
Work related to the Molten-Salt Breeder Reactor was init iated during th i s period. Studies were made of the problems related to the removal of the noble gases from the circulating s a l t t o he lp identify the equipment and sys t ems required to keep the '35Xe poison fraction and t h e f i ss ion product afterheat t o an acceptab le level. Prepara- t ions were begun for operation of a small out-of- pile loop in which a molten s a l t will b e circulated through a graphite fuel cell and for operation of an isothermal MSRE-scale loop with sodium fluoro- borate.
T h e major effort of t h e program a t t h i s t i m e is to he lp e s t ab l i sh the feasibil i ty of improved concepts and to define problem areas . Since the production of su i tab le and reliable s a l t pumps is one of the longes t lead-time i tems for molten-salt reactors, a major emphasis i s being placed on t h i s program.
Some of the work related to problems of the
graphite and other s i n k s in the MSRR. The s ink terms considered are:
1. Decay
2. Eurnup - t akes p lace in the graphite and in the fuel s a l t passlrig through t h e core.
3. Migration to graphite - t h e s e g a s e s ultimately decay or a re burned up.
4. Migration to circulating bubbles ...- t hese gases are stripped from t h e fuel loop to go t o the off-gas system.
Two source t e r n s a re considered: generation directly f rom f i ss ion , which i s assuined to occur only in the core, and generation f rom decay of the precursor, which OCCUKS throughout t h e fuel loop. The model is based on conventional iiiass transfer concepts, Some degree of s u c c e s s has beeil ex- perienced with similar models developed for the MSKE, for example:
MSBR but actually performed on the MSRE is 1. Xenon-135 poison fraction calculations. T h e d i scussed in the MSRE sec t ion of th i s report. The other work i s described below.
s teady-s ta te model is developed in ORNL-4069. Resu l t s of the time-dependent form of the model are summarized in OKNL-TM-1796.
7.1 NOBL E-GAS AVlQR Ira THE MSBR
R. J. Ked1
In the MSBR conceptual des igns , t he graphite i n t h e reactor core is unclad and in intimate contact with fuel sa l t . Noble g a s e s generated by fission and any gaseous compounds c a n d i i fuse from the s a l t into the porous structure of the graphite, where they will s e rve as hea t sources and nuclear poisons.
to compute the migration of noble g a s e s to the A s teady-s ta te analytical model was developed
2. A model was developed t~ compute the con- centrations of daughters of very short-lived noble g a s e s in graphite (QRNL-TM-1810). Computed concentrations check very well with measured va lues .
With th i s model, s teady-s ta te l 3 5Xe poisoning calculations have been made for the MSBR [556 Mw (thermal) fueled with 2 3 3 U and moderated with unclad graphite) to show the influence of various design parameters involved. T h e reactor con- sidered here i s essent ia l ly tha t described in ORNL-3996 [P. FZ. Kasten ef a]., Design Studies of 1000-Mw (e) Molten-Salt Breeder Reactors], with spec i f ic design parameters as l i s ted in 'Table 7.1.
90
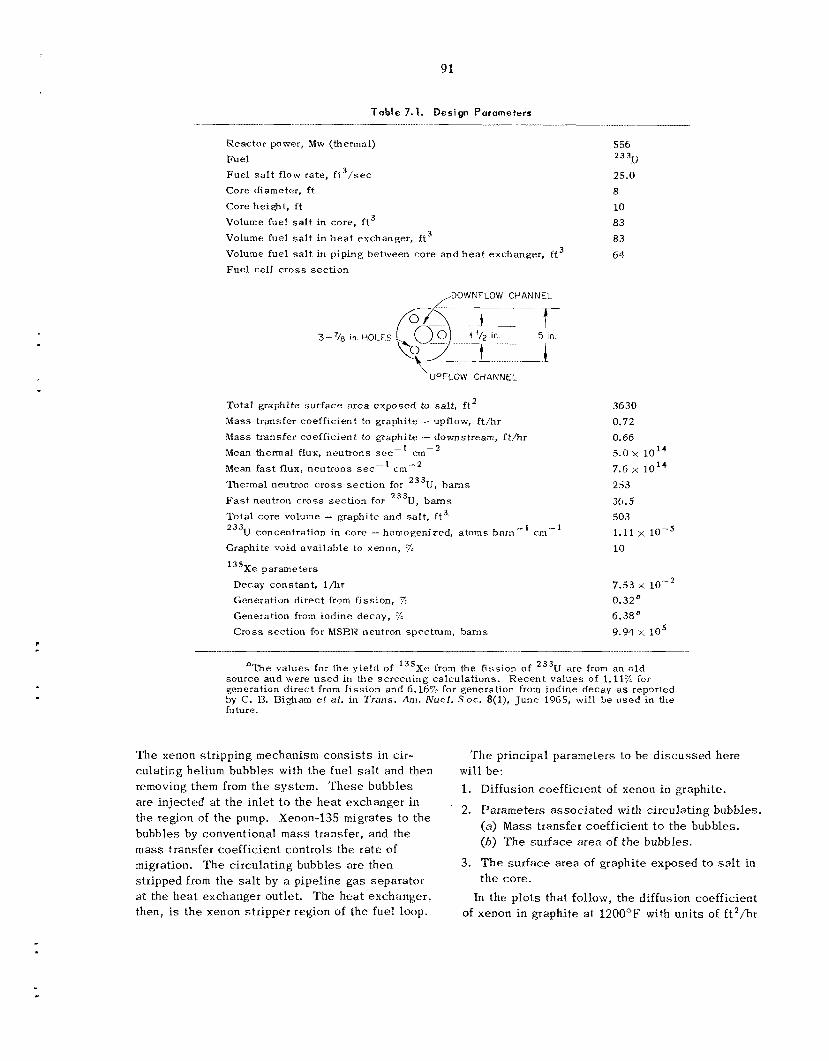
91
Table 7.1. Design Parameters -. .... __ ......... ................. .......
Reactor power, Mw (thermal) Fuel Fuel s a l t flow rate, f t 3 / sec Core diameter, f t Core height, f t Volume fue l s a l t in core, f t3 Volume fuel s a l t in h e a t exchanger, f t 3 Volume fue l s a l t in piping between rore and h e a t exchanger, f t 3 Fuel ce l l c ross sec t ion
,DOWNFLOW CHANNEL
‘UPFLOW C H A N N E L
Total graphite sur face a rea exposed to salt , f t 2 Mass transfer coefficient to graphite - upflow, ft/hr Mass transfer coefficient to graphite - downstream, f t /hr Mean thermal flux, neutrons sec-’ cm-’
Mean fa s t flux, neutrons sec - ‘ crn-’
Thermal neutron c ross sec t ion for 233U, barns F a s t neutron c ross sec t ion for 233U, barns Total core volume - graphite and salt, ft3. 233U concentration in core - homogenized, atoms barn-’ Graphite void available to xenon, 75
13’xe parameters Decay constant, l / h r Generation direct from fission, 70
Generation from iodine decay, % Cross section for MSRR neutron spectrum, barns
5 56 2 3 3 u
25.0 8 10 83 83 61
3630 0.72 0.66 5 . 0 ~ 1014 7.6 x 10¹⁴ 253 3G.5 503 1.11 -1 cm 10
7.53 x 0.32a G.38a 9.94 x los
aThe values for the yield of 13’Xe from the fission of 233U are from an o ld source and were used in the screening calculations. Recent values of 1.11% for generation direct from fission and 6.16% for generation from iodine decay a s reported by C. H. Bizham et al . in Trans. Am. Nucl. S o c . 8(1), June 1965, will be user? in the future.
The xenon s t r ipping mechanism c o n s i s t s in cir- culat ing helium bubbles with the fue l salt and then removing them from t h e system. T h e s e bubbles are injected at the inlet t o the heat exchanger in the region of the pump. Xenon-135 migrates to the bubbles by conventional m a s s transfer, and the mass transfer coefficient controls the ra te of migration. The circulat ing bubbles are then stripped from the s a l t by a pipeline g a s separator a t the h e a t exchanger outlet. The hea t exchanger , then, i s the xenon s t r ipper region of the fue l loop.
T h e principal parameters to b e d iscussed here will be: 1. Diffusion coefficient of xenon in graphite.
2. Parameters assoc ia ted with circulat ing bubbles. (a) Mass transfer coefficient to the bubbles. (b ) The surface a rea of the bubbles.
3. T h e surface a rea of graphite exposed to s a l t in the core.
In the p lo ts that follow, the diffusion coefficient of xenon in graphite a t 120Q°F with uni ts of f t2/hr
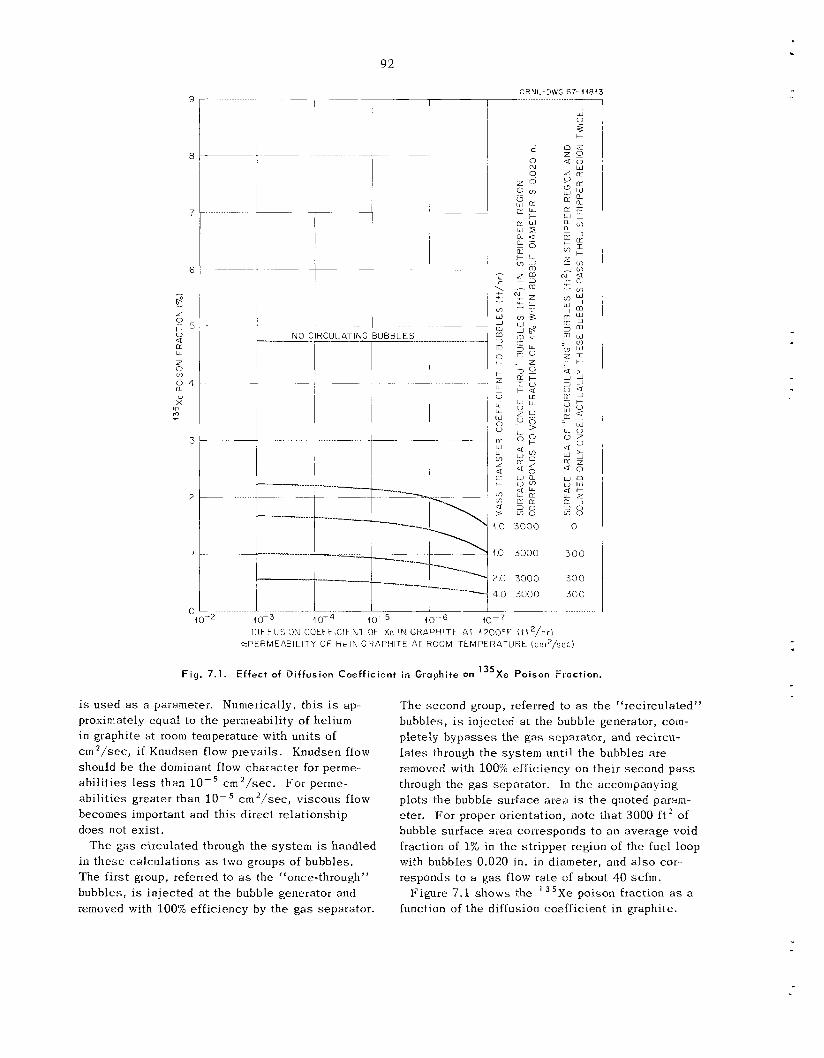
0 R N L-- DWG 67- .I 18 1 3
I -
92
I I
NO ClRCUl ATING BUBBLES -Clt et- - 1
1.0 3000
1.0 3000
2.0 3000
4.0 3000
OlFFUSlON COEFFICIENT OF Xe I N GRAPHITE 47 1200°F ( t t ‘ / h r ) -PERMEABIL ITY OF He IN GRAP! i lTE AT ROOM TEMPERATURE (cm2/sec)
Fig. 7.1. E f fec t of Dif fusion coef f ic ient in Graphite on 13’Xe Poison Fract ion.
is used a s a parameter. Numerically, th i s is ap- proximately equal to the permeability of helium in graphite at room temperature with uni t s of cm2/sec, i f Knudsen flow prevails. Knudsen flow should b e the dominant flow character for perme- ab i l i t i es less than lo-’ cm2/sec. For perme- abil i t ies greater than l o p 5 cm2/sec, v i scous flow becomes important and th i s direct relationship does not ex is t .
in t hese calculations as two groups of bubbles. The first group, referred to a s the “once-through” bubbles, is injected a t the bubble generator and removed with 100% efficiency by the g a s separator.
T h e gas circulated through the system is handled
The second group, referred to as the “recirculated” bubbles, is injected a t the bubble generator, com- pletely h y p a s s e s the g a s separator, and recircu- l a t e s through t h e sys tem until the bubbles a r e removed with 100% efficiency on their second p a s s through the g a s separator. In the accompanying plots the bubble sur face area is t h e quoted param- eter. Fo r proper orientation, note that 3000 f t 2 of bubble sur face aiea corresponds to an average void fraction of 1% in the stripper region of the fuel loop with bubbles 0.020 in. in diameter, and also cor- responds to a gas flow rate of about 40 scfin.
function of t h e diffusion coefficient i n graphite. Figure 7.1 shows the ‘ 3 5 X e poison fraction as a
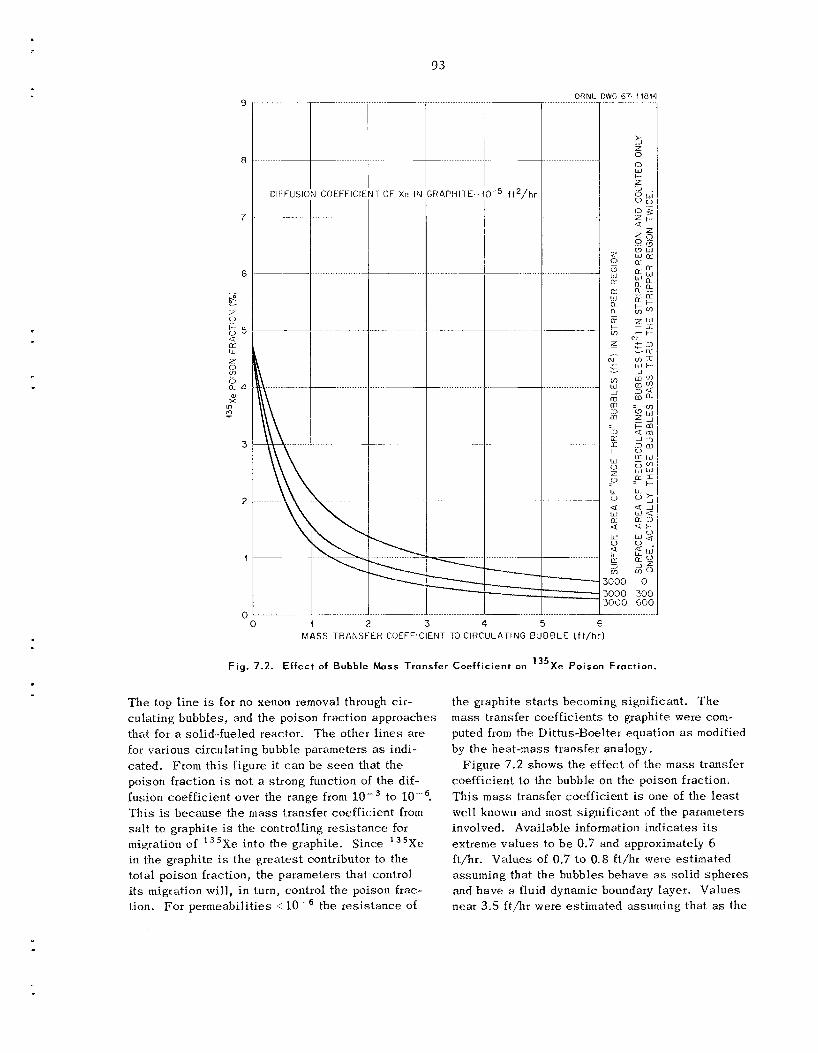
93
DIkFU5ION COLCFICILN l OF XP IN
--! I
DIFFUSION COEFFlClENl- OF X e IN
~.
..__.____....... ~~~~I ........... I .......
RAPI-IITE- ft2/hr I
=i:% % j . .. . .. . . . .. .. . . . . . . . . .
0 i 2 3 4 5 F MASS TRANSFEH COEFFICIENT TO C l R C U C A l l N G OUBBLE ( f t / h r l
Fig. 7.2. Effect of Bubble Mass Transfer Coeff ic ient on 135Xe Poison Fraction.
T h e top line is culating bubbles, and the poison fraction approaches that for a solid-fueled reactor. The other l ines are for various circulat ing bubble parameters as indi- cated. F r o m th is figure it c a n b e s e e n that the poison fraction is not a strong function of the dif- fusion coefficient over the range from T h i s is because the mass transfer coefficient from s a l t to graphite i s the controll ing res i s tance for migration of 13’Xe into the graphite. Since l J s X e in the graphite i s the grea tes t contributor to the total poison fraction, the parameters that control i t s migration will, in turn, control t h e poison frac- tion. For permeabili t ies -: the res i s tance of
)r no xenon removal through cir-
to
the graphite s t a r t s becoming significar. .. The m a s s transfer coefficients to graphite were com- puted from the Dittus-Boelter equation as modified by the heat-mass transfer analogy.
Figure 7.2 shows the effect of the m a s s transfer coefficient to the bubble on the poison fraction. T h i s m a s s transfer coefficient is one of the leas t well known and most s ignif icant of the parameters involved. Available information indicates its extreme va lues to be 0.7 and approximately 6 f t /hr . Values of 0.7 to 0.8 f t /h r were estimated assuming that the bubbles behave a s sol id spheres and have a fluid dynamic boundary layer. Values near 3.5 ft/lir were est imated assuming that a s the
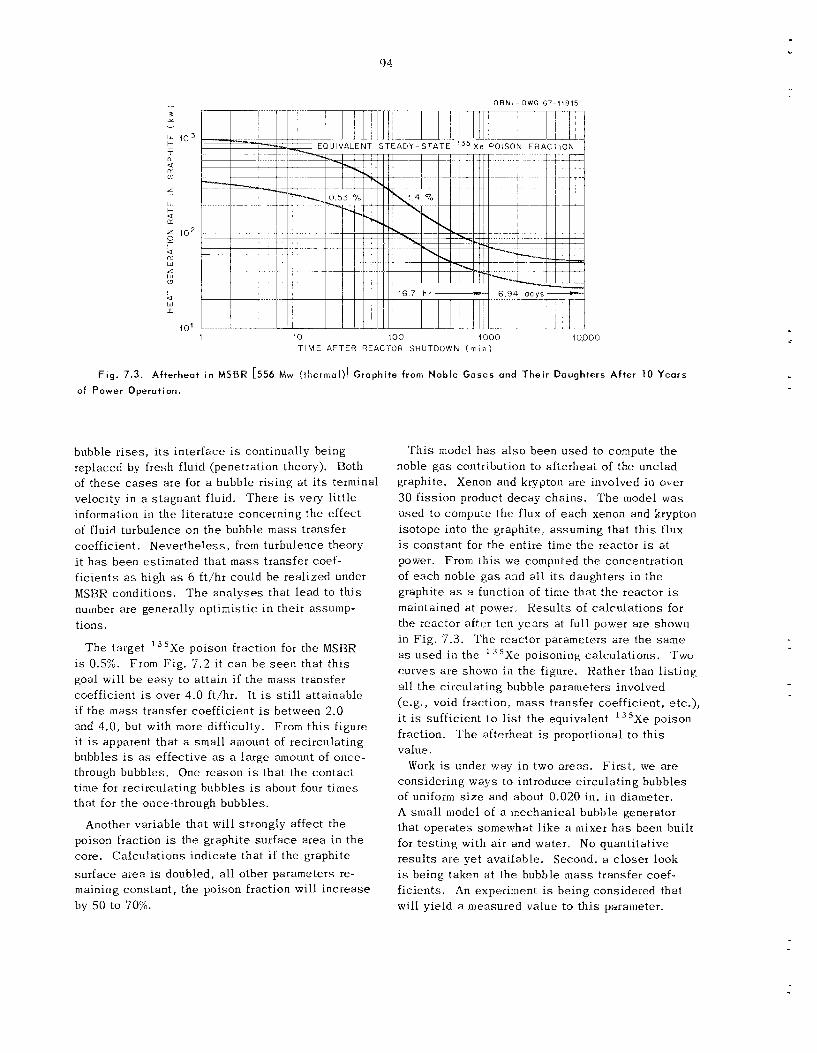
94
O R N L - O W G 67-(1815
L-
a r w
io ‘ 1 10 100 io00 10.000
T I M E AFTER R E A C l O R SHUTDOWN ( m l n )
F i g . 7.3. Afterheat i n MSBR [556 Mw (thermal)] Graphite from Noble Gases and Their Daughters After 10 Years
of Power Operation.
bubble r i s e s , i t s interface is continually being replaced by fresh fluid (penetration theory). Both of these cases are for a bubble rising a t its terminal velocity in a s tagnant fluid. There is very l i t t l e information in t h e l i terature concerning the effect of fluid turbulence on the bubble mass transfer coefficient. Nevertheless, from turbulence theory it h a s been estimated tha t m a s s transfer coef- f ic ien ts as high as 6 ft/hr could be realized under MSRK conditions. T h e ana lyses tha t l ead to th i s number are generally optimistic i n their assump- tions.
T h e target I3’Xe poison fraction for the MSBR is 0.5%. From Fig. 7 .2 i t can b e s e e n that t h i s goal will be e a s y to attain i f the m a s s transfer coefficient is over 4.0 ft/hr. It is s t i l l at tainable if t he m a s s transfer coefficient is between 2.0 and 4.0, but with more difficulty. From t h i s figure i t is apparent tha t a small amount of recirculating bubbles i s as effective as a large amount of once- through bubbles. One reason i s that the contac t time for recirculating bubbles is about four t imes that for t he once-through bubbles.
Another variable tha t will strongly affect tbe poison fraction is the graphite sur face area in the core. Calcu la t ions ind ica te that i f the graphite surface area is doubled, a l l other parameters re- maining cons tan t , t he poison fraction will increase by 50 to 70%.
T h i s model h a s a l s o been used to compute the noble g a s contribution to afterheat of the unclad graphite. Xenon and krypton are involved in over 30 f i ss ion product decay cha ins . T h e model was used to compute t h e flux of each xenon and krypton isotope into the graphite, assuming that th i s flux is cons tan t for the entire time the reactor is a t power. From th i s we computed the concentration of each noble gas and a l l its daughters i n t he graphite as a function of t i m e tha t t he reactor is maintained a t power, Resu l t s of calculations for the reactor after ten yea r s at full power are shown in F ig . 7.3. T h e reactor parameters a re the same as used in the 13’Xe poisoning calculations. Two curves a r e shown i n t h e figure. Rather than l i s t ing all t h e circulating bubble parameters involved (e.g., void fraction, m a s s transfer coefficient, etc.), i t is sufficient t o l i s t t h e equivalent 13’Xe poison fraction. T h e afterheat is proportional t o th i s value,
considering ways to introduce circulating bubbles of uniform size and about 0.020 in. i n diameter. A s m a l l model of a mechanical bubhle generator that opera tes somewhat l i ke a mixer h a s been built for tes t ing with a i r and water. N o quantitative resu l t s are yet available. Second, a closer look is being taken a t t he bubble m a s s transfer coef- f icients. An experiment is being consideied that will yield a measured va lue to th i s parameter.
Work is under way i n two areas . F i r s t , we a re
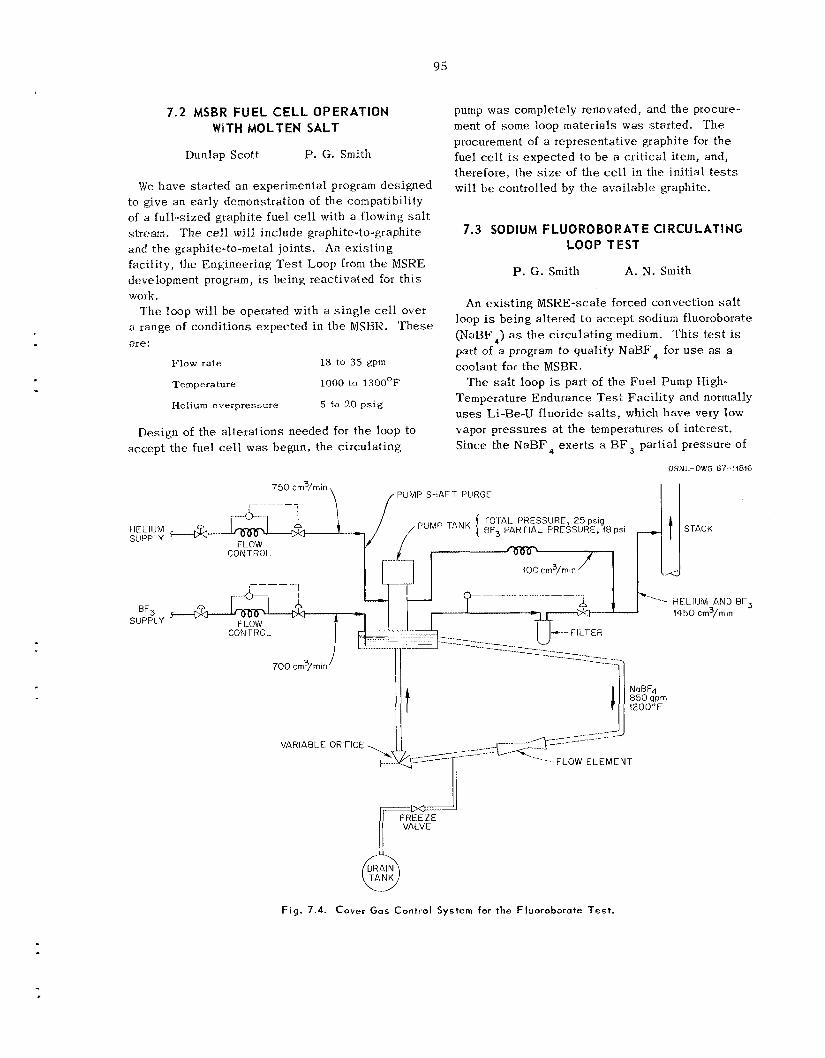
95
7.2 MSBR FUEL CELL OPERATION WITH MOLTEN SALT
Dunlap Scott P. G. Smith
We have s ta r ted a n experimental program designed to give an early demonstration of the compatibility of a full-sized graphile fuel cell with a flowing s a l t s t rcmn. T h e cell will include graphite-to-graphite and the graphite-to-metal joints. An ex is t ing facility, the Engineering Test Loop from the MSKE development program, 1s being reactivated for t h i s work.
a range of conditions expected in the MSBR. 'These are:
T h e loop will b e operated with a s ing le cell over
Flow rate
Temperature
18 to 35 gptn
1000 to 1300°F
Helium overpressure 5 to 20 psig
Design of the a l te ra t ions needed for t he loop to accept the fuel cell was begun, the circulating
750 crn3/rnin
r- --- -- -- - i
HE L llJM SUPPLY FLOW
CONTROL.
ET3 SUPPLY
pump was completely renovated, and the procure- ment of some loop materials was started. T h e procurement of a representative graphite for the fuel cell is expec ted to b e a critical. i t e m , and, therefore, the size of the cell in the in i t ia l t e s t s will be controlled by the available graphite.
7.3 SODIUM FLUOROBORATE CIRCULATING LOOP TEST
P. G. Smith A. N. Smith
An exis t ing WSKE-scale forced convection salt loop is being altered to accept sodium fluoroborate (NaHF,) as the circulating medium. 'This t e s t is part of a program to qualify NaBF, for u s e as a coolant for the MSBR,
The s a l t loop i s part of the Fue l Pump High- Temperature Endurance Test Fac i l i ty and normally uses Li-Be-U fluoride s a l t s , which have very low vapor pressures at the temperatures of interest . Since the NaBF4 exer t s a B F , partial pressure of
PUMP S H A F T PIJRGE
TOTAL PRESSURE, 25 psig BF3 P A R T I A L PRESSURE, 18 psi ,/ ,,PUMP TANK (
ORNL-DWG 67-418%
STACK 4
F i g . 7.4. Cover Gas Control Sys tem for t h e Fluoroborate Test .
96
about 500 mm H g a t t he t e s t operating temperature (1200°F), it will be necessary to maintain an over- pressure of B F 3 in the pump bowl vapor s p a c e t o avoid a loss of BF3 from the s a l t with the resultant increase in s a l t l iquidus temperature. The cover g a s sys tem is being revised to include the neces- sa ry equipment for handling and controlling t h e EF3. 'This system, shown schematically in Fig. '7.4, inc ludes s o m e of the features of the cover g a s sys tem used with t h e MSRE coolant s a l t , and the information developed i n the t e s t will b e useful i n planning the revisions which will be necessary t o prepare for tes t ing of NaBF4 i n t he MSRE coolant system.
'The operating conditions for the loop are:
Temperature 1200°F
Flow rate 800 gpm
Pump head 120 f t
Pump speed 1800 rpm
The tendency of BF organic materials could c a u s e problems i n the pump lubrication sys tem and in the off-gas l ine. The heliuiii purge to the shaf t annulus will be adjusted to minimize diffusion of BF, into the pump bearing chamber, and fi l ters are provided i n the off-gas l ine to protect the pump tank pres- sure control valve. T h e B F 3 flow required will b e dictated by the total pump bowl pressure , the desired BF3 partial pressure, and the required heliuiii purge flow.
It is planned to operate the loop isothermally for a period of about s i x months. T h e objective will b e to uncover any problems assoc ia ted with the circulation of N a B F 4 and to dev i se and t e s t su i tab le solutions or corrective measures.
to induce polymerization of
7.4 MSBR PUMPS
A. G. Grindell
P. G . Smith L. V. Wilson
Survey of Pump Experience C i r c u l a t i n g L iqu id Metals a n d MOltell SlaIt5
A survcy of exper ience with pumps for liquid metals and molten s a l t was made, and a report1
'P. G. Smith, Experience with High-Temperature Centrifugal Punips in Nuclear Reactors arid The i r Application to Molten-Salt Thermal Breeder Reactors , ORNL-'1'M-1993 (September 1967).
w a s i ssued relating pump descriptions, operating hours, and the problems encountered during oper- ation.
Introduction o f MSBW Pump Program
The objec t ives of the s a l t pump program for t h e MSBR include the production of suitable and reli- ab le pumps for the fuel, blanket, and coolant s a l t circuits of the Molten-Salt Breeder Experiment (MSRE) and i t s nonnuclear prototype, the Engi- neering T e s t Unit ( E T U ) . Table 7 .2 presents t he pump requirements as they are presently envi- sioned. A s ing le conditional objective requires that the pumps developed for the MSBE should b e capable of flow capacity scale-up by a factor of approximately 4 to the 550-Mw (thermal) MSBR with l i t t l e or no additional development work.
Our approach is to invite the strong participa- tion of U.S. pump industry in the design, develop- ment, and production of t hese pumps. We will prepare pump spec i f ica t ions along with a preliini- nary pump assembly drawing, pertinent rotor- dynamic and hea t transfer ana lyses , and the re- su l t s of a survey of fabrication methods for s u h - mission to pump manufacturers. T h e pump maiiu- facturers would be asked to make an independent ana lys i s of the pump specifications arid support- ing material and to def ine a l l the changes and im- provements they believe necessary. Parentheti- cally, it may prove necessary to pay for severa l independent ana lyses . T h e pump inaiiufacturers would then b e asked to bid on the production of the detailed pump des ign and shop drawings, t he fabrication and assembly for shop inspection of the required quant i t ies of sa1.t pumps, and the shipment of d i sassembled pumps to ORNL for further testing.
Two important implicit requirements a re pro- vided i n th i s approach. T h e individual pump configurations are matched to the various MSRE sys tems requirements by and a t ORNL, and the responsibility for approval of t he final pump de- sign and the de ta i led drawings res t s with ORNL.
T h e principal pump components requiring de- velopment effort are the molten-salt bearing, if used, the shaf t s e a l , and a full-scale rotor-dynamic simulator, i f supercrit ical operation of a s a l t pump is required, tha t is, operation of the pump a t speeds above the first cri t ical shaft speed. pump manufacturers would be invited to partici- pate in th i s and other development work they may
T h e
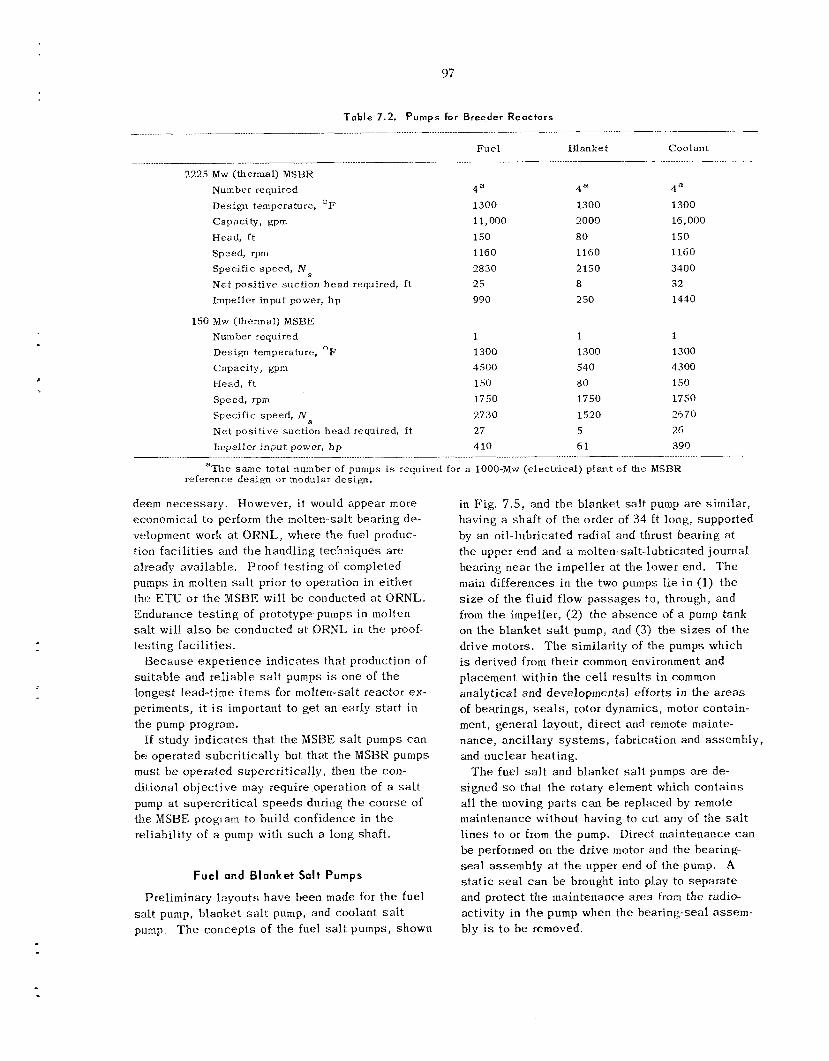
97
Table 7.2. Pumps f o r Breeder Reactors .... ~~ ......... ___-..__ ........__I ... -.........I_____.........
Fue l Hlanke t Coolant .........___I__ ......... _ _ _ _ ~ .......... ___-__- ............ __-~- - ... -. ......... .......
2225 M w (thermal) MSBR Number required 4” .la 4 * Design temperature, O F 1300 1300 1300
Head, f t 150 RO 150
Capacity, gpm 11,000 2000 16,000
Speed, rprn 1160 1160 1160 Specific speed, N 2830 2150 3400 N e t positive suction head required, f t 25 8 32 Impeller input power, hp 990 250 1440
150 Mw (thermal) MSBE Number required 1 1 1 Design temperature, O F 1300 1300 1300 Capacity, gpm 4500 540 4300 Head, f t 150 80 150 Speed, rpm 1750 1750 17.50 Specific speed, N 2730 1520 2670 Net positive suction head required, f t 27 5 26 Impeller i n p u t power, hp 410 61 390
........... ___ .... __ .............. ___.--- . ~ ....... .......... ........ ...............
I’he same total number of DUIIIPS is reauired f o r a 1000-Mw (electrical) plant of the MSRR a, - - reference desiw or nodular design.
deem necessa iy . However, i t would appear more economical to perform t h e molten-salt bearing de- velopment work a t O I I N L , where the fuel produc- tion fac i l i t i es and the handling techniques a re already available. Proof tes t ing of completed pumps in molten s a l t prior to operation in either tlw ETU or the MSBE will be conducted a t ORNL. Endurance t e s t ing of prototype pumps in molten salt will also b e conducted a t ORNL in the proof- tes t ing fac i l i t i es .
Because exper ience ind ica tes that production of su i tab le and re l iab le s a l t pumps is one of t h e longest lead-time i t ems for molten-salt reactor ex- periments, it is important to get an early s ta r t i n the pump program.
If study ind ica tes tha t the NISBE s a l t pumps c a n b e operated subcr i t ica l ly but that t he MSBR pumps must b e operated supercrit ically, then the con- ditional ob jec t ive may require operation of a s a l t pump a t supercr i t ica l s p e e d s during the cour se of the MSBE program to build confidence in t h e reliability of a pump with such a long shaf t ,
Fuel and Blanket Salt Pumps
Preliminary layouts have been made for t he fuel s a l t pump, blanket s a l t pump, and coolant s a l t pimp. T h e concepts of the fuel s a l t pumps, shown
in Fig. 7.5, and the blanket s a l t pump a re similar, having a shaf t of the order of 34 f t long, supported by an oil-lubricated radial and thrust bearing at the upper end and a molten-salt-lubricated journal bearing near t he impeller at the lower end. T h e main differences in the two pumps l ie i n (1) t h e size of the fluid flow p a s s a g e s to, through, and from t h e impeller, (2) t h e absence of a pump tank on the blanket salt pump, and ( 3 ) t he s i z e s of the drive motors. T h e similarity of the pumps which is derived from their common environment and placement within t h e ce l l resu l t s i n common analytical and developmental efforts i n the a r e a s of bearings, s e a l s , rotor dynamics, motor contain- ment, general layout, direct and remote mainte- nance, ancil lary sys t ems , fabrication and assembly , and nuclear heating.
T h e fuel s a l t and blanket s a l t pumps are de- signed so that t h e rotary element which conta ins all t he moving par t s can be replaced by remote maintenance without having to cut any of the s a l t l ines to or from the pump. be performed on the drive motor and the bearing- seal assembly at the upper end of t he pump. A s t a t i c s e a l c a n b e brought into play to sepa ra t e and protect the maintenance a rea from the radio- activity in t h e pump when the bearing-seal assem- bly is to b e removed
Direct maintenance c a n

98
1 I
I
1
1
MOTOR
COUPLING
d W E R BEARING AND SFAl ASSEMBLY
BILLOWS
CONCRETE SkIELD:NG
PUMP TANK
MO! TEN SA1.T BEARING
lNDELLER
HFAT tXCHANGCR
Fig. 7.5. Preliminary Layout of the MSBR F u e l Sa l t Pump.
99
Nuclear hea t ing of the pump tank and the sup- port structure within the pump tank i s removed by circulating a portion of the fuel salt from t h e main salt stream over the hea ted surfaces. To remove the nuclear heat from the shaf t , a small amount of salt is bled up t he center of the shaf t and fed in to an annulus between the shaft and a cooling tube that ex tends the length of the pump tank. A labyrinth seal a t t h e lower end of t he tube forces most of the salt to flow to the upper end of t he tube, where it s p i l l s over into the pump tank. An added benefit is t h e increased damping and s t i f fnes s provided to the shaf t by the salt i n the annulus.
in t ha t portion of t h e pump cas ings and shaf t for which no cooling is provided. i f a problem is found, w e c a n provide cooling or shielding and thermal insulation where needed to reduce the hea t generation in the pump structure to an ac- ceptable level.
T h e seal arrangement a t the upper end of the shaf t i s similar t o tha t used in the MSRE s a l t pumps. I t c o n s i s t s of a face-type seal (Craphitar against tool steel) with the lubricating oil on o n e s ide and the helium in the shaf t annulus on the other. Helium is brought into the annulus to s e r v e as a sp l i t purge between the s a l t and gaseous f i ss ion products a t the lower end of the shaft and m y lubricating o i l that l e a k s through the face s e a l into a leak-off l ine. P a r t of the helium p a s s e s down the shaf t through a close-fi t t ing labyrinth, where the increased g a s velocity reduces the upward diffusion of molten-salt vapor and gaseous fission products. Concurrently, that portion of the helium pass ing upward through the labyrinth s e a l prevents t he downward movement of lubricating o i l vapors and a l s o serves to scavenge o i l l eakage and vapors overboard f rom the pump.
Analyses a r e be ing made of the nuclear hea t ing
Coolant Salt Pumps
Two preliminary layouts of the XSBR coolant salt pump have been prepared. One layout u t i l i ze s a pump with a shor t overhung shaft mounted on two oil-lubricated irolling element bearings, and the other is a long shaf t with an oil-lubricated bearing a t the top end of the shaf t and a molten-salt bearing loca ted jus t above the impeller. One criterion for the pump requires variable-speed op- eration over t h e range 300 to 1200 rpm. T h e dif-
ficulty with t h e short-shaft pump is that to have the pump opera te below the first cri t ical speed , the shaf t diameter would have to be greater than 8 in. , which would present a formidable seal dc- sign and development problem. If i t were des igned to operate above the first cri t ical and below the second cr i t ica l speed , the shaft diameter would b e approximately .3 in. , which is inadequate to trans- mit t h e torque. Fo r the long-shaft pump configu- ration, however, a shaf t with a diameter s e l ec t ed on the b a s i s of torque requirements would have a first c r i t i ca l speed well above the maximum oper- a t ing speed . T h e long-shaft pump would also u s e the same upper bearing and s e a l configuration planned for the fuel and blanket salt pumps. Hence the long-shaft concept appears to b e preferable for the coolant pumps.
The coolant s a l t pump will have the impeller and volute mounted in a pump tank of sufficient volume to accommodate the thermal expansion of thc cool- ant s a l t for the most adverse thermal condition tha t might a r i s e during reactor operation. A double vo- lute pump cas ing h a s been se lec ted to reduce ra- dial l oads on t he impeller and the resultant l o a d s on the molten-salt bearing, particularly when op- erating at off-design conditions, and to reduce the diameter of the bridge tube, which provides a flexible connection from the volute to the pump tank nozzle.
We believe tha t t h e coolant pump drive motor, although having a greater horsepower, c a n b e de- signed to fi t t h e same containment ves se l as that for the fuel pump drive motor.
Water Pump Test Facility
Preliminary layouts have been prepared of a facility for t e s t ing the fuel pump with water. T h e configuration d o e s not incorporate the long s h a f t of the high-temperature pump but only mocks up those portions which affect the fluid flow. T h e layout also inc ludes a moclrup of the inlet to the hea t exchanger tube s h e e t with sufficient instru- mentation to monitor the flow distribution in the hea t exchanger tubes . T h e distribution of the gas injected to remove the xenon will b e monitored a l so .
water t e s t ing of the blanket pump in the same facility. T h e purpose of the water t e s t facility i n the pump development program is (1) to determine
T h e configuration h a s been designed to permit
100
head and flow charac te r i s t ics of the impeller- diffuser des ign , (2) to measure radial hydraulic forces ac t ing on the impeller (needed for designing the molten-salt bearing), ( 3 ) to measure and re- duce to an acceptab le leve l the axial forces ac t ing on the impeller, and to determine the relationship between the ax ia l c learance at the bottom end of the impeller and the ax ia l force, (4) to observe the fluid behavior in the pump tank, and to make the necessary changes to reduce gas entrainment to an acceptab le level, (5) to assure that the mocked-up molten-sal; bearing will run submerged under a l l operating conditions, and (6) to check the point of cavitation inception and the required net pos i t ive suc t ion head of the impeller.
Molten-Salt Bearing Tests
T h e present layouts of the MSBE and MSRR sa l t pumps require a molten-salt journal bearing near the impeller. A molten-salt bearing p resen t s three important considerations: (1) the hydro- dynamic design of the bearing to provide the requisite lubricating film, (2) the se lec t ion of the kind and form of the bearing materials, and ( 3 ) the design of a hearing mounting arrangement which will preserve the lubricating f i l m desp i t e thermal distortions between pump shaft and cas ings .
coatings on the journal and bearing surfaces. Such coa t ings present advantages over the sintered, solid-body journal and bearing inser t s most often used i n high-temperature process fluid lubrication. T h e hard coa t ings a re convenient to apply and hopefully eliminate the differential thermal expansion problems. Mechanical Tech- nology, Inc. , of Latham, New York, h a s been engaged to produce Hastelloy N specimens with each of four different hard coatings: (1) cobal t ( 6 to 8%) bonded tungsten carbide, (2) nickel (mj bonded tungsten carbide and mixed tungsten- chromium carb ides , ( 3 ) nickel.-chromium (15%) bonded chromium carbide, and (4) molybdenum (7%) bonded tungsten carbide.
‘These coa t ings will be subjected to corrosion and thermal cyc l ing t e s t s i n molten s a l t a t ORNL. A t e s t in molten s a l t will be made with a 3 x 3 in. bearing u s i n g o n e of these coatings, if o n e should prove satisfactory.
A layout is being made of a tes te r to accom- modate a fu l l - sca le molten--salt bearing for t he
W e are studying the u s e of hard, wear-resistant
MSBE fue l s a l t pump. T h e tes te r will be capab le of subjec t ing the bearing and i t s mounting arrange- ment to s ta r t - s top wear t e s t s and thermal cyc l ing and endurance t e s t s i n molten sa l t .
Rotor- Dynami c s Feosi bi I ity investigation
Mechanical Technology, Inc., i s performing an ana lys i s (Reactor Division subcontract No. 2942) of the rotor dynamics of the preliminary layout of the MSBR fuel s a l t pump to determine i t s flexural. and torsional c r i t i ca l speeds and flexural response to a dynamic unbalance. Interim results’ of the ana lys i s show that the pump will operate between the fourth and fifth flexural cri t ical s p e e d s of the pump sys tem, which includes the pump shaf t , inner and outer pump cas ings , and the drive motor. T h e third and fifth sys tem cr i t ica l s a re e s sen t i a l ly the first and second simply supported beam criti- ca l s of the shaft . T h e cri t ical-speed resu l t s also show that the pump-system cr i t ica l s are relatively independent of the hearing s t i f fness over a range representative of practical bearing designs. T h e s t i f fness charac te r i s t ics of the drive motor coupling also have l i t t l e effect on sys tem cii t i- ca l s .
from a “bowed-shaft” unbalance condition have been ca lcu la ted over the complete range of pump speeds , T h e response resu l t s show only one sys - tem crit ical to b e significant from a bearing load standpoint ..- namely, t he “first shaft cri t ical” which occurs a t ahoiit 700 rpm.
In addition to pas s ing through one shaft c r i t i ca l speed , three additional system cr i t ica l s must b e traversed as the pump acce lera tes to design speed . These three c r i t i ca l s a r e basically cantilever resonances of the outer casing. The first two cantilever inodes occur a t quite low speeds and hence should not be a problem from a s teady-s ta te standpoint. However, if t he pump system should be transiently exc i ted during normal operation, these cantilever beam modes would be the primary contributors t o the result ing transient vibration response of t h e pump sys tem.
T h e third cantilever beam mode of the outer cas ing a l s o e x c i t e s a simply supported resonance of the inner cas ing . T h i s mod:: occurs between
T h e synchronous response amplitudes resultiiig
‘P. W. Curwen, Rotor-Dynamic Feas ib i l i t y S tudy of Molten S a l t Pumps for MSBR Power Plants, MTI-67TR48, Mechanical Technology, Inc. , August 6 , 1067.
10 1
800 and 930 rpm and makes i t appear advisable to separate the inner and outer casing frequencies by sui table changes in the wall th icknesses and diameters of the two cas ings .
A preliminary undamped torsional cri t ical-speed analysis h a s been made for the pump system, and the resu l t s indicate that the two torsional c r i t i ca l speeds that might affect pump operation can be strongly dependent upon the electromagnetic torsional s t i f f n e s s of the drive motor. W e bel ieve that by changing some of the component dimensions and accounting for inherent system damping, the pump will operate sat isfactor i ly between the f i rs t and second torsional cr i t ical speeds .
Fabrication Methods Survey. - Based on the preliminary layout of the MSBK fuel s a l t pump, the shaf t and inner and outer cas ings were detai led, and a survey is being made of potential fabrication methods to identify fabrication problems. For t h e shaft, i t i s important t o determine the s t ra ightness and concentricity tolerances that can be supplied. T h e s e tolerances have considerable effect on the provisions that must be made for the dynamic balancing of the shaf t , which must b e done rather precisely when the pump is to operate above the first shaf t c r i t i ca l speed. A manufacturer w a s found who could fabricate s h a f t s in the range 7 to 10 in. outs ide diameter with a wall thickness as s m a l l as '4 in., and who would guarantee the s t ra ightness from end to end to 0.005 total indi- cator reading (TIR) and the outs ide diameter- inside diameter concentricity to 0.005 in., but at considerable expense. As these two tolerances are relaxed, more manufacturing capabili ty is available, and the fabrication c o s t s are reduced; however, dynamic balancing of the shaf t becomes a more important portion of the fabrication process .
An investigation is under way to determine the relationship between shaf t precision and total shaf t cost (fabrication plus dynamic balancing) a s well as its ef fec t on pump design.
Several manufacturers have been found who are capable of fabricating the inner and outer c a s i n g s to the tolerances shown on the preliminary layout, but a l so a t considerable expense. The effects on pump design of relaxing the preliminary values of the tolerances are being studied.
Other Molten-Salt Pumps
Fuel Pump High-Temperature Endurance Test Faci l i ty . - T h e faci l i ty ,3 including the s a l t pump, gas sys tems, instrumentation, and handling equip- ment, is being prepared for operation with sodium fluoroborate (WaBF,). The new drive motor, rated 200 lip a t 1800 rpm, was delivered, and the ex is t ing motor support was modified to sui t the new motor. Also, the pump rotary element was retnoved from the facility, disassembled, cleaned, and reassembled.
Molten-Salt B'earing Pump Endurance T e s t Faci l i ty . - A new salt bearing constructed of Wastelloy N was instal led on this pump.4 T h e gimbals support for the bearing was modified to reduce the possibi l i ty of the support becoming disassembled during operation. The bearing and gimbals arrangement was sat isfactor i ly tes ted with oil iis the pumped fluid a t room temperature.
MSK Program Semiann. Pro&. Rept . Feh. 28, 1967,
'MSR Program Semianti. [Jrogr. f?cpt. ~ u g . 31, 1966,
3
ORNL-41 19, p. 66.
OHNL-4037, p. 82.
e
W. R. Grimes
The chemical research and development effort in c lose support of the MSBR program inc ludes , a s described in th i s chapter, a variety of s tud ies . A major sha re of t h i s effort i s s t i l l devoted to t h e immediate and anticipated problems of t he operat- ing Molten-Salt Reactor Experiment.
Sampling of t h e MSRE fuel and coolant s a l t s and interpretation of the ana lyses for major and minor consti tuents of t h e melt, and examination of metal and graphite surveil lance specimens from t h e core and of spec imens exposed t o the pump bowl gases , continue a s routine, though obviously necessary , portions of t h e to t a l effort. Minor fractions of severa l f ission products continue to appear in the pump-bowl g a s space . The possibil i ty that t h e s e may occur as volati le compounds h a s prompted examination of t he chemistry a n d the vaporization behavior of the little--known intermediate valence fluorides of molybdenum.
Oxide-fluoride equilibria in t he LiF-BeF tem and i t s more complex counterparts with added U F , and ThF, a re under study, s ince such equilibria may well l ead to separation processes of value and seem to have shown u s container
s y s -
materials tha t will greatly a i d our experimental program.
economical coolant for t h e L i F - B e F the MSRE have r e q u i d examination of phase he- havior among t h e a lka l i fluoroborates and of ancil lary ques t ions of t h e decomposition pressure of t h e s e materials and of poss ib le undesirable interactions of BF, with meta ls and lubricants t o which i t would b e exposed.
While recovery of uranium by fluorination (both from fuel and blanket) and recovery of fuel s a l t by vacuum disti l lat ion remain a s t he design re- process ing methods, t h e recovery of protactinium from the blanket and t h e removal of fission prod- uc t s from the fuel by reductive extraction in to molten meta ls continue t o show promise and ace actively pursued.
Development s tud ie s in ana ly t ica l chemistry have been directed primarily to improvement in ana lys i s of radioactive samples of fuel for ox ide and uranium trifluoride and for impurities in t h e helium g a s from t h e MSR'E.
T h e p l ans to subs t i tu te a lower melting and more mixture i n
K. E. Thoma
8.1 MSRE SALT COMPOSITION AND FURlTY signify that generalized corrosion in t h e fuel and coolant c i rcu i t s is practically absent , and that
Molten fuel, f lush, and coolant s a l t s have been
In u s e , t h e s e s a l t s intermittently circulated and stored in the MSRE . . .. . . . -
f o r approxirnately two years. have been subjec ted to chemical ana lys i s on a
'Chemical ana lyses performed under the supervision of C. E. X,atnb, Analytical Chemistry Division; spec- trochemical data were obtained by W . R. Musick,
regular bas i s . T h e resu l t s of t h e s e a n a l y s e s Analytical Chemistry Division.
102
103
the s a l t s are currently in essent ia l ly as pure condition as when charged into the reactor.
as compared with t h e composition and purity it was known to p o s s e s s a year ago:
Fue l Salt
Li Be F Fe Cr Ni 0 .--.-
(wt X) ( P P d
MSRE runs 11 and 12 were completed within t h e current report period During th i s period, smal l amounts of beryllium metal were d isso lved in to the fue l salt to ad jus t t he oxidation-reduction potential of the s a l t . The to ta l concentration of uranium in t h e fue l w a s a l s o increased by addition of 7L iF-235UF, to the circulating salt Currently, the uranium concentration of t he fuel s a l t is approximately 4 590 wt 76, of which the U 3 ’ frac- tion of t h e total uranium i s 1 5%. T h e effects of the beryllium and 7LiF-23sUF, additions are evident in the resu l t s of t h e chemical ana lyses of the fuel salt shown in Table 8 1. A refinement of ana ly t ica l procedure was introduced during run 11 ; preliminary va lues for t h e determination of ura- nium concenttations were confirmed by a second group of ana lys t s before final va lues were re- ported. Continuous control methods were em- ployed by both groups. Th i s innovation in pro- cedure resulted in a significant improvement in precision. Average sca t t e r was reduced from +0.5% to +0.4% of t h e va lue , corresponding t o t0.03 and ‘0.02 wt % uranium.
MSRE fuel s a l t is analyzed by IIF-H, purge methods €or ev idence of oxide contamination. The resul ts of ana lyses obtained during runs 11 and 12 indicated that t h e fuel s a l t does not contain more than 50 t o 60 ppm of oxide, tha t i s , i t is currently a s free of oxide as when it was originally charged into the MSRE.
Coolant Salt
When run 12 w a s terminated in August 1967, the coolant s a l t had circulated in t h e MSRE for a period of 12,047 hr. Coolant s a l t specimens were submitted a t onsmonth in te rva ls during 1967. Resul t s of t h o s e ana lyses show t h e composition and purity of t h e salt t o be
Li Be F Fe Cr N i 0
( w t W ) ( P P d ___
13.04 9.47 76.30 63 27 12 “ ’200
13.03 9.46 76.16 58 36 16 Q’200
The two compositions a re not differentiable with- in the precision of t h e ana ly t ic methods. The constancy of t h e t r ace concentrations of the impurit ies a t t e s t s to t h e fact tha t t h e cover gas , which is supplied to both the fuel and coolant circuits from a common source , h a s been main- tained in a state of high purity throughout tfie entire operational period.
Flush Sait
Whenever the MSRE fue l circuit is flushed with flush salt, there is cross mixing uf fue l and flush salts by res idues which remain in t h e reactor after each is drained. We need to know the amounts of material transferred betwcen the fuel and flush s a l t s because they en ter into t h e calcu- lation of the book-value concentration of uranium in the fuel sa l t . Sufficient ana ly t ica l data are now ava i lab le to enab le u s to deduce the average m a s s of t h e s e rcsidues.
The concentration of uranium in the flush s a l t appears to change in neatly equal increments during each flush operation, as shown in Table 8.2. T h e s e da t a indicate tha t fuel s a l t which remains in the fue l circuit after drainage of t h e fuel i nc reases t h e uranium concentration of the flush s a l t by 200 ppm each time the drained re- actor is c leaned with flush sa l t . An increase of 200 ppm of uranium corresponds to t h e addition of approximately 850 g of uranium to the flush salt. Th i s is t h e amount of uranium in 19.20 t 0.10 kg of fuel s a l t i n which the uranium concentration is between 4 570 t o 4 622 wt % U, the range for t h e MSRE during the period considered.
On filling t h e MSRE with fuel s a l t , 7L.iF-BeF2 (66-34 mole %) flush s a l t residue is incorporated in the fuel s a l t , diluting i t s concentration of U F , and %rF4 slightly. T h i s dilution is reflected i n the uranium and zirconium ana lyses shown in Fig. 8.1 The decrease in zirconium concentration of the fuel s a l t from a mean value of 11 33 wt % to 10.85 wt ;“o corresponds to dilution of t h e fuel by 12.7 kg of salt on each drain-flush-fill cycle.
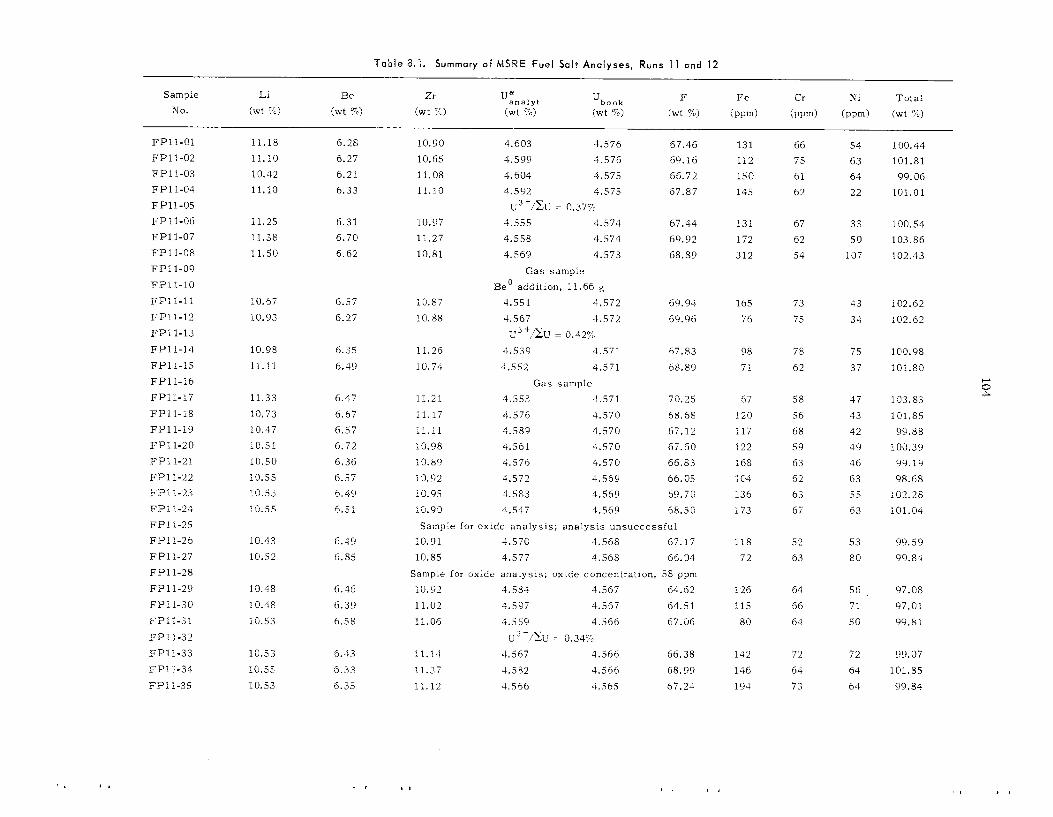
104
u-
03
?
??
?
03
mh
O
O~
O
43
7-
cr, 0 r.
Wm
z
Nd
O
-130
r.
Nd
w
w
In
r. 0 r.
N
NJ -<
w
m
43 N
3 N
w
0
m r.
*-. r" 6 1 +
ri *
m
ar 0 0
2
.4
a,
X
0
v)
'2 .- .4
VI
G m
0
w
m
m
m d
0
w
W
m
9 m
4
w
lx
0
'i!
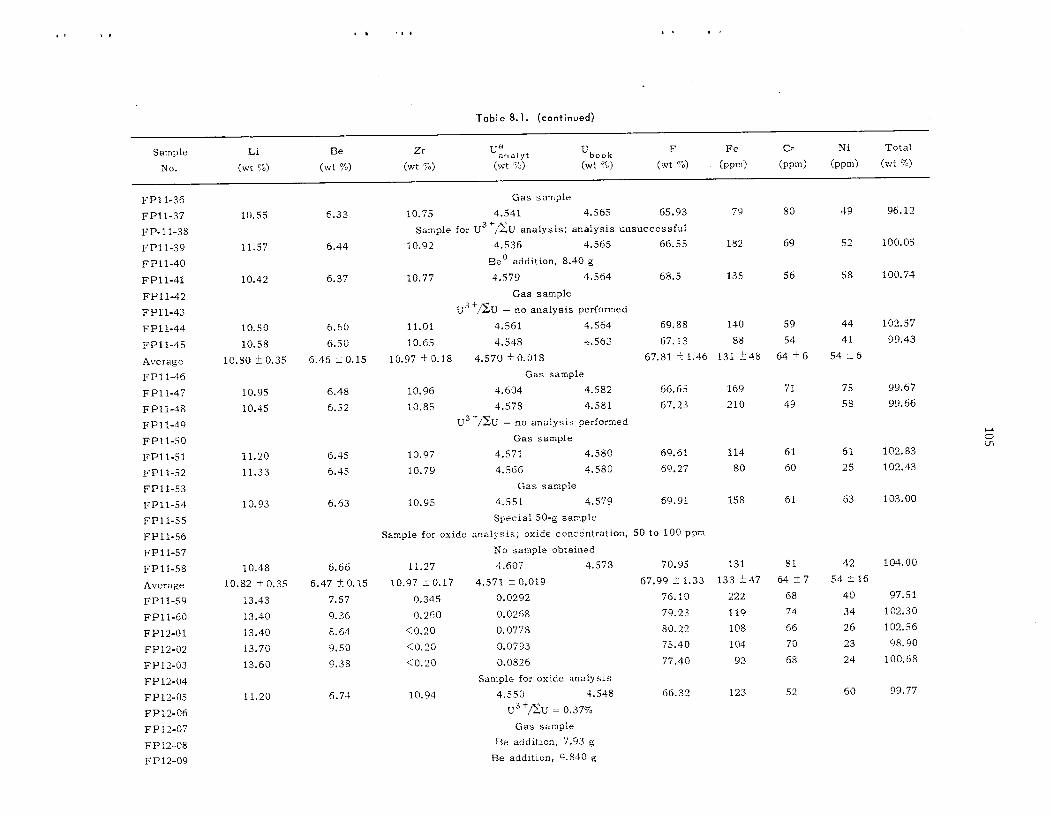
105
r- t.
01
0;
0
W
N
m
ro N
rl
C1
W
W
?
ln x 0 3 M
rn
m
ID
N
m
7-4
W
7-4
N+
I 0 d-
w
m *
d- t
mm
m~
i
d
Lo
u3 m
d-
..d +I d
m
dd- m
ma
7
-4
rn
r-Lo
am
W
W
m a
+I rn
mw
d-
W
r-
r- d
d-
0
da
n
o
d
ic
7-
4
7-4
N
W 3 i.
L1I 0
'. c + m
3
r- 7-4
W
a
.-. m
Em
p- d
o
2 '?
7-
4,
-
d- h
i
d
a
W
?
0
C?
7-4 r(
d
r"
me
ww
?
b:
a
m
Lorn
;: 2
%
+. W
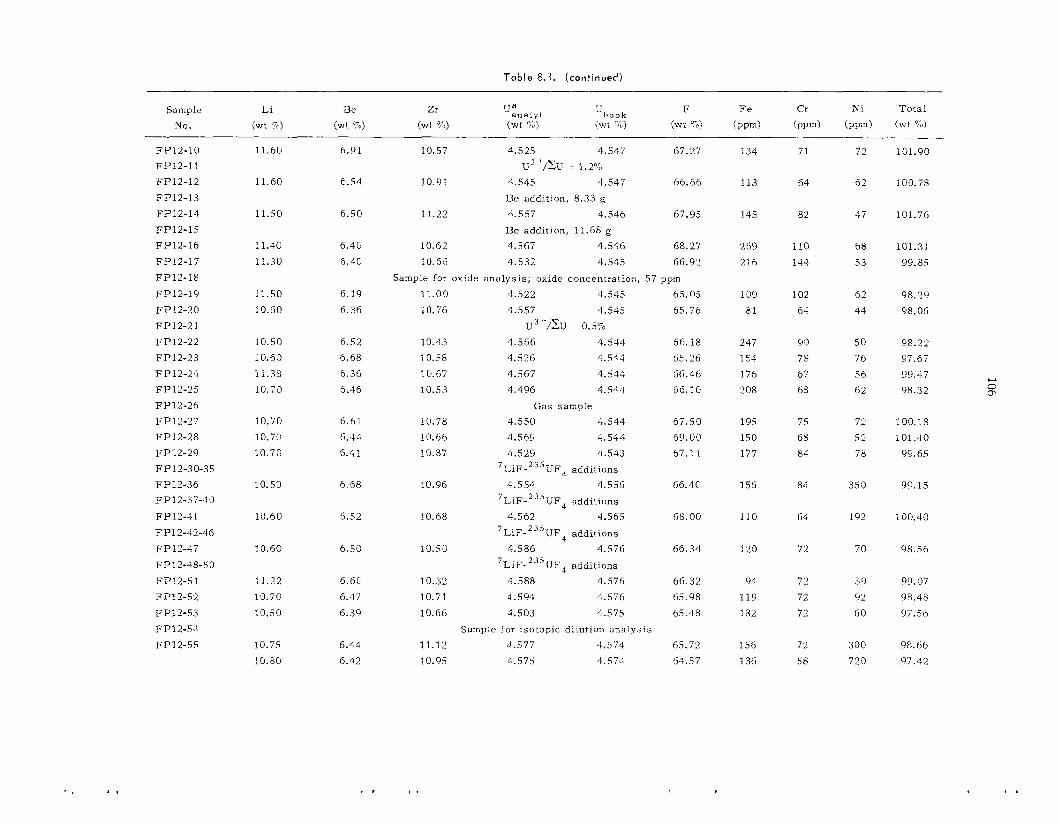
Table 8.1. (continued)
Sample Nc.
F312-10 FPi2-1: FP12-12 FPI2-13 FP12-14 FP 12-1 5 FP12-16 FP12-17 FP12-16 FP12-19 FP12-20 FP12-21 F P 12-2 2 FP12-23 F P 12-24 FP12-25 FP12-26 FP 12-27 FP12-28 FP12-29 FT12-30-35 FP12-36 FP 12-3 7-40
FP12-41 FP12-42-46 FP12-47 FF'i2-48-53 FP12-51 FPi2-52 FP12-55 FP12-54 FP12-55
11.60
11.60
11.50
11.40 11.30
11.50 10.60
10.50 10.53 11.38 10.70
10.70 10.70 10.70
10.50
10.60
10.60
i1.22 10.70 10.50
10.75 10.50
6.91
6.54
6.50
6.40 6.40
6.19 6.36
6.52 6.68 6.36 5.46
6.61 6.44 6.41
6.68
6.52
6.50
6.60 6.47 6.39
6.44 6.42
10.57 4.525 4.547 67.27 u3 +/xu = 1.2%
10.91 4.545 4.547 66.66 Be addition, 8.33 g
11.22 4.5 57 4.546 67.95 Be addition, 11.68 g
10.62 4.567 4.546 68.27 10.66 4.532 4.545 66.92
Sample lo r oxide ana lys i s ; oxide concentraiion, 57 ppm
11.00 4.522 4.545 65.05 10.76 4.557 4.545 65.76
U 3 '/XU = 0.5% 10.43 4.556 4.544 56.18 10.58 4.526 4.544 55.26 10.67 4.567 4.544 66.46 10.53 4.496 4.544 66. i 0
Gas sample 10.78 4.550 4.544 67.50 10.66 4.565 4.544 69.00 10.87 4.529 4.543 67.11
7LiF-22sgF addiTions 10.96 4.554 4.555 66.40
7LiF-23sUF4 additions 10.68 4.562 4.565 68.00
UF, additions
UF, additions
7LiF-2 3 5
7LiF-23s 10.50 4.586 4.576 66.34
10.32 4.588 4.576 66.32 10.71 4..594 4.576 65.93 10.66 4.503 4.575 65.45
Sample fo r isotopic dilution analysis 11.12 4.577 4.574 65.72 10.95 4.575 4.574 64.57
134 71
113 64
145 82
269 110 215 144
100 102 81 64
247 50 154 78 176 67 208 63
195 75 150 66 177 84
156 84
110 64
123 72
94 72 119 72 :a2 72
156 72 136 58
72
62
47
68 53
62 44
50 76 56 62
72 52 78
350
192
70
3 9
92 60
300 720
1131.90
100.78
101.76
101.31 99.55
98.29 98.06
98.22 97.67 99.47 98.32
100.1s 101.40
99.65
99.15
100.40
96.56
99.07 98.48 gi' * .I
98.66 97.42
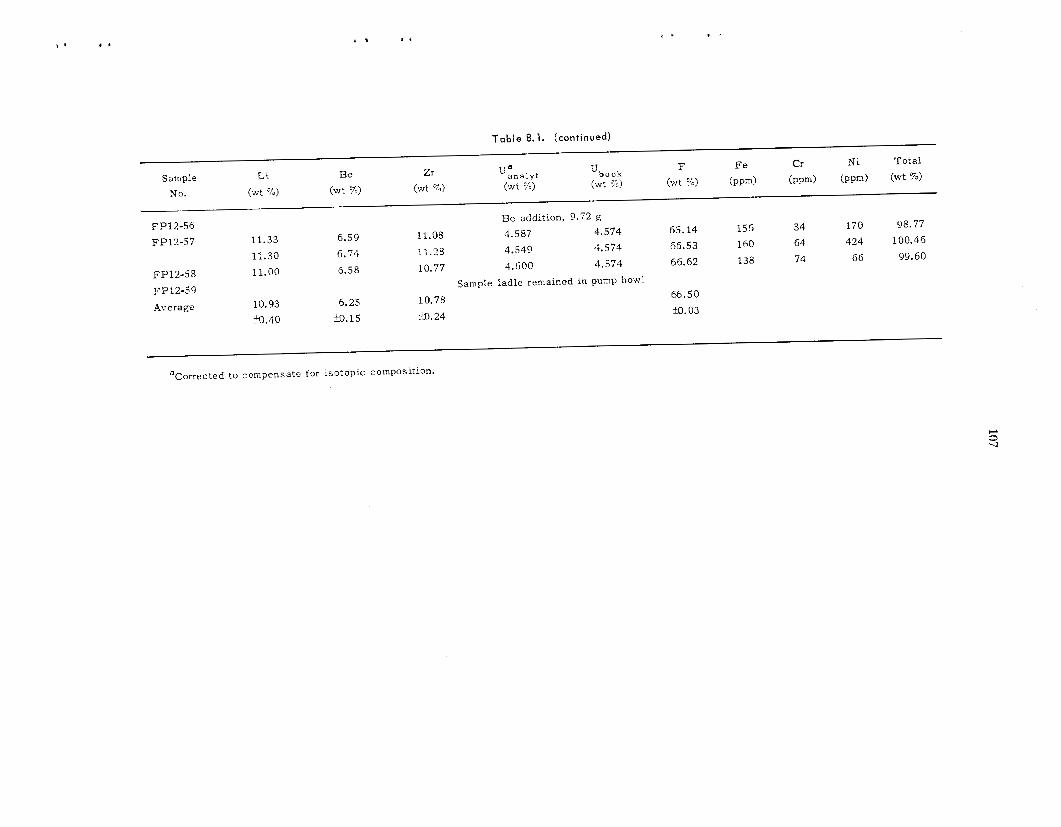
107
- -u al 3 C
C
U
.- c a c
- i a - L C I-
4
a a 3
E
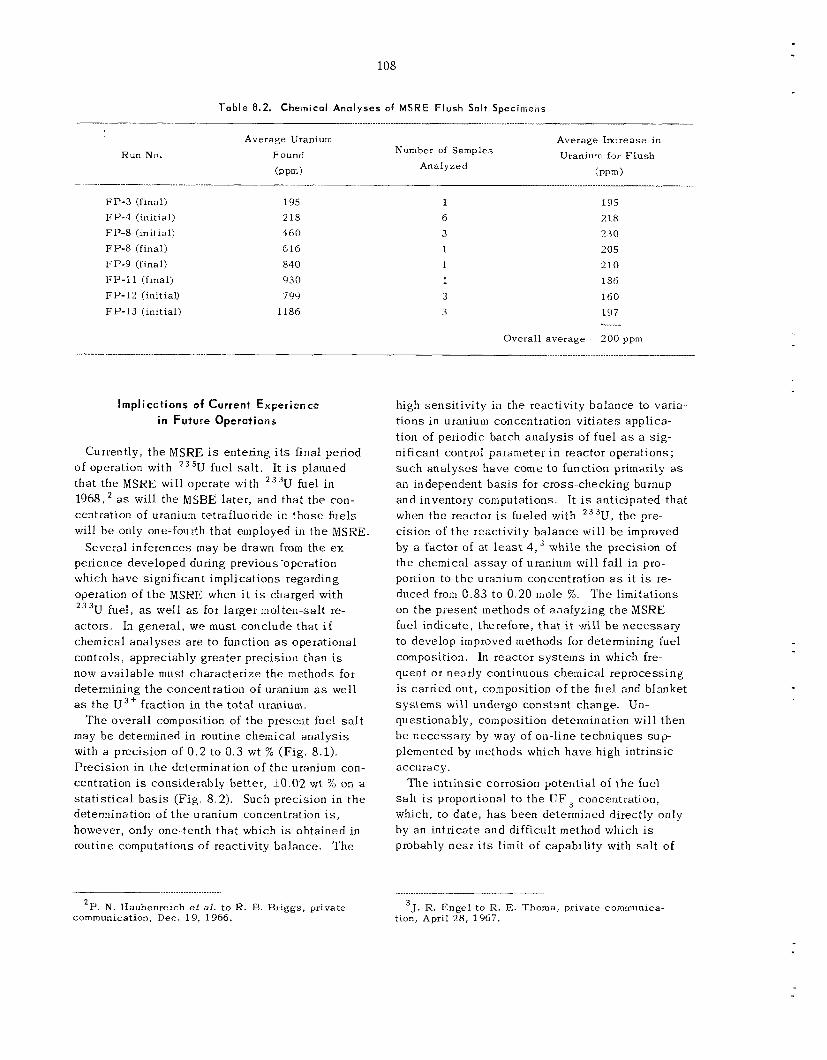
108
Table 8.2. Chemical Analyses af MSRE F l u s h Salt Specimens
Average Uranium Number of Samples Run No. Found
(ppm) Analyzed
Average Increase in Uranium f a r Flush
(ppm)
FP-3 (final) FP-4 (initial) FP-8 (initial) FP-8 (final) FP-9 (final) FP-11 (final) FP-12 (initiao FP-13 (initial)
195 218 160 616 840 930 '7 99
1186
1 6 3
Overall average =
19s 218 230
205 2 1 0 186 160 197
200 ppm
L_
__I .................... ~.
lmplicotions of Current Experience in Future Operations
Currently, t he MSRE i s entering i t s final period of operation with 2 3 5 U fuel s a l t . It i s planned that the MSRE: will operate with 233U fuel i n 1968,' a s will the MSBE later, and tha t the con- centration of uranium tetrafluoride in those fuels will b e only one-fouith that employed in t h e MSRE
Several inferences rnay b e drawn from the ex- perience developed during previous -operation which have significant implications regarding operation of t h e MSKE when i t i s charged with 2 3 3 ~ fuel, a s well as for larger molten-salt re- actors. In general , we must conclude that if chemical a n a l y s e s a re to function a s operational controls, appreciably greater precision than is now avai lab le must characterize t h e methods for deterniiriing the concentration of uranium a s well as the U 3 + fraction in t h e to ta l uranium.
may b e determined in routine chemical ana lys i s with a precision of 0 . 2 to 0.3 wt % (F ig . 8.1). Prec is ion in the determination of t h e uranium con- centration is considerably better, k0.02 wt % on a s t a t i s t i ca l b a s i s (F ig . 8.2). Such precision in t h e determination of t h e uranium concentration i s , however, only one.-tenth tha t which i s obtained in routine computations of reactivity balance.
T h e overall composition of the present fuel s a l t
T h e
high sensit ivity in the reactivity ba lance to varia- t ions in uranium concentration v i t ia tes applica- tion of periodic batch ana lys i s of fuel a s a s ig - nificant control parameter i n reactor operations; such ana lyses have come to function primarily a s an independent b a s i s for cross-checking burnup and inventory computations. It is anticipated that when the reactor i s fueled with 2 3 3 U , the pre- cision of t h e reactivity ba lance will b e improved by a factor of at l e a s t 4 , 3 whi le the precision of the chemical a s s a y of uranium will fall in pro- portion to t h e uranium concentration a s i t i s re- duced from 0 .83 to 0 .20 mole %. T h e limitations on t h e present methods of analyzing t h e MSRE fue l indicate, therefore, t ha t i t will b e necessary to develop improved methods for determining fuel composition, In reactor sys t ems in which fre- quent or nearly continuous chemical reprocessing is carried out, composition of t h e fuel and blanket sys lems will undergo constant change. Un- questionably, composition determination will then be necessary by way of on-line techniques sup plemented by methods which have high intrinsic accuracy.
T h e in t r ins ic corrosion potential of t h e fuel s a l t i s proportional t o t h e U F , concentration, which, t o da te , h a s been determined directly only by an intricate and difficult method which i s probably near i t s limit of capabili ty with s a l t of
........................ ............
'P. N. Haubanreich et a1. t o R. B. Briggs, private 3J. R. Engel to R. E. Thoma, private cornmunica- communication, Dec. 19, 1966. tion, April 28, 1967.
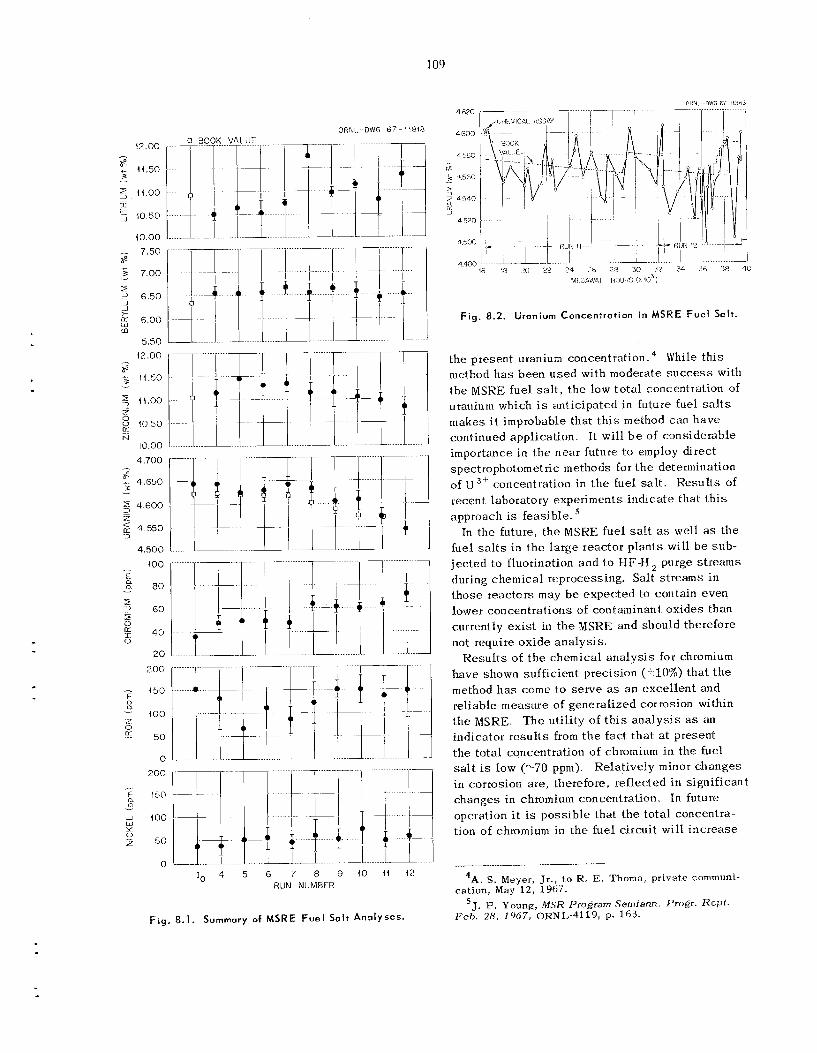
109
CRNL DWC 67 11818
40 00
IS 18 ,‘rl 22 74 .n 71 30 ‘ 7 34 3- 58 40 MIG~~LVOI r IIOJRS ( ~ 1 0 ~ 1
Fig. 8.2. Uranium Concentration in MSRE Fuel Salt. m
5 50 I? 00 t he present uranium concentration
method h a s been u s e d with moderate s u c c e s s with t h e MSRE fuel s a l t , t h e low to t a l concentration of
makes i t improbable that t h i s method can have continued application. It will b e of considerable importance in the near future to employ dlrect spectrophotometnc methods for the determination of u3+ concentration in t h e fuel s a l t . Resul t s of recent laboratory experiments ind ica te that t h i s approach is feasible. ’
In the future, t h e MSKE fuel sa!t as well as t h e fuel salts in t h e la rge reactor p lan ts will be sub-
during chemica l reprocessing. Salt s t reams in those teac tors may be expec ted to contain even lower concentrations of contaminant ox ides than currently ex i s t in the MSRE and should therefore
Resu l t s of t h e chemical ana lys i s for chromium have shown sufficient precision (110%) tha t t h e method h a s come to serve as a n exce l len t and reliable measure of generalized corrosion within t h e MSRE T h e uti l i ty of t h i s ana lys l s as an indicator resu l t s from t h e t s c t that at present t h e to ta l concentration of chroniium in t h e fuel s a l t is low ( 9 ‘ 0 ppm).
While t h i s ,- 6: ; ! I 5 0
uranium which i s anticipated in future fuel s a l t s
10 00
4 700
4 500
j ec ted to fluorination and to HF-W, purge s t reams
2 o
not require oxide a n a l y s i s 40
20
200
0
0 Relatively minor changes
are, therefore, reflected i n significant
operation it is poss ib l e that t he to ta l concentra- tion of chromium i n t h e fuel circuit will i nc rease
~ -
A S . Meyer, Jr., t o R. E. Thoma, prlvate communl- ration, May 12, 1967.
Fer). 28, 1967, ORNL-4119, p. 153. ’J. P. Young, MSR Program Sen7rann Progr Rept
n I ri concentratlon. In future J 100 LIJ Y
I o 4 5 6 7 8 9 1 0 1 1 12 RiJN NUMBER
F l g . 8.1. Summary of MSRE Fuel S o l t Analyses.
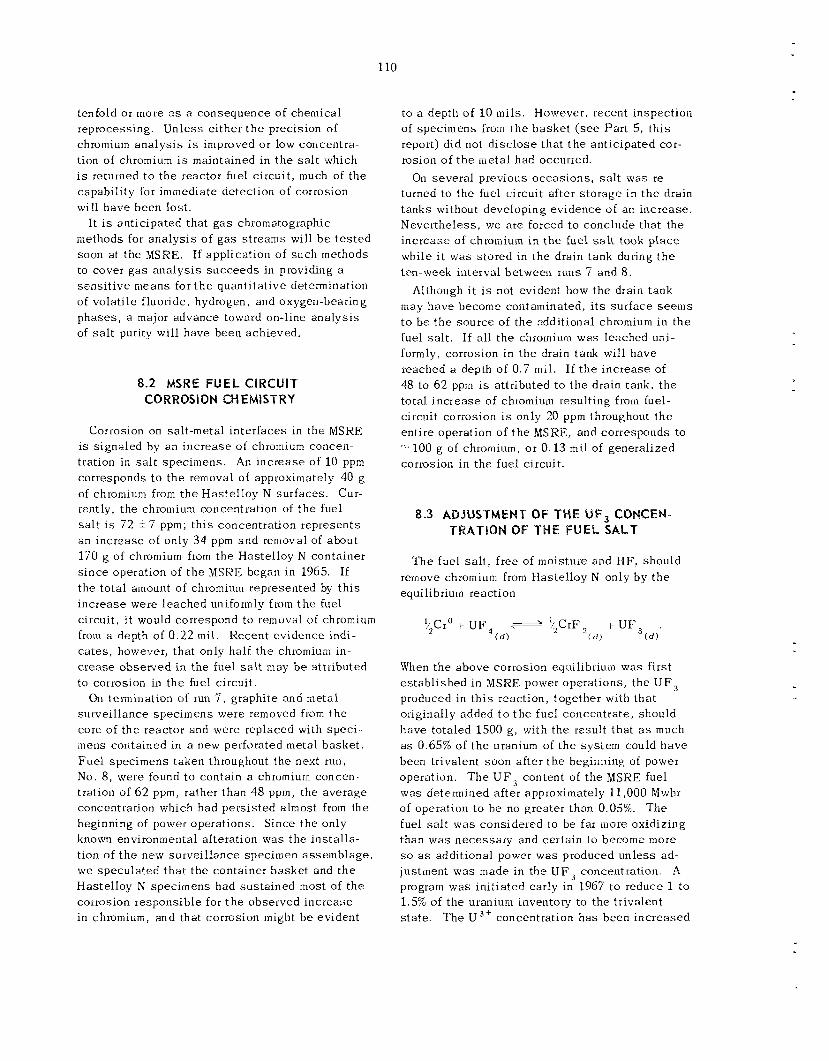
110
tenfold or more as a consequence of chemical reprocessing. Un les s either t h e precision of chromium ana lys i s i s improved or low concentra- tion of chromium is maintained in t h e s a l t which is returned t o the reactor fuel circuit , much of t he capabili ty for immediate detection of corrosion will have been los t .
It is anticipated that g a s chromatographic iiiethods for ana lys i s of g a s streams. will b e t e s t ed soon a t the MSRE. If application of such methods to cover g a s ana lys i s succeeds i n providing a sens i t i ve means for t h e quantitative determination of volati le fluoride, hydrogen, and oxygen-bearing phases , a major advance toward on-line ana lys i s of s a l t purity will have been achieved.
8.2 MSRE FUEL CIRCUIT CORROSION CHEMISTRY
Corrosion on salt-metal in te r faces in the MSRE i s signaled by an inc rease of chromium concen- tration in s a l t spec imens . An inc rease of 10 ppm corresponds to the removal of approximately 40 g of chromium from t h e Has te l loy N sur faces . Cur- rently, t he chromium concentration of t h e fuel s a l t i s 72 z 7 ppm; t h i s concentration repre- &nts an increase of only 34 ppm and removal of about 170 g of chromium from the Hastelloy N container s ince operation of t h e MSKE began i n 1965. If t h e to ta l amount of chromium represented by th i s increase were leached uniformly from t h e fuel circuit , i t would correspond to removal of chromium from a depth of 0 . 2 2 mil. Recent ev idence indi- ca t e s , however, that only half t he chromium in - c r ease observed in the fuel s a l t may b e att i ibuted to corrosion in the fuel circuit .
On termination of run 7 , graphite and metal surveil lance specimens were removed from t h e core of t h e reactor and were replaced with spec i - - mens contained in a new perforated metal baske t . Fue l specimens taken throughout t he next run, No. 8, were found to contain a chromium concen- tration of 6 2 ppm, rather than 48 ppm, the average concentration which had pers i s ted almost from the beginning of power operations. Since the only known environmental alteration was t h e ins ta l la - tion of t h e new surveil lance specimen assemblage , we specula ted tha t t he container baske t and t h e Hastelloy N spec imens had sus ta ined most of t h e corrosion responsible for t h e observed increase in chromium, and that corrosion might b e evident
to a depth of 10 mils. However, recent inspection of speciiiiens froim the baske t (see Par t 5 , t h i s report) did not d i sc lose tha t t h e anticipated cor- rosion of t h e metal had occurred.
On severa l previous occas ions , s a l t was re- turned to the fuel circuit after s torage i n t h e drain tanks without developing evidence o € an increase . Nevertheless, we a re forced to conclude that the increase of chroriiiuin in t h e fuel salt took p l ace while i t w a s s tored in the drain tank during t h e ten-week interval between runs 7 and 8.
Although i t is not evident how t h e drain tank may have become contaminated, i t s sur face seems t o b e t h e source of t he additional chromium i n t h e fuel s a l t . If a l l t he chromium w a s leached uni- formly, corrosion in the drain tank will have reached a depth of 0.7 mil. If t h e inc rease of 48 to 6 2 pprn is attributed t o t h e drain tank, t h e total i nc rease of chromium result ing from fuel- circuit corrosion is only 20 ppm throughout t he entire operation of t h e MSRE, and corresponds to % 100 g of chromium, or 0.13 mil of generalized corrosion in the fuel circuit.
8.3 ADJUSTMENT OF THE U6, CONCEN- TRATlQN OF THE FUEL SALT
The fuel s a l t , f ree of moisture and IIF, should remove chromium from Hasielloy N only by t h e equilibrium reaction
When the above corrosion equilibrium was first es tab l i shed i n MSRE power operations, the U F , produced in t h i s reaction, together with tha t originally added t o t h e fuel concentrate, should have totaled 1500 g , with t h e result that a s much a s 0.65% of t h e uranium of the system could have been trivalent soon after t h e beginning of power operation. T h e U F , content of t h e MSRE fuel was determined after approximately 11,000 Mwhr of operation to b e no greater than 0.05%. The fuel s a l t was considered to be far more oxidizing than was necessary and certain to become m o r e so a s additional power was produced unless ad- justment was made in the U F , concentration. A program was init iated early in 1967 to reduce 1 to 1.5% of t h e uranium inventory to the tr ivalent s ta te . The U 3 t concentration h a s been increased
111
s i n c e that t ime b y addition of 84 g of beryllium metal . T h e method of addition w a s descr ibed previously.
T h e low corrosion sus t a ined by t h e MSIiE fuel circuit , which is in general accord with t h e re- s u l t s from a wide variety of out-of-pile corrosion t e s t s , might have been expec ted t o b e greater during t h e f i r s t 10,000 Mwhr of operations be- c a u s e t h e UF, concentration of t h e fuel w a s markedly less than w a s intended. According t o Grimes,’ “The lack of corrosion in t h e MSRE melts which appear to b e more oxidizing than intended can b e rationalized by t h e assumption (1) that t h e Has te l loy N h a s been depleted i n Cr (and F e ) dt t h e sur face so that only Mo and Ni a r e exposed to attack, with Cr (and Fe) reacting only at t h e s low ra te a t which it is furnished t o the sur face by diffusion, or (2) that t h e noble- metal f i s s ion products are forming an adherent and protective p l a t e on t h e reactor metal.”
If i t is assumed that corrosion of the fuel pro duced 3.3 equiva len ts of U F , and tha t f i s s ion h a s resulted in t h e oxidation of 0.8 equivalent of U F ,
‘R. E. ‘l‘homa and W. R. Grimtxs, M S R Program Semznnn. Pro&. R e p t . Feb. 28, 1967, ORNL-4119, p. 123. ’W. R. Grimes, Chemical Research and Develop-
ment for Molten-Salt Breeder Reactors, O R N L - ~ ~ S ~ ~ p. 70 (June 6, 1967).
per gram-atom of f i ss ioned uranium, ’ t h e addi- t ions of beryllium metal to t h e fue l have been fol- lowed by t h e concentrations l i s ted i n Table 8.3. The ca lcu la ted va lues are for t h e most part higher than the measured values. T h e c a u s e of t h i s disparity i s not currently understood, but i s under investigation.
All d i sso lu t ions of beryllium metal into t h e fue l s a l t proceeded smoothly; t h e bar s t o c k which w a s withdrawn after exposure to t h e fue l w a s observed to b e smooth and of symmetrically reduced shape .
No significant e f f ec t s on reactivity were ob- se rved during or following: t h e beryllium additions, nor were chemical ana lyses indicative that such additions were made until after run 12 was begun. The addi t ions preceding run 12 had increased the U 3 + concentration in t h e to t a l uranium by ap- proximately 0.6%. Four exposures of beryllium were made a t close in te rva ls during t h e early part of tha t run. Samples t aken shortly after t h e l a s t of t h e s e four exposures (FP12-16 et seq., Tab le 8.1) began to show a n unprecedented in- c r e a s e in the concentration of chromium in t h e specimens, followed by a similar decrease during t h e subsequent sampling period.
Previous laboratory experience h a s not dis- c losed comparable behavior, and no well-defined
‘Ibid. , p. 65.
T a b l e 8.3. Concentration of U F 3 in the MSRE Fuel SaltR ___I____
Uranium Uranium u3 + N e t u3 +/&J u3 +/xu iLlwhr Burned Burned Oxidized He Added ne Added Equivalents Calculated Analysis Sample
No. (7%) (X) (9) (moles) (moles ) (‘) Reduced
9-4 10-25 11-5 11-13 11-32 11-38 11-49 12-6 12-1 1 12-21
10,978 16,450 17,743 20,386 25,510 27,065 30,000 32,450 33,095 35,649
5.54 829 953
1029 1287 1365 1514 1637 1670 1798
2.34 1.87 3.50 2.80 4.02 3.20 4.34 3.46 5.43 4.34 5.76 4.60 6.39 5.10 6.91 5.50 7.05 5.60 7.59 6.10
0 0 l(i.28 3.61 16.28 3.61 27.04 6.20 27.94 6.20 27.94 6.20 36.34 8.06 36.34 8. Oh 54.11 12.01 74.12 16.45
3.13 5.81 5.21 8.74 6. 86 6.60 7.96 7.76
11.40 15.35
0.31 0.58 0.53 0.88 0.69 0.66 0.80 0.77 1.14 I .5
0.1 0.5 0.37 0.42 0.34
0.37 1.2 0.5
RThese numbers assume that the s a l t originally was 0.16% reduced; that the increase in Cr from 38 to 65 ppm was real, occurred before 11-14-66, and resulted in reduction of U“’ to U”; that each fission l e su l t s in oxidation of 0.8 atom o f U”; and that there have been no other l o s ses of 1J3+.
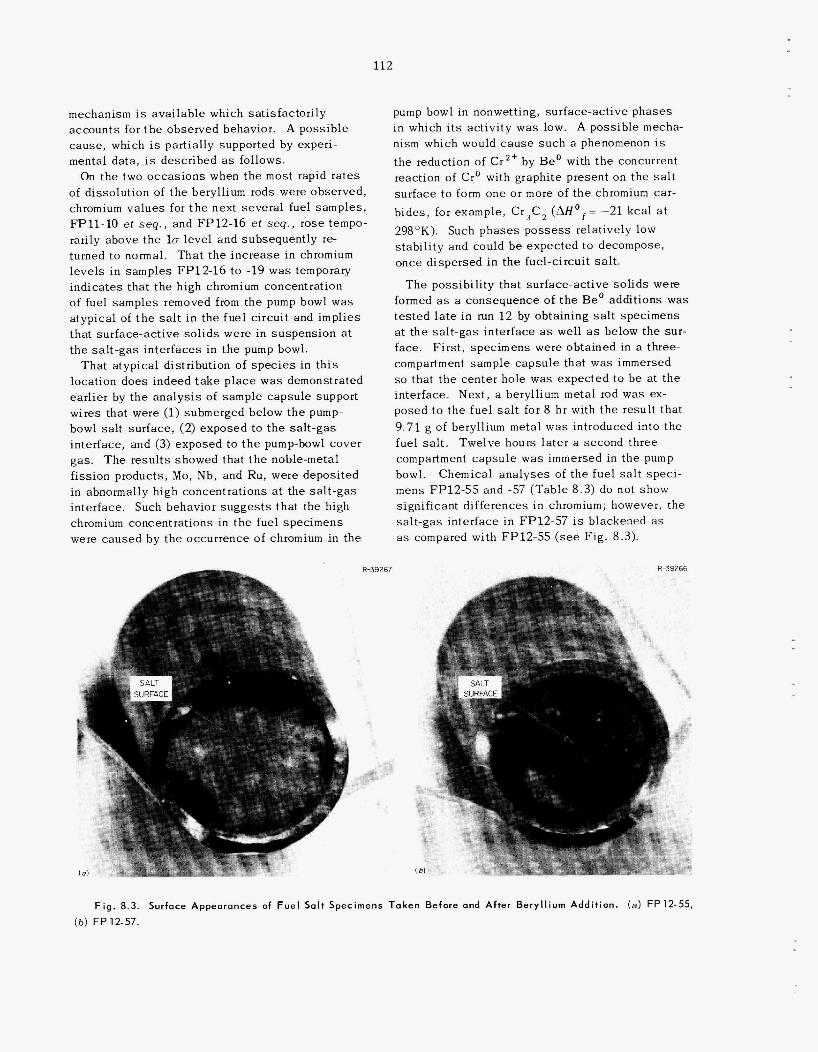
112
mechanism is avai lable which sat isfactor i ly accounts for t h e observed behavior. A poss ib le cause , which is partially supported by experi- mental data, is descr ibed as follows.
On the two occas ions when t h e m o s t rapid ra tes of dissolut ion of t h e beryllium rods were observed, chromium values for t h e next severa l fuel samples , FP11-10 et seq., and FP12-16 e t seq., rose tempo- rarily above the lo level and subsequently re- turned to normal. Tha t t h e increase in chromium leve ls i n samples FP12-16 to -19 w a s temporary ind ica tes tha t t h e high chromium concentration
amples removed from the pump bowl was atypical of t h e s a l t i n t h e f u e l c i rcui t and implies that surface-active s o l i d s were in suspens ion at t h e sa l t -gas interfaces in t h e pump bowl.
That a typical distribution of s p e c i e s in th i s location d o e s indeed t a k e p lace w a s demonstrated ear l ier by the a n a l y s i s of sample capsule support wires that were (1) submerged below t h e pump- bowl salt surface, (2) exposed to th interface, and (3) exposed to t h e pump-bowl cover gas . T h e resu l t s showed that t h e noble-metal fission products, Mo, Nb, and Ru, were deposited in abnormally high concentrations at the salt- interface. Such behavior s u g g e s t s tha t chromium concentrations in t h e fuel s p e were caused by the occurrence of chromium in the
pump bowl in nonwetting, surface-act ive p h a s e s in which its act ivi ty w a s low. A possible mecha- nism which would c a u s e such a phenomenon is t h e reduction of C r 2 + by B e o with t h e concurrent reaction of Cro with graphite present on the s a l t surface to form o n e or more of t h e chromium car- b ides , for example, Cr3C, ( 298'K). Such p h a s e s p o s s e s s relatively low stabi l i ty and could b e expected to decompose, once dispersed in the fuel-circuit salt.
T h e possibi l i ty that surface-active s o l i d s were formed a s a consequence of t h e Beo additions was tes ted late in run 1 2 by obtaining s a l t specimens a t t h e sal t -gas interface as we11 as below the sur- face. F i r s t , specimens were obtained in a three- compartment s ample capsule that w a s immersed so that t h e center hole was expected to b e a t the interface. Next, a beryllium metal rod was ex- posed to t h e fue l salt for 8 hr with t h e resul t tha t 9.71 g of beryllium metal w a s introduced into the fuel salt. Twelve hours la te r a second three- compartment capsule w a s immersed in t h e pump bowl. Chemical ana lyses of the fue l salt spec i - mens FP12-55 and -57 (Table 8 .3) do not show significant differences in chromium; however, the sal t -gas interface in FP12-57 is blackened as a s compared with FP12-55 ( s e e Fig. 8.3).
R-39267 R-39266
F F
F i g . 8.3. (b) FP12-57.
Surface Appearances of F u e l Sal t Specimens T a k e n Before and After Beryll ium Addit ion. (a) FP12-55,
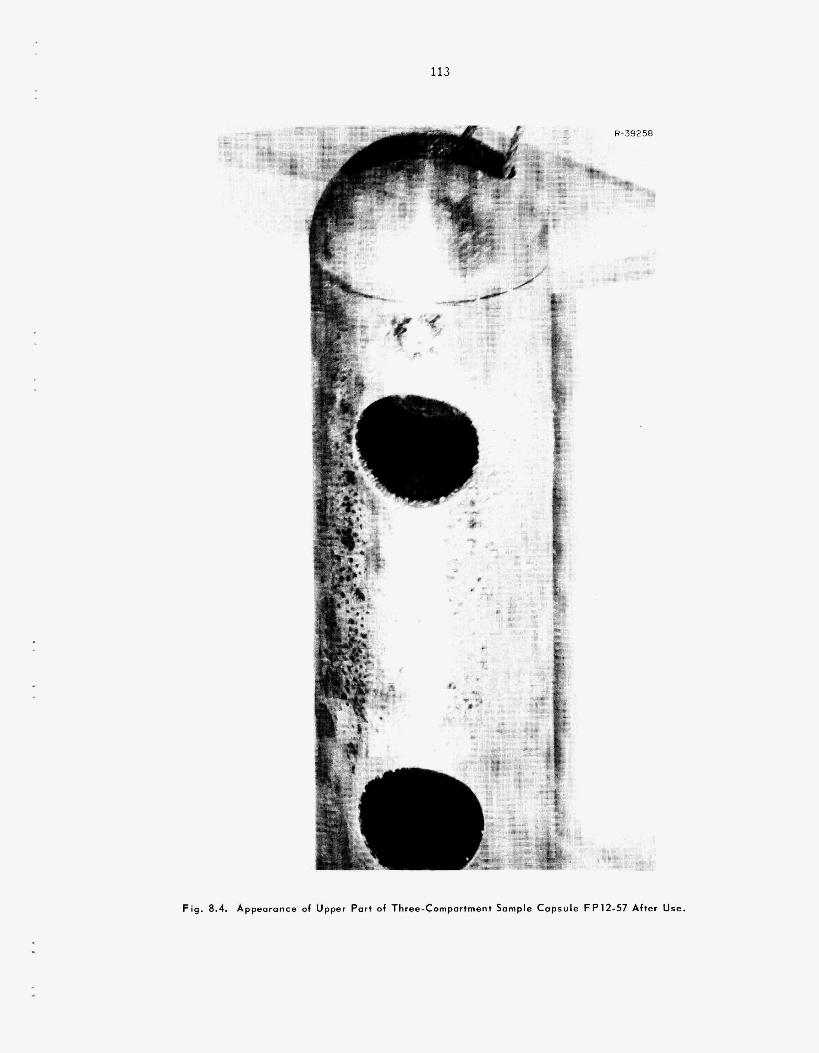
113
Fig. 8.4. Appearance of Upper Port of Three-Compartment Sample Capsule FP12-57 After Use.
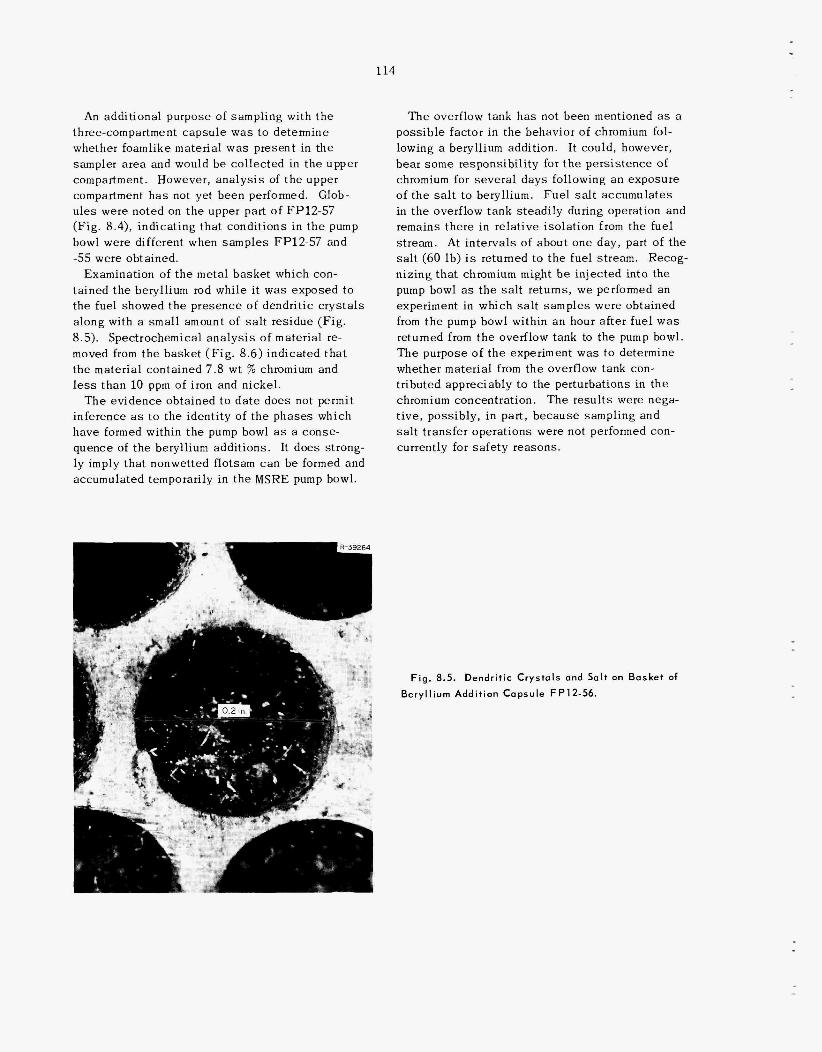
114
An additional purpose of sampling with t h e
whether foamlike material w a s present in the sampler a rea and would be col lected in t h e upper compartment. How r, ana lys i s of t h e upper compartment h a s not yet been performed. Glob- u l e s were noted on t h e upper part of FP12-57 (Fig. 8.4), indicating tha t conditions in t h e pump bowl were different -55 were obtained.
tained t h e beryllium the fuel showed t h e along with a small a
moved from t h e baske t (Fig. 8.6) indicated that t h e material contained 7.8 wt % chromium and less than 10 ppm of iron and nickel.
The ev idence obtained to da t e does not permit inference as to the identity of t h e phases which have formed within the pump bowl as a conse- quence of t he beryllium additions. It does strong- ly imply that nonwetted flotsam can be formed and accumulated temporarily in t h e MSRE pump bowl.
ompartment capsule was to determine
n samples FP12-57 and
Examination of the metal baske t which con- le i t was exposed to
ectrochemical anal
1
c
The overflow tank h a s not been mentioned as a poss ib le factor in the behavior of chromium fol- lowing a beryllium addition. It could, however, bear some responsibil i ty for t h e pers i s tence of chromium for several days following a n exposure of t h e salt to beryllium. Fue l s a l t accumulates in t h e overflow tan during operation and remains there in re ation from the fuel stream. At intervals of about one day, part of the salt (60 lb) is returned to t h e fuel stream. Recog-
mium might b e injected into the pump bowl as the s a l t returns, we performed an experiment in which salt samples were obtained from t h e pump bowl within a n hour after fuel w a s returned from t h e overflow tank to the pump bowl. The purpose of t h e experiment w a s to determine whether material from the overflow tank con- tributed appreciably to the perturbations in t h e chromium concentration. The resul ts were nega- t ive, possibly, in part, because sampling and salt transfer operations were not performed con- currently for s a fe ty reasons.
Fig , 8.5. Dendri t ic Crystals and Salt on Basket of
Beryl I ium Add i t i o n Capsule F P 12-56.
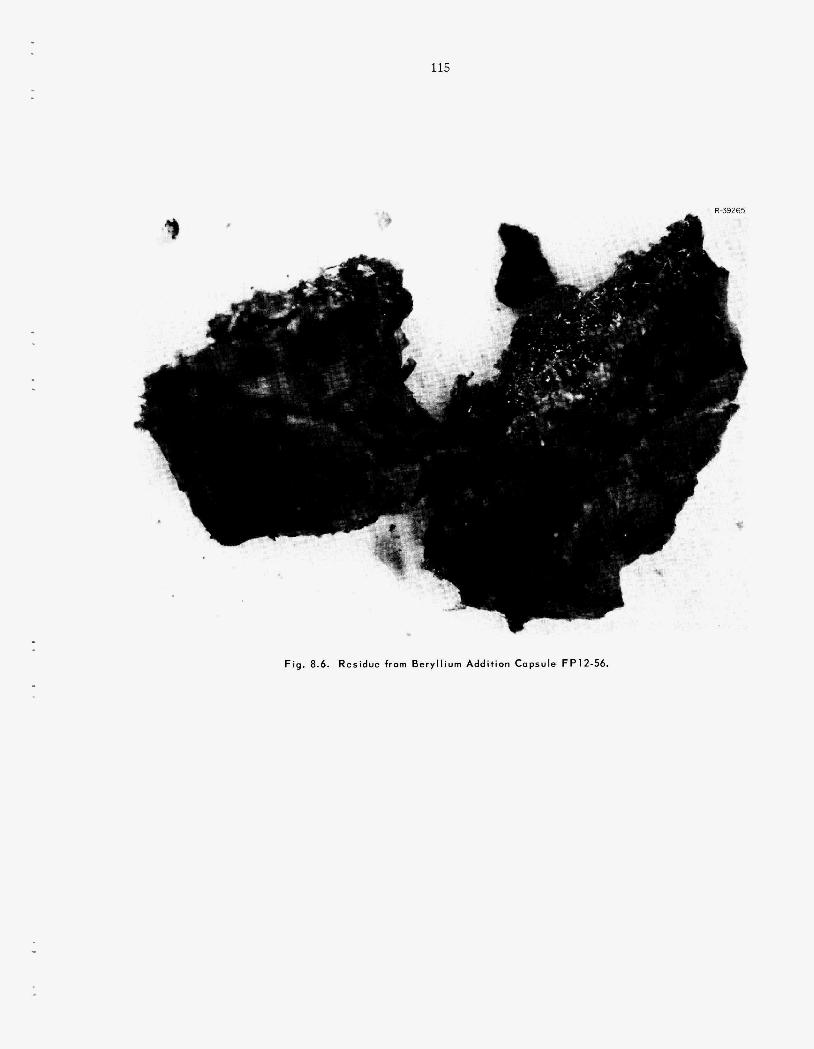
115
*”
6
L
R-39265
Fig. 8.6. Residue f r o m Beryl l ium Addition Copsu le FP12-56.
9. Fission Product Behavior in the MSRE
S. S. Kirslis
Resu l t s of previous tests in-pile and in the MSRE have been very reassur ing regarding most a s p e c t s of t h e chemical compatibility of graphite and Has te l loy N with molten f i ss ioning sa l t . The a s p e c t of chemical behavior currently caus ing s o m e practical concern is the observed tendency of noble-metal f i s s ion products (Mo, Ru, Tc, Te, and Nb) to depos i t on graphite sur faces exposed to f i ss ioning fuel i n the MSRE. Some of t he iso- topes of t h e s e e lements have neutron c r o s s sec- t ions high enough to affect significantly the neutron economy of a n MSBR a f t e r s eve ra l years of operation if a large fraction of t h e s e i so topes depos i ted in t h e graphite core. Recent work in the MSRE h a s been directed mainly toward eluci- da t ing the behavior of t h e s e noble-metal f i s s ion products.
is reported in some de ta i l in t h e following sec- tions. T h e s e include (1) quantitative measure- ments of the concentration of fission product s p e c i e s in samples of t h e MSRE pump bowl cover gas captured during a number of d iverse reactor operating conditions, (2) ana lys i s of fuel samples for f i ss ion products, (3 ) examinations and a n a l y s e s of g a p h i t e and Hastelloy N specimens exposed to molten fissioning fuel s a l t in t he MSRE for 24,000 Mwhr of power operation, and (4) qua l i ta t ive meas- urements of f i ss ion product deposit ion on metal and on one s e t of graphite samples exposed to the cover g a s and fuel phases in t h e MSRE pump bowl under a variety of reactor operating conditions.
Information derived from seve ra l kinds of t e s t s
9.1 FISSION PRODUCTS IN MSRE COVER GAS
Sampling of t he cover gas in the MSRE pump bowl h a s been continued in a n effort t o def ine the nature and t h e quantity of t h e gas-borne spec ie s .
F. F. Blankenship
F i v e gas samples were obtained a n d ana lyzed during t h e period covered by th i s report. In t h e s e s tud ie s w e attempted to determine how the nature and amount of gas-borne s p e c i e s a r e affected by (1) addition of beryllium to the fuel, (2) s topping the MSRE fuel pump, (3) a long reactor shutdown, and (4) increas ing the volume of helium bubbles in the fuel.
All samples were taken in evacuated 20-cc capsu le s s e a l e d by fus ib le plugs of 2 L i F . BeF,; t h e s e plugs melted and permitted t h e capsu le s to fill with the cover g a s upon insertion into the hea ted pump bowl. Samplers, sampl ing procedures, and ana ly t ica l operations were, i n e a c h c a s e , very similar t o those previously described. '
S ince it w a s not poss ib le t o instrument the sampling assembl ies , no definit ive information concerning the temperature of t he g a s a t time of sampling is available. Temperatures were cer- tainly higher than the melting point of the fusible plug (-450OC). It seems likely that the tempera- ture i s near 6OOOC and that the capsu le ac tua l ly drew 20 cc of gas a t t h i s temperature and 5 psig; the sampled volume of gas a t S T P was , therefore, about 8.5 cc.
T h e resu l t s obtained from t h e s e f ive samples a r e shown in Tab le 9.1. All va lues (except those for uranium) a r e given in disintegrations per minute for t h e total sample , and all have been corrected to correspond to the t i m e of sampling if t h e reactor w a s operating, or to time of shut- down for t he two cases where the reactor was not a t power. T h e uranium va lues a r e in micro- grams of uranium per sample. Conditions of re- ac tor operation and spec ia l features of e a c h t e s t a r e indicated in Tab le 9.1.
'S. S . K i r s l i s , MSR Program Semiann. Progr. Rep t . A @ . 31 , 1966, ORNL-4037, p. 165.
116
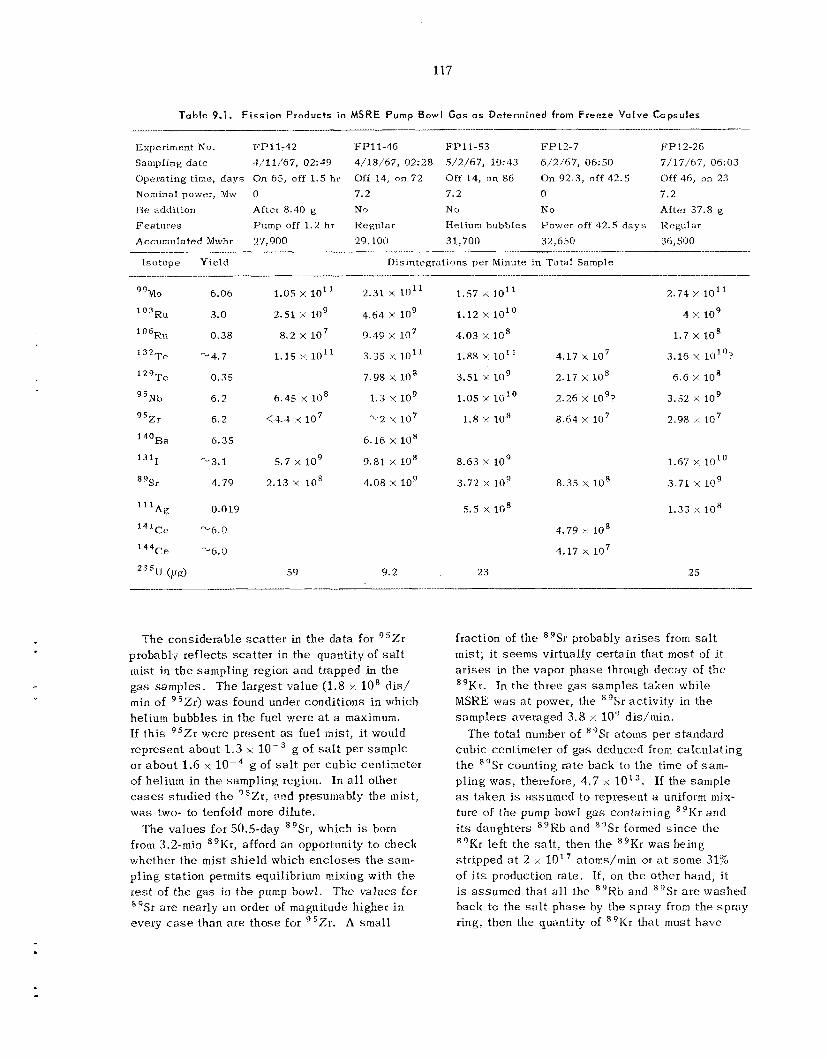
117
Table 9.1. F i s s i o n P r o d u c t s in MSRE P u m p Bowl Gas a s D e t e r m i n e d from Freeze Va lve C a p s u l e s
r
~~~ ~~
Exp e rirrient No. F P l l - 4 2 FPll-4G FP 11-53 FP12-7 FP12-26 Sampling date 4/11/67, 02:49 4/18/67, 02:28 5/2/67, 10:43 6/2/67, 06:50 7/17/67, 06:03 Operating t ime , days On 65, off 1.5 hr Off 14, on 92 Off 14, on 86 On 92.3, off 42.5 Off 46, on 23 Nominal power, Mw 0 7.2 7.2 0 7.2 R e addition After 8.40 g No Nu N o After 37.8 g F e a t u r e s P u m p off 1 .2 hr Regular Neliuni bubbles Power off 42.5 days Regular
Accumulated Mvrhr 27,900 29,100 31,700 32,650 36,500
Isotope Yield Disintegrations per Minute in Total Sample
6.06
3. n 0.38
-4.7
0.35
6.2
6.2
6.35
-" 3.1
4.79
0.019
-6.0
-6.0
1.05 j< lo*1 2 . 5 2 x 10'
8.2 x l o 7 1.15 x 10"
6.45 x 10⁸
(4.4 107
5.7 x 10'
2.13 x 10'
5 9
2.31 x 10"
9.49 10'
3 . 3 5 x 10"
1.3 x 10⁹
-2 x l o 7
4.64 X 10'
7.98 x lo8
6.16 x 10'
9.81 x 10'
4.08 x io9
9.2
1.57 x 10"
1.12 x lo1"
1.88 x 10"
3.51 x l o 9 1.05 x 1 o 1 O
1.8 x 10⁸
4.03 X 10'
8.63 x 10'
3.72 Y, lo9
5.5 x 10⁸
23
2.71 Y 10' l
4 ;.: 10
1.7 x 10'
3.16 x lo1", 4.17 x 10⁷
2.17 x 6.5 x 108
2.26 x l o 9 > 3.52 x 10⁹
8.64 X l o 7 2.98 / 107
1.67 X 10"
3.71 x 10⁹ 8.35 x 10'
1.33 x 10'
4.79 x 10⁸
4.17 10'
25
T h e considerable sca t t e r in t h e data for "Zr probably reflects s ca t t e r i n t he quantity of s a l t mist in the sampling region and trapped in the gas samples. T h e la rges t va lue (1.8 x 10' d is / min of "Zr) w a s found under conditions in which helium bubbles in the fuel were a t a maximum. If th i s 95Zr were present as fuel mist , i t would represent about 1.3 x g of salt per sample or abou t 1.6 x 10---' g of salt per cubic centimeter of helium in the sampling region. In all other cases s tudied t h e 95Zr , and presumably the mist, w a s two- to tenfold more dilute.
T h e values for 50.5-day 89Sr, which is born from 3 . 2 - m i n 89Kr, afford an opportunity to check whether the m i s t sh i e ld which enc loses t h e s a m - pling s t a t ion permits equilibrium mixing with t h e r e s t of the gas in the pump howl. The values for "Sr are nearly a11 order of magnitude higher i n every case than ate those for "Zr. A sinall
fraction of the 8gSr probably a r i s e s from s a l t mi s t ; it seems virtually certain that m o s t of i t a r i s e s in the vapor phase through decay of the 8 9 K ~ . In the three gas samples taken while MSRE was a t power, the 89Sr ac t iv i ty in the samplers averaged 3.8 x 10' dis/min.
T h e total number of "Sr atoms per standard cubic centimeter of gas deduced from ca lcu la t ing t h e 89Sr counting rate back to the time of s a m - pling was , therefore, 4.7 A II t he sample as taken js assumed to represent a uniEorm mix- ture of the pump bowl gas containing "Kr and its daughters 89Rb and 89Sr formed s i n c e the R 9 K r left the sa l t , then the 89Kr w a s being stripped at 2 x 10" atoms/min or a t some 31% of i t s production rate. If , on the o ther hand, i t is assumed that al l t h e "Rb and "Sr are washed back to the s a l t phase by the spray from t h e spray ring, then the quantity of "Kr that must have
118
been stripped i s more nearly 50% of the production rate.
89Kr is lo s t to the moderator graphite, (2) no "Kr i s l o s t through burnup, and (3) the fuel which flows through the pump bowl is stripped of 89Kr with 100% efficiency, it may be simply shown that
With the simplifying assumptions that (1) no
"Kr stripped/min F
89Kr produced/min ~ ~
__ A 4 F '
where F i s that fraction of the fuel volume which p a s s e s the stripper (pump bowl) per minute and h
is the decay constant (0.693/3.2 min) for "Kr. For MSRE, with the pump bowl flow rate at 4% of total flow, th i s expression yields the value 29% for the "Kr l o s t to the stripper gas . It i s un- likely that the stripping efficiency in the pump bowl i s 100%; moreover, i t is certain that some fraction of the 8 9 K r i s los t by penetration into the graphite. Th i s rate of l o s s of 8 9 K r to the moderator - which i s probably l e s s than 30% of the production rate - will in effect introduce a third term to the denominator of the equation and lower the fraction lo s t to the off-gas. F r o m t h e s e da ta , therefore, it seems poss ib le that the gas a t the sampling station m a y be more concentrated in *'Sr than is the average gas i n the pump bowl, but the concentration factor i s not large.
The absolu te amounts of 99Mo, corrected back to sampling time or time of previous shutdown, show rather minor variations with reactor op- erating conditions. The lowest value i s for run FPll-42, in which the sample was taken 1.5 hr after shutdown and 1 .2 hr after stopping t h e fuel pump. The normal runs showed the higher 9 9 M 0 concentrations, although the highest value might have been expected for F P l l - 5 3 , in which t h e off- gas pressure was suddenly lowered jus t before sampling to ensure a re lease of helium bubbles from the pressurized graphite bars into the cir- culating fuel. F r o m the amount of 9 9 M 0 found i n t hese samples (mean value 1.9 x 10" dis/min or 2.2 x 10" d i s iiiiii-' cc-' or 1.3 x l O I 4 atoms
'Mo/cc), the effective partial pressure of the volati le s p e c i e s i s ca lcu la ted to be 4 x l o p 6 atm. The to ta l "Mo lo s t a t 4.2 l i ters/min of helium flow is 7.8 x 10'' atoms/day. Th i s is about 18% of the total inventory of 4.4 x 10" afoms, or about 70% of the daily production rate. If i t i s assumed that the material i s l o s t as MoF,,
th i s corresponds to a loss of 4.6 x l o 2 ' fluorine atoms/day, or a n equivalent of F- per 150 days. T h e very considerable quantit ies of 99Mo found on the graphite and the Hastelloy surve i l lance specimens a s well a s in the fuel stream do not s eem cons is ten t with such large losses to the gas sys tem.
The l o 3 K u , I o 6 R u , I2 'Te , and 132Te concen- trations generally showed parallel behavior over a l l the runs, with particularly good correspondence between the Io3Ru and 06Ru va lues . T h e ratios for the two isotopic pairs agreed satisfactorily with the ratios of fission y ie lds divided by half- l ives. s toppage was minor on this s e t of isotopes. The h ighes t va lues for Io3Ru, l o 6 R u , and '29Te were obtained during the pressure re lease run , FPll-53. However, ' 3 2 T e , l ike 99iV0, did not show a high value during th i s particular t e s t .
s amples F P l l - 4 2 and FP12-7 are puzzling. In each c a s e the reactor had been shut down long enough to permit t he complete decay of 8 9 K r be- fore the sample was taken. The 9sZr ana lyses indicated fuel mist concentrations too low to account for the 89Sr values. It may be tha t other ac t iv i t ies interfered with the beta counting re- quired for 89Sr ana lys i s . If t h e s e va lues are accepted as real (and further sampling must be done to confirm them) i t would appear that , a t l ea s t when the pump is off or the reactor i s not a t power, the sampling volume is poorly flushed by the cover gas sys tem.
magnitude from the first run to the fifth, with a marked peak a t the pressure release run, FP11- 53. Not a l l of the overall increase could be as- cribed to the increase of "Nb inventory in the reactor sys tem with continued reactor operation (cf. moderate increases in ' 0 3 R u and Io6Ru) .
T h e ana lyses for 2 3 5 U from four of t h e s e r u m yielded values higher by a t l ea s t a factor of 10 than those observed in earlier t e s t s . ' T h e s e relatively high values for 2 3 5 U are, a t best , dif- ficult to explain. If, a s noted above, t he values for "Zr are taken to indicate the ex is tence , and quantity, of s a l t mist in the sample, then sample F:Pll.-53 might have been expec ted to have about 20 p g of 2 3 s U in such mist. However, in no other case of those shown i n Tab le 9.1 can such an ex- planation account for more than 20% of t h e observed uranium.
T h e effect of short shutdown and pump
T h e appreciable concentrations of *'Sr found in
T h e 95Nb values showed a fivefold increase of
119
T h e l o s s e s indicated by these samples a re ap- preciable. The mean of four samples shows nearly 30 pg/sample or about 3.5 pg per cub ic centimeter of helium. Th i s would correspond to somewhat less than 20 g/day of 'U or nearly 60 g/day of the uranium in the fuel. (The figure remains a t nearly one-half th i s level if t he h ighes t figure i s rejected.) I t seems absolutely certain that the reactivity ba lances on the reactor through 250 days of full-power operation would have speedily d i sc losed losses of far smal le r magnitude than these . It is difficult t o conce ive of a mechanism other than volati le U F 6 to account for l o s s e s of uranium to the vapor. It is, however, extremely difficult t o see how losses of th i s s o r t could b e reconciled with the nuclear behavior (and the chemical ana lyses) of MSRE. Further s amples of t he gas sys t em will b e made to he lp resolve this apparent dilemma.
The ef fec t of shor t shutdown and pump s toppage (FP11-42) on noble-metal volati l ization w a s in- significant. Th i s sugges t s that t he volati l ization process does not depend on fuel nor bubble cir- culation nor on the fissioning process i t se l f , but is probably a loca l phenomenon taking p l ace a t t he fuel-salt-gas interface. Beryllium addi t ions to the fuel had no discernible effect on the volati l ization of noble-metal f ission products. T h i s fact i s rein- forced in some detail ( s e e subsequent s ec t ions of this chapter) by data obtained by insertion of getter wi res into the pump bowl vapor space .
T h e effect of reactor drain and long shutdown (FP12-7) w a s cons is ten t ly to lower observed noble-metal volati l ization (observed ac t iv i t i e s were, of course , calculated back to the t ime of previous shutdown). T h i s observation is con- s i s t e n t with all previous da ta on t he e f fec t of long shutdowns. Presumably a n apprec iab le fraction of t h e noble metals is depos i ted on the wa l l s of the drain tank and reactor sys t em during a long shutdown. The minor e f fec t of shor t shut- down and the incomplete deposit ion during long shutdown seem to ind ica te a s low deposit ion process.
T h e p res su re r e l ease experiment (FPll-53) re- su l t ed in a n appreciable increase of volati l ization of most f ission products but not of "Mo or 132Te. Niobium-95 showed the most d i s t inc t increase. I t is particularly puzzling that the '' 'Te concentra- tion increased markedly while t he ' 3 2 Te concen- tration fell sl ightly. Clearly, further experiments
of t h i s kind would b e required to permit definite interpretations.
I t cannot b e claimed that the mechanism for volati l ization of many of t hcse materials is known. As has been shown elsewhere' f 2 t he volati le flu- or ides of many of t hese materials (notably Mo, Ru, Te , and, probably, Nb) a r e too uns tab le to e x i s t a s equilibrium components of a fuel sys tem con- taining appreciable quantit ies of U F 3 . It is true that, for example, "Mo formed a t about 5 x 10" atoms/day probably exceeds greatly the so lubi l i ty limit for th i s material in t he sa l t . S ince it is born in the salt in a n atomic dispersion, i t may, i n ef- fect, behave as a supersa tura ted so lu t ion ; that is, the activity of molybdenum may, in fact, b e mark- edly greater than unity. It s eems most unlikely tha t it can have ac t iv i t ies greater than 10- l o , which would b e required i f MoF, were to be s tab le . Such Eindings as the presence of l 1 Ag, for which i t is difficult to imagine vola t i le f luorides, seem to render the volati le fluoride mechanism more un- l ikely. It s t i l l seems more likely that an ex- planation b a s e d upon the finely divided metall ic s t a t e will prove iruc?, though such explanations a l s o have their drawbacks.
9.2 FISSiON PRODUCTS IN MSRE FUEL
T h e program of sampling and ana lys i s of samples of MSRE fuel for f i ss ion product s p e c i e s h a s been continued by u s e of apparatus and techniques de- scribed previously. '-' Table 9.2 shows data for 16 f i ss ion product i so topes and for 2 3 'Np obtained from a s e r i e s of four samples from a long s t a b l e run o f MSRE, from a sample obtained shortly after shutdown i n th i s run, a sample after the salt had been cooled for 42.5 days , and a sample from a relatively early s t a g e in the subsequent power run.
Captions in th i s table show the operating history of MSRE and t h e spec ia l conditions prevailing in t h e reactor at t h e t i m e t h e sample was taken. Tab le 9.2 also includes estimates of the fraction of t h e isotope represented by these ana lyses in the 4850 kg of circulating fuel.
'5. S. Kirs l i s and F. F. Blankerrship, Reactor Cham. Div. Ann. Progr. Rept. D e c . 31, 1966, ORNL-4076, p. 48.
3 S . S . K i i s l i s arid F. F. Blankenship, MSR Program Serninnn. Progr. Rept. Feh. 28, .1967, ORNL-4119, p. 124.
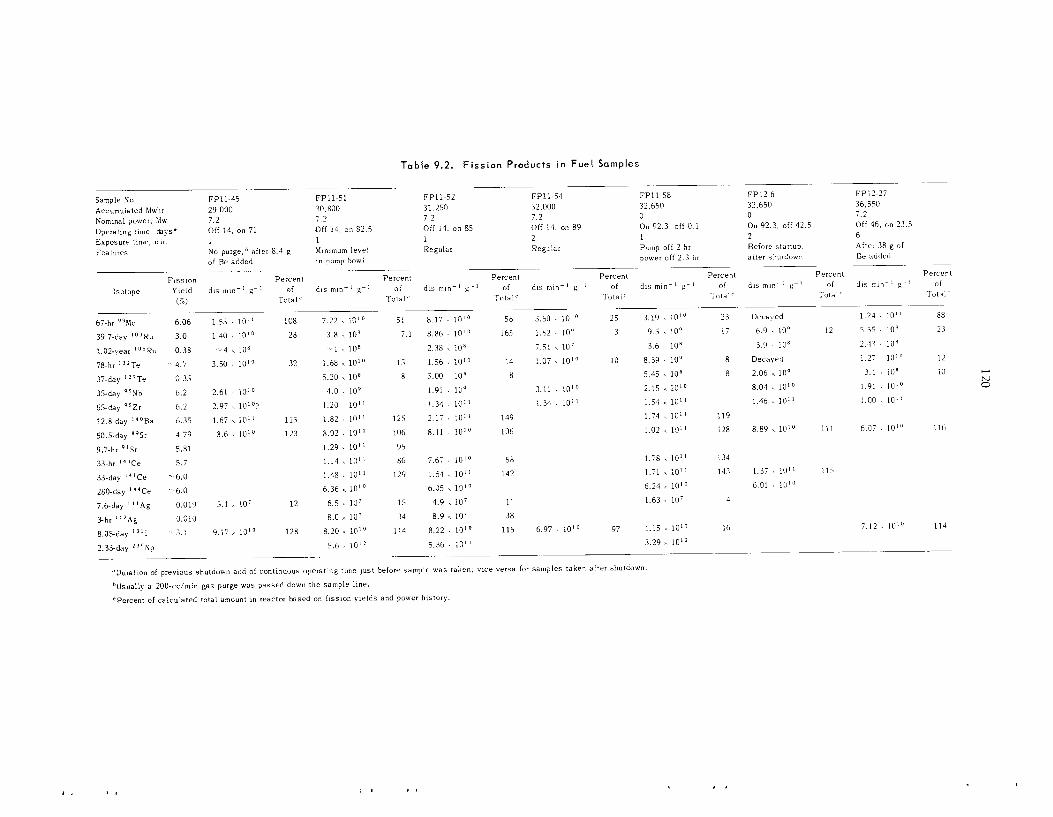
12.0
E > 0
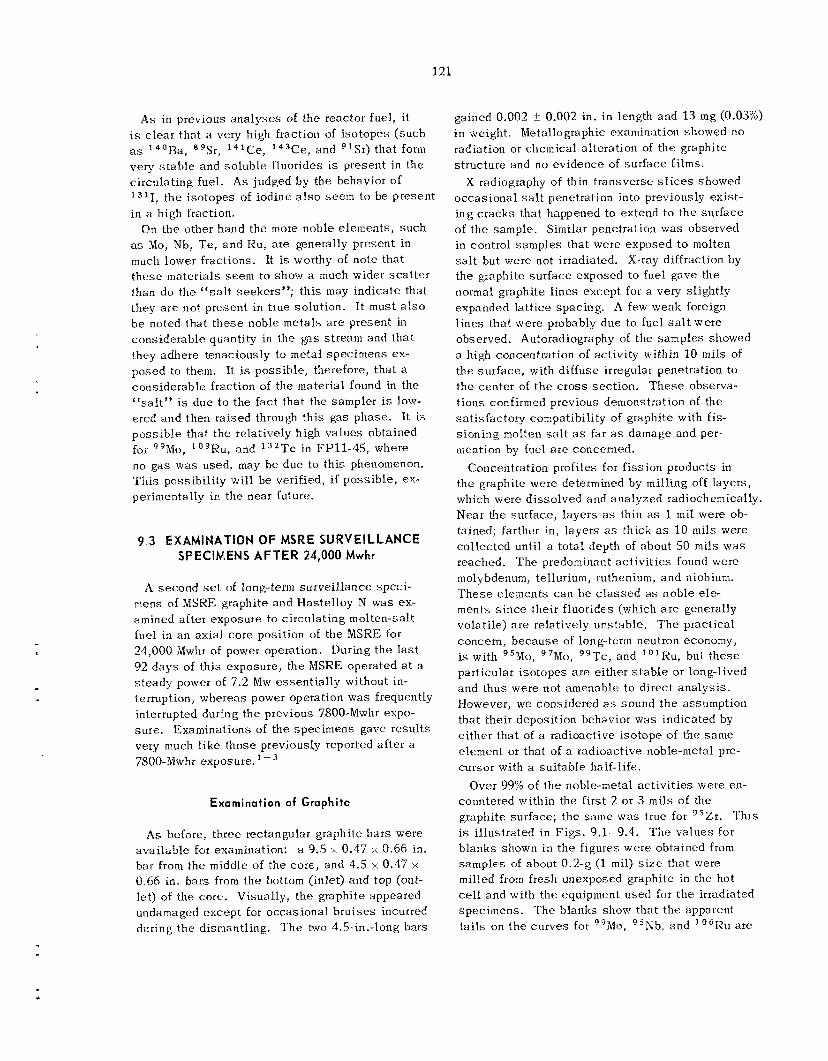
1 2 1
As in previous ana lyses of t he reactor fuel, it is c l ea r t ha t a very high fraction of i so topes (such as * 4 0 B a , 89Sr, 141Ce, 14'Ce, and "Sr) t ha t form very s t a b l e and so luble fluorides i s p resent in the circulating fuel. As judged by the behavior of
in a high fraction.
as Mo, Nb, T e , and Ru, are generally present in much lower fractions. It is worthy of note tha t t hese materials s eem to show a much wider s c a t t e r than do the "sa l t seekers"; th i s may indica te that they a r e not present in true solution. I t must a l s o b e noted tha t t h e s e noble meta ls a r e present in cons iderable quantity in t he gas s t ream and tha t they adhere tenaciously to metal s p e - ' Limens ex- posed to them. It is poss ib le , therefore, t ha t a cons iderable fraction of the material found in the "salt" is due to the fact that the sampler i s low- ered and then ra i sed through th i s gas phase . It i s poss ib l e that t he relatively high va lues obtained for g9Mo, l o 9 R u , and 132Te in F P l l - 4 5 , where no g a s was used, may b e due to th i s phenomenon. Th i s possibil i ty will b e verified, i f poss ib l e , ex- perimentally in the near future.
'I, t h e i so topes of iodine also seem to be present
On the other hand the more noble elements, such
9.3 EXAMINATION OF MSRE SURVEILLANCE SPECIMENS AFTER 24,000 Mwhr
A second s e t of long-term surve i l lance spec i - mens of MSRE graphite and Has te l loy N was ex- amined after exposure to c i rcu la t ing molten-salt fuel in an ax ia l core posit ion of the MSRE for 24,000 Mwhr of power operation. During t h e l a s t 92 d a y s of this exposure, the MSRE operated a t a s teady power of 7.2 Mw essen t i a l ly without in- terruption, whereas power operation w a s frequently interrupted during the previous 7800-Mwhr expo- sure . Examinations of the specimens gave resu l t s very much l ike those previously reported a f te r a 7800-Mwhr exposure. ' -'
Examination of Graphite
As before, three rectangular graphite ba r s were ava i lab le for examination: a 9.5 x 0.47 x 0.66 in. bar from the middle of the core , and 4.5 x 0.47 x
0.66 in. bars from the bottom (inlet) and top (out- let) of the cote. Visually, t h e graphite appeared undamaged except for occas iona l b ru i se s incurred during the dismantling. T h e two 4.5-in.-long bars
gained 0.002 k 0.002 in. i n length and 13 mg (0.03%) in weight. Metallographic examination showed no radiation or chemical alteration of the graphite structure and no ev idence of sur face fi lms.
X radiography of thin transverse slices showed occas iona l s a l t penetration into previously exist- ing c racks that happened to extend to the sur face of t h e sample. Similar penetration was observed in control samples that were exposed to molten salt but were not irradiated. X-ray diffraction by th.e graphite sur face exposed to fuel gave the normal graphite l ines except for a very slightly expanded la t t ice spacing. A few weak foreign l i nes tha t were probably due to fuel salt were observed. Autoradiography of the samples showed a high concentration of activity within 10 mils of t he sur face , with diffuse irregular penetration to the center of t h e c ros s sec t ion . T h e s e observa- t ions confirmed previous demonstration of the sa t i s fac tory compatibility of graphite with fis- sioning molten s a l t as far a s damage and per- meation by fuel are concerned.
concent ra t ion profiles for f i ss ion products in t h e graphite were determined by milling off layers, which were d isso lved and ana lyzed radiochemically. Near the surface, l ayers as thin as 1 mil were ob- tained; farther in, layers a s thick a s 10 mils were co l lec ted until a total depth of about 50 m i l s w a s reached. T h e predominant ac t iv i t i e s found were molybdenum, tellurium, ruthenium, and niobium. T h e s e e lements c a n b e c l a s s e d as noble ele- ments s i n c e their f luorides (which a r e generally volatile) are relatively imstable. T h e practical concern, because of long-term neutron economy, is with g5Mo, 97Mo, g g T c , and "'Ru, but t h e s e particular i so topes a r e either s t a b l e or long-lived and thus were not amenable to direct ana lys i s . However, we considered a s sound t h e assumption tha t their deposit ion behavior was indicated by e i ther tha t of a radioactive i so tope of the s a m e element or tha t of a radioactive noble-metal pre- cursor with a su i tab le half-life.
Over 99% of the noble-metal ac t iv i t ies were en- countered within the first 2 or 3 m i l s of the graphite surface; t he same w a s true for 95Zr. T h i s is il lustrated in F igs . 9.1-9.1, T h e va lues f o r b lanks shown in t h e figures were obtained from samples of about 0.2-g (1 mil ) s i z e that were milled from fresh unexposed graphite in the hot cell and with t h e equipment used for t h e irradiated spec imens . T h e blanks show tha t the apparent ta i l s on t h e curves for "Mo, "Nb, and '0611zu are
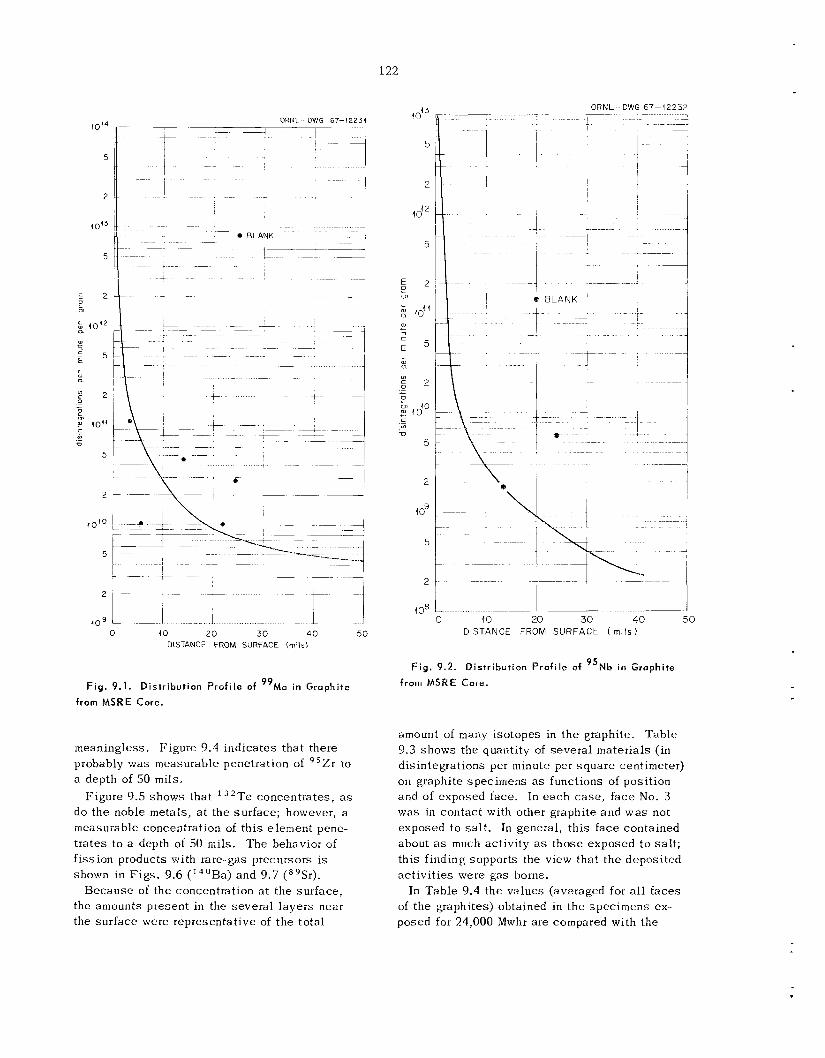
122
ORNL-- -DWG 67-12232 ORNL DWG 67-12234
(014
5
2
4 o~~
5
2
- BLANK -~
,--\ I t 1
40"
5
0 10 20 3 0 40 50 DISTANCE FROM SURFLCE (mils)
Fig . 9.1. Distribution Profi le of 9 9 M 0 in Graphite
from MSRE Core.
meaningless. Figure 9.4 ind ica tes that there probably w a s measurable penetration of a depth of 50 mils.
do the noble metals, a t t he surface; however. a measurable concentration of t h i s element pene- t ra tes t o a depth of 50 mils. The behavior of f i ss ion products with rare-gas precursors i s shown in Figs. 9.6 (I4'Ba) and 9.7 (sgSr).
Because of the concentration a t the surface, the amourits present in the severa l l ayers near the sur face were representative of t h e total
'Zr to
Figure 9.5 shows that '32Te concent ra tes , as
5
2
Id'
5
~ . . . .. .. . . . . . . -. . - I .~ : - - - I I ,
1
2
lo9
5
2
108 0 10 20 3 0 40 5 0
D I S T A N C E FROM S U R F A C E ( m i l s )
Fig . 9 .2 . Distribution Prof i le of 95Nb in Grophite
from MSRE Core.
amount of many isotopes in t h e graphite. Table 9.3 shows the quantity of severa l materials (in disintegrations per minute per square centimeter) on graphite specimens as functions of posit ion and of exposed face. In e a c h c a s e , face No. 3 was in contact with other graphite and w a s not exposed to sa l t . In general, th i s face contained about as much activity a s those exposed t o sa l t ; th i s finding supports the view tha t t he depos i ted ac t iv i t ies were gas borne.
In l a b l e 9.4 the va lues (averaged for a l l faces of t he graphites) obtained in t h e specimens ex- posed for 24,000 Mwhr a re compared with the
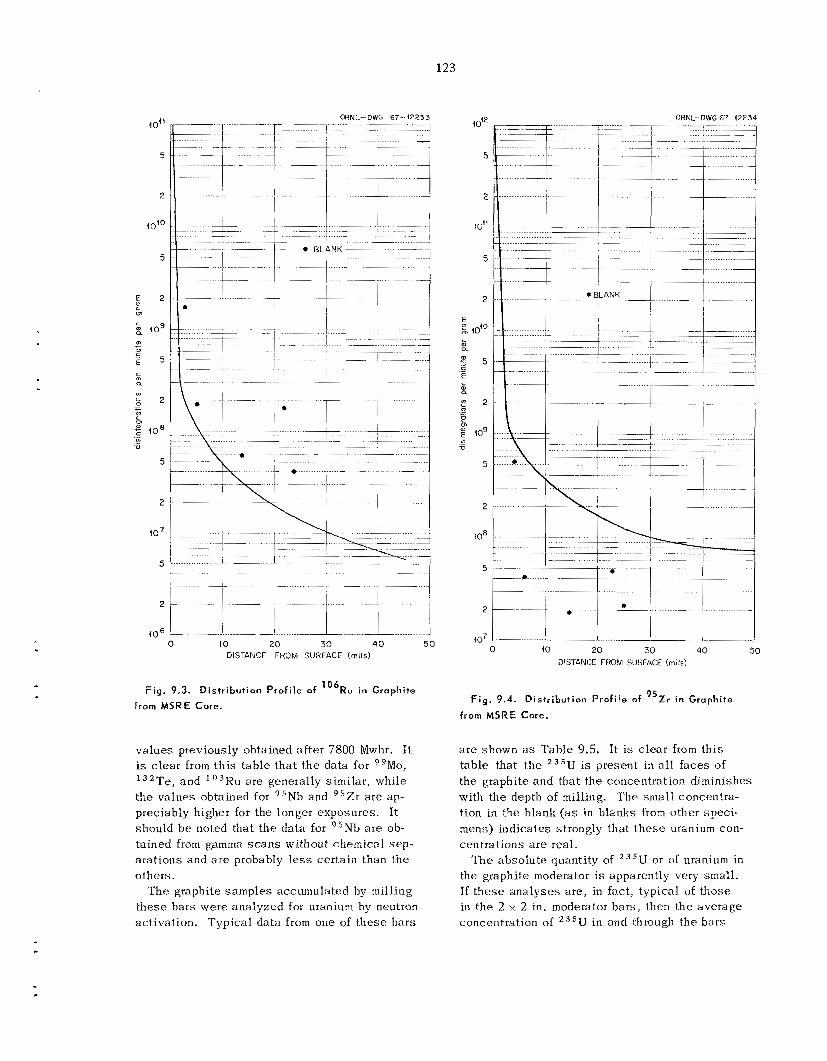
123
40''
5
2
5
L a) CA
5
2
to7
5
2
ORNL-DWG 67 12233
I
0 i o 2 0 30 40 50 CllSTANCE FROM SURFACE (mils)
Fig. 9 . 3 . Dis tr ibut ion Prof i le of l o 6 R u in Graphite
from MSRE Core.
va lues previously ohtained after 7800 Mwhr. I1 i s c lea r f rom th i s tab le tha t t h e data for 99Mo, * 2 T e , and Ku a re generally similar, while t he va lues obtained for "Nb and 9 5 2 r a r e ap- preciably higher for the longer exposures. It should b e noted that t h e da ta for 95Nb a r e ob- tained from gamma s c a n s without chemical sep- a ra t ions and a r e probably less cer ta in than the others.
T h e graphite s amples accumulated by milling t h e s e ba r s were ana lyzed f o r uranium by neutron activation. Typica l da ta f rom one of these bars
ORNI.--0WG 67- 12234
....... 1.-
~ .....
i ..... __A I 1 1 1 ...._..___ 407 I 1
20 30 40 SO 0 io DISTANCE FROM S[JW/iC€ (mils)
Fig. 9.4. Dis tr ibut ion Prof i le of 95Zr in Graphi te
from MSRE Core.
a r e shown as Table 9.5. It is c l ea r from th i s tab le that the 2 3 s U is present in all faces of the graphite and that t he concentration diminishes with the depth of milling. T h e smal l concentra- tion in the blank (as in blanks from other speci- mens) ind ica tes strongly that t h e s e uranium con- cent ra t ions a r e real .
'me absolu te quantity of 235U or of uranium in the graphite moderator is apparently very small . If t h e s e ana lyses a re , in fact , typical of those in the 2 x 2 in. moderator bars , then the average concetitration of 2 3 5 U in and through the bars
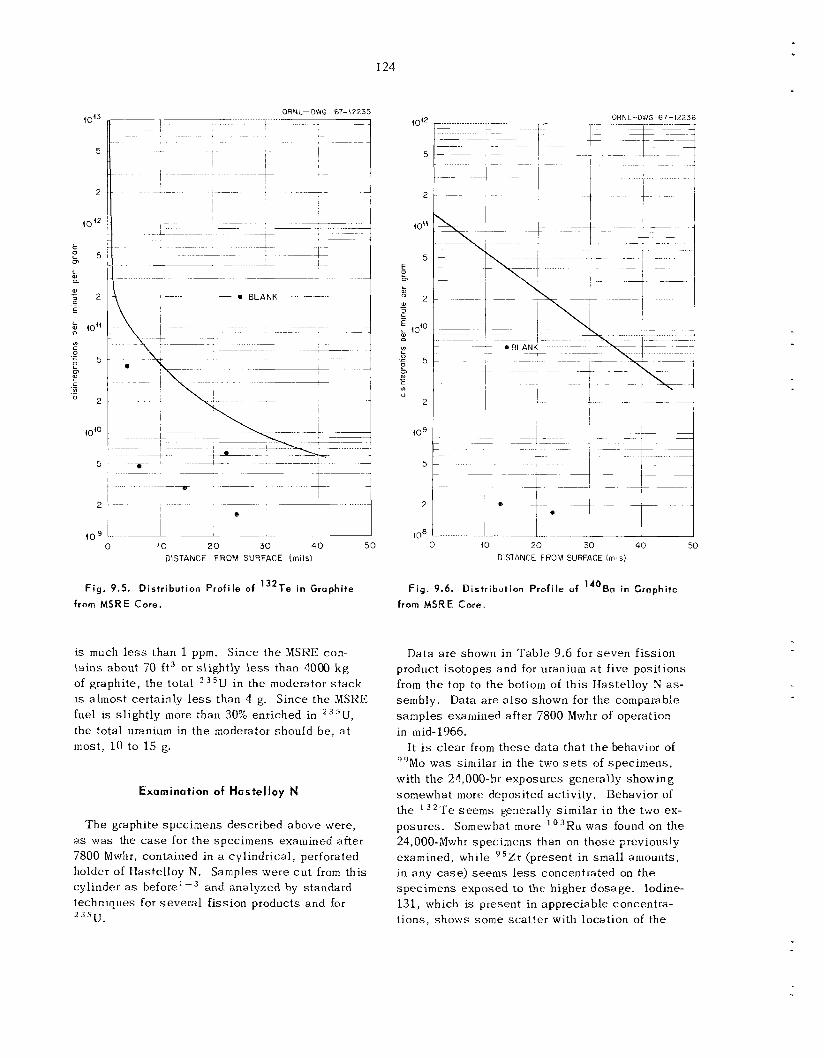
loi3
5
2
40 ’2
: 5 E
m
L al a
0)
i 2 E
10’’
“l c 0 .- - 5 e 0
c u1
V
.-
.-
.- 2
10’0
5
2
do9
ORNL- DWG 67-(?.?35
0 10 2 0 30 40 5 0 DISTANCE FROM SURFACE (mils)
F i g . 9 .5 . Distribution Prof i le o f 132Te in Graphite
from MSRE Core.
i s much less than 1 ppm. S ince the MSRE con- t a ins about 70 ft3 or sl ightly less than 4000 k g of graphite, the total 2 3 5 U i n the moderator s t ack is almost certainly less than 4 g. S ince the MSRE fuel i s s l igh t ly inore than 30% enriched in 2 3 5 U , the total uranium in the moderator should be, a t most, 10 to 15 g.
Examination of Hastelloy N
T h e graphite spec imens described above were, as was the case for t he spec imens examined after 7800 Mwlir, contained in a cylindrical , perforated holder of I-Iastelloy N. Samples were c u t from this cylinder as techniques for severa l f ission products and for 23513..
and analyzed by standard
5
2
to”
(09
5
2
108 0 to 2 0 30 40 50
DISTANCE FROM SURFACE lrntls)
F i g . 9.6. Distribution Prafile of 140Ba in Grnphite
from MSRE Core.
Data a r e shown in Tab le 9.6 for s even f i ss ion product i so topes and for uranium a t five posit ions from the top to the bottom of th i s Hastelloy N as- sembly. Data are a l s o shown for the comparable samples examined after 7800 Mwlir of operation in mid-1966.
I t i s c lear from t h e s e da t a tha t t h e behavior of ”Mo was similar in the two s e t s of spec imens , with t h e 24,000-hr exposures generally showing somewhat more deposited activity. Behavior of the 1 3 2 T e s e e m s generally similar i n the two ex- posures. Somewhat m o r e 1 0 3 R ~ ~ w a s found on the 24,000-Mwhr spec imens than on those previoiusly examined, while ’Zr (present in smal l amounts, in any case ) s e e m s l e s s concentrated on t h e specimens exposed to the higher dosage . Iodine- 131, which i s prcsent in appreciable concentra- t ions, shows some sca t t e r with location of the
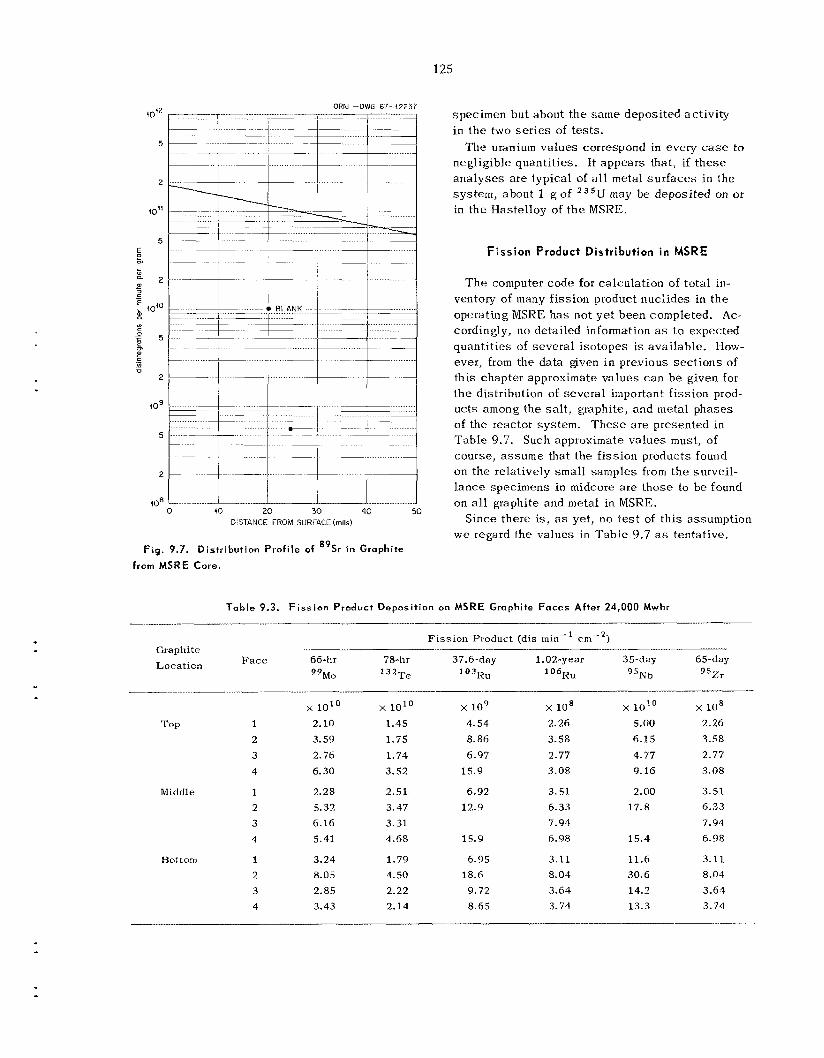
125
O R N L - D I G 67-4 2237
io9
5
DlST4NCE FROM SURF4CE (mils)
2
408
Fig, 9.7. Distribution Profile of 89Sr in Graphite
from MSRE Core.
specimen but about t h e same deposited activity in the two s e r i e s of tes t s .
negligible quantit ies. I t appears that, if t hese ana lyses are typical of a l l metal s u r i a c e s in the sys tem, about 1 g of 235U may be deposited on or in the Nastelloy of t he MSRE,
The uranium values correspond in every case to
Fission Product Distribution in MSRE
T h e computer code for calculation of total in- ventory of many fission product nuclides in the operating MSRE h a s not y e t been completed. Ac- cordingly, no detailed information a s t o expected quant i t ies of severa l isotopes is available. IIow- ever, from the data given in previous sec t ions of th i s chapter approximate values can b e given for t he distribution of severa l important fission prod- ucts among the s a l t , graphite, and metal phases of the reactor system. T h e s e a re presented in Table 9.7. Such approximate values must, of course, a s sume that the f i ss ion products found on the relatively small samples from the surveil- l ance specimens i n midcore are those to be found on a l l graphite and metal in MSRE.
w e regard the values in Tab le 9.7 as tentativc. Since there i s , as yet, no t e s t of th i s assumption
T a b l e 9.3. Fission Product Deposit ion on MSRE Graphite Faces After 24,000 Mwhr
Fission Product (dis rnin-' rrn--') ____ Graphite
Location Face 66-hr 78-hr 37.6-day 1.02-year 35-day 65-day
"Mo 132Te Io3Ru Io6Ru "Nb 95z r
x 1010 x 1010 io9 x 108 x 10'O x 108 ~- .... . . . . .. ____
T O P 1 2.10 1.45 4.54 2.26 5.00 2.26
2 3.59 1.75 8.86 3.58 6.15 3.58 3 2.76 1.74 6.97 2.77 4.77 2.77 4 6.30 3.52 15.9 3.08 9.16 3.08
Middle 1 2.28 2.51 6.92 3.51 2.00 3.51 2 5.32 3.47 12.9 6.33 17.8 6.33 3 6.16 3.31 7.91 7.91 4 5.41 4.68 15.9 6.98 15.4 6.98
Bottom 1 3.24 1.79 6.95 3.11 11.6 3.11 2 8.05 4.50 18.6 8.01 30.6 8.04 3 2.85 2.22 9.72 3.64 14.2 3.64 4 3.43 2.14 8.65 3.74 13.3 3.74
.-
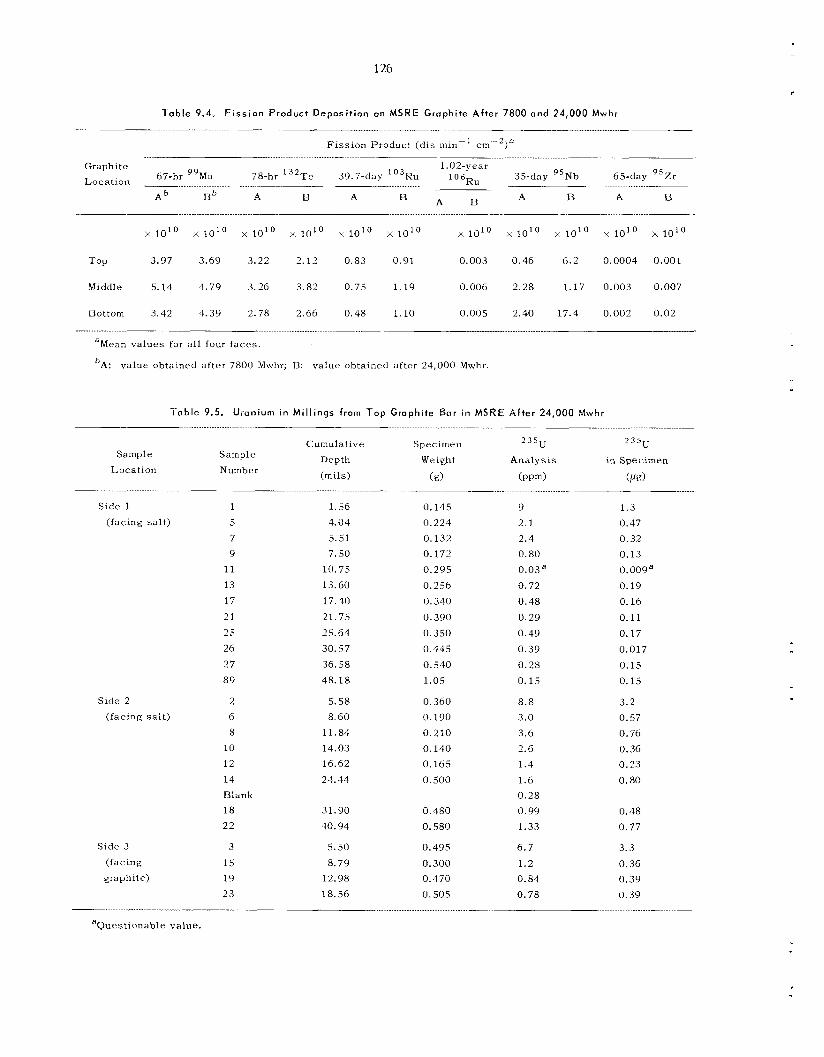
126
Table 9.4, Fiss ion Product Deposit ion on MSRE Graphite Af te r 7800 and 24,000 Mwhr
Fiss ion Product (dis min- ' cm--2)s .................... ~ . . . . . ............ . . . . . . . . . . . .. ....
Graphite 1.02-year 67-hr 99b10 78-hr I3*Tc 39.7-day ' 0 3 R u 1 O t j R u 35-day 9sNb 65-day 9sZr
Location ~. __-__ . . . . . . . . . . . . . ~ ................. ____ ~
A b B b A B A B A B A R A B
x 10'0 x 10'0 x 10'0 x 10'O x 10'0 x 10'0 x 10'0 Y 10'0 x 1010 x 10'0 x 10'0
' T O P 3.97 3.69 3.22 2.12 0.83 0.91 0.003 0.46 6.2 0.0004 0.001
Middle 5.14 4.79 3.26 3.82 0.75 1 .19 0.006 2.28 1.17 0.003 0.007
Bottom 3.42 4.39 2.78 2.66 0.48 1.10 0.005 2.40 17.4 0.002 0.02 I__....._......... . . . . . . .
aMean values for a l l four faces.
bA: value obtained after 7800 Mwiir; R: value obtained after 24,000 Mwhr.
Tab le 9.5. Uranium in Mi l l ings from T o p Graphite Bur in MSRE After 24,000 Mwhr .....
~
Cumulative Depth (mils)
Sample Sample Location Number
Specimen 2 3 S U 235u Weight Analysis in Specimen
( 9) (ppm) (peg)
Side 1 1 (facing salt) 5
7 9
11 13 17 2 1 25 26 27 89
Side 2 2 (facing sa l t ) 6
8 10 1 2 14 Blank 18 22
Side 3 3
(facing 15 graphite) 19
2 3
1.56 4.04 5.51 7. 50
10.75 13.60 17.10 21.75 25.61 30.57 36.58 48.18
5.58 8.60
11.84 14.03 16.62 24.44
31.90 40.94
5. so 8.79
12.98 18.56
0.145 0.224 0.132 0.172 0.295 0.256 0.340 0.390 0.350 0.445 0.540 1.05
0.360 0.190 0.210 0.140 0.165 0. 500
0.480 0.580
0.495 0.300 0.470 0.505
9 2. 1 2.4 0.80 0.03a 0.72 0.48 0.29 0.49 0.39 0.28 0.15
8.8 3.0 3.6 2.6 1.4 1.6 0.28 0.99 1.33
6.7 1.2 0.84 0.78
1 .3 0.47 0.32 0.13 0.009= 0.19 0.16 0.11 0.17 0.017 0.15 0.15
3.2 0.57 0.76 0.36 0.23 0.80
0.48 0.77
3.3 0.36 0.39 0.39
.....
aQuestionable value.
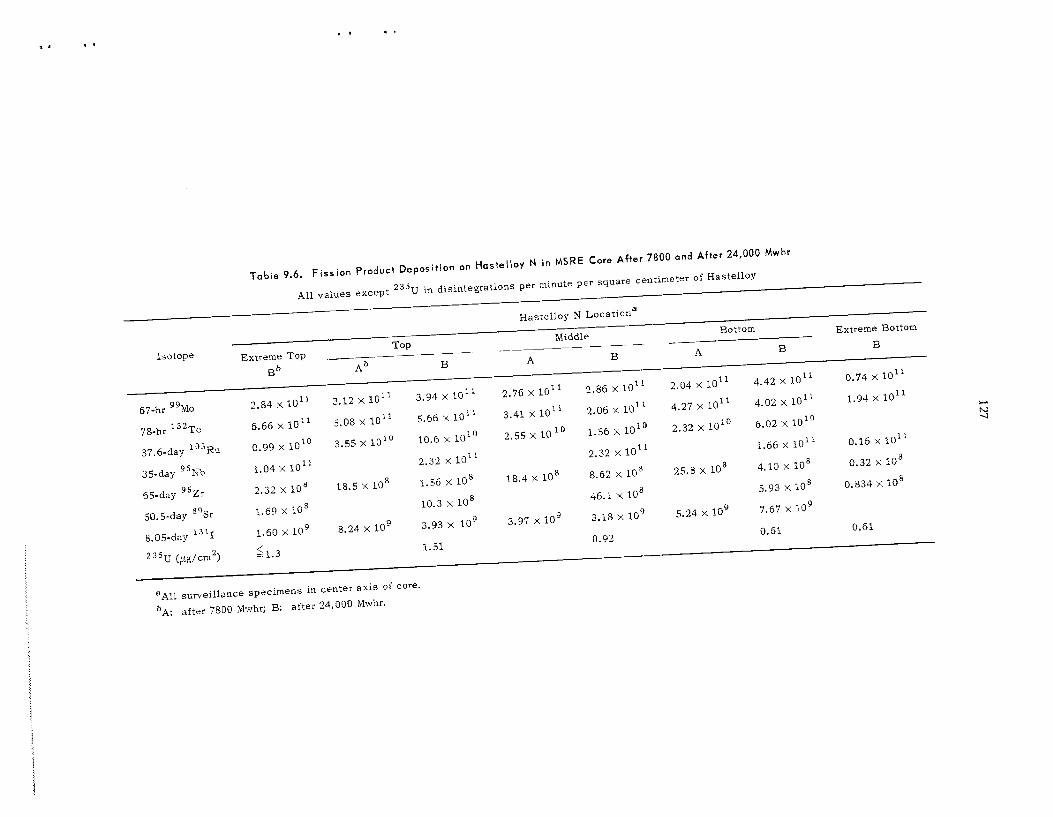
127
-. ... __ ....... .- ..... .-..
-. ............
....... ........
.............. .......
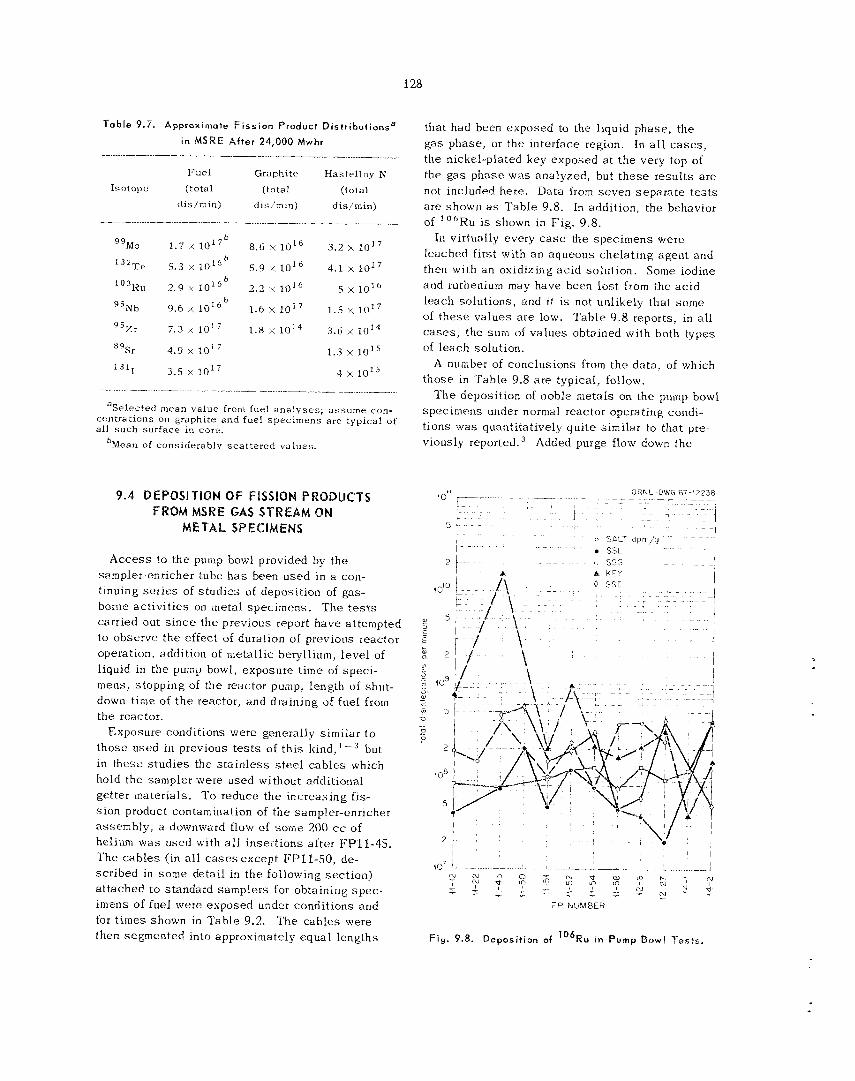
128
Table 9.7- Approximate F i s s i o n Product Distributionsa
in MSRE A f t e r 21,000 Mwhr . _l..._l I _ . ~ I_ _l_...-_..___l
Fue l Graphite Hasfe l lay N
Isotope (total (total (total d i s /min ) dis/min) dislrnin)
9 9 ~ ~ 1.7 1 0 1 7 ~ 8.6 x 1 O I 6 3.2 x I O I 7
132-r~ 5 . 3 1016 ' 5.9 x i o I 6 4.1 x 10¹⁷
l o 3 R u 2.9 x 2.2 x 1 O I 6 5 x 10'6
"Nb 9.6 x l o L 6 ' 1.6 x 10¹⁷ 1.5 x 10¹⁷
9 5 ~ r 7 . 3 10': 1.8 x 10¹⁴ 3.6 1014
"Sr '4.9 x 10' 1 .3 1015
3.5 x 10' ' 4 x 10'5 1 3 1 1
...... .. ........ - __...__ .. I__
aSptected mean value from fuel analyses , assume con- centrations on grdphlte and fuel specimens are typical of all such surface in core.
bMean of considerably scat tered va lues .
9.4 DEPOSITION OF FISSION PRODUCTS FROM MSRE GAS STREAM ON
METAL $~~~~~~~~
A c c e s s to the pump bowl provided by the sampler-enricher tube h a s been used in a con- tinuing s e i i e s of s tud ie s of deposit ion of gas- borne ac t iv i t ies on metal spec imens . The t e s t s carried out s i n c e the previous report have attempted to observe the effect of duration of previous reactor operation, addition of metall ic beryllium, leve l of liquid in the pump bowl, exposure t ime of spec i - mens, s topping of the reactor pump, length of shut- down time of t h e reactor, and draining of fuel from the reactor.
Exposure conditions were generally similar t o those used in previous t e s t s of th i s kind, '-3 but in these s tud ie s the s t a in l e s s s t e e l cab le s which hold the sampler were used without additional getter materials. To reduce the increas ing fis- s ion product contamination of the sampler-enricher assembly , a downward flow of some 200 cc of helium was used with a l l inser t ions after FPll-45. T h e cab le s (in a l l cases except FPll-SO, de- scribed in some detail in the following sec t ion) a t tached to standard samplers for obtaining spec -
that had been exposed to the liquid phase , the gas phase , or the interface region. In a l l c a s e s , the nickel-plated key exposed at t he very top of the g a s phase w a s analyzed, but t hese results a r e not included here. Data from seven sepa ra t e t e s t s a r e showii as Table 9.8. In addition, the behavior of ' 0 6 R u i s shown in Fig. 9.8.
leached first with a n aqueous che la t ing agent and then with a n oxidizing ac id solution. Some iodine and ruthenium may have been los t from the ac id leach solutions, and it is not unlikely that some of t h e s e va lues a re low. Table 9.8 reports, in a l l c a s e s , the sum of va lues obtained with both types of leach solution.
A number of conclusions frorn the data, of which those in Table 9.8 are typical, follow.
T h e deposit ion of noble meta ls on the pump bowl specimens under normal reactor operating condi- t ions was quantitatively qui te similar to that pre- viously r e p ~ r t e d . ~ Added purge flow down the
In virtually every case tfe spec imens were
ORNL-DWG 67 12236 4 0'' -
i 5
1 I 1
I- - 0 SSL 2 }-- o SSG
A K K Y 0 SSI
A
1
i I
imcns of fuel were exposed under conditions and FP NUMBER
for t imes shown in Tab le 9.2. then segmented into approximately equa l lengths
The cables were F i g . 9.8. Deposit ion of l o6Ru in Bump Bow! T e s t s .
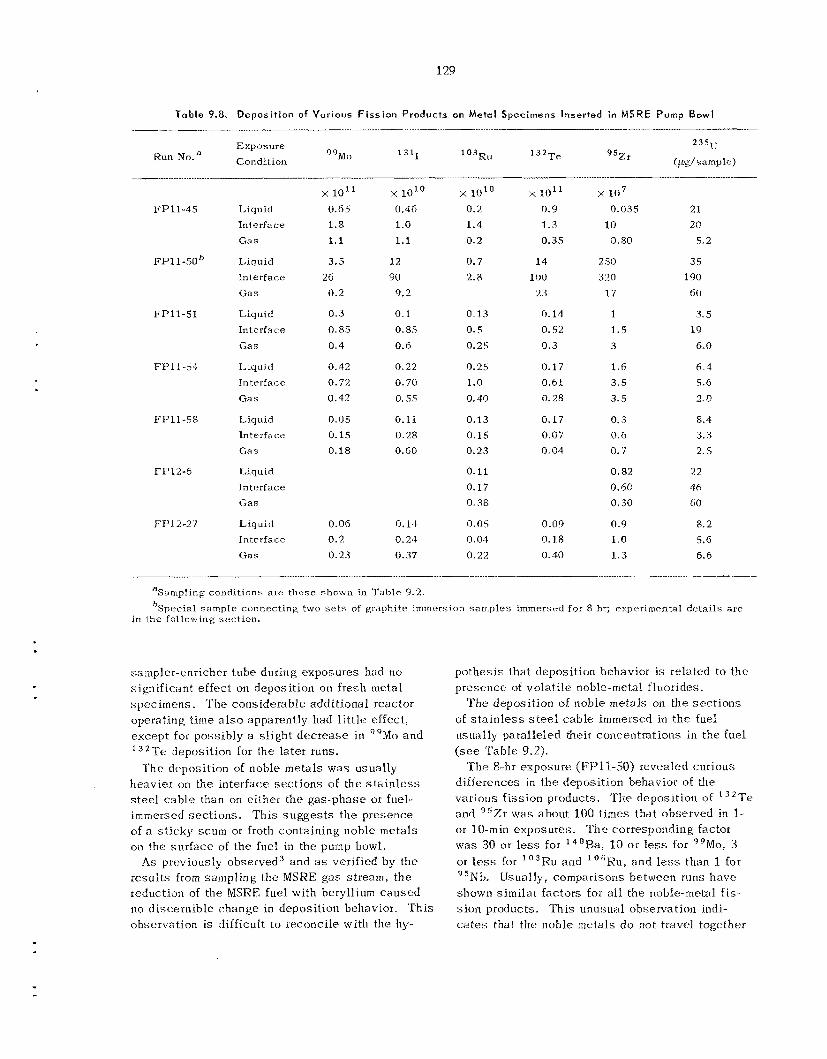
129
Table 9.8, Oepasit ion of Various F i s s i o n Products on Metal Specimens Inserted in MSRE Pump Bowl
Exposlire 2 3 5 ~
Condition (,ug/ sa rnp le) a g M O 1311 1 0 RI, 13*Te 952, Run NO.^
F P l l - 4 5 Liquid Interface Gas
F P l l - S O h Liquid Interface Gas
FPll-51 Liquid In te rf R ce
Gas
FP11-54 Liquid Interface Gas
F D l l - 5 8 Liquid Intcrfece Gas
FP12-6 Liquid Interface Gas
Fit-" 2-27 Liquid Interface Gas
x 10" x 1010 0.65 0.46 1.8 1.0 1.1 1.1
3.5 12 26 90
0-2 9.2
0.3 0.1 0.85 0.85 0.4 0.6
0.42 0.22 0.72 0.70 0.42 0.55
0.05 0.11 0.15 0.28
0.18 O.GO
0.05 0.14 0.2 0.24 0.23 0.37
x 1010
0.2 1.4 0.2
0.7 2.8
0.13
0.5 0.25
0.25 1.0
0.40
0.13 0.15 0.23
0.11 0.17 0.33
0.05 0.04 0.22
x 10' 0.9 1.3 0.35
14 100
23
0.14 0.52
0.3
0.17 0.61 0.28
0.17 0.07 0.04
0.09 0.18 0.40
x l o 7 0.035
10 0.80
250
310
1 7
1 1 . 5 3
1.6 3 .5
3.5
0.3 0.6 0.7
0.82 0.60 0.30
0.9 1.0 1.3
21 20
5.2
35 190 60
3.5 19 6.0
6.1 5.6 2.0
8.4 3.3
2.5
22 46 60
8.2 5.6 6.6
%ampling conditions a x those shown in Table 9.2. bSpecial sample connecting two s e t s of graphite immersion samples immersed for 8 hr; experimental de ta i l s are
in the following section.
sampler-enricher tube during exposures had no s igni f icant effect on deposit ion on fresh metal spec imens . T h e corisiderable additional reactor operating time also apparently had l i t t l e effect , except for possibly a s l igh t dec rease in 99Mo and 132Te deposit ion for the later runs.
The deposit ion of noble meta ls was usually heavier on the interface sec t ions of the s t a i n l e s s s t e e l cable than on either t he gas-phase or fuel- immersed sec t ions . Th i s s u g g e s t s t h e presence of n s t i cky scum or froth containing noble meta ls on the sur face of t h e fuel in the pump bowl.
As previously observed3 and as verified by the resu l t s f r o m sampl ing the MSKE gas stream, the reduction of the MSRE fue l with beryllium caused no d iscern ib le change in deposit ion behavior. Th i s observation i s difficult to reconcile with the hy-
pothes is that deposit ion behavior js related to the presence of volatile noble-metal fluorides.
The deposition of noble m e t a l s on the sec t ions of s t a i n l e s s s t e e l cab le immersed in t h e fuel usually paralleled their concentrations in t he fuel (see Tab le 9.2).
'rhe 8-hr exposure (FP11-50) revealed curious differences in t h e deposit ion behavior o f the various f i ss ion products. The deposit ion of 32Te and "Zr was about. 100 times tha t observed in 1- or 10-min exposures . 'The corresponding factor was 30 or less for 140Bal I O o r less for "&IO, 3 or less for 1 " 3 ~ ~ and lo ' Ru, and less than 1 for 95Nb. IJsiially, comparisons between runs have shown similar factors for all the noble-metal f is- s ion products. cates that the noble metals d o not travel together
This u11Ll:jual observation indi-
130
(e.g., in metallic colloidal aggregiites) but depos i t individually by sepa ra t e mechanisms.
In a l l but one of these t e s t s , the exposure t imes varied from 1 to 6 min. T h e amounts of noble meta ls deposited during t h e s e intervals showed no inc rease with exposure t ime (if anythj.ng a de- c rease) and were not significantly different from the results of previous 10-min exposures . Even in the case of 1 3 2 T e , which depos i ted heavily in the 8-hr exposure, no significant differences were ob- se rved for exposure t imes between 1 and 10 min. T h i s and related information will b e d i scussed in more detail later.
T h e deposit ion behaviors of 40-day I o 3 R u and 1.0-year l o 6 R u were fairly c lose ly parallel . T h e incomplete data for 33-day well t he variations among runs of t he 77-hr '32Te deposit ion data. At production-decay equilibrium, the number of disintegrations per ininute of each fission product should b e proportional to i t s fis- s ion yield. For the tellurium iso topes t h e ratio of ac t iv i t i e s deposited was about 20, while t he ratio of fission y ie lds is 13.4. T h e ratio of ac- t iv i t ies of the two i so topes in t he fuel. was a l s o about 20. T h e discrepancy between 20 and 13.4 may b e partly due to the fac t that t h e '*'Te may not have reached equilibrium activity. In the case of the ruthenium iso topes the much larger discrep- ancy between t h e ratio of ac t iv i t ies and the ratio of f i ss ion y ie lds i s very probably due to the fact tha t t h e one-year '061iu had not nearly reached equilibrium activity.
Experiment F P l l - 5 1 was cairied out with the pump bow1 level a s low a s poss ib le , with the oh- j ec t ive of introducing more than the usual amount of circulating helium bubbles into the fuel. Normal deposit ion of noble metals w a s observed. There- fore, t h e fraction of circulating helium bubbles has nu effect on fission product deposit ion.
Experiment FPll-58 was carried out a f te r 92.3 days of virtually uninterrupted power operation, 2.3 hr after shutdown, and 2 hr a f te r stopping the fuel pump. Under these conditions, t he deposit ion of noble metals decreased by a fac tor of 2 to 9, most sharply for tellurium and l e a s t for ruthenium. T h e concentrations in the s a l t ( s e e Tab le 9.2) re- mained nearly constant except for ruthenium, for which t h e data show a fivefold increase .
T h e rather moderate dec reases in noble-metal deposit ion with the reactor shu t down for 2.3 hr and particularly with the fuel pump off a r e dif- f icult t o explain by the previously mentioned
'Te a l s o followed
metal colloid theory of deposition. Any suspended s p e c i e s in t he pump bowl cover gas should have been swep t out by the I-liter/min helium flow through the pump bowl g a s space . T h e 3-in.-diam by 6-in. volume inside the mist sh ie ld w a s addi- tionally swep t by the 200-cc/min purge flow prior t o and during the exposure. T h e result i s one of the most conclusive indications that truly gaseous s p e c i e s originating from the fuel su r f ace a r e responsible for t he observed concentrations of noble-metal f i s s ion products in the pump bowl gas space .
Experiment FP12-6 w a s carried out a f te r a re- ac tor drain and refill after 4 2 S days of reactor shutdown and prior to resumption of power op- eration. Only slightly lowei than normal depo- s i t ion of noble metals aYas observed. After long shutdowns in the pas t , sharp dec reases in depo- s i t ion occurred. Also contrary to p a s t experience, t he concentrations of noble metals i n t h e fuel either remained cons tan t (ruthenium) or increased (tellurium and niobium).
An additional experiment (FP14-1, not shown in the table) was carried out after the MSRE had been s h u t down for 38.1 days , then a t full power for 2.5 days? then shu t down and drained for 2.0 days . T h e fuel pump continued to c i rcu la te helium i n t h e drained reactor with t h e temperature of t he pump bowl top a t 700°F. Specimens were exposed for 11 min. The only specimens ava i lab le for ana lys i s were the gas-exposed s t a i n l e s s s t e e l cab le and the key.
T h e ana lyses a re not complete, but t he avail- ab l e resu l t s are remarkable. Compared with the previous "normal" run (FP12-27), t he activity (ca lcu la ted back to the end of the 2.5-day op- eration) deposited on the c a b l e w a s sl ightly higher for "Mo, l o 6 R u , and "Nb, distinctly higher for I 3 ' I and 2 3 5 U , slightly lower for ' 32Te and I o 3 R u , and hs t inc t ly lower for "Zr. Most of the ac t iv i t ies on the key dropped by a factor of about 10 from the previous run. T h e s e high deposit ions a r e all the more re- markable when it is considered that there was a two-day shutdown before sampling and that even the short-lived fission products could not have reached equilibrium ac t iv i t ies in the 2.5- day period of power operation following the 38.1- day shutdown.
It is not c lear whether the observed depos i t s originated from material previously depos i ted on the graphite or metal wal l s of the reactor system
131
or whether i t came &om t h e 40 l b of fuel s a l t which remains in the reactor sys t em after a fuel drain. Some of th i s fuel s a l t is in the form of sha l low puddles in the in te rna ls of the fuel pump where contac t with the circulating helium should h e good. Another possibly pertinent fac t i s that gas circulation through the reactor and pump bowl with the pump operating in t h e drained reactor is much fas te r than when the reactor is fil led with fuel. Thus the pump bowl specimens may con- t ac t a larger volume of gas per unit time. 'The fuel may a l s o a c t as a scrubbing fluid to remove gaseous or suspended ac t iv i t i e s f r o m the pump bowl gas , eveti while it is t h e sou rce of these ac t iv i t i e s a t a different time arid place. Sorbed gaseous ac t iv i t ies or loosely depos i ted s o l i d s from the reactor sur faces may conceivably move to and s t a y in the .@s p h a s e more readily in the a b s e n c e of fuel sa l t .
A few ana ly t ica l resu l t s a r e ava i lab le from t e s t FP14-2, which was run one day af te r t e s t FP14-1 and af te r the reactor had been refilled with fuel but before power operation was resumed. For the g a s p h a s e s t a i n l e s s s t ee l cab le spec imen, the deposit ion of "Mo, 13'Te, and I 3 ' I was lower than for FP14-1 by an order of magnitude. T h e ruthenium and niobium ac t iv i t i e s increased s l igh t ly , and that o f 95%r decreased slightly. T h e amount of 2 3 5 L J deposit ion increased by a factor of 4. T h e dec reases in activity are dif- f icult to explain. T h e curious fact appears to s t and that deposit ion of noble meta ls in the drained reactor is the s a m e within a n order of magnitude a s with fuel in t h - L reactor.
Occas iona l radiochemical a n a l y s e s were car- ried out on the leaches of the metal specimens for two ii dd i t iona I noble- met a 1 f is sion produ c t s , ' 'Ag and 'Pd. T h e s e behaved l ike the other noble metals, with heavy deposit ion on t h e gas-
phase and submerged spec imens . T h i s behavior is of chemical in te res t since no highly volati le fluorides of s i lver and palladium a r e known to ex is t . T h i s observation favors t h e gaseous metal suspens ion theory of noble-metal volatili- zation.
Occas iona l ana lyses were a l s o made for other alkaline-earth and rare-earth s p e c i e s such a s "Sr, ' 4 1 ~ e , 143Ce, '44Ce, and 147Nd. T h e s e s p e c i e s remained in the fuel melt and showed light deposit ion on t h e pump bowl spec imens . Most of t h e pump bowl specimens were ana lyzed f o r 2 3 'W deposit ion by delayed-neutron counting
of their l eaches . Unusually high va lues were ob- tairied for the FPll-50 (8-hr exposure) specimens, averaging 70 pg of 2 3 5 U on each specimen. An- other s e t of high va lues averaging 35 p g of 2 3 5 U per specimen was obtained on run FP12-6 (42.5- day shutdown). T h e deposit ion of 95Nb was also unusually high for this run. 'The values for tun FP11-45 (normal) were a l s o high, averaging about 30 1J.g of 235U per specimen. T h e resu l t s f o r 2 3 5 U did not parallel t hose for any other f i ss ion product, and t h e reasons for t h e wide variations between runs a r e not known.
9.5 DEPOSITION OF FISSION PRODUCTS ON GRAPMITES IN MSRE PUMP BOWL
Graphite spec imens have been exposed in the MSRE pump bowl to observe f i ss ion product depo- si t ion under a known s e t of short-term conditions. Such an exposure h a s been carried out for 8 h r during s t eady 7.2-Mw operation of MSRE:. Since this exposure, with the sampler-enricher tube opened t o i t s s epa ra t e containment for 8 hr, posed s o m e problems in reactor operation, ihe t e s t was designed to yield a cons iderable amount of infor- mation. Three graphite samples , two of CXt3 grade and one o f pyrolytic graphite, were exposed in the gas phase , while similar specimens were exposed to the liquid. A comparison sample of I-Iastelloy N was exposed in each phase . Assemblies used in th i s experiment cons is ted of a pair of t h e holders shown in F ig . 9.9. T h e s e holders, for safety reasons, enc losed the graphite and ftastelloy specimens in perforated metal cylinders. 'Ihey were connected by a loop of s t a i n l e s s s t e e l cab le of a length such that the bottom holder was completely immersed in the molten fuel while the top holder was exposed only to the gas phase . T h i s assembly was exposed in the punip bowl for 8 h r with 200 cc/min of helium purge except for the last 10 min. After the exposure, tiny droplets (-*0.2 mm in diameter) of greenish white fuel s a l t were s e e n adhering loosely to the gas-phase graphite specimens. T h e mechanical disturbance involved i n removing the specimens from the holder was sufficient t o dislodge the droplets from the graphite sur faces . Nevertheless, two of the graphite specimens were wiped with smal l squares of cloth, which were ana lyzed radiochemically. T h e remaining graphite and metal specimens were then leached in a neutral mixture of sodium ver- sena te , boric ac id , and c i t r ic ac id , which dis-
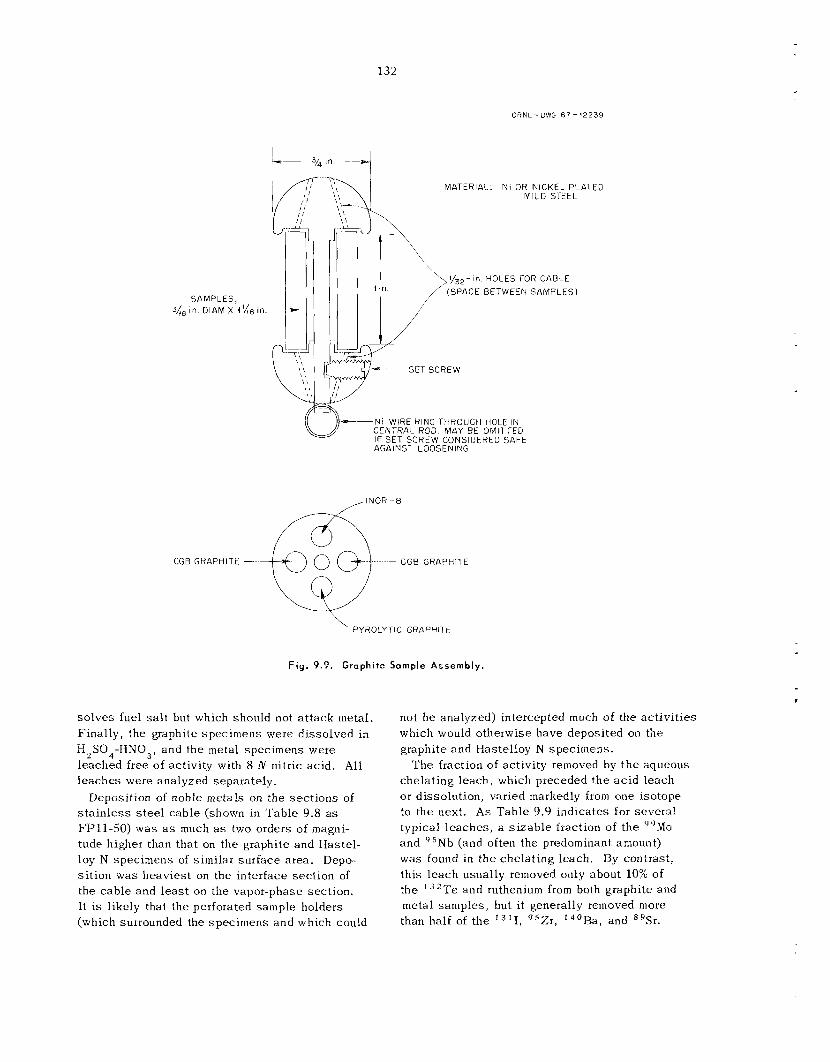
132
ORNL- DLVG 67 - 12239
MATERIAL: Ni OR NICKEL PLATED MILD Sl-EEL
SAMPLES in. D lAM X t'46 i n .
,,/NOR-@
PYROLYTIC GRAPHITE \
Fig. 9.9. Graphite Sample Assembly.
so lves fuel s a l t but which should not a t t ack metal. Finally, the graphite specimens were d isso lved in H ,S04-HN03 , and the metal spec imens were leached free of activity with 8 N nitric ac id . All l eaches were analyzed separately.
s t a i n l e s s s t e e l cab le (shown in Tab le 9.8 as FPll-50) was a s much as two orders of magni- tude higher than that on the graphite and Has te l - loy N specimens of similar sur face area. Depo- s i t ion was heavies t on the interface sec t ion of the cab le and l e a s t on the vapor-phase section. It i s likely that the perforated sample holders (which surrounded the specimens and which could
Deposition of noble metals on the sec t ions of
not be analyzed) intercepted much of the ac t iv i t ies which would otherwise have deposited on the graphite and Hastelloy N specimens.
che la t ing leach , which preceded t h e ac id leach or dissolution, varied markedly from one isotope to the next. A s Table 9.9 indicates for several. typical l eaches , a s i z a b l e fraction of t h e "Mo and "Nb (and often the predominant amount) w a s found in t h e che la t ing leach. By contrast , th i s l each usually removed only about 10% of the I3*Te and ruthenium from both graphite and metal samples , but it generally removed more than half of t h e I 3 ' I , g 5 % r , 140F3a, and "Sr.
The fraction of activity removed by t h e aqueous
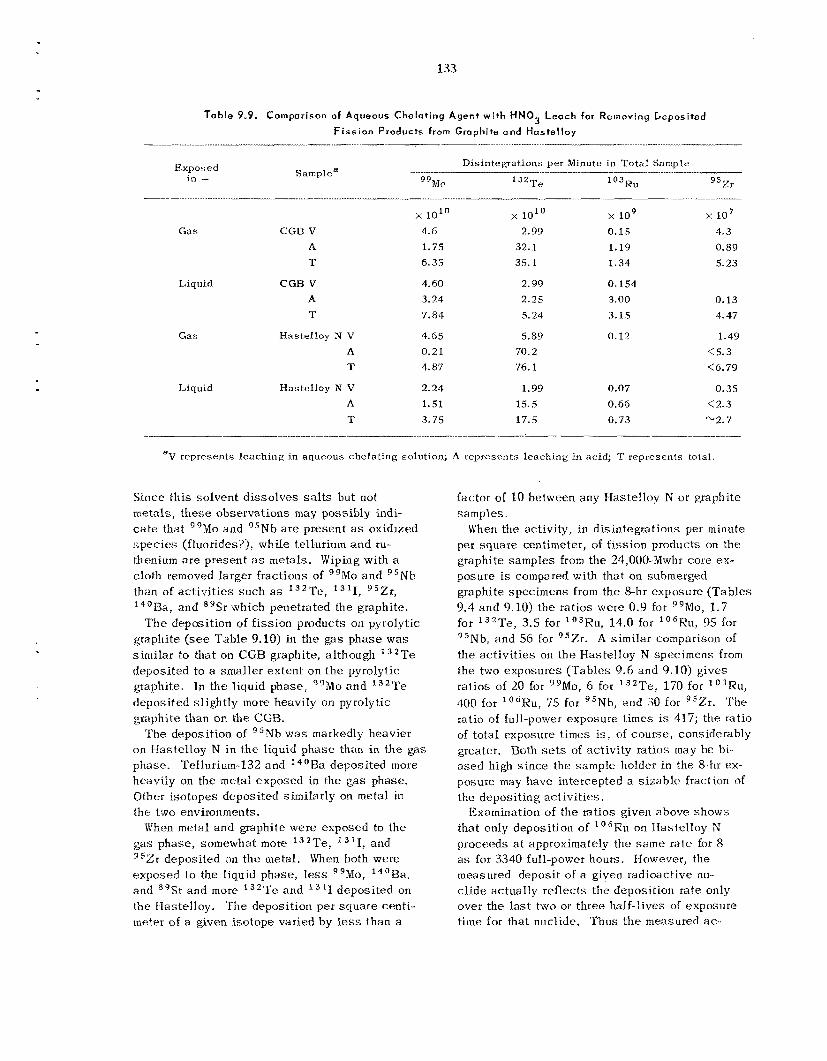
133
T a b l e 9.9. Comparison of Aqueous Chelot iny Agent w i t h H N 0 3 L e a c h for Removing Geposited
F i s s i o n Products from Graphite a n d Hastelloy ._.._._. __I..._ ~... .__. .
Disintegrations per Minute in Tota l Sanrple Samplea Exposed
in - 9 9 ~ ~ 0 132TC. 103Ru 95%,
Gas CGB V A T
Liquid CGB V A T
Go s Hastel loy N V A T
Liquid Hastelloy N V A T
x 10'O 4.6 1.7.5 6.35
4.60 3.24 7 .84
4.65 0.21 4.87
2.24 1.51 3.75
% 1o'O 2.99
32.1 35.1
2.99 2.25 5.24
5.89 70.2
76.1
1.99 15.5 17.5
x i o 9 0.15 1.19 1.34
0 . 1 5 4 3.00 3 .15
0.12
0.07 0 . 6 6 0 . 7 3
x 10' 4.3 0.89
5.23
0.13 4.47
1.49 < 5 . 3
(6.79
0.35 ( 2 . 3
'"2.7
*V represents leaching in aqueous chelating solution; A represents leaching in acid; T represents total,
Since th i s so lvent d i sso lves s a l t s but not metals, these observations may possibly indi- c a t e that 9 9 M 0 and "Nb a r e present as oxidized s p e c i e s (fluorides?), while tellurium a n d tu- thenium are present as metals. Wiping with a cloth removed larger fractions of 'OM0 and "Nb than of ac t iv i t i e s such a s ' 3 2 T t ? , I 3 ' I , y5Zr, I4'Ba, and 89Sr which penetrated the graphite.
graphite (see Tab le 9.10) in the gas phase was similar to that on CGB graphite, al though 132Te deposited t o a smaller ex ten t on t h e pyrolytic graphite. In the liquid phase, 9yM0 and '"Te deposi ted slightly more heavily on pyrolytic graphite than on the CGB.
The deposition of "Nb w a s markedly heavier on Hastelloy N in the liquid phase than in the gas phase. Tellurium-132 and '"Ha deposi ted more heavily on the metal exposed in the gas phase. Other isotopes deposited similarly on metal in the two environments.
When metal and graphite were exposed to the gas phase, somewhat mote ' 3 2 T e , I 3 ' I , arid 95Zr deposited on the metal. When both were exposed to the liquid phase, less "Mo, 14'Ra, and 89Sr and more ' j2Te and 1 3 L I deposi ted on the Hastelloy. The deposition per squa re centi- meter of R given isotope varied by less than a
T h e depmi t ion of f i ss ion products on pyrolytic
factor of 10 between any Hastelloy N or graphite samples.
per square centimeter, of f i ss ion products on the graphite samples from the 24,000-Mwhr core ex- posure is compared with that on submerged graphite specimens from the 8-hr exposure (Tables 9.4 and 9.10) the ratios were 0.9 €or "Mo, 1.7 for '32T~>, 3.5 for 1 " 3 R ~ , 14.0 for l o i R u , 95 for 95Nb, and 56 for "Zr. A similar comparison of the ac t iv i t ies on the Hastelloy N specimens from the two exposures (Tables 9.6 and 9.10j J v e s ratios of 20 for "Mo, 6 for '32Te, 170 for 1 0 3 R i ~ , 400 for '*'IRU, 7.5 for "Nb, arid 30 for 9sZr. The ratio of full-power exposure times is 417; the ratio of total exposure t i m e s is, o f course , considerably greater. Both s e t s of activity ratios may be bi- a sed high s ince the sample holder i n the 8-hr ex- posute may have intercepted a sii;able fraction of the deposit ing ac t iv i t ies .
Examination of the ratios given above shows that only deposit ion of "'Ru 011 Hastelloy N proceeds a t approximately the same ra te for 8 as for 3340 full-power hours. However, the measured deposit of a given radioactive nu- c l ide actually reflects the deposit ion rate only over the l a s t two or three half-lives of exposure time for that nuclide. Thus the measured ac-
When the activity, in disintegrations per minute
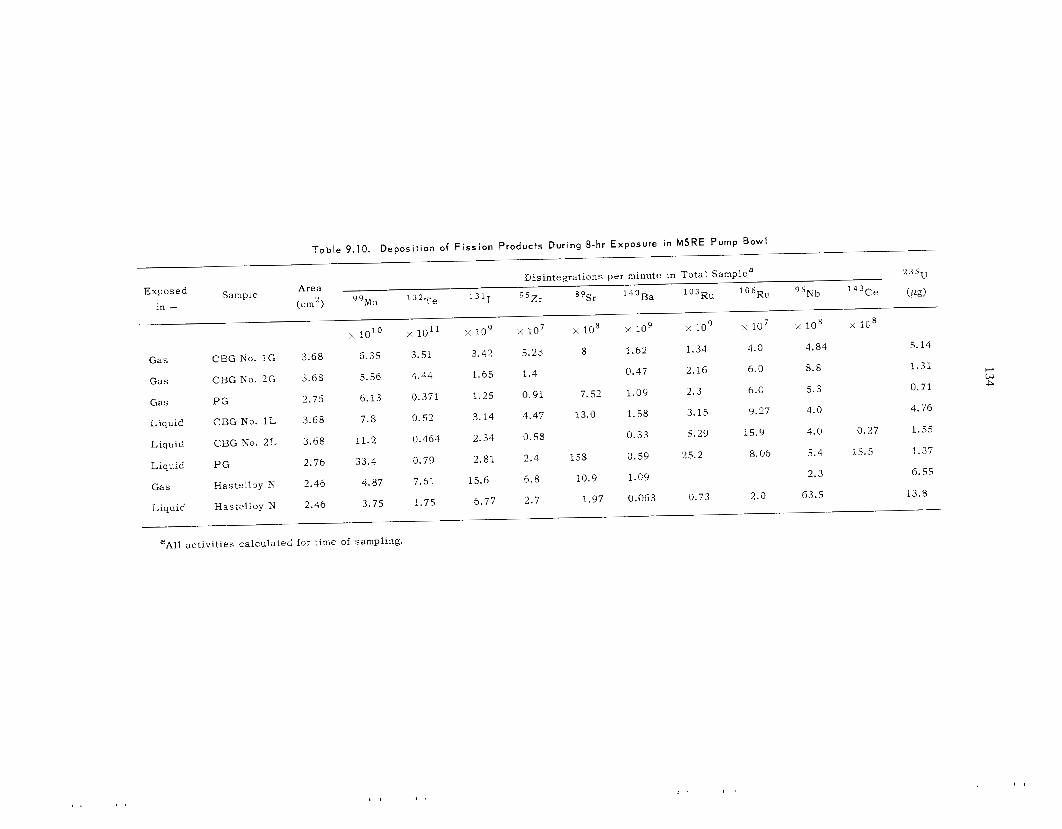
134
c
0
c
c(
0
135
t iv i t ies of 9 9 M 0 and 132Te deposi ted in a long exposure a r e a measure of deposit ion ra te over only the last week or so of exposure. If we a s sume a cons tan t deposit ion rate, the amount deposi ted in time t is given by the familiar equation:
At k A
p/ :=-(I - e- ) ,
wheic k is the cons tan t deposit ion rate and A is the decay constant. Using th i s equation a theoretical ratio can be ca lcu la ted for each iso- tope for exposure times of 3340 and 8 hr:
These ratios turn out to be 12.6 for "Mo, 14.5 for '"Te, 157 for l o 3 R u , 365 for l o 6 R u , 142 for "Nb, and 218 for "Zr. Whether fortuitous o r not, t hese calculated ratios agree with the ob- se rved ratios for deposition on I-Iastelloy N very well €or the ruthenium iso topes and within a factor of 2 for molybdenum, tellurium, and niobium. Th i s agreement sugges t s that t h e deposit ion of noble metals on Hastelloy N does indeed proceed a t approximately the s a m e con- s t an t rate for a 3340-hr exposure as for an 8-hr exposure.
By cont ras t , the calculated ratios a re much higher (usually by tenfold or more) than the ob- served ratios for deposition 011 graphite except for "Nb arid "Zr, whose ca lcu la ted ratios are high by factors of only 1.5 and 4 respectively. Th i s indicates that the deposit ion rate of noble metals (except 35Nb) on graphite dec reases with exposure time. Neutron economy in MSRE would benefit i f the deposit ion rate of noble-metal fis- s ion products on graphite dec reases with espo- su re time while that on Hastel loy N remains constant. As the data in Tab le 9.10 indicate, the 8-hr deposition ra tes :ire not greatly different
on graphite and metal, and the ac t iv i t i e s of "hI0, I3*Te, Io3Ru, and l o 6 R u were s imi la r €or the 7800- and 24,000-Mwhr exposures. Th i s sugges t s no change of rate between 7500 and 24,000 Mwhr for '%lo, '32Te, and I o 3 R u and a decreased rate for the long-lived
The d iscuss ion above gives a generally sa t i s - factory picture of noble-metal deposit ion for ex- posures of 8 hr or longer. The picture is greatly complicated by the inclusion of t e su l t s from t h e shor t ( 1 to 10 min) exposures of the s t a i n l e s s steel. cab le specimens in the pump bowl fuel (see Tab le 9.8). For most i so topes , the deposit ions were only sl ightly greater (a factor less than S ) for t he 8-hr exposure than for 1- to 10-min ex- posures. 'Tellurium-132 and ""Zr depos i t s in 8 hr were about 100 times larger than for t h e short exposures.
The calculated ratios from the formula given above would be vecy close to the t,ime rat-ios for t hese short exposures. Comparing the 8-hr run with a 1-min run, the time ratio is 480. The short-exposute data thus indicate tha t (except for 13'Te arid 95%r) the original deposit ion ra te is very fast compared with the rate a f te r 8 hr . It may he that when fresh samples of metal are exposed to fuel s a l t two deposit ion mechanisms come into play. The first p rocess rapidly de- pos i t s noble metals on the s t a i n l e s s s t e e l in less than a minute and then s t o p s (or reaches equilibrium). The second (slow) process then continues to depos i t noble metals a t a fairly constant rate for exposure t i m e s up to 3340 hr. It may be speculated tha t the first p rocess is a
rapid pickup of colloidal noble-metal par t ic les from the fuel on the metal surface; the second may be a s low plating of noble metals in higher valence s t a t e s present a t very low concentra- t ions in the fuel.
It will be interesting to expose graphite samples in the fuel for shor t times to see whether a short-term mechanism a l s o e x i s t s for deposition on graphite.
6Kri.
with LiF- 2
10.1 OXIDE CHEMISTRY OF ThF,-UF, MELTS
B. F. Witch C. E. L. Bambcrger C. F. B a e s , J r .
T h e precipitation of protactinium and uranium from L i F - B e F ,-ThF , mixtures by addition either of B e 0 or T h o , was demonstrated severa l years ago by Shaffer et al . '-' as a poss ib le method for processing a n MSBR blanket s a l t . T h e purpose of the present investigation i s (1) t o verify that the oxide solid phase formed a t equilibrium with U F ,-ThF ,-containing melts is the expected solid solution of UO, and T h o , and (2) t o determine the distribution behavior of Th4 ' and U4' between the oxide and the fluoride solutions:
u '(f) + T h ' (0 ) U 4 ' ( 0 ) + 'I'h '(f) (1)
(where f and o denote the fluoride and the oxide phases).
T h e experimental technique is similar to that used in a U0 , -Zr02 phase s tudy . 1J0, were contacted with 2 L i F * B e F , containing UF, and T h F , within n icke l capsu le s under a hydrogen atmosphere in a rocking furnace. The equilibrated oxide so l id s were allowed to se t t l e before the samples were frozen. Provided su f - f icient fluoride phase had heen added originally, good phase separation w a s thus obtained.
A (U-Th)@, so l id solution h a s been found in every sample examined thus far, and , moreover,
T h e T h o , and
'J. H. Shaffer et 31., N u c f . Sci. E n g . 18(2), 177 (1964). 'J. H. Shaffcr, G. M. Watson, and W. R. Crimes, Ke-
actor Chem. Div . Ann. Progr. Rept. Jan. 31, 1960, ORNL-2931, pp. 84-90.
3J. H. Shaffer et af., Reactor Chem. Div. Ann. Progr.
,K. A . Romberger, C. F. Uaes, Jr., and H. H. Stone, Rept . Jan. 31, 1961, ORNL-3127, pp. 8---11.
J. Inorg. Nucl . Chem. 29, 1619 (1967).
the la t t ice parameter determined by x-ray diffrac- tion was cons is ten t with the coinposition calcu- lated for such an oxide phase . 'The equilibrium quotient for the above metathetic reaction was determined by ana lys i s of the fluoride phase for the small amount of uranium which it contained. The results obtained thus far give
X u ( o ) Q - -T!!.('> ~ 1000 t o 2000 'u(f) 'Th(o)
at 600OC. T h e m o l e fraction of uranium in the oxide phase [Xu(o ) ] was varied from 0.2 to 0.9, while the mole fraction of thorium in the fluoride phase was in the range 0.01 to 0.07.
It t hus appears that relative to T h 4 + , the U4' present is strongly extracted from the fluoride phase by the oxide so l id solution formed at equi- librium. There is every reason to expec t that * Pa4' will distribute even more strongly to the oxide phase. T h i s i s in agreement with the ef- fective precipitation of U4' and Pa4' by oxide first reported by Shaffer et a l . T h e formation of a s ingle oxide solution phase to which 'i'h4+, U 4 ', and Fga4'all could distribute offers a much more f lexible and effective oxide separa t ion method for a single-region breeder reactor fuel than would he the case if only the sepa ra t e oxides ('Tho, and IJO,) were formed. For example, a possible processing scheme for an MSHM might involve some sort of a countercurreut contactor (Fig. 10.1) in which a (U-Th)O, so l id solution of
5,.. l h e s e x-ray examinations were performed by G. D. Bruriton and D. R . Sears of the Reactor Chemistry Di- vision. The mole fraction of T h o 2 in the oxide solid solutions was calculated from the latt ice parameter, using the equation given by L, 0. Gilpatrick and C. H. Secoy, Reactor Chem. D i v . Ann. Progr. R e p t . Jan. 3 1 , 1965, ORNL-3789, p. 241.
136
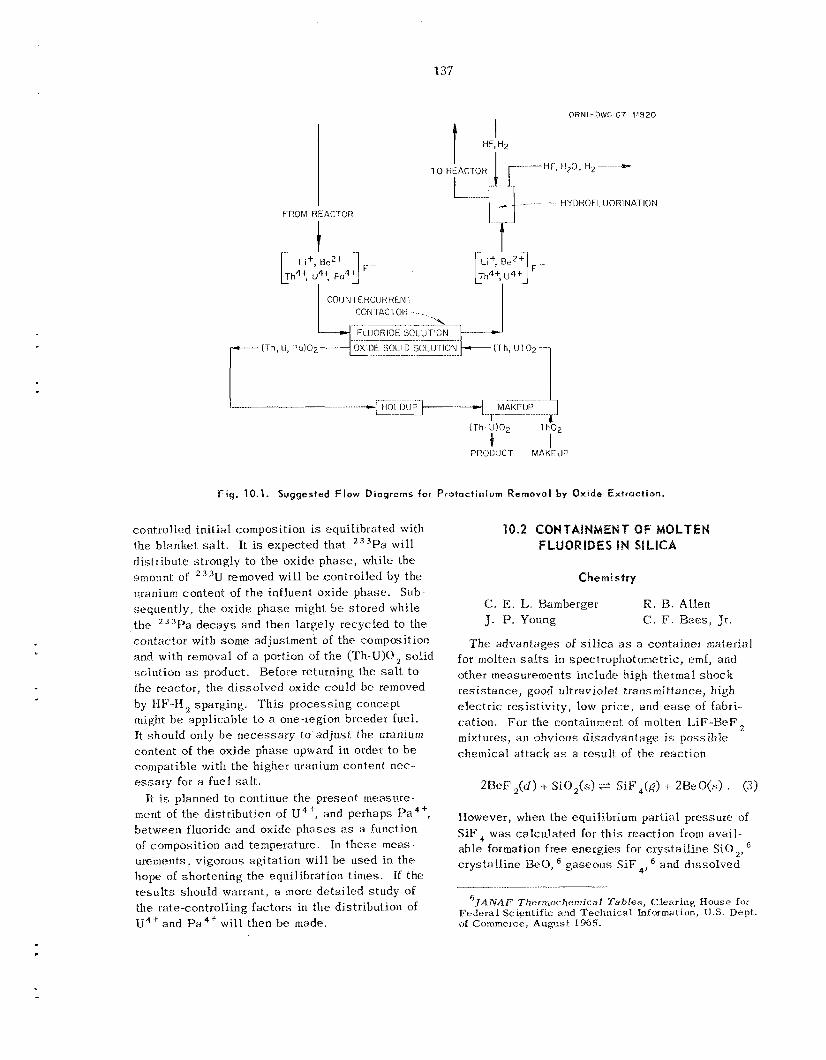
137
c l
FROM REACTOR
t Li+, ~ e * + F - I ! Th4: U": Po'.'
I
ORNL-DWG 67--1,!920
H20, H* --------pp
HYDROFI. UDRlNATlON
COIJNTFRCURRFNT CON [ACTOR
Fig . 10.1. Suggested F low Diagrams for Protactinium Removal by Oxide Extract ion.
controlled initial composition is equilibrated with the blanket. s a l t . It is expec ted that 2 3 3Pa wil l distribute strongly to t h e oxide phase , while the amount of 233U removed wi l l b e controlled by the iirariium contenl. of t he influent oxide phase. Sub- sequently, the oxide phase might b e s tored while the 233Pa decays and then largely recycled to the contactor with some adjustment of the composition and with removal of a portion of the (Th-U)O, solid solution a s product. Before returning the salt t o the reactor, the disso lved oxide could be removed by HF-H sparging. 'This process ing concept might b e applicable to a one-region breeder fuel. Kt should only b e necessa ry to ad jus t the uranium content of the oxide phase upward iii order to b e compatible with the higher uranium content nec - e s sa ry for a fue l s a l t .
It i s planned to continue the present rneasure- merit of the distribution of U4'., and perhaps Pa4+, between fluoride and oxide phases as a function of composition and temperature. In t h e s e m e a s - urements, vigorous agitation wi l l b e used in the hope of shortening the equilibration t imes. If the resu l t s should warrant, a more de ta i led study of the rate-controlling fac tors in the distribution of U4-' and Pa4' wi l l then he made.
Chemistry
e. E. I,. Bamberger J. P. Young C. F. Baes , J r .
The advantages of s i l i ca as a container m a t e r i a l
R . B. Allen
for molten salts in spectrophotometric, emf, and other measurements include high thermal shock res i s tance , good ultraviolet transmittance, high e lec t r ic resist ivity, low price, arid ease of fabri- cation. Fur the containment of molten L iF-BeF ~
mixtures, a n obvious d isadvantage is possible chemical a t tack a s a resul t of the reaction
However, when the equilibrium partial pressure of S iF , w a s ca lcu la ted for t h i s reaction from avai l - ab l e formation f ree energ ies for c rys ia l l ine SiO,, c rys ta l l ine BeO, gaseous SiF,, and d isso lved
JA N A F Th ermochenzic a 1 Ta b les , Cle :<ring Hous e for Federa l Scientific and Technical Information, U.S. Dept . of Commerce, Augx~st 1965.
138
B e F , i n 2 L i F 13eF,, th i s partial pressure was found to be surprisingly low, that i s , 0.03 mm a t 700'K to 21 mm at 1000'K. Flirthermore, pre- liminary direct measurements now i n progress con- firm the low range of t hese partial p ressures . Th i s sugges ted that a n overpressure of S iF , might pre- vent, or a t l ea s t reduce, the a t t ack of the s i l i ca container and prevent the precipitation of BeO.
T h e compatibility of SiO, with t h e s e LiF-BeF , melts i s primarily a s soc ia t ed with the relative stabil i ty of B e F , compared with that of BeO; the standard free energ ies of formation at 1000°K are -206 and -120 kcal/mole respectively. Since many other metallic fluorides show even greater stabil i ty compared with their corresponding oxides, i t seems that S i 0 , should not b e ruled out as a container material for molten fluorides without first estimating the equilibrium posit ion of s u c h reactions a s
X
--SiQ,(s) i MFx(s or I ) + MOx,,(s) 4
X
+ --SiF,(g) , (4) 4
which involve the pure metal fluoride and metal oxide, and
The latter reaction is the one of most in te res t , s ince it gives the leve l of oxide contamination of the fluoride m e l t . be judged if activity coefficients or so lubi l i t i es can be ass igned to MFx and M O x i z in the melt under consideration. In the present c a s e the ac- tivity of B e F , in 2 L i F . B e F , (",0.03) and the solubili ty of H e 0 (-0.01 m o l e of 0'- p e r kg of s a l t a t 600'C) have been measured. From these and the available thermochemical da ta the follow- ing equilibrium quotient may be estimated for the above reaction [Eq. (5)l in 2 L i F . B e F , a t 600°C:
Its equilibrium position may
7C. F. Baes, Jr., "The Chemistry and Thermodynamics of Molten Salt Reactor Fluoride Solutions," SM-66/60 in Thermodynamics, vol . 1, IAEA, Vienna.
From th is , it c a n in turn b e estimated that i n the presence of 1 atm of S iF , the oxide ion concen- tration a t equilibrium with SiO, should be only 6 x l o - , mole/kg.
ica is the poss ib le formation of s i l i ca t e s ; for example,
Another factor t o be considered when using s i l -
2MF,(s or 2 ) i 2SiO,(s)
In the present c a s e , for example, Be,SiO, (phen- ac i t e ) should be formed a s the s t ab le reaction product rather than ReQ at low SiF, partial pres-- s u i e s ; however, phenacite is not very s t ab le rcl- a t ive to 2 H e 0 - I SiO, and should not a l te r the above conclusions about the compatibility of sil- ica with L iF -BeF , melts. In other fluoride s y s - tems , the formation of metall ic s i l i c a t e s may b e the controlling factor.
T h e solubili ty of S i F , i n the molten fluoride must b e considered because poss ib le reactions s u c h as
could produce high so lubi l i t i es which not only would alter the s a l t phase , but a l s o would cause the reaction with SiO, to proceed farther than otherwise expected. Accordingly, the solubili ty of S i F , in 2LiF . B e F was estimated by means of transpiration measurements. The prepurifjed s a l t was saturated with S iF , by bubbling a mix- ture of 0 1 atiii of S iF , i n He through the s a l t until the effluent and influent compositions were the same . The d isso lved g a s was then stripped with helium and trapped in an aqueous NaOH bub- bler, the a m o u n t of S i F , being equiva len t to the amount of NaOH consumed by i t s hydrolysis:
SiF,(g) i- 4 0 H - + 4F- + 2H,0 I SiO,(s) . (9)
The solubili ty was ca lcu la ted by means of
in which
139
XnSi,, = total number of moles of S i F ,
pSip4 = SiF, pressure a t equilibrium
ti trated,
with the melt,
.?;(f'Sip4V//RTm) - correction term which in- c ludes the various dead vol- umes at different iempera- l u re s , Tm,
w : weight of t he melt in kg.
IJsing Eqs. (10) and (11) t h e so lubi l i ty was found to b e
K, : 0.032 t 0.005 mole kg- ' a t m - ' a t 499"C,
K , = 0.035 i0.005 mole kg- ' atm-' a t 5 4 0 T .
T h e s e so lubi l i t i es a r e of the same order of magni- tudc as the solubili ty of HF in 2 L i F * BeF, (-0.01 mole kg- atm '). ' At higher temperatures, in the range 600 to 70OoC, t he solubili ty was so low that by the rather insens i t ive method of measure- ment only an upper limit could b e set: K , .:0.01 mole k g - a t m - '. The data obtained ind ica te that a t 1000"K, using an S i F , pressure close to the equilibrium va lue over 2 L i F * B e F ,, the so lu- bility of S iF , i s -0 003 mole %.
Another undesirable s i d e reaction tha t should bc considered in these sys t ems is the formation of s i l i con oxyfluorides; for example,
Six;,(&) t SiO,(s) 2SiOF ,(g) , (1 2 )
3SiF 4(g) t SiO,(s) * 2Si ,OF ,(g) . (13)
Such s i l icon oxyfluorides have been identified by Novoselova et d. ac i t e from S i 0 2 , BeO, and Na,BeF, at ternpera- tu res in the range 700 to 800°C urement they report equilibrium partial p ressures of 0 162 atm of SiF, and 0.07 atm of SiOF, over the reaction mixture at 813cC. In other experi- mrnls wherein equilibrium was not reached, they were ab le t o identify Si,OF,. W e performed t e s t s in which He af te l pnssage through molten 2 L i F * ReF, containing powdered Be0 and SiO, clt tern- peratures up to 650°C was ana lyzed by means of a mass spectrometer. No s i l i con oxyfluorides were found to be present.
during the syn thes i s of phen-
In one meas-
%. E. Fie ld and J. H. Shaffer, J. P21ys. Chem., in press.
Specfrophotometric Measurements with Silica Cells
C. E. L. Bamberger J. P. Young C . F. F3aes, J r .
Behavior of u4+. - To es t imate the ex ten t to which a n SiF overpressure would prevent reaction (3, UF,, a colored so lu te which would produce an even less soluble oxide than d o e s BeF,, was added to LiF-BeF , melts in SiO, containers. 'ret- ravalent uranium thus should a c t as a sens i t i ve "internal indicator' ' of the reaction of F- with S O , . It h a s a known absorption spectrum of su i t - ab l e intensity, '' and hence i ts concentration can be followed spectrophotometrically. For the re- ac t ion
UF,(d) -t Si02( s ) + SiF,(g) t I.JO,(s) , (14)
equilibrium partial p ressures of SiF, were pre- dicted to h e reasonably low; for example, with 0.002 mole fraction Up-, i n 2LiF = BeF,, ca lcu- lated SiF, pressures varied from 3 mm a t 700°K to 115 mtri a t 1000°K. Spectrophotometric mon- itoring of the concentration of U4' provides a very good means for studying the s tab i l i ty of the s y s - tem.
Melts of 2 L i F BeF containing variable con- centrations of U F , (0.0053 t o 0.13 mole % O K 0.003 t o 0.008 mole/liter) were held under S ip ,# (--400 mm) a t temperatures ranging from 490 to 70OoC in s ea l ed silica tubes . T h e tubes were placed di- rectly in a spec ia l furnace" located in the light path of a Cary spectrophotometer, model 141, or in a heated nickel metal block and later transferred to the furnace ins ide the instrument. 'Temperatures were controlled to floe by means of a Capacitrol 471 controller.
Constancy of the U4+ absorbance peaks a t 1090 and 640 nm showed the uranium concentration in the melt t o b e constant. within the precision of thc spec t r a l measurement (about 17%) for a t l eas t 43 hr. It was , therefore, evident. t ha t no significant a t tack of the s i l i ca container Or significant contamination of t h e melt occurred. During longer periods of time
9 ~ . V. Novoselova et ol., Proc. Acad. ~ c i . USSR, Chern. S e c t . (Eriplish Trans l . ) , 159, 1370 (1964); A . V. Novoselova and Yu. V. Azhikina, Iziorg. Mater. USSR (Engl i sh Transl . ) , 1(9), 1375 (1966).
"J. P. Young, Inorg. Cherri. 6, 1486 (1967). "J. P. Yourig, Anal. Chprn. 31, 1592 (1959).
(up to one week) the transparency of the containers was noticeably affected, and the b a s e l ine of the spec t ra rose. T h e net absorbance of the U4' peaks , however, remained reproducible even though in some experiments the temperature was cycled from 500 t o 700°C. No spec t ra l experiment was con- tinued for longer than a week. However, in other s tud ie s , melts of 2LiF. B e F , were maintained as long as one month a t 5OOOC without noticeable damage except loss of transparency (presumably due to some process of devitrif ication) of the fused s i l i ca .
urements of U4' was better than that possible with windowless cells. of U 4 + h a d been observed" to b e 14 i 10% and 7 i 10% a t 1090 and 610 nm, respectively, in molten L iF-BeF a t S5OoC contained in windowless cells. With the melts contained in the present s i l i ca ce l l s the A , of U 4 + IS 14.4 k 0.5 and 7.3 i 0.3 a t 1090 and 640 rim, respectively, in molten 2Lj.F . BeF at 560OC. The effect of temperature on the Ala of seve ra l absorption peaks of U 4 ' in 2LiF . B e F was studied. The results are summarized in Tab le 10.1.
Behavior of Cr3 '. - The solubili ty of C r F , in L iF -BeF is being investigated spectrophoto- metrically with the melts contained in SiO, ce l l s . A minimum solubili ty of 0.43 mole % Cr 3' was ob- tained a t a temperature of 550°C. Th i s is not the solubili ty limit, bu t the so lu t ions a re too opaque to observe spectrophotometrically in a 1-cm path length. Further s tud ie s will be carried out with SiO, c e l l s of a shorter path length. of Cr 3' in L i F - R e F a t 500°C c o n s i s t s of three peaks a t 302, 442, and 690 nm, a l l a r i s ing from transit ions within the 3 d level. sorptivity of the 690-nm peak was ca lcu la ted to be 6.G. Th i s value compares favorably with an
T h e precision of these quantitative spec t ra l meas-
T h e molar absorptivity (A,)
The spe-- ctrurn
'l'he molar ab -
Table 10.1. E f fec t of Temperature on the Molar
Absorptivity of Several Peaks of U4' in Molten 2L iF . B e F 2
Molar Absorptivity
1090 nm 640 n m Temperature ( O C )
4 98 56 0 650 698
16.4 8.0 14.4 7.3 13.8 6.2 12.9 5.7
approximate value of 7 reported from a cursory study of the sys tem i n windowless cells. l 3 T h e molar absorptivity of the two other peaks is some- what higher, about 10, but further work will b e necessary to e s t ab l i sh a more prec ise value.
10.3 E k E: CT RB C A L CON DUC TI VI TY OF MOLTEN FLPlORlDES AND FEUOROBQRATES
J , Srauns te in K. A . Romberger
Studies have been init iated to mea.sure the e l e c - t r ica l conductivity of molten fluorides and fluoro- borates of interest a s fuel, blanket, and coolant s a l t s for the Molten-Salt Breeder Reactor. Pre- liminary measurements were made to provide e s t i - mates of the electrical conductivit ies for engi- neering u s e in the design of e lec t r ica l c i rcu i t s for instrumentation in the MSBE. Ce l l des ign h a s been investigated, including the use of silica in view of recent indications that dry fluorides may be s t ab le to s i l i ca in the presence of low concen- trations of S iF , (see Sec t . 10.2).
ductivity of 213 ' -BeF 2 , of LiF-'ThF (29 mole % T h F 4), and of NaBF current-voltage curves a t 100 hertz and using plat- inized platinum wire e lec t rodes in a s i l i ca c e l l at 4000 hertz. l 4 Potassium nitrate at 390OC was used to determine the effective ce l l constant. Temperature coefficients were estimated f rom da ta on mixtures of alkaline-earth fluorides with a lka l i fluorides or with cryolite l 5 and f rom the da ta of Greene
The ce l l used for t he current-voltage measure- ments was similar to that used by Greene l 6 and cons is ted of a pair of platinum wire e lec t rodes of 0.07-cm diameter separa ted by about 2 c m and iin- mersed to a measured depth in the melt contained
Preliminary measurements were made of the con- eu tec t ic
by observing
on FLINAK and NaF-ZrF4-UF, mixtures.
12J. P. Young, Anal. Chem. 36, 390 (1964). ' 3h tSR Program Semiann. Progr. R e p t . Aug. 3 1 , 1966,
OKNL-4037, p. 191. 1 4 J . Braunstein t o R. L. Moore, private comnunication,
Aug. 14, 1967. "E. W. Yim and M. Feinleib, J . Electrochem. SOC.
104, 626 (1957); J. D. Edwards et a t . , J . Efectrochem. S O C . 99, 527 (1952); hl. de Kay Thompson and A. L. Kaye, Trans. Efectrochem. Soc. 67, 169 (1931).
16N. D. Grcene, Measurements of the Electr ical Con- ductivity of Molten Ffuorides, ORNLCF-54-8-64 (Aug. 16, 1954).
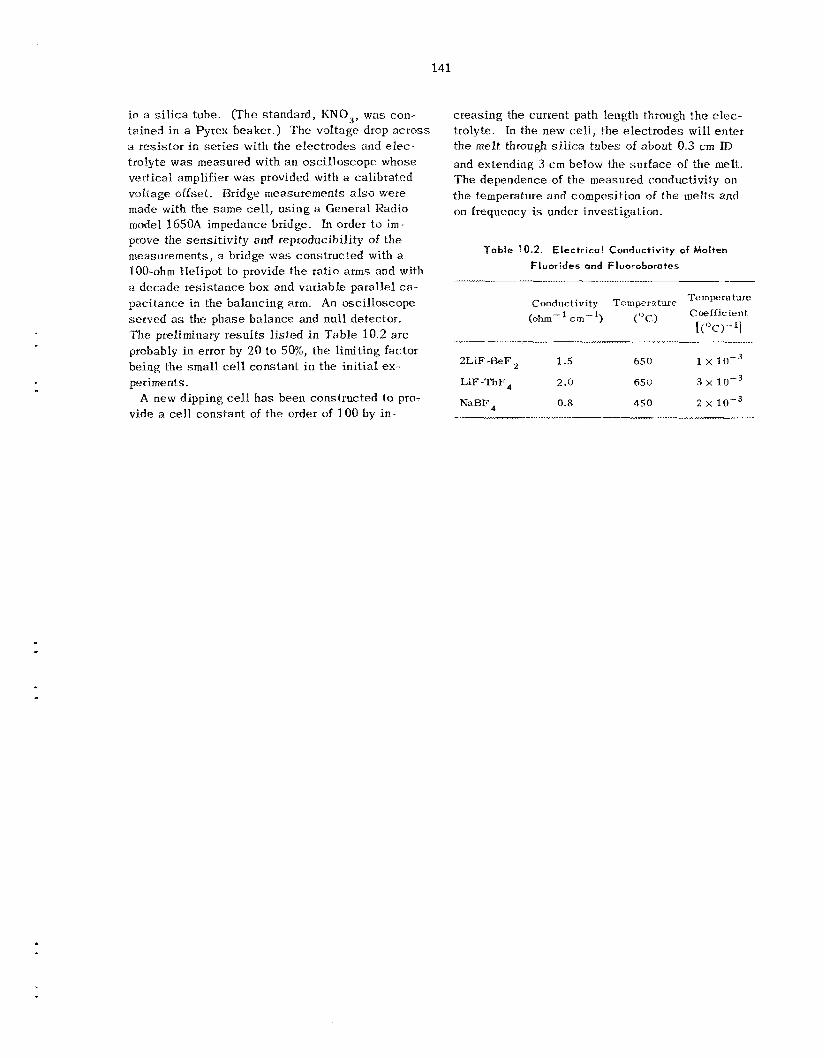
in a s i l i ca tube. (The s tandard, KNO,, was con- ta ined in a Pyrex beaker.) The voltage drop a c r o s s a resis tor in s e r i e s with the e lec t rodes and elec- trolyte was measured with an osc i l loscope whose vertical amplifier was provided with a cal ibrated voltage offset. Bridge nieasurements a l s o were made with the s a m e cell, using a General Radio model 1650A impedance bridge" In order to i m - prove the sens i t iv i ty and reproducibility of the measurements, a bridge w a s constructed with a 100-ohm Helipot to provide the rat io arms and with a decade res i s tance box and variable parallel ca- paci tance in the balancing arm. An osci l loscope served as the phase balance and null detector. The preliminary resu l t s l i s ted i n T a b l e 10.2 a r e probably in error by 20 to SPh, the limiting factor being the smal l cell constant in the ini t ia l ex- periments.
vide a cell constant of the order of 100 by in- A new dipping c e l l h a s been constructed to pro-
creasing the current path length through the elcc- trolyte. In the new cell, the e lec t rodes will enter the melt through silica tubes of about 0.3 cm ID and extending 3 c m below the surface of the melt . The dependence of the measured conductivity on the temperature and composition of the melts and on frequency is under investigation.
Table 10.2. Electrical Conductivity of Molten Fluorides and Fluoroborates
Conductivity Temperature Ternprrar''re Coefficient (ohm-'crn-'> ( " C ) [( "C) - 'I
2LiF-BeF 1.5 650 1
LiF -ThF 2.0 65 0 3 x 10⁻³
2 io-, NaRF 0.8 4 5 0
T h e appearance in appreciable concentrations of several f ission product s p e c i e s in t h e g a s s p a c e of t he MSRE pump bowl remains the biggest chemical surprise in MSKE operation. Th i s hchavior d o e s not, of i t se l f , s e e m to pose ser ious problems for t h e PASRE o r for subsequent la rge molten-fluoride re- actors, but i t i s clearly important to e s t ab l i sh t h e mechanism by which t h e s e d iverse spec ie s , notably 99Mo, 95Nb, l o 3 K u , l o S R u , I3'Te, and even "'Ag, get into t h e g a s stream.
It is poss ib le that a t l e a s t some of t h e gas-borne s p e c i e s l i s t ed above have volati l ized from t.he melt a s fluorides. of the ( l e s s well known) lower fluorides of t h e s e rriaterials both a s pure compounds and a s their s o l u - t ions in molten L iF-BeF , preparations. The pre- liminary s tud ie s performed to da t e have been de- voted to the fluorides of molybdenum, hut i t is anticipated tha t , should t h e results warrant, t h e study will b e broadened to include o ther elements on t h e l i s t .
W e have, accorchngly, init iated s tud ie s
C . F. Weaver H. A. Friedman
Molybdenum i s a consti tuent of Has te l loy N , t h e MSRE structural metal, a s well a s a n important high-yield fission product. Consequently, and espec ia l ly s ince molybdenum is one of the e lements appearing in the MSKE exi t gas stream, the be- havior of molybdenum and i t s fluorides in molten fluoride fuels i n contact with graphite and Has te l - loy N i s of considerable interest . '-'
A search of t h e l i terature on t h e fluorides and oxyfluorides h a s been completed and reported. The fluorides MoF,, MoF4, Mo,F9, MoF,, and MoF, have been shown to ex is t , but of t h e s e only MoF, i s commercially available. It has been neces- - sary, therefore, to refine methods for preparation,
and to prepare gram quant i t ies , of the lower- valence compounds €or s tudy .
Preparation of MoF, by t h e reaction
has been described by Edwards, Peacock , and Small, wlio have a l so es tab l i shed t h e c rys ta l structure of MoF,. We have successfu l ly employed th is method in which MoF6 is iefluxed over metal- l i c molybdenum at temperatures in t he interval 35 to 100cC in glass apparatus.
Molybdenum pentafluoride i s a yellow, hygro- scopic material which mel t s a t about 65OC to a yellow liquid of high viscosity. at the melting point is about 2 mm, ' and i t bo i l s at about 212OC. ' s 6
be very complex. W e have observed that heating of the material t o 100°C while maintaining a good vacuum leaves the MoF, unchanged. However, W E
have shown that i f MoF, is hea ted a t 20OOC and i f the volati le product is removed by pimping, t h e reaction i s
I ts vapor pressure
Disproportionation behavior of MoF appears t o
3 M o F , y 2MoF, t MoF, .
'W. R. G r i m e s , Chemrca1 Research and Development for Molrcn Salt Breeder Reactors , ORNL-TM-1853, pp. 61 -81 (June 6 , 1967).
'5. S. K i r s l i s , F. F. Blankenship, and C. F. Baes, Jr., Reactor Chem D J V Anti Progr Rep t J a n 31 1967, ORNL-4076, pp. 48--53.
3S. S. K i r s l l s and F. F. Blankenship, M S R Program Senizann Progr Rep t F e b 28, 1967 ORNL-4119, pp. 124-43.
4C. F. Wcaver dnd 13. A. Friedman, A Literature Sur vey of the Fluorides and Oxyf luondcs of Molybdenui-n, ORNL-TM-1976 (October 1967).
'A. J. Edwards, K. 1). Peacock, and K. W . H. S m a l l , J Chem S O C . 4486-91 (1962).
,D. E. L.aValle e t a t . . J . Am. Chem. S O C . 82, 2433-34 (1 960).
143
The MoF, so obtained h a s been identified by its x-ray diffraction pattern es tab l i shed by LaValIe et aI This convenient method of preparation, which s e e m s not to have been used before, h a s served to pre- pare severa l pure ba tches of MoFCI.
fhe reaction h a s been repor tedsv7 to b e
on the material synthesized by other methods.
When MoF, is pumped, in th i s same way at 15OoC,
W e have es tab l i shed tha t t h e sol id product is not MoF, (as produced in the 200°C: reaction), but we have not ye t completed our identification of the material.
The compound MoF, h a s been shown to react with EiF to form a t least two binary compounds. T h e s e materials, whose stoichiometry h a s not yet been es tab l i shed , a r e both birefringent. The mean index of refraction for compound I is at 1.520, while i t s major x-ray diffraction peaks (copper x-ray target , 20 values in degrees) a re a t 21.4, 19.4, and 27 0; for compound 11, t h e mean refrac- t ive index is 1.480 and t h e major diffraction peaks are at 22.3 and 20.3. The stoichiometry and the opt ical and x-ray data will b e es tab l i shed as soon a s well-crystallj zed samples a re available.
1 A .2 REACTION OF MOLYBDENUM FLUORIDES WITH MOLTEN LiF-BeF, MIXTURES
C. F. Weaver 11. A. Friedman
The appearance of ''Mo in t h e exi t g a s from the MSRE h a s suggested t h e possibi l i ty tha t a vola- t i l e fluoride of molybdenum exists in the MSKE. We have accordingly begun an examination of react ions ol molybdenum fluorides with MSRE fuel and fuel sol vent mixtures.
material (boil ing point, 3 4 7 3 and is a very s t rong oxidant. T h e nickel container was rapidly at tacked when MoF, diluted to -50% with helium was passed through the MSRE fuel mixture (in which a l l of the uranium w a s as UF,) at 69°C; af ter 1 h r the f u e l m e l t contained 9500 ppm of nickel . A small quantity of uranium was transported (presumably as UF,) by t h e gas , but, as expected, no appre-
Molybdenum hexafluoride is a very volatile
'G. W. Cody and G. B. Hargreaves, J. Chem. SOC. 1568-74 (1 961).
ciable reaction of t h e IvIQF, with the me l t was ob- served. When MoF6 was p a s s e d through a fuel mixture to which 0.08 mole 7L U F , bad been added, the UF, was rapidly oxidized to UF,,. A small quantity of uranium was again observed in t h e exi t gas l ines , and violent c o r n s i o n of tlie nickel was observed. The valence state to which the MoF, w a s reduced w a s not determined in t h e s e experi- ments. It is probable, however, that the molybde- num was present a s ei ther molybdenum meta l or MoF,, s i n c e MoF and MoF, have not been reported to ex is t and MoF,, Mo,F,, and MoF, seem to b e thermally unstable abovc 200°C.
T h e compound MoF, disproportionates readily6 under a vacuum at temperatures greater than about 6OOOC to form molybdenum and MoF,. However, t h i s material has been heated under its own pres- sure in c losed nickel and copper c a p s u l e s at 500 and 710"C, respectively, f o r periods in e x c e s s ot ten d a y s without disproportionation. In addibon, i t h a s been shown tha t MoF, a t 500 mm will react at 5 6 0 T with molybdenum to form MoF,. Conse- quently, an equilibnum
2NIoF, e N I o t MoF,
must ex is t in th i s temperature range with MoF pressures of a fraction of an atmosphere. When MoF, w a s heated in a nickel capsule to 500°C in the presence of 2LiF.ReF' (SO-SO mole %), the reaction
21CloF3 + 3 N i 4 3NiF, c 2 M 0
occurred. Apparently t h e 21,iF.BeF liquid dis- solved the protective coat ing on tlie nickel wall. Repeating the experiment with copper indicated that much l e s s corrosion occurred. In th i s case the molybdenum w a s found both as MoF, and a s the 1.480 refractive index LiF-MoF compound of unknown stoichiometry. The reaction
MoF, (1 m o l e %) + 3 U F , (4 a o l e %)----:* Mo t 3 U F ,
was demonstrated t o proceed essent ia l ly to comple- tion a t 500°C in a copper container. The reverse reaction was not observed, although it is poss ib le that equilibrium was achieved wilh very small con- centrations of MoF and IIF ,.
Present information sugges ts tha t the following events (equat ions unbalanced) may b e s ignif icant in t h e kinet ics of t h e reduction of MoF, to molyb- denum metal by UF,:
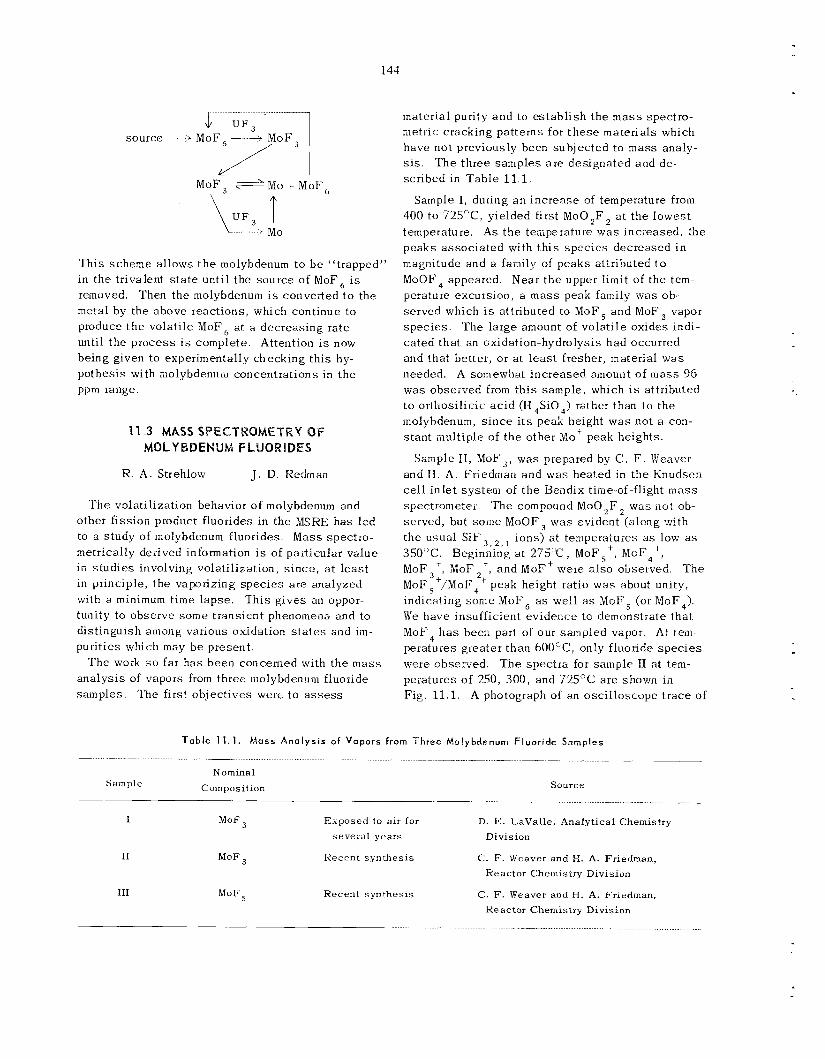
144
MoF3 e h l o t MoF,
.... ~~ .... Mo
This scheme allows t h e molybdenum to b e "trapped" i n t he trivalent s t a t e until t he source of MoF, is removed. Then t h e molybdenum i s converted t o the metal by the above rcactions, which continue to produce t h e volati le MoF, at a decreas ing rate until t he p rocess is complete. Attention is now being given to experimentally checking th i s hy- pothes is with molybdenum concentrations i n t h e ppm range.
11.3 MASS SPECTROMETRY OF MOLYBDENUM FLUORIDES
R. A . Strehlow J . D. Redrnan
'The volati l ization behavior of molybdenum and other fission product f luorides i n t he MSRE h a s led to a study of molybdenum fluorides. Mass spec t ro- metrically derived information i s of particular value in s tud ie s involving volati l ization, s ince , a t l ea s t in principle, t he vaporizing spec ie s are analyzed with a minimum time l apse . T h i s g ives an oppor- tunity to observe s o m e t rans ien t phenomena and to distinguish among various oxidation s t a t e s and im- purit ies which may b e present.
ana lys i s of vapors from three molybdenum fluoride samples . The first ob jec t ives were to assess
T h e work so far h a s been concerned with the m a s s
material purity and to e s t ab l i sh t h e m a s s spectro- metric cracking patterns for t h e s e materials which have not previously been subjec ted to m a s s analy- sis. scribed i n Tab le 11.1.
T h e three samples a r e designated and de-
Sample I , during a n inc rease of temperature from 400 to 725"C, yielded first MoO,F, a t t h e lowes t temperature. As t h e temperature w a s increased , the peaks a s soc ia t ed with th i s spec ie s decreased in magnitude and a family of peaks attributed t o MoOF, appeared. Near t h e upper limit of t he tem- perature excursion, a m a s s peak family was ob. served which i s attributed to MoF, and MoF s p e c i e s . ca ted tha t an oxidation-hydrolysis had occurred and that better, o r a t l ea s t fresher, material was needed. A somewhat increased amount of mass 96 was obseived from th i s sample , which i s attributed to orthosil icic ac id (H,SiO,) rather than to the molybdenum, s i n c e i t s peak height w a s not a con- s tan t multiple of t he other Mo' peak heights.
vapor The large amount of vola t i le oxides indi-
Sample 11, MoF,, was prepared by C . F. Weaver and H . A. Friedman and was heated in the Knudsen ce l l in le t system of t h e Bendix time-of-flight m a s s spectrometer. 'The compourid MoQ,F was not ob- served, but some MoOF, w a s evident (along with the usual S i F 3 , 2 , 1 ions) a t teinperatuies as low as 350°C. Beginning a t 275'1c, MoF,', MoF,', MoF3+, MoF ', and MoF+ were also observed. T h e MoF,+/MoF, peak height ratio w a s about unity, indicating s o m e MoF, as well a s MoF, (or MoF,). We have insufficient ev idence to demonstrate t ha t MoF4 h a s been part of our sampled vapor. At tern-- peratures greater than 600"C, only fluoride s p e c i e s were observed. T h e spec t ra for sample I1 a t tem- peratures of 250, 300, and 725OC a re shown in Fig. 11.1. A photograph of a n osc i l loscope t r ace of
It
Table 11 .1 . Mass Analysis o f Vapors f r o m Three Molybdenum Fluoride S o m p l e s
Nominal Cumpusition Sample Source
I
I1
111
MoF Exposed to a i r fur D. E. LaValle, Analytical Chemistry Division several years
MoF Recent synthesis C. F. Weaver and H. A. Friedman, Reactor Chemistry Division
MoF' , Recent synthesis C. F. Weaver and H. A. Friedman, Reactor Chemistry Division
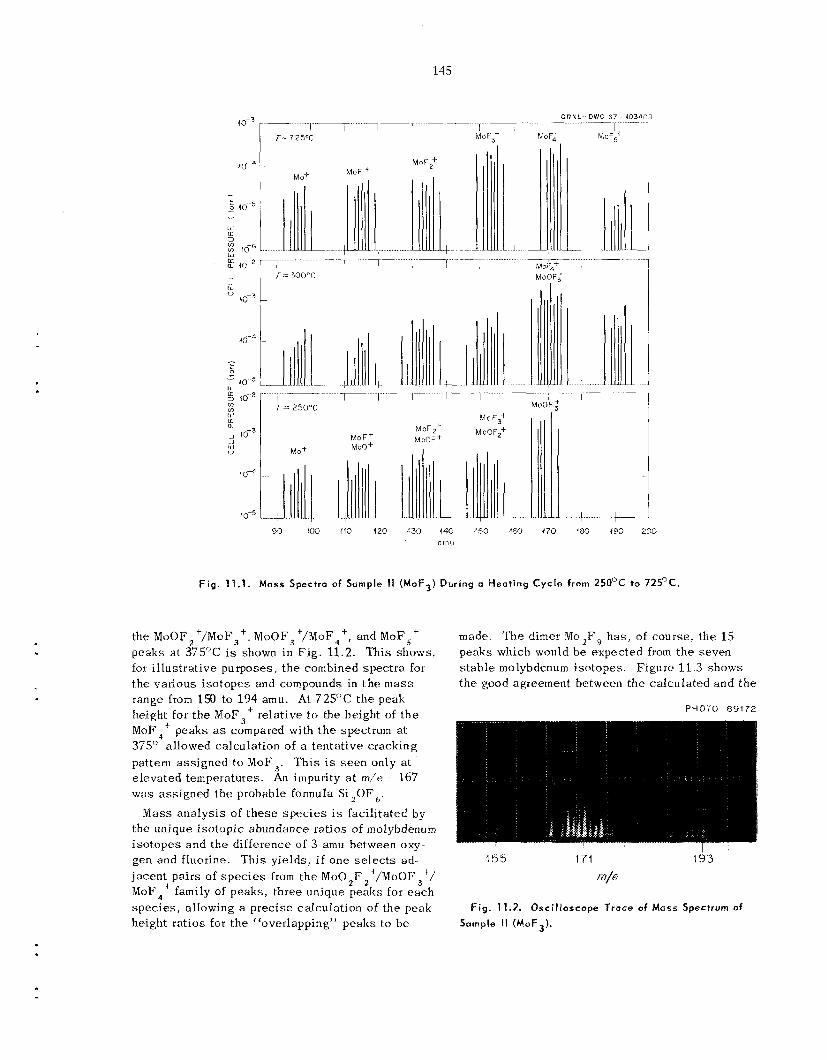
145
MoF + M O+
w I I
O R N L - - D W G 67 -103403 ...... ~ ....... r- I 1
MoFJ'
7 - 1 - - -
M o F .
MnDF2+ MoOFZ MOF+ M " O i + M O O +
..J. .... ~
90 (00 110 120 ,130 140 150 160 170 180 490 X O ornu
F i g . 11.1. Mass Spectra of Sample I1 (MoF3) During a Heat ing C y c l e from 25OoC to 725°C.
t he MoOF, ' / M o F 3 + , M o O F , t/MoF4t, and M o F 5 ' peaks a t 375°C i s shown in F ig . 11.2. This shows, for i l lus t ra t ive purposes , t h e combined spec t ra for t h e various i so topes and compounds in t h e mass range from 150 to 194 amu. At 725OC t h e peak height for t h e MoF,+ relative to the height of t h e Mop,' peaks as compared with t h e spectrum a t 375O allowed calculation of a ten ta t ive cracking patteni a s s igned to MoF,. T h i s is s e e n only a t e leva ted temperatures. An impurity a t m/e - 167 wiis ass igned the probable fonnula Si 20F,.
Mass ana lys i s of t h e s e s p e c i e s is facil i tated by t h e unique i so topic abundance ra t ios of molybdenum i so topes and the difference of 3 amu between oxy- gen and fluorine. This yie lds , if one s e l e c t s ad- jacent pa i r s of s p e c i e s from t h e M o 0 , F 2 + / M ~ ~ O F 3 t / MoF4+ family of peaks , three unique peaks for each spec ie s , allowing a p rec i se calculation of the peak height ratios for t h e "overlapping" peaks to b e
made. The dimer Mo,F, h a s , of course , t h e 15 peaks which would b e expected from t h e seven s t ab le molybdenum isotopes. Figure 11.3 shows t h e good agreement between t h e ca lcu la ted and t h e
PHOTO 89172
-- I - r 155 171 193
m/e
Fig . 11.2 . Oscil loscope Trace of Mass Spectrum of S a m p l e II (MoF3).
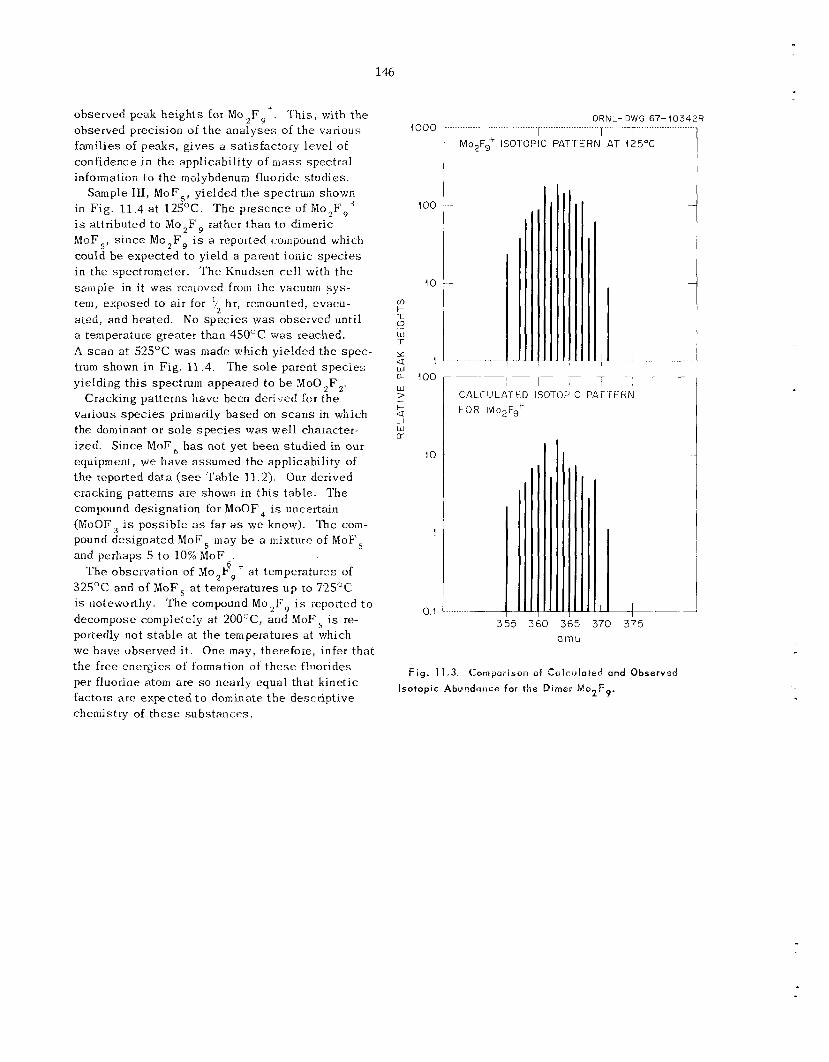
146
i
observed peak he ights for Mo 2F9 ' . 'I'his, with t h e observed precision of t h e ana lyses of t h e various families of peaks , gives a satisfactory leve l of confidence in the applicabili ty of mass spectral information to the molybdenum fluoride s tudies .
Sample 111, MoF,, yielded the spectrum shown in F ig . 11 .4 a t 125OC. T h e presence of M O ~ F ' , ~ is attributed t o Mo,F, rather than to dimeric MoFS, s i n c e Mo,F, is a reported compound which could be expec ted to yield a parent ionic s p e c i e s i n the spectrometer. T h e Knudsen ce l l with the sample in i t was removed from the vacuum s y s - tem, exposed to a i r for 11 hr, remounted, evacu- ated, and heated. N o s p e c i e s was observed until a temperature greater t han 45OOC w a s reached. A s c a n at 525OC was macle which yielded t h e spec - trum shown in Fig. 11 .4 . The sole parent s p e c i e s yielding t h i s spectrum appeared t o b e Mo0,F2.
Cracking patterns have been derived for t he various s p e c i e s primarily based on s c a n s in which the dominant or s o l e s p e c i e s was wel l character-. izcd. Since MaF, h a s not yet been studied in our equipmerit, w e have assumed the applicability of t h e reported data (see 'Table 11.2). Our derived cracking patterns a re shown in t h i s table. The compound designation for MoOF, is uncertain (MoOF, is poss ib le as far a s we know). The corn- pound designated Mob', may b e a mixture of MoF, and perhaps 5 t o 10% MoF .
T h e observation of Mo,#,' a t temperatures of 325OC and of MoF, at temperatures u p to 725'C is rioieworthy. The compound Mo,P;, i s reported t o decompose completely a t 2OOcC, and MoF, i s re- portedly not s t ab le at t he temperatures at which we have observed i t . One may, therefore, infer that t he free energ ies of fornation of t h e s e fluorides per fluorine atom a r e so nearly equal tha t kinetic factors a r e expec ted to dominate t h e descriptive chemistry of these subs t ances .
2
I i
ORNL-DWG 67-1034ZR 1 1 1 1 M O ~ F S + ISOTOPIC PATEHN AT ~ Z Y C
I 1 /I C a L C U L A f E D ISOTOPIC PATTFRN FOR Mo2Fgf
3 5 3 amu
'0 375
Fig. 11.3. Comparison of Calculated and Observed Isotopic Ataundunce for t h e Dimer Mo2F9.
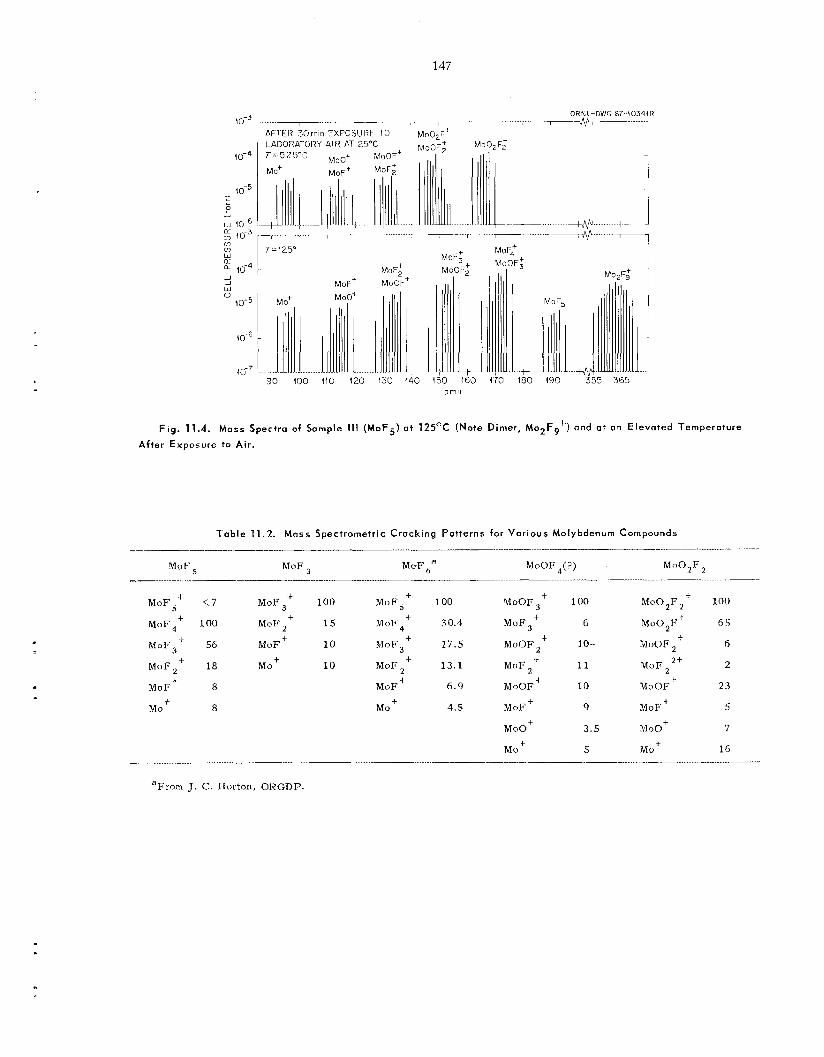
147
0 120 130 140 150 160 o m IJ
Fig . 11.4. Mass Spectra of Sample I l l (MoF5) a t 125OC (Note Dimer, Mo2F9+) and a t an E levated Temperature
After Exposure to Air .
T a b l e 11.2. Moss Spectrometric Cracking Patterns for Various Molybdenum Carnpounds ~- -
M o F MoF M"F,R MoOF4(') M o 0 2 F 2
MoF jt <7 MoF, t 100 M U F 5 + 100 MoOFJt 100 M0O2F2+ 100
MOF,+ 100 M ~ F ~ + 15 M O F q ' 30.4 6 M ~ O ~ F + 65
M O P 3 + 56 MoF + 10 M ~ F ~ + 17.5 MoOF2+ 10.- MoOF 6
M ~ F ~ ' 18 MO+ 10 MVF 2 + 13.1 M ~ F 2t 1 1 M O F
I
I '
2t 2
+ M o F 8 M ~ F + 6.9 MoOF + 10 M ~ O F + 23
a Mo + 4 . 5 M o F 9 M ~ F ' 5
MOO+ 3.5 MOO+ 7
+ M 0
M o 5 M o 16 _____ -
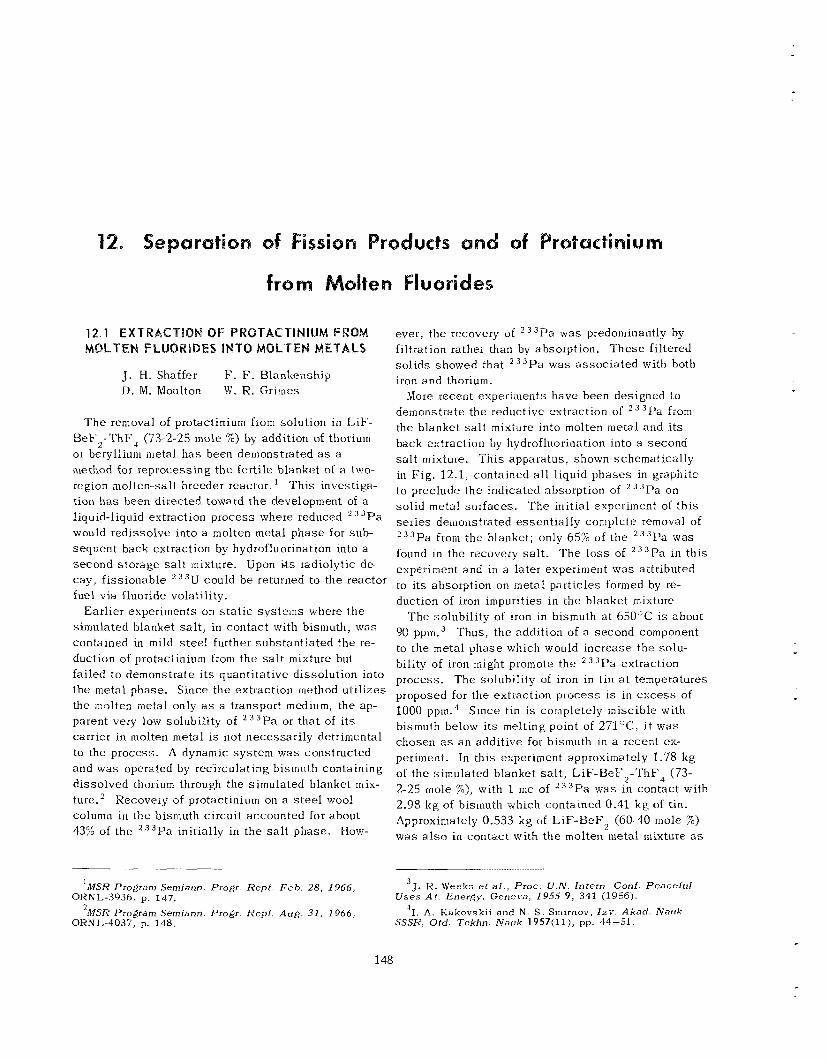
12.1 EXTRACT] ROTACTlNlUM FROM ever, the recovery of 233Pa was predominantly by MOLTEN FLUORlDES INTO MOLTEN METALS filtration rather than by absorption.
so l ids showed that 2 3 3 P a was a s soc ia t ed with both iron and thorium.
More recent experiments have been designed to demonstrate the reductive extraction of 233Pa from
T h e removal of protactinium from solution in LiF- the blanket salt into molten and its
T h e s e filtered
J. H. Shaffer D. M. Moulton W. R. Grimes
F. F. Blankenship
SeF2- 'rhF4 (73-2-25 mole %) by addition of thorium back extraction by hydrofluorination into a second or beryllium metal h a s been demonstrated as a s a l t mixture. T h i s apparatus, shown schematically method for reprocessing t h e fert i le blanket of a two- in Fig. 12.11 contained a l l liquid phases in graphite region molten-salt breeder reactor. ' Th i s investiga- to preclude the indicated absorption of z 3 3 p a on
liquid-liquid extraction process where reduced ' 3 P a se r i e s demonstrated essent ia l ly complete removal of would redissolve into a molten metal phase for sub- ~ 3 3 ~ ~ from the blanket; only 65% of the 2 3 3 p a was sequent back extraction by hydrofluorination into a found in the recovery salt. The loss of 2 3 3 p a in this second s torage s a l t mixture. Upon Its radiolytic de- experiment and in a later experiment was attributed cay , f i s s ionable 233U could be returned to the reactor to its absorption on metal particles formed by re- fue l via fluoride volatility. duction of iron impurities in the blanket mixture.
Earlier experiments on s t a t i c sys t ems where t h e simulated blanket s a l t , in contac t with bismuth, w a s 90 ppm.3 Thus, the contained in mild s t ee l further subs tan t ia ted the re- to the metal phase wilich would duction of protactinium from the s a l t mixture but bility of iron might promote the 233Pa extraction failed to demonstrate i t s quantitative dissolution into process. The sol,lhility of iron in t in a t t he metal phase. Since the extractioii method u t i l i zes proposed for the the molten inetal only a s a transport medium, the ap- parent very low solubility of 233Pa or tha t of i t s carrier in molten metal is not necessar i ly detrimental to the process. A dynamic system was constructed this experiment approximately 1.78 kg and was operated by recirculating bismuth containing of the simulated blanket salt, L ~ F - B ~ F ~ - T ~ F ~ (73- disso lved thorium through the simulated blanket mix- ture.' column iri the bismuth circuit accounted for about 43% of the 233Pa initially i r i t he s a l t phase . How-
tion h a s heen directed toward t h e development of a solid metal surfaces. The initial experiment of this
The solubili ty of iron in bismuth a t 6503C i s about of a second component
+he solu-
process is in of l ~ o ~ PPm.4 Since tin is completely miscible with bismuth below its melting point of 27I0C, i t w a s chosen a s a n additive for bismuth in a recent e'x- peri,nent.
2-25 inole "/.I, with 1 mc of 2 3 3 ~ ~ w3s in contact ,aith 2.98 k g of bismuth which contained 0.41 k g of tin. ~~~~~~~~~~~l~ 0.533 kg was also in contac t with the molten metal niixttire a s
Recovery of protactinium on a s t e e l wool
(60-40 mole %)
'MSR Program Semiann. Progr. Rep t . Feb . 28, 1966,
2 M S R Program Semiann. Progr. Rep t . Aug. 31, 1966,
3J. K. Weeks et a]., Proc. U . N . Intern. Conf . Peace fu l U s e s A t . Energy, Geneva, 1955 9 , 341 (1956).
41. A. Kakovsk i i and N~ S , Smirnov, I z v . Akad. Natrk SSSR, Otd. Tekhn. Narik 1957(11), pp. 44-51.
ORNL-3936, p. 147.
O R N L - ~ O ~ ~ , p. 148.
148
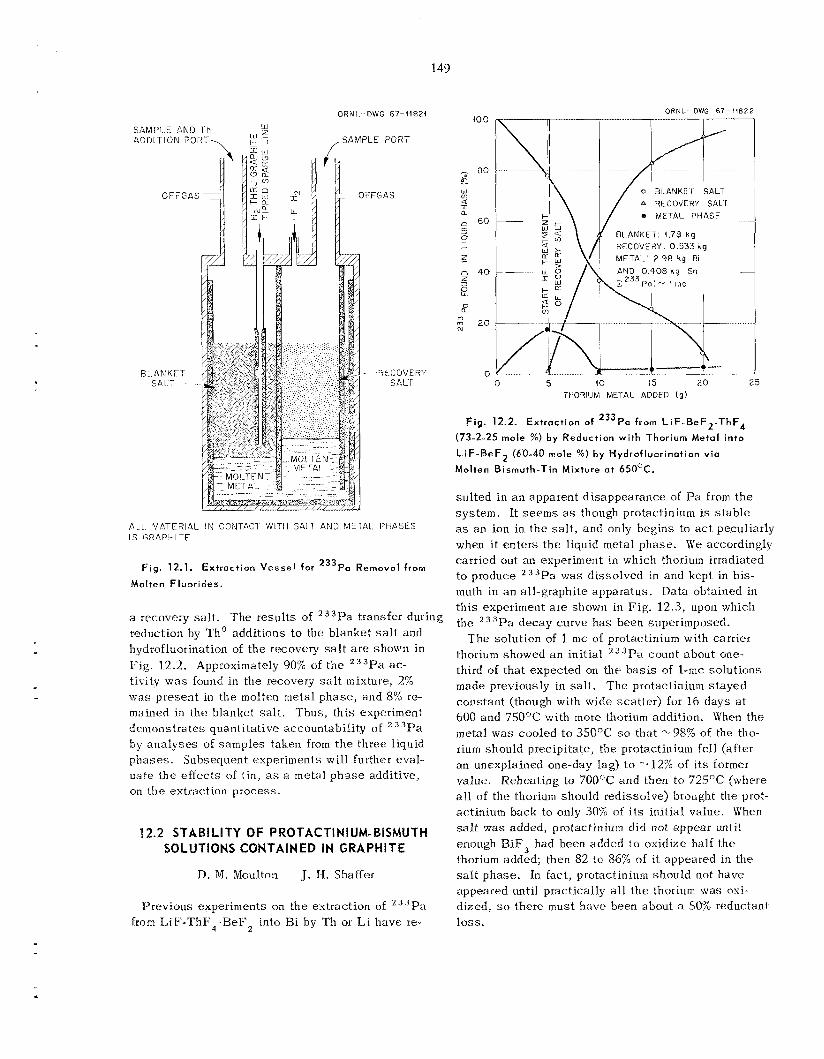
149
100 ORNL - 0 W G 67-11821
111
w 6 ,,SAMPLE PORT ADDITION FORI-, _I
SAMPI. E GND 1 n
O F i
F3 1. A N K E SALT-
-G.C
-r
'FGAS
WECOVEFiY 0 SAC1
ORNL-- DWG 67--118: 2
A i7ECOVERY SAL-I e METAL PHASE
LANKET. '1.75 k g ECOVERY: 0.5:33 k g ETAL: 2.98 kg Ei
0 5 10 15 2 0 25 THORIUM M U A L ADDED ( 3 )
F ig . 12.2. Extraction of 233Pa from L i F - B e F 2 - T h F 4
(73-2-25 mole X) by Reduction wi th Thorium Meta l into
L i F - B e F 2 (60-40 mole %) by Hydrofluorinotion vio
Molten Bismuth-Tin Mixture at 65OoC.
su l ted in a n apparent d i sappearance of Pa from t h e sys tem. It seems as though protactinium is s t ab le
A1.L. MATERIAL ! N CONTACT WITH SALT AND blJlt:I.AL. PHASES as a n ion in t h e sa l t , and only begins to a c t peculiarly when i t en te rs t he liquid metal phase . W e accordingly carried out a n experiment in which thorium irradiated to produce 3Pa was d isso lved in and kept in bis- muth in a n all-graphite apparatus. Data obtained in th i s experiment a r e shown in Fig. 12.3, upon which
I S GRAPIi ITF
F i g . 12.1. Extraction V e s s e l for 233Pa Removol from
Molten Fluorides.
a recovery sa l t . The resu l t s of 233Pa transfer during the 2 3 3 p a decay CUrVE has beetl superimposed. reduction by Th' addit.ions to the blanket s a l t and hydrofluorination of t he rr_yovery salt are shown in Fig. 1.2.2. Approximately 90% of the 233Pa ac- tivity w a s found in the recovery s a l t mixture, 2% was present in the molten metal phase , and 8% re-- mained in the blanket s a l t . Thus, this experiment demonstrates quantitative accountabili ty of "Pa by ana lyses of samples taken from t h e three liquid phases . Subsequent experiments will further eval- uate the ef fec ts of tin, a s a metal p h a s e additive, on {be extraction process .
12.2 STABILITY OF PROTACTINIUM-BISMUTH SBLUTIONS CONTAINED IN GRAPHITE
D. Id. Moulton J. Ii. Shaffer
Previous experiments on the extraction of 3Pa from LiE'-ThF4-BeF, into B i by Th or L i have re-
T h e solution of 1 nic of protactinium with carrier thorium showed a n init ial 2 3 3 P a count about one- third of that expected on the b a s i s of 1-rnc solutions made previously in sa l t . T h e protactinium s t ayed cons tan t (though with wide sca t te r ) for 16 days a t 600 and 750OC with more thorium addition. When the
rium should precipitate, the protactinium fell !after an unexplained one-day lag) to value. Reheating to 700'C and then to 72.5OC (where all of the thorium should redissolve) brought the prot- actinium back to only 30% o f i t s initial value. When salt was added, protactinium did not appear until enough BiF3 had been added to oxidize half the thorium added; then 82 to 86% of it appeared in the s a l t phase . In €act, protactinium should not have appeared until practically all t h e thorium was oxi- dized, so there must have been about 3 50% reductant. loss.
111etal w a s cooled to 350°C SO tha t -'98% of the tho-
of i t s former
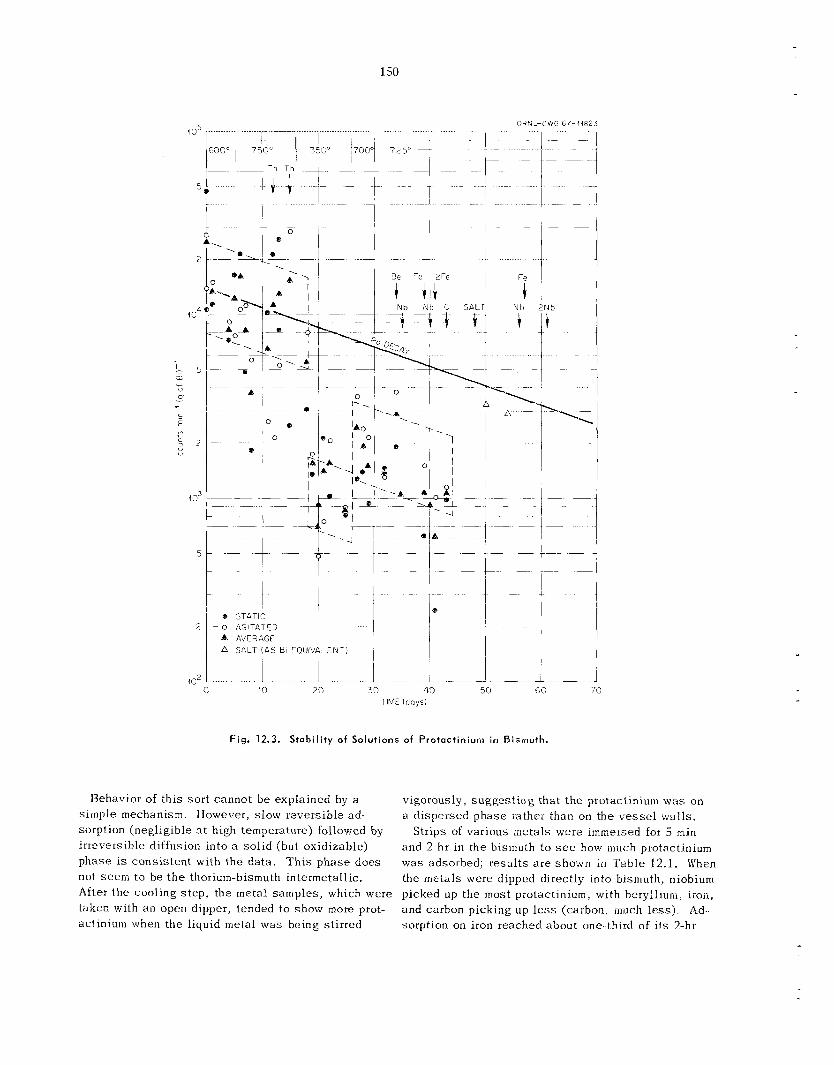
150
2 a STATIC
- 0 AGITATED A AVERAGE A SALT ( A S BI EQUIVALENT)
-~
I I 1 I-
(()' I .......... ...... ~~1 ~ ..... 1 ........ ~ .... 1 - ..... -1- 1 0 10 20 30 40 50 60 70
TIME (days1
Fig. 12.3. Stability o f Solutions of Protactinium in Bismuth.
Behavior of th i s sor t cannot b e explained by a simple mechanism. However, slow reversible ad- sorption (negligible at high temperature) followed by irreversible diffusion into a so l id (but oxidizable) phase i s cons is ten t with t h e data. T h i s phase does not s e e m to be t h e thorium-bismuth intermetallic. After t he cooling s t ep , the metal samples , which were taken with an open dipper, tended to show more prot- actinium when the liquid metal was being stirred
vigorously, sugges t ing tha t t h e protactinium was on a d ispersed phase rathcr than on the v e s s e l walls.
Strips of various metals were immersed for 5 min and 2 hr in the bismuth to see how m u c h protactinium was adsorbed; r e s u l t s a r e shoyqil in Table 12.1. When the metals were dipped directly into bismuth, niobium picked up the most protactinium, with beryllium, iron, and carbon picking u p l e s s (carbon, milch less). Ad- sorption on iron reached about one th i rd of its 2-hr
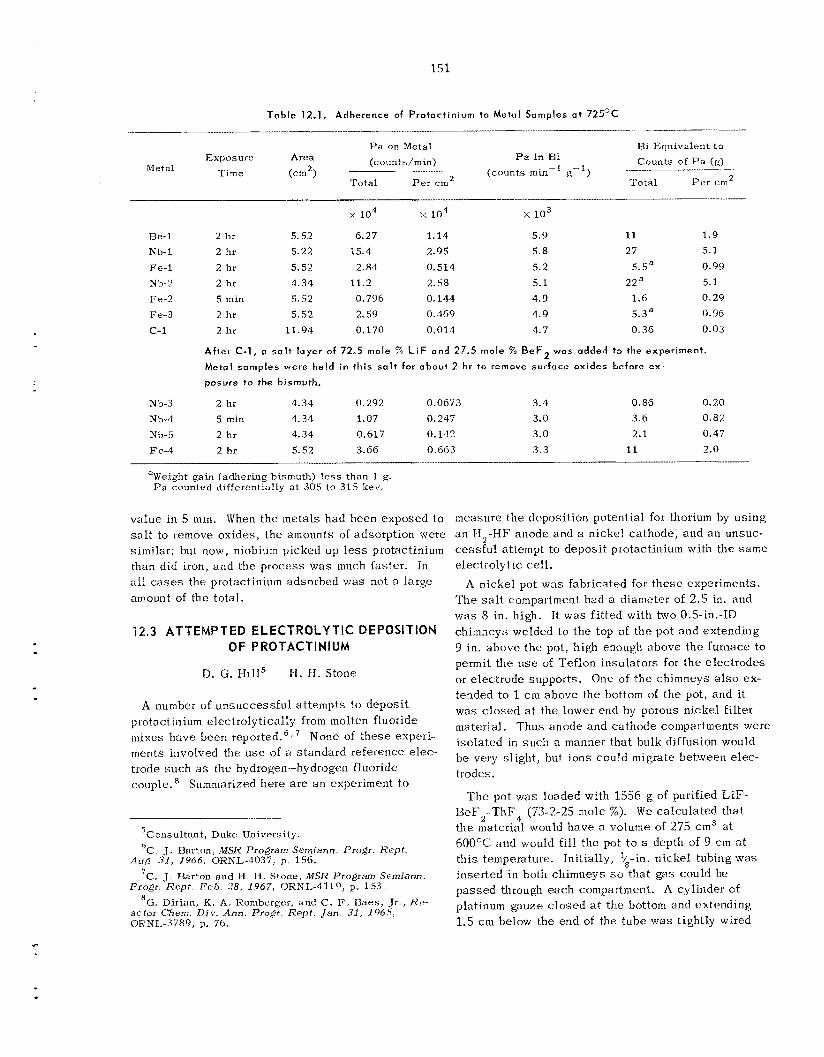
151
T a b l e 12.1. Adherence of Protoctinium t o Metul Samples a t 725°C
Pa on Metal Bi Equivalent to Expos ure Area Pa in Bi Countk of Pa (9 ) (counts /min)
(counts min-' E-*) Total P e r <:ma Total Pe r c m 2
.....--. ~ T i m e (cm2) Metal
104 x lo4 x 103
Re-1 2 hr 5.52 6.27 1.14 5.9 11 1.9 Nb-1 2 hr 5.22 15.4 2.95 5.8 27 5.1 Fe-1 2 hr 5.52 2.84 0.514 s.2 5.5a 0.99 Nb-2 2 hr 4.34 11.2 2.58 5.1 22 a 5.1 Fe-2 5 min 5.52 0.796 0.144 4.9 1.6 0.29 Fe-3 2 hr 5.52 2.59 0.469 4.9 5.3a 0.9G C-1 2 hr 11.94 0.170 0.014 4.7 0.36 0.03
A f t e r C-1, a solt luyer of 72.5 mole 7'0 LiF and 27.5 mole % B e F
Metal samples were held in this sa l t for about 2 hr to remove surface oxides before ex-
posure to the bismuth.
was added to the experiment. 2
Nb-3 2 hr 4.34 0.292 0.0673 3.4 0.86 0.20 Nb-4 5 min 4.34 1.07 0.247 3.0 3.6 0.82 Nb-5 2 hr 4.34 0.617 0.142 3.0 2.1 0.47 Fe-4 2 hr 5.52 3.66 0.663 3.3 11 2.0
"Weight gain (adhering bismuth) l e s s than 1 g. P a counted differentially a t 305 to 315 kev.
-. -- ____-
value in 5 mm. When the meta ls had been exposed to s a l t to remove oxides, t he amounts of adsorption were similar; but now, niobium picked up less protactinium than did iron, a n d the process w a s much faster. In all cases the protactinium adsorbed was not a large amount of the total .
12.3 ATTEMPTED ELECTROLYTIC DEPOSITION OF PROTACTlNlUM
D. G. ~ 1 1 1 ~ 1-1. 1-1. Stone
A number of unsuccessfu l a t tempts to depos i t protactinium electrolytically from molten fluoride mixes have bcen r e p ~ r t e d . ~ , ~ None of these experi- ments involved the u s e of a s tandard reference elec- trode such as the hydrogen-hydrogen fluoride couple. * Summarized here a r e a n experiment t o
'Consultant, Duke University. 6 e. J. Barton, M S R Program Serniann. Progr. K e p t .
Aug. 31, 19/56, OKNL-4037, p, 156.
Pro&. Rept . F e b . 28, 1967, ORNI,-4119, p. 153.
actor C'heni. Div. Ann. Pro&. Rept . J a n . 3.1, 196.5, OkNL-3789, p. 76.
7 ~ . J. Barton and H. H. Stone, ;\fsR Program ~ e m i a n n .
'G. Dirian, K . A , Romberger, and C. F. Raes, Jr., K?-
measure the deposit ion potential for thorium by us ing a n H,-HF anode and a nickel ca thode , and a n unsuc- cessful attempt to depos i t protactinium with the s a m e electrolytic cell.
T h e s a l t compartment had a diameter of 2.5 in. and was 8 in. high. It was fi t ted with two O.S-in.-ID chimneys welded to the top of t he pot and extending 9 in. above the pot, high enough above t h e furnace to permit the u s e of Teflon insu la tors for t h e e lec t rodes or electrode supports. One of t h e chimneys also ex- tended to 1 c m above the bottom of the pot, and it was c losed a t t he lower end by porous nickel Eilter material. Thus anode and ca thode compartments were isolated in s u c h a manner tha t bulk diffusion would be very slight, but ions could migrate between elec- trodes.
A nickel pot was fabricated for t h e s e experiments,
T h e pot was loaded with 1556 g of purified LiF- BeF2-ThF4 (7:?-2-25 mole z). W e ca lcu la ted that t he material would have a volume of 275 c m 3 a t 600°C and would fi l l t he pot to a depth of 9 cm at th i s temperature. Init ially, %-in. n icke l tubing was inserted i n both chimneys s o tha t gas could he pas sed through each compartment. A cylinder c f platinum gauze c losed a t t he bottom and extending 1.5 c m below the end of the tube was tightly wired
x
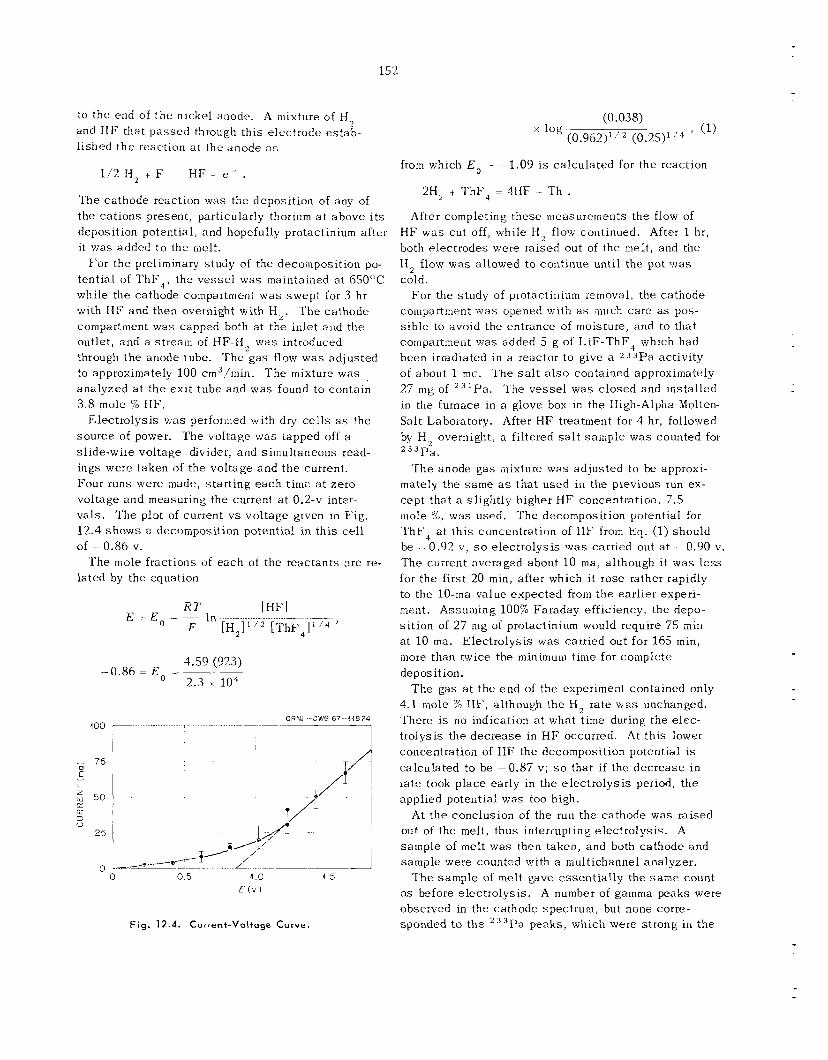
152
(0.038) (0.962)’ ’’ (0.25)’ ’ 4
x log t (1) to the end o f t h e nickel anode. A mixture o f H 2 and H F that pas sed through th is electrode e s t ah - l i shed t h e reaction a t the anode as
1/2 H, t F- : H F i e- .
The ca thode reaction was the deposit ion of any of the cations present, particularly thorium a t above i t s deposition potential, and hopefully protactinium after it vias added t o the melt.
For the preliminary study of the decomposition po- tential of T h F 4 , the ves se l was maintained at 6SO’C while the cathode compartment was swep t for 3 hr with H F and then overnight with H 2 . The ca thode coinpartrrient was capped both a t the inlet and the outlet, and a stream of HF-i12 was introduced through the anode tube. T h e g a s flow was ad jus ted to approximately 100 cm3/rnin. T h e mixture was ,
analyzed a t t he ex i t tube and was found to contain 3.8 mole “0 HF.
Elec t ro lys i s was performed with dry ce l l s as the source of power. The voltage was tapped off a sl ide-wire voltage divider, and simultaneous read- ings were taken of the voltage and t h e current. Four r u n s were made, s ta r t ing each time a t zero voltage and measuring the current a t 0.2-v inter- vals. The plot of current v s voltage given in F ig . 12.4 shows a decomposition potent-ial in th i s ce l l of -0.86 V.
T h e mole fractions o f each of the reactants a r e re- lated by the equation
-0.86 = E o
100 7
from which E , : - 1.09 is ca lcu la ted for the reaction
2H, i ThF, = 4IIF t Th . After completing these measurements the flow of
H F was cut off, while 1 1 2 flow continued. both electrodes were raised out of the melt, and the H 2 flow was allowed to continue until t he pot w a s cold.
compartment w a s opened with as milch. c a re a s pos- s ib le to avoid the entrance of moisture, and to that compartment was added 5 g of L i F - T h F 4 which had been irradiated in a reactor to give a 233Pa activity of about 1 m c . The s a l t a l s o contained approximately 27 mg of 2 3 1 P a . ‘The vesse l was c losed and installed in the furnace i n a glove box in the High-Alpha Molten- Salt Laboratory. After H F treatment for 4 hr, followed by H 2 overnight, a filtered s a l t s ample w a s counted for 233Pa.
T h e anode gas mixture was ad jus ted to be approxi- m a t e l y the same a s tha t used in the previous tun ex- cept that a s l igh t ly higher H F concentration, 7.5 mole %, was used. T h e decomposition potential for T h F 4 a t th i s concentration of IIF from Eq. (1) should be .--0.92 v, s o e lec t ro lys i s w a s carried out a t .--0.90 v. The cijiient averaged about 10 m a ; although i t was l e s s for the first 20 min, after which i t rose iather rapidly to the 10-ma value expected from the earlier experi- ment. Assuming 100% Faraday efficiency, t he depo- s i t ion of 27 mg of protactinium would require 75 rnin a t 10 m a . E lec t ro lys i s was carried out for 165 min,
After 1 hr,
For the study of protactinium removal, the cathode
more than twice the minimuiii tiil1e for complete deposition.
4.1 molc “7, kIF, although the H 2 rate wa? unrhanged. ~ - - O W L 0 ~ F 6 7 4 4 8 ~ There is no indication a t what time during the e lec-
trolysis t he decrease in H F occurred. At th i s lower concentration of HF the decomposition p o t ~ n t i a l 15 calculated to be -0.87 v, so that i f the dec rease in rat? took p lace early in the e lec t ro lys i s period, the applied potential was too high.
4.59 (923)
2.3 1 0 4 T h e gas a t the end of the rxpeiiment contained only
I
At the conclusion of the run the ca thode was raised
Fig. 12.4. Current-Voltage Curve.
out of the melt, thus interrupting e lec t ro lys i s . A sample of melt was then taken, and buth cathode and sample were counted with a multichannel analyzer.
as before e lec t ro lys i s . A number of gamma peaks were observed in the cathode spectrum, but none corre- sponded to the
T h e sample of melt gave essent ia l ly the s a m e count
‘Pa peaks , which were s t rong in the
153
melt sample. T h e location of t he peaks and the limited da ta on their decay ra tes ind ica te that t h e s e ac t iv i t ies c a n be attr ibuted to various metubers of t h e thorium decay se r i e s , s u c h a s 2 r z P b , '"Bi, and '"*Tl, although insufficient decay rate da t a were obtained for conclusive identification. T h e lack of 2 3 3 P a ac t iv i ty on the ca thode , coupled with a lmost identical counts on samples OE melt taken below and after e lec t ro lys i s , indicated tha t deposit ion of a s igni f icant amount of protactinium on the ca thode did not t ake p l ace in this experiment.
T h e failure to reduce protactinium in th i s experi- ment may b e explained by its low concentration in the melt. The amount added, 27 rng in 1556 g of L iF -BeF2-ThF4 , is approximately equa l tu a mole fraction of 2 x I O w 5 . If the protactinium is four- valent in the melt, and if i t is assumed that i t s E , is c l o s e to that of thorium, tha t is, 1 v, the potential required to reduce it a t that concentra- tion and a t the HF-1-1, ratio used in t h e electrol- y s i s i s 1.007 v. The very sma l l denominator makes the logarithm t e r m posit ive, so that t h e reduction potential is even more negat ive than E , in sp i te of the low H F prt.: .\sure.
c a n be reduced by thorium a t th i s concentration, which is contrary to fact. 'The n icke l ca thode did not provide a low-activity alloy in th i s attempt. T h i s sugges t s the possibil i ty of u s i n g a ca thode that would form a thorium alloy in which protactinium d i s so lves at low enough activity to permit reaction. For further experiments of th i s type w e recommend a potential of 1.1 v, at which thorium will be de- posited, hopefully, a long with protactinium, and s topping the experiment when five equivalents of thorium have been deposited. This would give a concentration of about 0.2 for protactinium in the metal, and thus a low enough ac t iv i ty to permit reduction of essent ia l ly a l l t he protactinium.
T h e s a m e argument would deny tha t protactinium
12.4 PROTACTINIUM STUDIES IN THE HIGH- ALPHA MOLTEN-SALT LABORATORY
C. J. Barton H. PI. Stone
In the previous progress report7 w e mentioned the possibil i ty tha t icon coprecipitated with protacl inium, when so l id thorium was exposed to molten Li F-ThF,$, might be carrying the reduced protactinium to the s t e e l wool su r face in the Rril lo process . It w a s a l s o pointed out that variable iron a n a l y s e s made it dif- ficult t o determine the role of iron in protactinium re-
duction experiments. We performed one reduction experiment with (73-27 mole %j in the absence of protactir~ium, and the resu l t s a r e summarized below. Most of t he protactinium recovery experiments performed during the current report period wetre thorium reduction t e s t s . An unsuccessful effort to depos i t protactinium elec- trolytically is discus:;ed in the preceding sec t ion o f th i s report.
'Fe tracer d i sso lved in I,iF-ThF4
Reduction of Iron Dissolved in Molten LiF-ThF,
We studied t h e reduction o f iron d isso lved in molten L iF-ThF4 (73-27 mole %j by us ing hydrogen and metall ic thorium as t he reducing agents . T h e tracer iron results indicated tha t more than 40 hr was required to reduce the iror? concentration f rom 330 to 2 ppm with hydrogen a t a temperature of 6OOOC. During a 3-hr exposure to metall ic thorium at the same temperature, the iror! concentration in filtered samples , caIculat.ed from t racer counts, diminished from 550 to 13 ppm.
Colorimetric iron determinations performed by two different laboratories agreed with the tracer iron da ta for about half the samples . In general, agreement was poorest for sarriplcs that gave "Fe counts in- d ica t ing a n iron concentration less than 0.1 mg/g. It appears that the colorimetric iron method tends to give high resu l t s with samples having a low iron concentration. This finding is in agreement with resu l t s of earlier unpublished s tud ie s per- formed by Reactor Chemistry Division personnel.
in more de ta i l in another report. The results of this experiment will be d i scussed
Thorium Reduction in the Presence of an Iron Surface ( B r i l l 0 Process)
One Rrillo experiment of the type d i scussed in the previous report' was performed during th i s report period. A s a l t solvent, LiF-'ThF, (73-27 mole %), containing init ially 17 mg of 2 3 'Pa and 57 rrig of Fe was exposed to thorium rods for two 1-hr petiods in the presence of 4 g of s t e e l wool (0.068 m 2 per g of sur face area). T h e tracers 233Pa and 5gFe were added to a id in following the behavior of t h e s e e l e - ments in the experiment. The f i r s t thorium exposure removed 05% of t h e protactinium, a s determined by ana lys i s of a filtered sample of s a l t , and almost a l l the iron. The second thorium exposure resulted in only a s l igh t further decrease in protactinium con-
154
centration (97% removed). The distribution of prot- actiriiurn was a s follows: 72 2% in the s t e e l wool p lus untransferred sa l t , 4.3% i n the unfiltered s a l t transferred away from the s t e e l wool, 8.7% in t h e s t ee l l iner and dip leg, and 12.0% in saiiiples, for a total of 97.8% recovered. The data obtained in Lhis experiment confirmed the r e su l i s of previously i c p r t e d 7 experiments that indicate the Rril lo process may warrant further examination.
Thorium Reduction Fol lowed by Fiitratior!
W e reported earlier6 tha t a large fraction of t h e reduced protactinium that would not p a s s through a sintered copper filter was found in samples. of un- filtered sa l t . This sugges ted t h e possibil i ty of col- l ec t ing the reduced protactinium on a rrietal filter from which it could presumably be removed by dis- solving i t in a molten s a l t after pas s ing I-IF through the filter. W e performed severa l experiments to t e s t the efficiency of protactinium recovery by filtration. The initial treatment of molten L iF-ThF4 (73-27 mole %) mixed with enough 231Pa to give a con- centration of 20 to 60 ppm w a s performed in unlined nickel pots. The molten s a l t was treated first with mixed hydrogen and H F , followed by a brief hydrogen treatment before i t was transferred through a nickel filter into a graphite-lined pot equipped with a graphite d ip leg. Here the reduction of protactinium was carried out in the usual fashion, either by ex- posure to a solid thorium rod o r to thorium turnings suspended in a nickel baske t , t ak ing sainples of fil- tered and unfiltered s a l t a f te r each thorium treatment of the melt. The reduced melt was then transferred back into the nickel pot through the transfer filter.
In four experiments the amount of protactinium found in the transfer filter varied from 10 to 30% of the total amount present. T h i s represented 40 to 95% of the amouiit of protactinium suspended in the reduced s a l t (average, 69%). T h e amount of prot- actinium i n the graphite liner and d ip l e g varied frorn 20 t o 57% of the total (average, 33%). The data show that a fi l t iat ion method will not ca tch prntactinium on the filter, but never the less the re- moval of protactinium from a melt does appear feo- s ib le .
One experiment was attempted with a niobium liner and dip leg. The reduction of protactinium with thorium proceeded normally (12% of the Pa re- mained in the filtered s a l t a f te r 2 h r of thorium treatment), but transfer of the reduced s a l t through the filter could not be effected because of a clogged
filter. A considcrable amount of grayish. material was found in the bottom of the pot a f te r it cooled to room temperature. A sample of th i s material w a s reported to contain only 0.35 m g of Nb per g, but i t is qu i te poss ib le that th i s aruount of iinpuiity in the molten s a l t w o d d have been sufficient to c log the filter.
T h e effect of iron on the behavior of protactinium in thorium reduction experiments has noi been de- fined imambiguously as ye t , but we continue to find reasonably good correlation between the distribution of iron and protactinium in these experiiiients. Count- ing of 233Pa and 59Fe in both so l id samples and solutions of samples provided a check on the ac- curacy of 2 3 'Pa alpha pulse-height ana lyses and colorimetric iron determinations.
Concl us ion
- 1 horium metal i s an effective agent for reducing protactinium in molten fluoride breeder blanket mixtures, but further s tudy w i l l be required to de- termine the bes t method o f separa t ing the reduced protactinium from the s a l t m i x .
R FUEL REPROCESSING BY REDUCTIVE EXTWACTaCaN INTO
MOLTEN B!SMUTH
I). M. Moulton vir. R. Grimes F. F. Blankenship J. H. Shaffer
An electromotive s e r i e s for the extraction of f iss ion products frorn 21,jF.BeF2 into liquid bis- miiih has been constructed in the way described for the MSBR blanket materials in the preceding ieport in th i s s e r i e s . Briefly, standard half-cell reduc- tion potentials a r e ca lcu la ted for each metal, using as the standard s t a t e s t he idea l solutions i t 1 s a l t and bismuth extiapolated from infinite dilution to unit mole fraction. 'The exception is lithium, for which the standard s t a t e in sa1.t is 2L iF .BeF2 . (This standard s t a t e is a l s o used for beryllium, but i t is not ass igned a standard s t a t e in bismuth be- c a u s e of i t s very low solubility.) Th i s choice of standard s t a t e s is the normal practice when dea l - ing with d i lu te so lu t ions . T h e s e standard poten- t i a l s a re ca l led 'P d to distinguish thein from y o , 3~ i
9.VSH Program Serniann Pro&. Rep t . Feb. 28, 1367, O R N I A ~ ~ ~ , p. is(?.
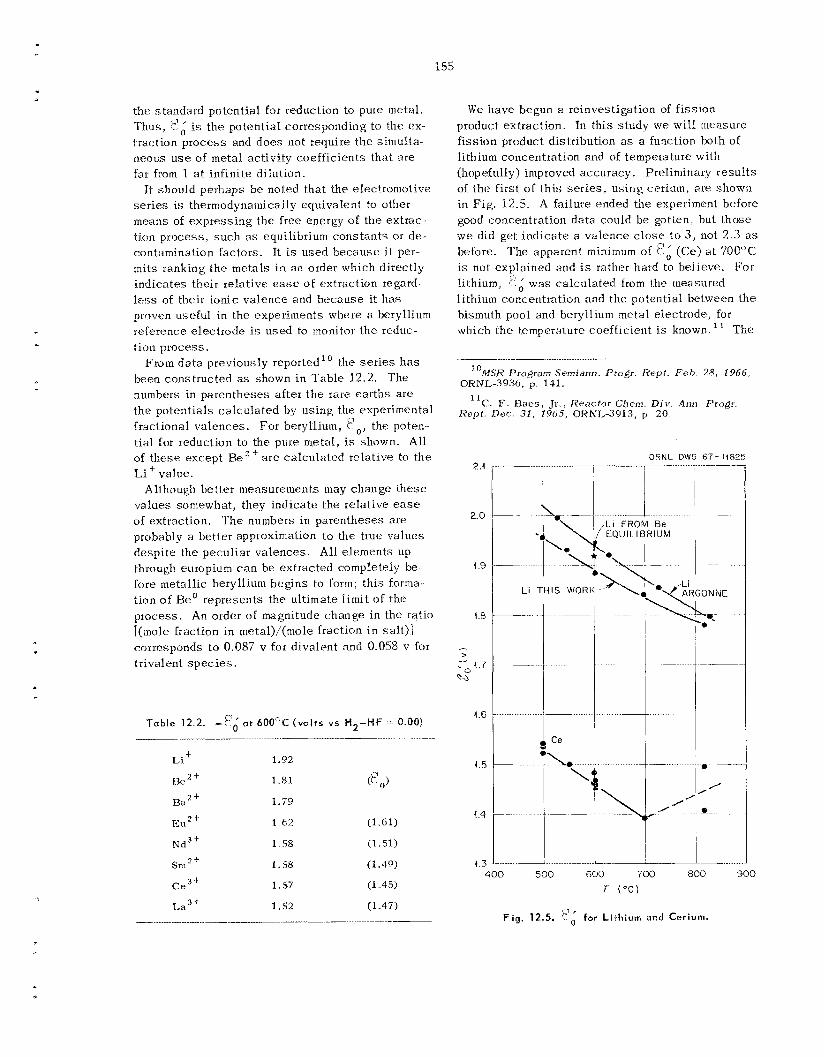
155
the standard potential for reduction to pure metal. Thus , is the potential corresponding to the ex- traction p rocess and does not require the simulta- neous u s e of metal activity coef f ic ien ts that are far from 1 at infinite dilution.
s e r i e s is thermodynamically equivalent to other means of express ing the free energy of the ex t rac- tion process , s u c h as equilibrium cons tan ts or de- contaminaiion factors. It i s used because i t per- mits ranking the meta ls i n an order which djrectly ind ica tes their relative ease of extraction regard- less of their ionic va lence and because it h a s proven useful i n t h e experiments where a beryllium reference e lec t rode is used to monitor t he reduc- tion process .
the s e r i e s h a s been constructed as shown i n Table 12.2. The numbers in parentheses a f te r t he r a re ear ths are t h e potentials ca lcu la ted by using the experimental fractional va lences . For beryllium, (.- o , the poten- t i a l for reduction to the pure metal, is shown. All of these except ~ e ' + a r e ca lcu la ted relative to t h e Lit value.
Although be t te r measurements may change t h e s e values somewhat, they indicate the relative ease of extraction. 'The numbers in parentheses a re probably a better approximation to the true va lues desp i te the peculiar va lences . All e lements up through europium c a n b e extracted completely k- fore metall ic beryllium begins to form; th i s forma-- tion of He" represents the ultimate l imit of the process. An order of magnitude change in the ratio [(mole fraction in metal)/(moIa fraction i n sa l t j l corresponds to 0.057 v for divalent and 0.058 v ior tr ivalent s p e c i e s .
It. should perhaps be noted that the electromotive
From da ta previously reported
C'
Table 12.2. -?; at 600°C ( v o l t s v s H 2 - H F : 0.00)
t Li
BaZ+
EU 2 '-
SmZ +
ce3+
L a 3 i
Nd3+
1.92
1,81 CF o)
1.79
1.62 (1 61)
1.58 (1 ,511
1.58 (1.49)
1.57 (1.45)
1.52 (1.47) ~
We have begun a reinvestigation of f i ss ion product extraction. In th i s s tudy we wil l measure f i ss ion product distribution a s a ftirlction both of lithium concentration nnd of temperature with (hopefully) improved accuracy. Preliminary results of t h e f i r s t of t h i s s e r i e s , us ing cerium, a re shown in Fig. 12.5. A failure ended the experiment before good concentration da ta could be gotten, but those wc: did get: i nd ica t e a va lence c l o s e to 3 , not 2 .3 a s before. The apparent minimum of ?; ( C e ) a t 700°C is not explained arid is rather hard to believe. For lithium, f''; was ca lcu la ted from the measured lithium concentration and t h e potential between t h e bismuth pool and beryllium metal electrode, for which the temperature coefficient is known. The
" M S R Program Semianri. Progr . Kept . F e h 28. 1966, ORNL-3936, p. 141.
1 1 C;. F, Haes , J r ~ , Keactor Chern. Div. Atin. F'rogr. Rept. Dec. 31, 196.5, ORNL-391.3, p, 20.
2.4
2.0
1.9
i .a
- > - . 4.7 Q
4.6
4.5
.n,
+.3
ORNL. DWG 67-14825 __ ... . ._ 7.-
400 500 600 700 800 900
T ("GI
F i g . 12.5. b:i for Lithium and Cerium.
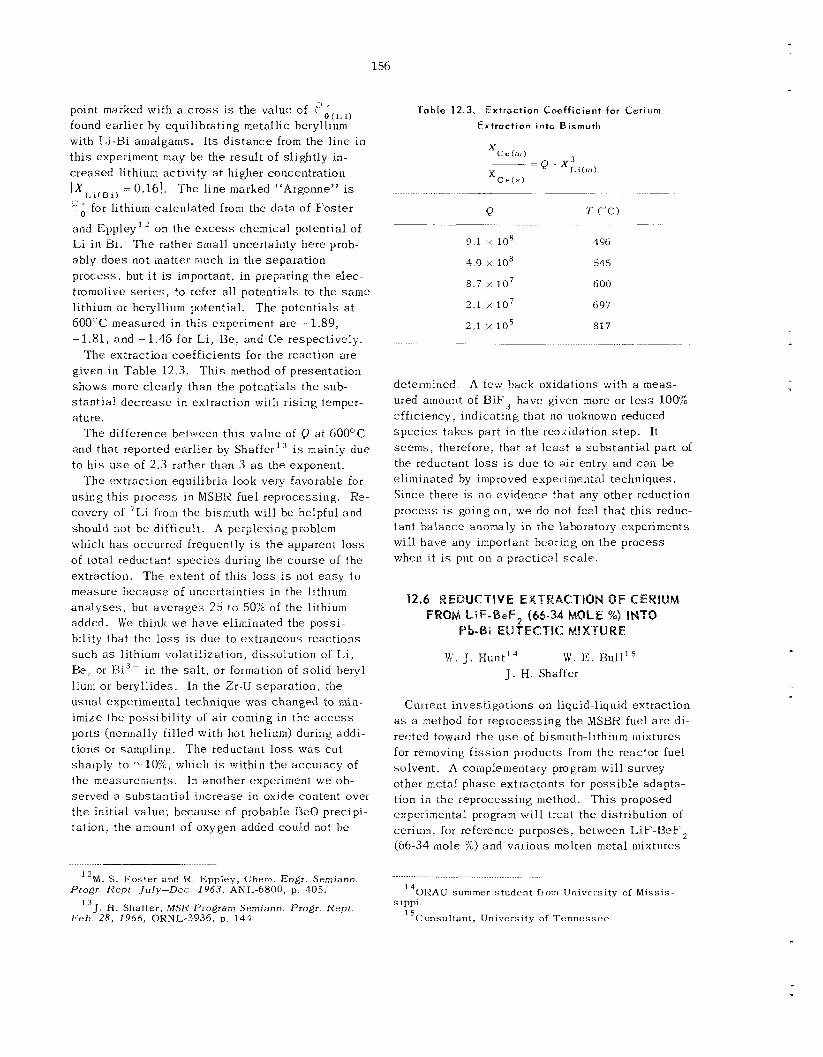
156
point marked with a c r o s s i s the value of 2 ’ found earlier by equilibrating metallic beryllium with Si-Bi amalgams. I t s d i s t ance from the l ine in th i s experiment may be the result of sl ightly in- creased lithium activity a t higher coiicentration ‘ X L i ( B i ) - 0.161. The l ine marked “Argonne” is
f o r lithium ca lcu la ted from the da ta of Fos t e r
and Eppley ’ on the e x c e s s chemical potential of Li in Bi. The rather small uncertainty here prob- ably does not matter much in the separation process , but i t is important, in preparing the elec- tromotive se r i e s , to r e f e r al l potentials to the same lithium or beryllium potential. The potentials a t 600°C measured in th i s experiment a re .. 1.89, -1.81, and -1.46 for L i , Be, and C e respectively.
The extraction coefficients for the reaction are given i n Table 12.3. T h i s method of presentation shows more clearly than the potentials the sub- s t an t i a l decrease in extraction with rising temper- ature.
The difference between th is value of Q a t 600°C and that reported earlier by Shaffer13 i s mainly due to h is u s e of 2.3 rather than 3 a s the exponent.
T h e extraction equilibria look very favorable for us ing th i s process in MSX-1II fuel reprocessing. Re- covery of 7L i froni the bismuth will be helpful and should not b e difficult. which has occurred frequently is the apparent loss of total reductant s p e c i e s during the course of the extraction. The extent of th i s l o s s i s not ea sy to measure because of uncertainties in the lithium ana lyses , but averages 25 t o 50% of the lithium added. We think we have eliminated the poss i - bility that the lo s s is due to extraneous reactions such as lithium volati l ization, dissolution of L i , Re, or Ei3- i n the sa l t , or formation of solid beryl- lium or beryll ides. In the Zr-U separation, the usua l experiniental technique was changed to min- imize the possibil i ty of air coming in the access ports (normally filled with hot helium) during addi- t ions or sampling. The reductant l o s s was cu t sharply to -,10%, which is within the accuracy of the measurements. In another expeiiment w e ob- served a substantial increase in oxide content over t he initial value; because of probable BeQ precipi- tation, the amount of oxygen added could not be
O ( 1 - i )
A peiplexing problem
.~ .......... ~..
M. S , Foster and R. Eppley. Chnm Engr Serniann 1 2
Progr. R e p i July-Dec 1963, A N L 6 8 0 0 , p. 405.. 13 J. H. Shaffer, MSIi Program Semrann Progr. liept
F e b 28, 1966, OKNL-3936, p. 144.
Table 12.3. Extraction Coef f ic ient for Cerium
Ext rac t ion into B i s m u t h
X C e ( r n )
xce(s)
- Q X;.i(rn)
~-
0 T ( - c )
9 1 x 10⁸ 496
4 0 Y 108 545
8 7 x l o 7 600
2.1 x 10⁷ 697
2.1 x 10⁵ 817
determined. A few back oxidations with a meas- ured aiiiount of B i F J have given more or l e s s 100% efficiency, indicating that no unknown reduced s p e c i e s takes part in t he reoxidation s t ep . It s eems , therefore, that a t l ea s t a subs tan t ia l part of the reductant l o s s i s due to air entry and can be eliminated by improved experimental techniques. Since there is no evidence that any other reduction process is going on, we do not feel that th i s reduc- tan t ba lance anomaly in the laboratory experiments will have any important bearing on t h e process when i t i s put on a practical s c a l e .
UCTlVE EXTRACTION OF CEWaUM FROM LiF-BeF, (66-34 MOLE %) INTO
W. J. ~ ~ u n t ’ ~ w . E Hull’
Pb-Si EUTECTIC MlXTblRE
J . H . Shaffer
Current investigations on liquid-liquid extraction a s a method for reprocessing the MSBR fluel a r e di- rected toward the u s e of bismuth-lithium iiiixtures for renioving f i ss ion products froni the reactor fuel solvent. A complementary program will survey other metal phase ex t rac tan ts for poss ib le adapta- tion i n the reprocess ing iilethod. experimental program will treat t he distribution of cerium, for reference purposes, between I,iF-BeF2 (66-34 mole %) and var ious molten metal mixtures
Th i s proposed
1 4 ORAU summer student f rom University of Missis-
Consultant, University of Tennessee . sippi.
1 5
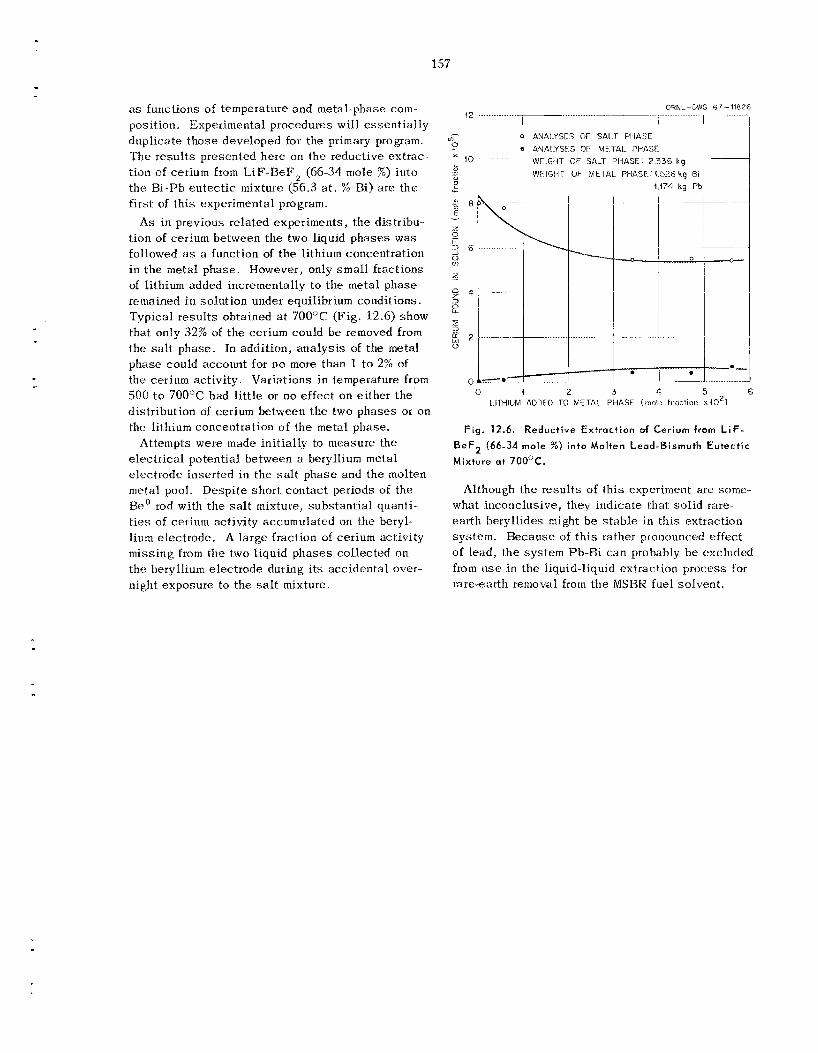
157
as functions of temperature and metal-phase com- posit ion. Experimental procedures will e s sen t i a l ly duplicate t h o s e developed for the primary program. 'The r e su l t s presented here on the reductive extrac- tion of cerium from LiF-BeF, (66-34 mole %) in to the Bi-Pb eu tec t i c mixture (56.3 a t . % S i ) a r e t h e first of th i s experimental program.
As i n previous related experiments, the distribu- t ion of cerium between the two liquid phases was followed as a function of the lithium concentration i n t h e metal phase . However, only sma l l fractions of lithium added incrementally to the metal phase remained in so lu t ion under equilibrium conditions. Typica l resu l t s obtained a t 700°C (Fig. 12.6) show that only 32% of the cerium could be removed from the s a l t phase . In addition, ana lys i s of the m e t a l phase could account for no more than 1 to 2% of the cerium activity. Variations i n temperature from 500 to 7 0 0 T had little or no e f fec t on either t he distribution of cerium between t h e two phases or on the lithium concentration of the metal phase .
Attempts were made init ially to measure the e lec t r ica l potential between a beryllium metal e lec t rode inserted in t h e s a l t phase and the molten metal pool. Despi te sho r t contac t periods of the Beo rod with t h e s a l t mixture, subs tan t ia l quant i - ties of cerium activity accumulated on the beryl- lium electrode. A l a rge fraction of cerium activity inissing from the two liquid phases co l lec ted on the bery Ilium electrode during i t s acc identa l over- night exposure to the salt mixture.
O R N L - W G G7-11826
0 ANALYSES OF SAL1- PHASE 0 ANAlYSES 01: MFTAL PHASE
WEiGHT OF SALT PHASE: 2.336 k g __ WEIGHT OF biETAL PHASF: 1.57.6 kg Bi
t i 7 1 kg Pb
r r e _ L -4- .......______.._ I .... . . . . .I
Fig. 12.6. Reduct ive Extract ion of Cerium from LiF- BeFZ (66-34 m o l e %) into Molten Lead-Bismuth Eutectic Mixture a t 7OO0C.
Although the r e s u l t s of th i s experiment are some- what inconclusive, they indicate t h a t so l id rare- ear th beryll ides might b e s t ab le i n th i s extraction sys tem. Because of t h i s rather pronounced effect of lead, the system Ph-Ki c a n probably b e excluded from u s e in the liquid-liquid extraction process for rare-earth removal from the MSBR fuel solvent.
13. FB u orate
13.1 PHASE RELATIONS IN FLUORQBORATE SYSTEMS
C. J . Barton L. 0. Gilpatrick H. Insley' T. N. McVay2
J . A. Bornrriann'
H. H. Stone
Interest in low-melting, low-cost molten s a l t s for u s e as the coolant in molten-salt breeder reactors h a s prompted reexamination of phase rela- t ions in fluoroborate systeins . T h e sys tem NaBF4- K S F , w a s s tudied earlier a t t h i s Laboratory, while Selivanov and Stender, reported low-melting eu tec t ics i n the sys tems NaF-NaBF, and KF- KHF, . More recentiy, Pawlenko' invest igated the ternary sys tem KUF,-KF-KBF,OH and its as- sociated binary systems. Varying melting points reported in the l i terature for t h e compounds NaBF, and KWF, indicated the need for pure compounds and care in heat ing them to prevent hydrolysis or
We found that recrystallization of commercial preparations of NaBF, and KBF, f rom di lute hydrofluoric acid solut ions, usual ly 0.5 hi', gave compounds with higher melting points than any previoiusly reported. We find 569'C for KEF, (previous high, 552O)' and 406°C for NaBF, (previous high, 368"). ana lys i s (DTA)6 melting curve for KBF, w a s much
loss of BF3.
T h e differential thermal
'Research participant from Lindenwood College, St.
2Consul tan t. ,R. E. Moore, J. G. Surak, and U'. I<. Grimes, P h a s e
Charles, hlo.
Diagrams of Nuclear Reactor Materzals, R. E. Thoma (ed.), ORNL-2548, p. 25 (Nov. 6, 1959).
,V. G. Selivunov and V. V. Stender, J . Inorg. Chen., U S S R , I I I(2), 447-49 (1958).
' S . Pawlenko, 2. Anorg . Allgenz. Chem. 336, 172-78
6L. 0. Gilpatrick, R. E. Thoma, and S . Cantor, Reactoz (1965).
Chem. Div. Ann. Progr. Rept. D e c . 3 1 , 1366, ORNL- 4076, pp. 5-6.
sharper than that of NaRF,; t h i s probably ind ica tes higher purity of the potassium compound, but repeated crystal l izat ions of NaBF, from di lute H F solut ions failed to give a preparation having a melting point above 406O. We are consider ing alternative methods of purifying t h i s compound.
tion of phase relat ions in fluoroborate sys t ems were DTA6 and quench ing7 By u s e of t h e s e techniqu2s we have examined t h e binary sys t ems NaF-NaBF, and KF-KBF, as wel l as t h e compound joins NaBF,-KBF, and NaF-KRF, i n t h e ternary system NaF-KF-BF 3. Diagrams for t h e s e sys t ems are presented i n Figs. 13.1 t o 13.4. NaRF ,-KBF, a r e s imple eu tec t ic sys tems, although a small thermal effect at 435OC i n KEF,-rich NaF- K B F , mixtures suggests that t h e composi t ions used were sl ightly off t h e compound join and that a small amount of NaF-KF-KBF, eu tec t ic liquid w a s formed. Large thermal effects due to t h e KBF, phase transit ion (283 + 2OC) and t h e NaBF, transit ion (243 i 2OC) were noted in the DTA curves. Efforts t o retain the high-temperature forms of the pure compounds arid their mixtures with N a F or K F by rapid quenching were unsuccessful .
'The phase diagram for the NaF-NaRF', systeiil (Fig. 13.1) indica tes that the previously reported da ta on t h i s sys tem4 showing a eu tec t ic melting at 304°C and containing 37.5 w l % Na13F4 is grossly i n error. T h e most recently reported work5 on the KF-KBF, sys tem agrees with our d a t a (Fig. 13.2) on the location of t h e eu tec t ic composition, but w e found that the eu tec t ic temperature w a s 1 4 O higher than reported. pounds K F ~ KBF, and K F .2KHF, reported' in t h i s system. T h e system NaF-KBF, (Fig. 13.3) h a s apparently not been s tudied by other investigators. The diagram for the Na13F4-KBF, sys tem (Fig. 13.4)
(1958).
T h e principal techniques used in t h e investiga-
All except
We found no evidence of t h e com-
.-
7C. J. Barton e t al., J . Am. Cerern. S O ~ . 41(2), 6 3
158
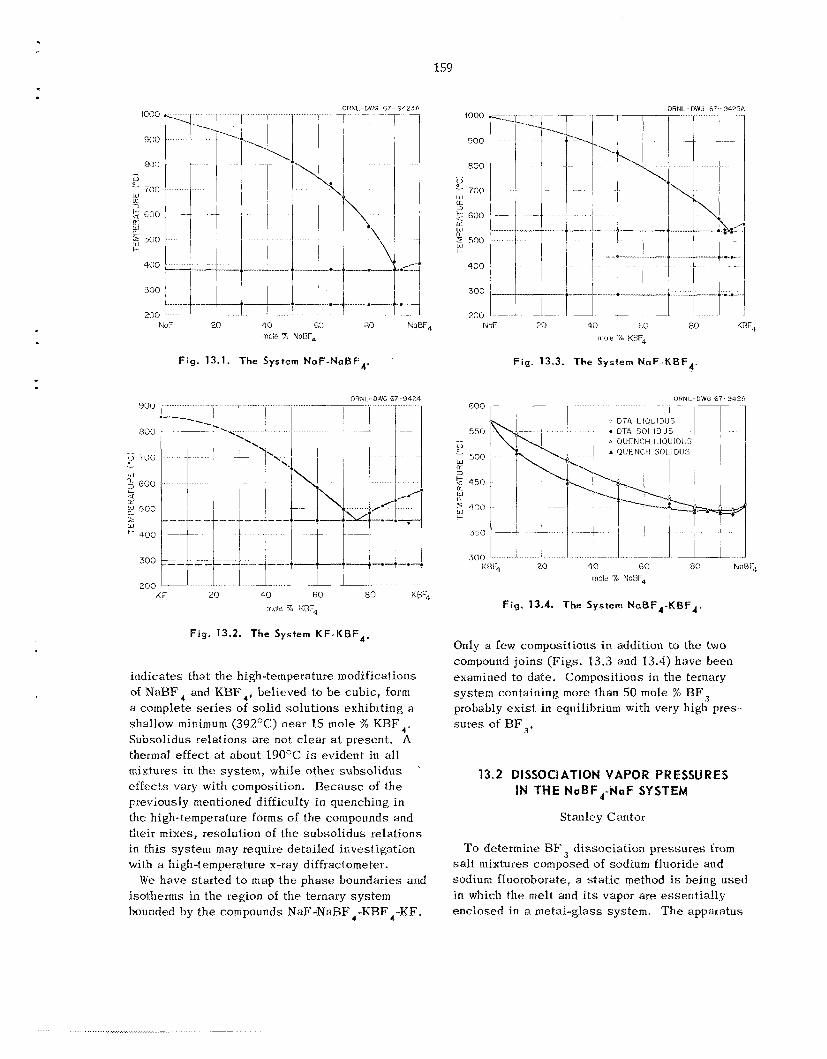
I000
900
800
0
?- ii:0
$ 600 W 2: 3
CT L I I n. 500
t
400
500
?00 N& M 40 M, Ex2 N'3BF,*
mole 9h NaBF,
F i g . 13.1. The System NaF-NaBF4. '
GRNI: DNG 67-3474
indicates that the high-temperature modifications of NaHF, and KBF,, believed to be cubic , form a complete series of sol id solut ions exhibit ing a shallow minimum (392OC) near 15 mole % KBE,. Subsolidus relat ions are not clear at present. A thermal effect at about 190°C is evident in all mixtures in the s y s t e m , while other subsol idus effects vary with composition. Because of the previously mentioned difficulty in quenching in the high-temperature f o r m s of the compounds and their mixes, resolution of the subsol idus relat ions in this system may require detai led invest igat ion with a high-temperature x-ray dtffractometer.
isotherms in the legion of the ternary system bounded by t h e compounds NaF-NaBF 4-KBF,-KF.
~
W e have s tar ted to map the phase boundaries and
1000
900
800 - u 7G0
w % 2 600 n!
=" 500 W a
l i l 1.-
400
F i g . 13.4. The System NaBF4-KBF4
Only a few compositions in addition to the two compound joins (Figs. 13.3 and 13.4) have been examined to date. Compositions in the ternary system containing more than 50 mole % BF, probably e x i s t in equilibrium with very high pres-. s u r e s of OF,.
13.2 DlSSOClATlQN VAPOR PRESSURES IN THE NoBF,-NcIF SYSTEM
Stanley Cantot
To determine BF dissociat ion pressures from salt mixtures composed of sodium fluoride and sodium fluoroborate, a s t a t i c method is being used in which the me l t atid i t s vapor are essent ia l ly enclosed in a metal-glass system. T h e apparatus
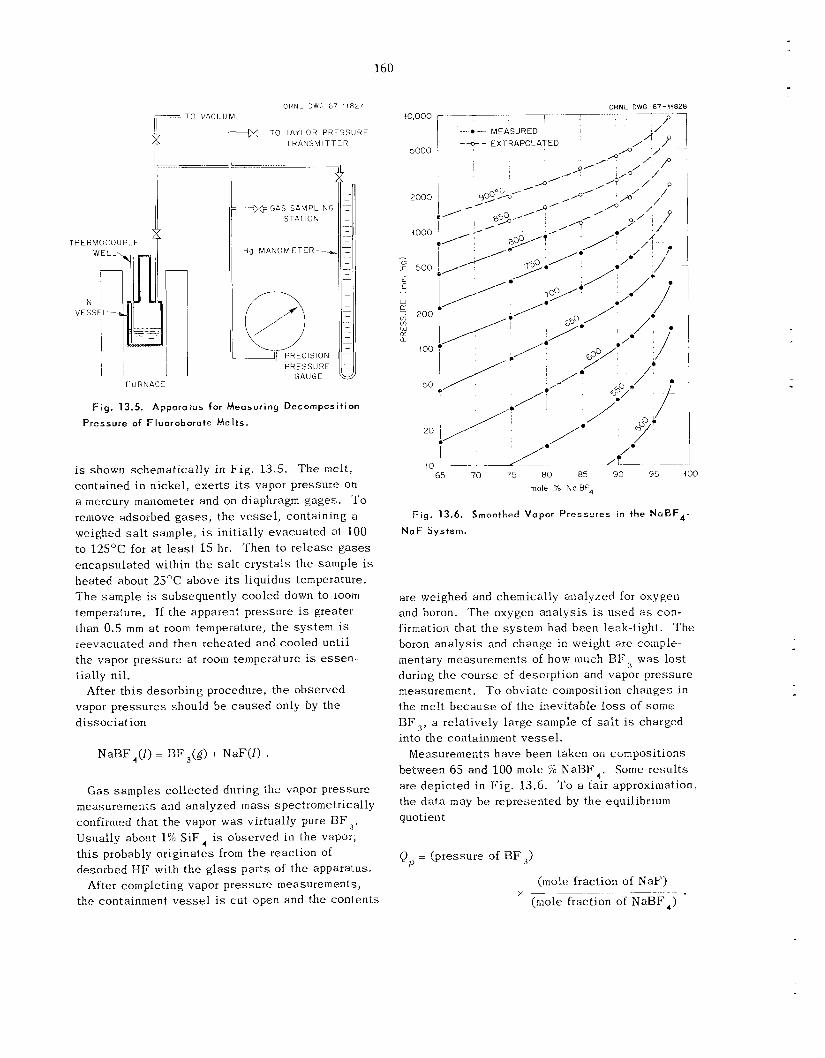
160
O R N L - D W G 67-1f827 I TO VACUUM
THERMOCOUPI-F
e TO TAYLOR PRESSURE TRANSMITTER
*GAS SAMPLING STPT IO ‘\i
PRESSURE GAUGE k&
FURNACE
Fig. 13.5. Appnratus for Measuring Decomposition
Pressure of Fluoroborate Melts.
is shown schematically in Fig. 13.5. contained in nickel, exer t s i t s vapor pressure on a mercury manometer and on diaphragm gages. To remove adsorbed gases , the ves se l , containing a weighed s a l t sample, i s init ially evacuated at 100 to 125°C for a t l e a s t 15 hr. Then to re lease gases encapsulated within the s a l t c rys t a l s the sample is heated about 25OC above i t s l iquidus temperature. T h e sample is subsequently cooled down to room temperature. If t he apparent pressure i s greater than 0.5 m m a t room temperature, t he sys tem i s reevacuated and then reheated and cooled until the vapor pressure a t room temperature is e s s e n - t ially nil.
After t h i s desorbing procedure, t he observed vapor pressures should be caused only by the dissociation
The mclt,
NaRF,(2) = BF,(g) + NaF(2) .
G a s samples collected during the vapor pressure measurements and analyzed m a s s spectrometrically confirmed that the vapor was virtually pure BF,. Usually about 1% SiF , is observed in the vapor, t h i s probably originates from t h e reaction of desorbed K F with the g l a s s par t s of the apparatus.
After completing vapor pressure measurements, the containment v e s s e l is c u t open and the contents
ORNL DWG 67-41828
7 - 1 - ‘OrOOO r -e- FAEASURED
65 70 75 80 85 30 95 100 mole % Na BF4
Fig. 13.6. Smoothed Vapor Pressures in the N o 5 F 4 - NaF System.
are weighed and chemically analyzed for oxygen and boron. T h e oxygen ana lys i s i s used a s con- firmation that t h e sys tem had been leak-tight. ‘The boron ana lys i s and change in weight are comple- mentary measurements of how much BE’, was lost during the course of desorption and vapor pressure measurement. To obviate coinposition changes i n t h e melt because of the inevitable loss of some BF,, a relatively large sample of s a l t is charged into the containment ves se l .
Measurements have been taken on compositions between 65 and 100 m o l e % NaRF4 . Some resu l t s are depicted in F ig . 13.6. To a fair approximation, the da t a may be represented by the equilibrium quotient
Q = (pressure of BF,) P
(molc fraction of NaF) (mole fraction of NaBF,)
x - - ~
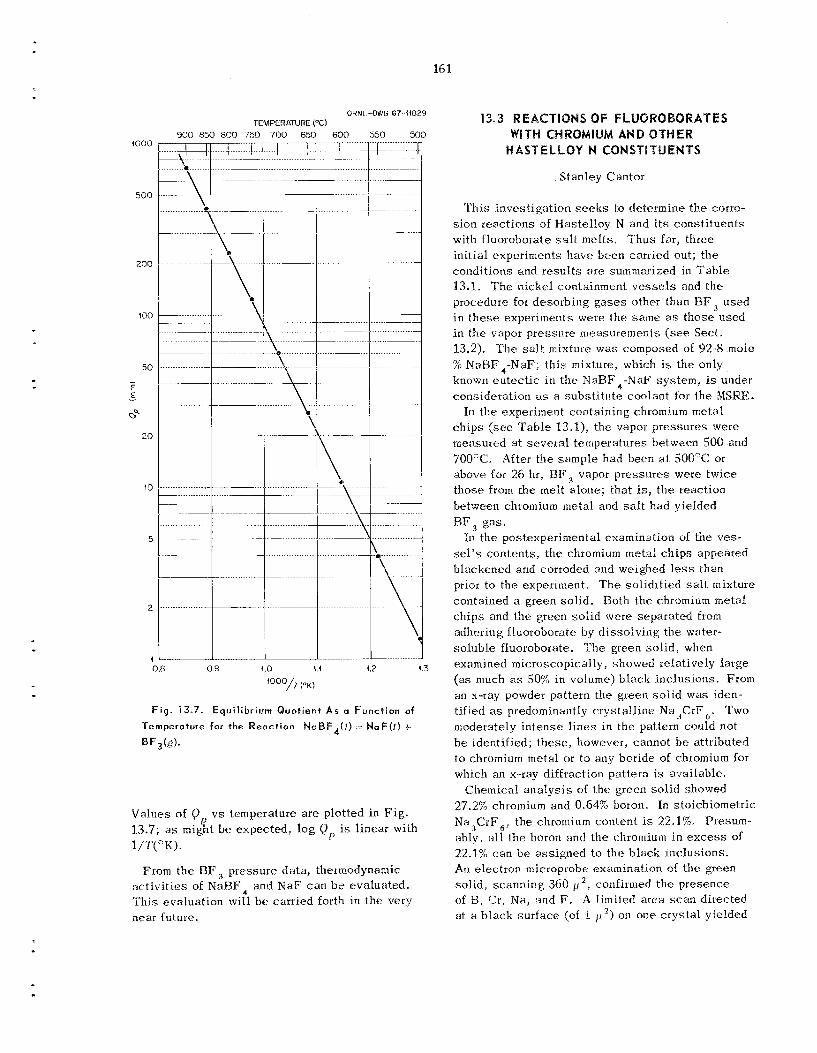
16 1
G R N l -D’W 67-11829 TEMPERATURE (“C)
1000
500
200
200
SO - E E .. 0“
10
5
2
I
OR 09 40 t i 12 13
‘QOO/T (Ok)
Fig. 13.7. Equilibrium Quotlsnt A s a Function of Temperature for the React ion NcrBF,if) - NaF(1) + BF@.
Values of Q 13.7; a s might b e expected, log Q
v s temperature a r e plotted i n Fig. P
is linear with P
1/ 7‘( i‘ K).
From the BF pressure da ta , thermodynamic ac t iv i t ies of NaRF, and N a F c a n b e evaluated. This evaluation will b e carried forth in the very near future.
Stanley Cantor
This investigation seeks 1.0 determine t h e corro- s ion reac t ions of Wastelloy N and i t s cons t i tuents with fluoroborate salt melts, Thus far, three initial experimen4.s have been carried out; t h e conditions and resu l t s a r e summarized in Tab le 1.3.1. The nickel containment v e s s e l s and the procedure for desorbing gases other than B Y 3 used in these experiments were the saiiie a s those used in the vapor pressure measu remen t s (see Sect. 13.2). The s a l t mixture was composed of 92-8 mole % NaBF4-NaF; th i s mixture, which is the only know11 eutectic i n the NaBF,-NaF sys tem, is under consideration as a subs t i tu te coolant for the MSRE.
In t h e experiineist containing chromium metal ch ips (see Tab le 13.1), the vapor pressures were measured at seve ra l temperatures between 500 and 7QOOC. After t he sample had been af. 500°C or above for 26 h r , EF, vapor pressures were twice those from the melt alone; that is, t h e reaction between chromium metal and salt hiad yielded BF, gas .
In the postexperimental examination of the ves- sel’s contents, t he chromium metal ch ips appeared blackened and corroded and weighed less than prior to the experiment. ‘The solidified salt mixture contained a green solid. Both t h e chromium metal ch ips and the green so l id were separa ted f rom adhering fluorobotate by dissolving; t he water- soluble Eluoroborate. T h e green so l id , when examined microscopically, showed relatively large (as much as 50% in volume) black inclusioris. F r o m an x-ray powder pattern t h e green so l id was iden- tified as predominantly c rys ta l l ine Na,CrF,. Two moderately in t ense l i nes in the pattern could not be identified; these , however, cannot b e attributed to chromium metal or lo any boride of chromium for which an x-ray diffraction pattern is available.
Chemical ana lys i s of the green so l id showed 27.2% chromium and 0.64% boron. In stoichiometric Na,3CrF,, the chromium content is 22.1%. Presum- ably, a11 the boron and the chromium in e x c e s s of 22.1% can be ass igned to thc: black inclusions. An electron microprobe examination of the green solid, scanning 360 I,’, confirmed t h e presence of H , Cr, Na, and F. A limited area s c a n directed at :i black sur face (of I ! L ’ ) on one crys ta l yielded
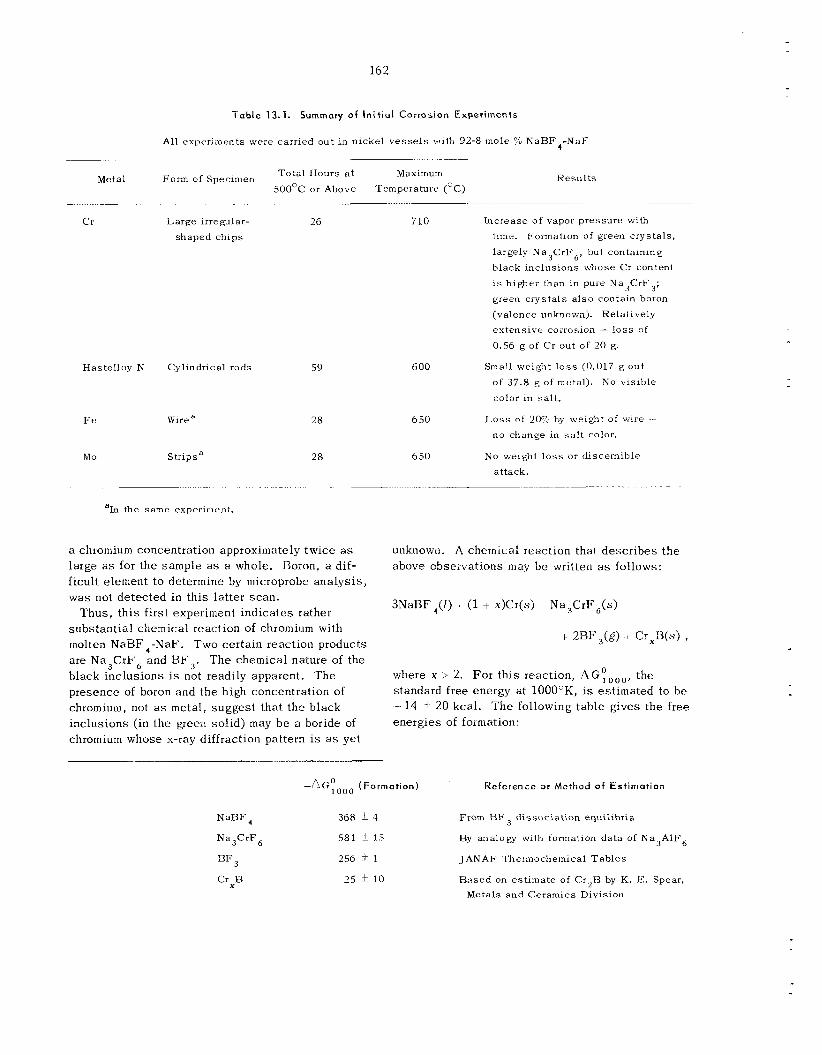
162
Metal
Cr
Hastelloy N
F e
Mo
Table 13.1. Summary o f In i t ia l Corrosion Experiments
All experiments were carried out in nickel v e s s e l s wit? 92-8 mole Yo NaHF,-NaF ~
Form of Specimen
-
Large i r regdar- shaped chips
Cylindrical rods
\virea
s t r ip s a
~
the same experiment.
Total Hours a t Maximum 500°C o r Above Temperature ( O C )
-
Resul ts
26
59
28
28
710 Increase of vapor pressure with time. Formation o f gieen crys ta l s , largely Na CrF,, but containing black inclusions whose Cr content is higher than in pure Na3CrF3; green crystals a lso contain boron (valence unknown). Relatively extensive corrosion - l o s s of 0.56 g of Cr out of 20 g.
3
600 Small weight l o s s (0.017 g o u t of 37.8 g of metal). No visible color i n salt .
6 SO L o s s of 20% by weight of wire .- no change in s a l t color.
650 No weight loss or discernible attack.
a chromium concentration approximately twice as large as for the sample as a whole. Boron, a dif- ficult element t o determine by microprobe ana lys i s , was not detected in th i s latter scan .
Thus , t h i s f irst experiment ind ica tes rather subs tan t ia l chemical reaction of chromium with molten NaBF,-NaF. Two certain reaction products are Na3CrF, and BF,. T h e chemical nature of the black inc lus ions i s not readily apparent. T h e presence of boron and t h e high concentration of chromium, not as metal, sugges t that t he black inclusions (in the green so l id) may b e a boride of chromium whose x-ray diffraction pattern is as yet
unknown. A chemical reaction that descr ibes the above observations may b e written a s follows:
3NaBF4(1) - (1 + x)Cr(s) ~ Na,CrF,(s)
i 2BF,(g) * CrxB(s) ,
where x > 2. For th i s reaction, A G ~ , , , , the standard free energy a t 1000°K, is estimated to h e -14 5 20 kcal. T h e following tab le gives the free energ ies of formation:
- - A C , ~ , , ~ ~ (Formation) Reference or Method o f Estimation
NaBF,
Na3CrF6
BF 3
CrxB
368 * 4 From RF dissociation equilibria
581 f 15
256 + 1
By analogy with formation data of Na3AIF,
JANAF Thermochemical Tab le s
Based on estimate of CrZD by K. E. Spear, 25 * 10 Metals and Ceramics Division

The two other experiments, one with Ilastelloy N and the other with iron and molybdenum, were not monitored for vapor pressure. After desorbing the gaseous impurii ies from the sample charge (metal plus salt) , t he v e s s e l s weie brought t o t h e tempera- tures shown in Tab le 13.1 and were kept there for the indicated time. After completing t h e s e two experiments t he samples were examined; very l i t t l e or no v is ib le a t tack was apparent on the metal specimens. Also, there were no v is ib le color changes in the salt mixtures. However, the weight l o s ses i n the Iiastelloy and in the iron specimens (see Tab le 13.1) sugges t t he need for more thorough investigation of the corrosion read ions of chromium and iron with fluoroborate s a l t m e l t s .
Apparent Mass Transfer cif Nickel
Afier completing vapor pressure measurements on each fluoroborate mixture, the n icke l v e s s e l s are always cu t open for exarninatiori oE the con- tents. In almost every case, the top sur face of the solidified salt conta ins a smal l amount of black material. In all cases the inner metal sur faces iue shiny. T h e top portions of two s a l t c a k e s (one 97.5-2.5 mole %, the other 65-35 mole % NaBF4- Nap) when d isso lved in water yielded silvery res idues , T h e s e residues were ferromagnetic, and, by x-ray diffraction, were identified a s nickel rneial.
T h e reason that nickel metal par t ic les appeared on the m e l t i s not readily evident. It is unlikely that metal particles were present in the vesse l prior to loading with s a l t , nor is i t likely that the s tock s a l t s contained nickel metal. The luster of the walls jn contact with s a l t sugges t s that nickel inay have been mass transferred. Further investiga- tion should provide additional information on th i s unexpected deposit ion of nickel metal on the salt.
13.4 REACTION OF BF, WITH CHROMIUM METAL A T 650°C
J. Is. Shaffer I-I. F. Mclh f f i e
Current platis to replace the secondary coolant of the MSRE with a fluoroborate mixture have prompted s tud ie s of the compatibility of these materials with structural metals of the reactor system. program exert measurable vapor pressure of B F , a t operating temperatures, covering atmospheres
Since lluoroborates of in te res t to t h i s
163
containing equivalent concentrations of BF’,3 must be maintained in the free volume of the pump bowl of dynamic sys tems o r used for gas sparge opera- tions. T h i s experimental program will examine the reac t ions of BF3 with various structural metals and a l loys that might b e applicable to the program. Preliminary resu l t s obtained by contacting BF3 with chromium metal at 650°C are presented here.
The experimental method u t i l i zes a 30-in. length of 2-in. IPS nickel pipe, mounted horizontally in a 341. tube furnace, as the reaction chamber. The reacting gases are admitted through a penetration i n the end plate tha t is welded tu one end of the nickel pipe. A sheathed thermocouple also pene- trated the end p la te and extended into the central region of the hea t zone. The other end of the teac- tion chamber, which ex tends sotile 10 in. out of the tube furnace, is c losed by Teflon in a threaded pipe cap. The gas manifold system provides for the introduction of helium, BF gases at known flow ra tes into the reaction chamber. The sys tem is sea led from the atmosphere by bubbling the gas effluent through a fluorocarbon oil. Concentrations of H F , in helium can be determined continuously from the recorded s igna l of a calibrated thermal conductivity cell. Metal samples o r spec i - mens are carried in nickel boa ts inserted through the threaded a c c e s s port.
The reaction of BF, with chromium metal w a s followed by periodic determination of weight gain of about 10.88 g of prepared chromium f lakes during a 6 0 h r reaction period ai 650°C. T h e chromium metal was prepared by electrolytic deposi- tion on a copper shee t which was subsequent ly d is - solved by an acid leach. The thiti film of chromium metal which remained was broken in to small f lakes for t h i s investigation. React ion periods commenced by introducing WF3 a t 1 to 2 cc/min after heating the sample to 650°C in flowing helium, The sample was also cooled to room temperature under flowing helium to permit inspection and weight gain deter- minations.
A s shown by Fig. 13.8, the weight gain of the chromium sample showed a lineiir dependence on the square root of reaction time. T h e overall reac- tion period showed that the chromium sample in- c reased its weight by about 4%; there was no significant difference in the weight o r appearance of the nickel boat during thi:; experiment. Examina- tion by x-ray diffraction techniques showed that the chromium sample contained subs tan t ia l qunntit ies of C r 2 0 3 ; minor fractions of the mixed fluoride,
or mixtures of these ?’
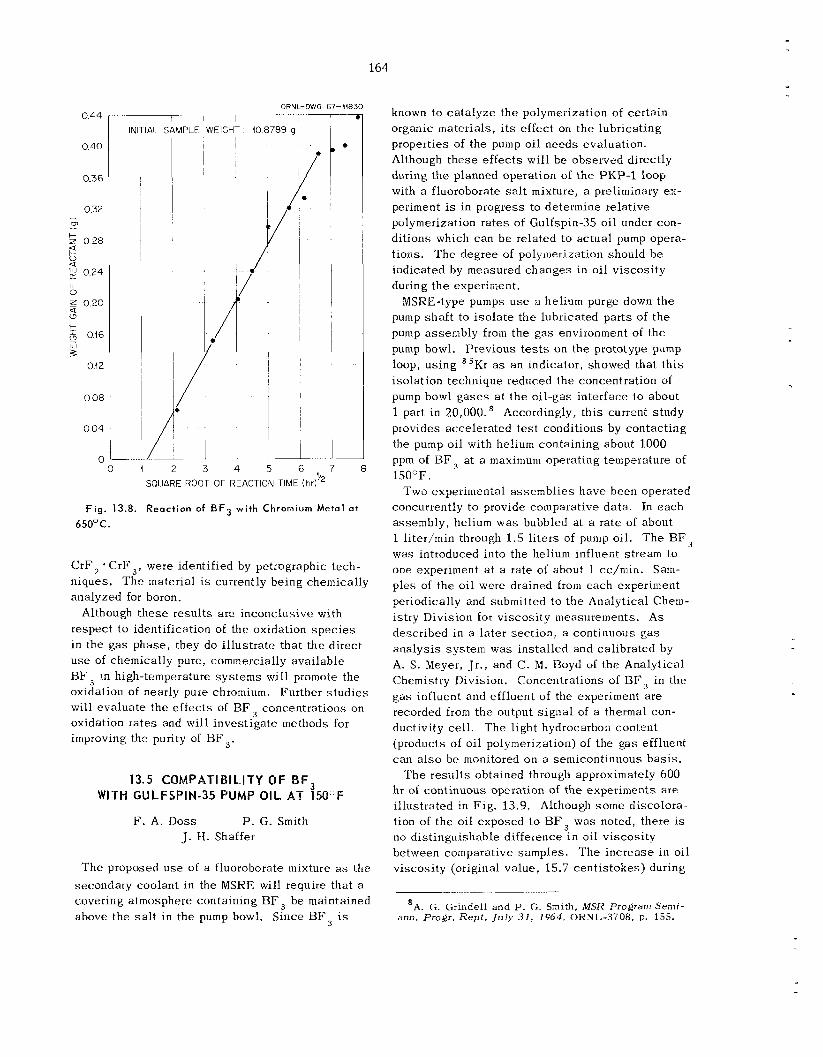
164
0.44
0.40
0.36
0.32 - 0 .- + z 0.28
a 2 0
0.24 L L 0
z 0.20 a a +
0.16 W 3
0.4 2
0.08
0.04
n
ORNL-DWG 67-31830
- 1 I r- ---T
INlTlAl SAMPI F WEIGHT io8789 g I
I / I A'
- 0 4 2 3 4 5 6 7
SQUARE ROOT OF REACTION TIME ( h r ? 8
F i g . 13.8. React ion of BF3 wi th Chromium Metol a t
650°C.
CrF , * CrF,, were identified by petrographic tech- niques. T h e material i s currently being chemically analyzed for boron.
Although these resu l t s a r e inconclusive with respect t o identification of the oxidation s p e c i e s in the g a s phase , they do i l lus t ra te that t he direct u se of chemically pure, commercially available HF3 i n high-temperature sys t ems will promote the oxidation of nearly pure chromium. Further s tud ie s will eva lua te the effects of 3F3 concentrations on oxidation ra tes and will inves t iga te methods for improving the purity of BF3.
13.5 COMPATlBlLlTY OF BF, WITH GULFSPIN-35 PUMP OIL AT 150°F
F. A. Doss P. G. Smith J. €1. Shaffer
T h e proposed use of a fluoroborate mixture as the
b e maintained secondary coolant i n the MSRE will require that a covering atmosphere containing BF above the s a l t i n the pump bowl. S ince 3F3 is
known to ca ta lyze t h e polymerization of certain organic materials, i t s effect on t h e lubricating properties of the pump oil needs evaluation. Although these e f fec ts will be observed directly during t h e planned operation of t h e PKP-1 loop with a fluoroborate salt mixture, a pieliminary ex- periment is in progress to determine relative polymerization r a t e s of Gulfspin-35 oil under con- dit ions which can b e related to actual pump opera- t ions. T h e degree of polymerization should b e indicated by measured changes in oil viscosity during the experiment.
pump sha f t to i so l a t e t h e luhricated par t s of the pump assembly from the g a s environment of t h e pump bowl. Previous t e s t s on the prototype pump loop, us ing 85Kr as an indicator, showed that t h i s isolation technique reduced the concentration of pump bowl g a s e s a t t h e oil-gas interface to about 1 part i n 20,000.* Accordingly, th i s current s tudy provides accelerated t e s t conditions by contacting the pump oil with helium containing about 1000 ppm of BF3 a t a maximum operating temperature of 150OF.
Two experimental assembl ies have been operated concurrently to provide comparative data. In each assembly, helium was bubbled at a rate of about 1 liter/min through 1.5 l i t e rs of pimp oil. T h e BF, was introduced into the helium influent stream to one experiment at a rate of about 1 cc/min. Sam- ples of the oil were drained from each experiment periodically and submitted to t h e Analytical Cheni- istry Division for viscosity measurements. As described in a la te r sec t ion , a continuous gas ana lys i s sys tem was installed and calibrated by A. S. Meyer, Jr., and C. M. Boyd of the Analytical Chemistry Division. Concentrations of BF, in the g a s influent and effluent of the experiment are recorded f r o m t h e output s igna l of a thermal con- ductivity ce l l . The light hydrocarbon content (pioducts of oil polymerization) of the g a s effluent can a l s o he monitored on a semicontinuous bas is .
T h e resu l t s obtained through approximately 600 hr of continuous operation of t h e experiments a re i l lustrated in Fig . 13.9. Although some discolora- tion of the oil exposed t o BF, was noted, there is no distinguishable difference i n oil viscosity between comparative samples. T h e inc rease in oil viscosity (original value, 15.7 cent i s tokes) during
MSRE-type pumps u s e a helium purge down the
'A. G. Grindell and P. G. Sml th , M S R Program Semi- ann. Propr. Rept . J u l y 31 , 1964, ORNL-3708, p. 155.
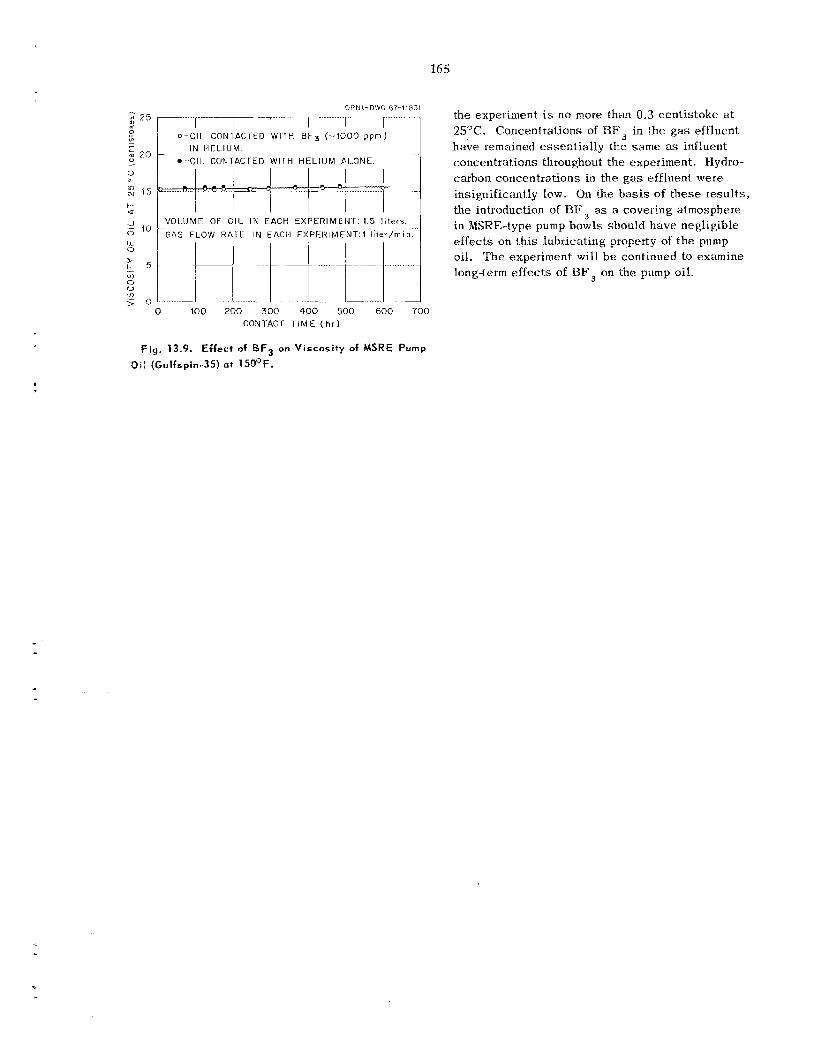
165
I I :>
-~ ............ +-.
a ...
VOl.lJMF: OF O I L I N E A C H E X P E R I M E N T : 1.5 l i ters. - G A S FLOW R A T E IN E A C I i EXF'EII1MENT:l l i te r / rn in .
OR N I_.- D'NG 67- 1 IO31 - ..... I T ~ - VI 25
0-OIL CONT'ACTED WITH Y F 3 ( - , IO00 ppm) IN HEL.IUM.
a -OIL CONTACTED W l - r H HELIUM ALONE.
I ',
0 100 200 300 400 500 600 7Q0 CONTACT T I M E ( h r )
Fig. 13.9. Effect of BF, on Viscosity of MSRE Pump
Oil (Gulfspin-35) at 15OoF.
the experiment is no more than 0.3 centistoke at 25OC. Concentrations of 13F3 in h e gas effluent have remained essent ia l ly the s a m e as influent concentrations throughout the experiment. IIydro- carbon concentrations in the g a s effluent were insignificantly low. On the basis of these resu l t s , the introduction of BF3 as a covering atmosphere in MSRE-type pump bowls should have negligible effects on th i s lubricating property of t h e pump oil. T h e experiment wil l be continued to examine long-term effects of BF3 on the pump oil.
. Development and E aluation of
for Molten-
J . C. White
T h e determination of oxide in highly radioactive MSRE fuel samples was continued. T h e replacement of the moisture-monitor ce l l was the first major maintenance performed s i n c e the oxide equipment was installed in the hot cell .
T h e U 3 + concentrations in the fuel samples r im to da t e by the transpiration technique do not reflect the beryllium additions which have been made to reduce the reactor fuel. T h i s may b e accounted for by a n interference stemming f r o m the radiolytic generation of fluorine in the fuel samples. T h i s problem will receive further investigation. Ex- perimental work is also being carried out to develop a method for t he remote measurement of ppm con- centrations of H F in helium or hydrogen gas streams.
Design work was continued on the experimental molten-salt t e s t loop which will be used to eva lua te electrometric, spectrophotometric, and transpiration methods for the ana lys i s of flowing molten-salt streams.
Controlled-potential voltammetric and chrono- potentiometric s tud ie s were carried out on the reduction of U(1V) in molten fluoride s a l t s us ing a new cyc l ic voltammeter. It w a s concluded that the IJ(IV) -+ U(II1) reduction in molten LiF-BeF,- ZrF, is a reversible one-electron process but that adsorption phenomena must h e taken into account for voltammetric measureriients a t f a s t s c a n ra tes or for chronopotentiometric measurements a t short transit ion t i m e s .
An investigation of the spectrum of U(V1) in molten fluoride s a l t s h a s been init iated. It was found that the spectrum of Na,UF8 d isso lved in LiF-BeF, in an SiO, ce l l with SiF, overpressure was identical to the spectrum of UO,F, d i sso lved under identical conditions. I t appears that the
equilibrium concentration of 0 ’- may b e sufficient to react with the components of the melt. An attempt t o u s e the Si0,-SiF, sys tem in the spec- trophotometric investigation of electrochemically generated s p e c i e s in molten fluorides also met with difficult ies. T h e S iF , overpressure interferes with cathodic voltammetric s tud ie s by caus ing very high cathodic currents.
facility with an extended optical path adjacent to a high-radiation-level hot ce l l t o permit t he observa- tion of absorption spec t r a of highly radioactive materials. T h e bas i c spectrophotometer and as- soc ia ted equipment have been ordered.
investigated. Measurements were made of increases in hydrocarbon concentrations of a n He-BF, g a s stream after contac t with the oil. A thermal con- ductivity detector was used to monitor the RF , concentration in t h e t e s t g a s stream.
Developinent s tud ie s a re being made on the design of a gas chromatograph to be used €or the continuous determination of sub-, low-, and high- ppm concentrations of permanent g a s iinpiirities and water in the helium blanket gas of t h e MSKE. Th i s problem of analyzing radioactive gas samples prompted the des ign and construction of an all- metal six-way pneumatically actuated diaphragm valve. A helium breakdown voltage detector with a g l a s s body was designed and constructed t o permit t h e observation of the helium discharge. Under optimum conditions th i s detector h a s ex- hibited a miniiiiuin de tec tab le limit below 1 ppb of impurity. It appears to be poss ib l e that the detector will also operate in the less -sens i t ive mode nec- e s sa ry for the determination of high-level con- centrations of impurities in the blanket gas.
It is planned to ins ta l l a spectrophotometric
The effects of BF, on MSRE pump oil have been
166
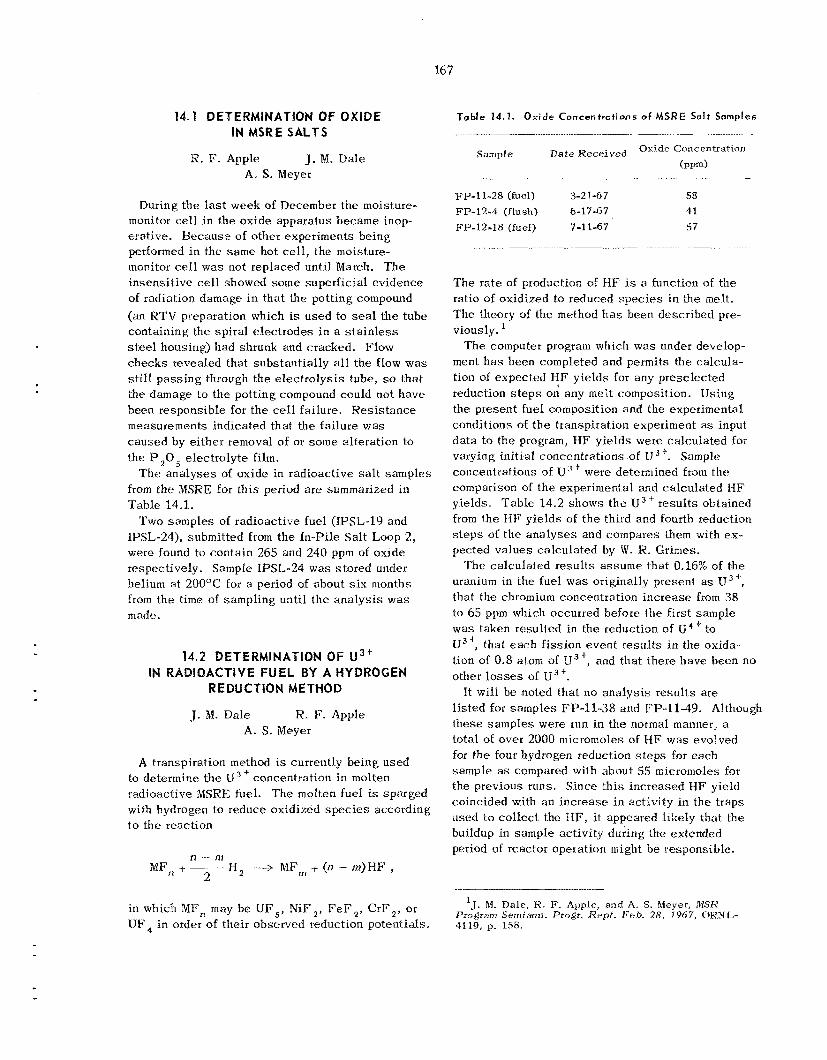
167
14.1 DETERMINAT1ON OF OXIDE IN MSRE SALTS
R. F. Apple J. M. Dale A. S . Meyer
During the last week of December the moisture- monitor cell in the oxide apparatus became inop- erative. Because of other experiments being performed in the s a m e hot cell, the moisture- monitor cell was not replaced until March. The insensi t ive ce l l showed sortie superf ic ia l evidence of radiation damage in that the potting compound (an KTV preparation which is used to seal the tube containing the sp i ra l e lec t rodes in a s t a i n l e s s steel housing) had shrunk and cracked. Flow checks revealed that substant ia l ly all the flow was s t i l l pass ing through the e lec t ro lys i s tube, so that the damage to the potting compound could not have been responsible for the cell failure. Res is tance measurements indicated that the failure w a s caused by ei ther removal of or some alteration to the P,05 electrolyte fi lm.
from the MSRE for this period a r e summarized in Table 14.1. Two samples of radioactive fuel (IPSL-19 and
IPSL-24), submitted from the In-Pile Sa l t Loop 2, were found to contain 265 and 240 ppm of oxide respectively. Sample IPSL-24 w a s s tored under helium a t 200°C for a period of about s i x mont.hs from the time of sampling unt i l the ana lys i s was made.
T h e ana lyses of oxide in radioactive salt samples
14.2 DETERMINATION OF U3' IN RADIOACTlVE FUEL BY A HYDROGEN
REDUCTION METHOD
J. RI. Dale R. F. Apple A. S. Meyer
A transpiration method is currently being used to determine thc 0 + concentration in molten radioactive MSRE fuel. The molten fuel is sparged with hydrogen to reduce oxidized species according to fie reaction
n in MFrl + --
2 - H, -+ MF, + (n - RZ)IIF ,
Table 14.1. O x i d e Concentrations of M S R E Salt Somples
Dattt Received Oxide Concentration Sample ( P P d
FP-11-28 (fuel) 3-2 1-67 58 FP-12-4 (flush) 6-17-57 11
FP-12-18 (fuel) 7-1 1-67 57
T h e rate of production of H F is a function of the ratio of oxidized to reduced s p e c i e s in the melt. The theory of the method h a s been descr ibed pre- viously.
T h e computer program which was under develop- ment has been completed and permits the calcula- tion of expected IIF yields for any preselected reduction s t e p s on any melt composition. Using the present fuel composition and the experimental conditions of t h e transpirat ion experiment as input data to the program, €IF yie lds were calculated for varying ini t ia l concentrations of 1J3 '. Sample concentrations of U3' were determined from the comparison of the experimental and calculated WF yields. Tab le 14.2 shows t h e U 3 + resu l t s obtained from the [ I F ' yie lds of t h e third and fourth reduction s t e p s of t h e ana lyses and compares them with ex- pected values calculated by W. R . Grimes.
T h e calculated resu l t s a s sume tha t 0.16% of the uranium in the fuel was origiiially present as U 3 ', that the chromium concentration increase from 38 to 65 ppm which occurred before the f i r s t sample was taken resulted in the reduction of U4' to U 3 ', that e a c h f iss ion event resul ts in the oxida- tion of 0.8 atom of U3', and that there have been no other l o s s e s of u3 '.
I t will be noted tha t no ana lys is resu l t s are l i s ted for s amples FP-11-38 and FP-11-49. Although these samples were run in the normal manner, a total of over 2000 micromoles of H F was evolved for the four hydrogen reduction steps fox each sample as compared with about SS micromoles for the previous runs. Since th i s increased H F yield coincided with an increase in act ivi ty in the t raps used to co l lec t the HF, it appeared l ikely that the buildup in sample act ivi ty during the extended period of reactor operation might be responsible.
'J. M. Dale, K. 17. Apple, and A. S. Meyer, MSR which " n may be UF,, NiF2' FeF2' C r F 2 y Proprarn Sernrmn. Pro&. Rrpf. f'cb. 28, 1967, C>&jL-
UF4 in order of their observed reduction potentials. 4119, p. 158,

168
Table 14.2, Concentration o f U 3 + in MSRE Fuel Salt
Sample No. M Wil 1
FP-9-4 FP-10-25 FP-11-5 FP-11-13 FP-11-32 FP-11-38 FP-I 1-49 FP-12-6 FP-12-11 FP-12-21
10,978 16,450 17,743 20,386 25,510 27,065 30,000 32,450 33,095 35.649
4 u 3 + Rumup Oxidation
(equivalents) ~~~
1.87 0.93 0.40 0.26 0.88 0.26 0.50 0.40 a. 10 0.50
Be Added
(equivalents) ~~~
3.61
2.59
1.86
3.95 1.14
3 + U ”total’ C a lcii 1 a t ed
(70)
0.31 0.58 0.54 0.77 0.69 0.66 0.80 0.76 1.14 1.54
- ~~ ~
3 + U /Uto ta l , Analysis (%)
Step 111
0 0.35 0.37 0.37 0.33
0.42 0.38 0.39
Step IV ~~ ~
0.1 0.45 0.37 0.42 0.34
0.37 1.2 0.50
If the induction period for t he radiolytic generation of fluorine were shortened due to the increased activity leve l of the sample, t he fluorine evolved during the loading of the sample could react with the inner walls of the Monel hydrogenation vesse l . The copper and nickel fluorides formed would be subsequently reduced during the hydrogemation s t e p s to produce H F .
T h e above hypothesis appears t o be supported by the resu l t s of the following experiment. One of t h e samples which produced the high H F y ie lds was allowed to s tand in the hydrogenator a t room temperature for about a week. T h e sample was then subjec ted to additional hydrogenation s t e p s , and ISF was produced in quantit ies comparable with tha t obtained in the original runs. After standing severa l iiiore days at room temperature, the sample was removed from the hydrogenator. Smaller but significant quantit ies of HF were obtained when the empty hydrogenator was subjected to the high-temperature hydrogenation procedure.
FP-12-21, wexe all taken after a relatively brief period of reactor operation following a lengthy reactor shutdown period. None of these ana lyses produced the excess ive ly high I-IF yie lds which were observed for t he previous two samples . T h i s appears to b e further confirmation tha t the exces- s i v e HF yie lds resulted from a buildup in sample activity with extended reactor operation.
Since the first addition of beryllium to the fuel, a l l t h e determinations of U + not obviously affected
T h e l a s t three samples , FP-12-6, FP-12-11, and
by radioactivity have fallen i n t he 0.33 to 0.50% range ( the one result of sample FP-12-11 could b e explained by a leaky valve) and d o not reflect t he beryllium additions in the periods between the samplings. This could b e accounted for by t h e evolution of fluorine in much smaller quantit ies than appeared to b e t h e case in samples FP-11-38 and FP-11-39. If t h i s is the c a s e , t he only per- manent solution would be to maintain the samples a t 20OOC during the lime of transfer to the hot ce l l for ana lys i s . However, a n apparatus is now being designed which will pertiiit the hydrogenation of synthe t ic fuel samples under carefully controlled conditions. It i s felt that th i s experiment will provide a check of the validity of the transpiration method and will give further ev idence as to whether or not t he fluorine evolution is a real problem.
Experimental work is a l s o be ing carried out to develop a method for the remote measurement of ppm concentrations of H F in helium or hydrogen gas streams. T h e technique i s primarily for appli- cation to the U3 i~ transpiration experiment but, i f successfu l , should also b e applicable to the deter- mination of H F in the MSRE off-gas. T h e method i s based on the collection of H F o n a small N a F trap which is held a t 70°C to prevent t he adsorp- tion of water. ‘This is followed by a desorption a t a higher temperature to give a concentrated pulse of HF tha t c a n b e measured by thermal conduc- tivity techniques.
A cornponents t e s t ing facil i ty h a s been s e t up which inc ludes a dilution sys tem to produce I ~ I F “standards” as low as 20 ppm, a therrnostatted
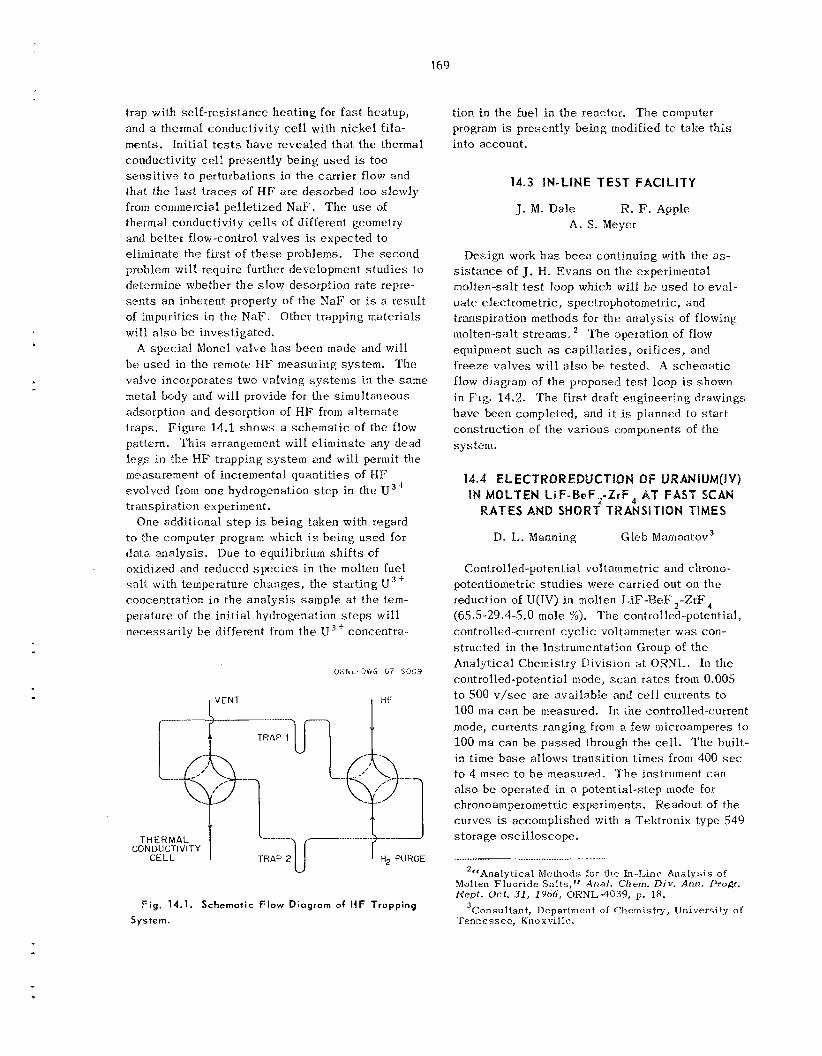
169
trap with se l f - res i s tance hea t ing for f a s t heatup, and a thermal conductivity cell with n icke l fila- merits. Init ial tests have revealed that t he thermal conductivity cell presently be ing used is too sens i t i ve t o perturbat.ions in the carrier flow and that t he l a s t t races of HF a r e desorbed too slowly f iom corrimercial pe l le t ized NaF . T h e u s e of thermal conductivity cells of different geometry and bet.ter flow-control. va lves is expec ted to eliminate the f i r s t of t h e s e problems. T h e second problem will require further development s t u d i e s to delermine whether the s low desorption ra te repre- s en t s a n inherent property of the NaF or is a resu l t of impurities i n the N a F . Other trapping materials will a l s o b e investigated.
be used in the remote H F measuring system. T h e valve incorporates two valving sys t ems in the same metal body and will provide for t he simultaneous adsorption and desorption of H F from a l te rna te traps. Figure 14.1 shows a schemat ic of the flow pattern. T h i s arrangement will el iminate any dead l egs in the H F trapping system and will permit the measurement of incremental quanf i t ies of H F evolved from one hydrogenation step in the W 3 ' transpiration experiment.
One addit.ional s t e p is be ing taken with regard to the computer program which is being used for da t a a.nalysis. Due to equilibrium sh i f t s of oxidized and reduced s p e c i e s in the inolten fuel salt. with temperature changes , t he s ta r t ing U 3 +
concentration in the ana lys i s sample at the tem- perature of t he init ial hydrogenation s t e p s will necessar i ly be different frotn the U 3 + concentra-
A spec ia l Monel va lve h a s been made and wil l
O R N L - D W G 67-YOO9
I VENT I HF
I
TRPP 1
THERMAL CON DUCTlVlTY
CELL TRAP 2 H2 PURGE ' H2 PURGE U
Fig. 14.1. Schematic F l o w Diagram of HF Trapping System.
tion in the fuel i n t h e reactor. T h e computer program is presently being modified to take t h i s into account.
14.3 IN-LINE TEST FACILITY
J. M. Dale R. F. Apple A. S . Meyer
Design work h a s beeii continuing with the as- s i s t ance of J. H. E v a n s 011 the experimental molten-salt test loop whic-h will be u s e d to eval- ua te electrometric, spectrophotometric, and transpiration methods for the ana lys i s of flowing molten-salt streams. 'The operat ion of flow equipment such as capi l la r ies , orifices, and freeze va lves will d u o b r tes ted . A schemat ic flow diagram of the proposed t e s t loop is shown in Fig. 14.2. T'ne first draft engineering drawings have been completed, and i t is planned to stdirt construction of tile various components of the system.
14.4 ELECTWQREDUCTlQN OF U IN MOLTEN l iF -SeF2-ZrFF4 AT FAST SCAN
RATES AND SHORT TRANSITION TIMES
D. I,. Manning GIeb ~ a m a n t o v ~
Controlled-poteiitial voltammetric and chrono- potentiometric s t u d i e s were car r ied out on the reduction of U(IV) in molten LiF-I3eF ,-ZrF, (65.5-29.4-5.0 mole %). T h e controlled-potential, controlled-current cyc l i c voltammeter was con- structed in the Instrumentation Group of the Analytical Chemistry Division at OKNL. In t h e controlled-potential mode, s c a n r a t e s from 0.005 to 500 v / sec are available and cell currents t o 100 ma c a n be measured. IE Lie controlled-current mode, currents ranging from a few niicroamperes to 100 m a c a n b e pas sed through the cell. T h e built- in time b a s e allows transit ion t i m e s from 400 sec to 4 m s e c to b e measured. T h e instrument c a n also b e operated in a potential-step mode for chronoamperometric experiments. Readout of the curves is accomplished with a Tektronix type 549 s torage osc i l loscope .
28'Analytical Methods for the Ln-Lint: Analysis of Molten Fluoride Salts," Anal . Chrm. Div. Atin. f'ro&r. fiept. Oct. 31, 19b6, OWL-4039, p. 18.
Tennessee, Knoxvillt-. 3 ~ o n s u ~ t a n t , Department of czhernistry, Univers i ty o f
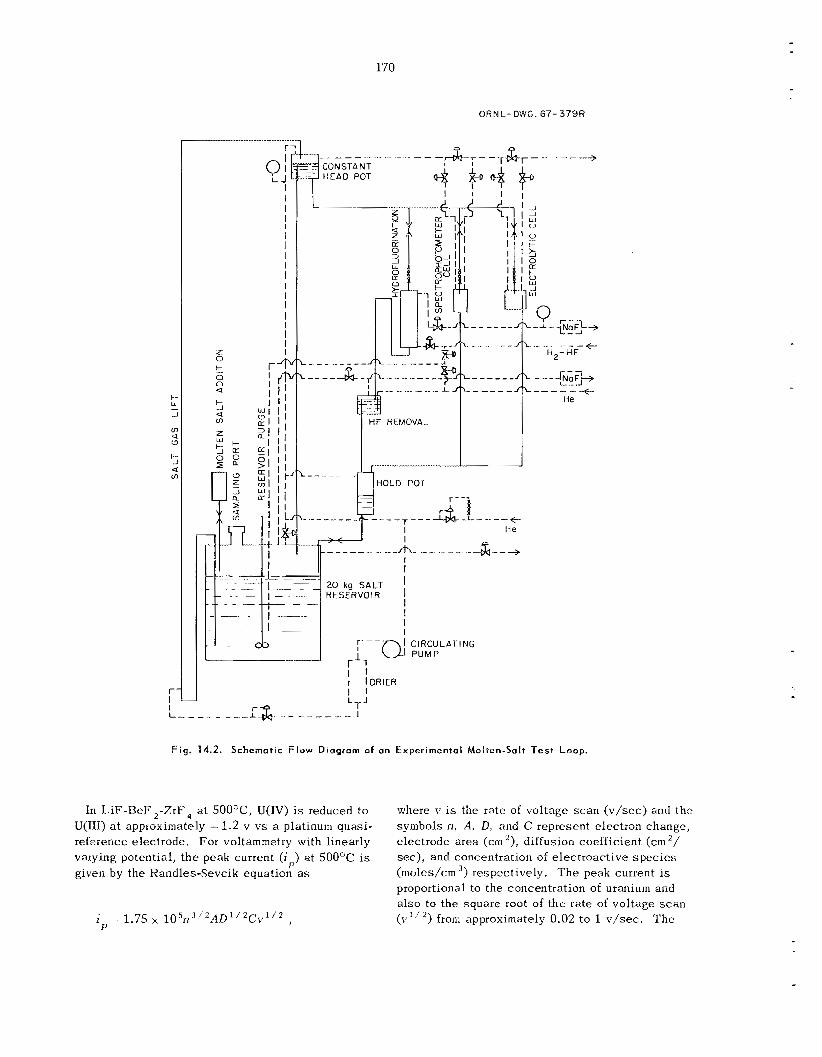
170
ORNL-DWG. 67-379R
I I I
I I I I 1 I I I I I I I I
I
-+ (? ; I ; I I I
1 1
.............. - .
LJ !+€AD POT
I I I I
r 9
l l REMOVAL
20 kg SALT I R E S E R V O I R I
I I I I
L ---_I-__ I*---- ---- -I
Fig. 14.2. Schematic Flow Diagram of an Experimental Molten-Salt T e s t Loop.
In LiF-BeF,-ZrF4 a t 5OO0C, U(1V) is reduced t o U(II1) a t approximately - 1.2 v v s a platinum quasi- reference electrode. For voltammetry with l inearly varying potential , t h e peak current (i ) a t 5OOOC is given by the Randles-Sevcik equation a s
where v is the rate of vol tage s c a n (v/sec) and the symbols n: A, D, and C represent electron change, electrode area (cm2>, diffusion coefficient (cm ’/ sec), and concentration of electroact ive s p e c i e s (niules/crn 3> respectively. T h e peak current is proportional to the concentration of uranium and also to the square root of the rate of voltage s c a n (v””) from approximately 0.02 t o 1 v/sec. T h e
P
i = 1.75 x 1 0 5 n 3 / 2 A D ” 2 C v ” 2 , P
17 1
diffusion coefficient at 50O0C is approximately 2 x l o u 6 cm2/sec. At fas te r s c a n ra tes , however, the i v s vl” p lo t s frequently exhibited upward curvature, particularly at platinum and platinum- rhodium indicator electrodes. It is believed tha t t h i s deviation from the Randles-Sevcik equation i s caused i n part by adsorption of uranium on the surface of the electrode. Conway4 postulated that for a charge transfer examined by t.he voltage sweep method there a r e three contributions to the time- dependent current: (1) a non-Faradaic current C,, d v / d t assoc ia ted with charging or discharging of t he ionic double layer, (2) a pseudo-Faradaic current C dv/dr assoc ia ted with the change of extent of coverage by adsorbed s p e c i e s formed or removed in the electrochemical s t e p , and (3) Farada ic current i F assoc ia t ed with any ne t reac t ions which c a n occur within the range of potential s c a n s employed. Therefore the net current i t that is recorded as a function of time during a potential sweep is
1’
i t C,, dv /d t + C dv/dt t i, .
Since d v / d t is the s c a n rate (v) and i F -.= k v 1 / 2 , i t c a n b e written a s
where k 1.75 x ~ O ’ ~ I ~ ’ ~ A D ‘ / ~ C . Corrections for adsorption p lus charging ef fec ts , when encountercd at fast s c a n r a t e s , were made by plott ing i / v ~ ’ ~ vs vl”, where t h e s lope re f lec ts adsorption phenomena and the intercept conta ins the Farada ic term. T h e diffusion coefficient for U(1V) ca lcu la ted from the intercept was in good agreement with the value from the l inear i vs v 1 l 2 plots.
In chronopotentiometry, adsorption of reactant c a u s e s the i O r 1 I 2 product, where i, - current density (amp/cm2), to inc rease as 7 (transit ion time) dec reases ; th i s effect w a s observed for uranium at shor t transit ion t imes (<loo msec). T h e potential-time t r aces were not as well defined as the voltammograms; howeve,, reasonably prec ise transition t i m e s could b e es tab l i shed . Approximate corrections for adsorption e f fec ts were made uti l izing a method set forth by Tatwawadi and
P
P
---.-.-_l
4R. E. Conway, J. Electroanal . Cham. 8, 486 (1964).
Bard. chronopotentiometry was i n agreement with the voltammetric value.
in molten L iF-ReF 2-ZrF4 is a reversible one- electron process . However, for the ana lyses of current-potential curves at f a s t ra tes of voltage s c a n or potential-time traces at short transit ion times, adsorption phenomena could b e pronounced and must be taken into account.
T h e diffusion coefficient calculated from
It is concluded that the U(1V) 8 U(TI1) reduction
14.5 SPECTROPHOTOMETRIC STUD! ES OF MOLTEN FLUORlDE SALTS
J . P. Young
Spectrophotometric s tud ie s of in te res t t o molten- salt reactor problems have continued. A major portion of the work for t h i s period h a s been con- cerned with the u s e of SiO, a s a container for L,iF-BeF melts. Spectrophotometric techniques were applied to the evaluation of the compatibility problems involved. T h i s work is reported in a preceding sec t ion of t h i s report. An investigation of the spectrum of U(V1) in molten fluoride salts has t e e n initiated. By means of spec t ra l meas- urements it should b e poss ib l e to measure t h e solubility of U(VT) in t h e s e solutions. T h e spec - tral measuremetits can also be used analytically to measure concenttations of U(V1) and to follow the change in concentration of t h i s s p e c i e s during various reactions. T h i s work is being done in cooperation with G. I. Cathers , who h a s furnished the so lu t e sa l t , Na,UF8. T h e container material for molten-salt so lu t ions of U(V1) must b e inert to oxidation. It was hoped that SiO, would sa t i s fy these requirements. It w a s found, however, that t he spectrum of Na,UF, d isso lved i n L iF -BeF , i n a n Si0 cell with Si?? overpressure was identical to the spectrum of UO ,F, d isso lved under identical conditions. T h i s would sugges t that the oxide concentration in the melt was suf- f icient to c a u s e the formation of uranyl ion. T h e d isso lved s p e c i e s a t 550°C exhibited a n absorption peak a t 419 nm and the foor of a s t rong absorption peak in t h e ultraviolet with a shoulder at 310 nm. T h e absorption peaks generally correspond quite well to that reported6 for UO,” in aqueous IIC10,.
’5. V. Tatwawadi and A. J. Bard, Anal . Chem, 36, 2
6J. T. Bell and R. E. Biggers, J. M o l . Spectry . 22, (1964).
262 (1967); ihid., 22, in press .
172
Th i s uranium s p e c i e s disappeared slowly when iron wire was introduced into the melt. T h e resultant spectrum was that of tetravalent uranium; thus, i t is demonstrated that an oxidized s p e c i e s of uranium was oiiginally present. It would appear, then, tha t although S i 0 containers a re s t ab le to oxidation, the equilibrium 0 '- concentration may react with components of t h e melt.
s p e c i e s and their spectrophotometric characteriza- tion is ~ o n t i n u i n g . ~ T h i s work is carried out in cooperation with F. L. Whiting' and Gleb Mamantov. advantages in th i s s tudy compared with window- l e s s ce l l techniques which had been used. Under the experimental conditions presently required, however, i t was found that t h e presence of 1 atm of S iF , g a s over t he melt under study interferes with cathodic voltammetric s tud ie s by caus ing very high cathodic currents. The reasons for t h i s a re not ye t understood, but t he IJ(IV)/U(III) reduc- tion wave is completely lo s t i n t he presence of SiF,. Conversely, S iF , does not affect anodic voltammograms. Since S iF , is a product of fluoride s a l t reaction with SiO,, t h e s e resu l t s sugges t that SiO, containers may have limited u s e in voltam- metric s tud ies .
T h e development of a recording spectrophoto- metric sys tem is continuing that wilj permit spec - tral measurements of highly radioactive solutions to be obtained on samples located i n a high- radiation-level cell. T h e system will make u s e of the extended opt ica l path length similar to that being considered for u s e in t h e in-line spec t ra l measurements of molten-salt reactors. The bas i c spectrophotometer and a s soc ia t ed equipment have been ordered, and t h e design of the phys ica l and optical arrangements of the components for t h e extended path is being considered. T h e optical arrangement will b e s u c h tha t both windowed and windowless cells c a n be used .
The work on electrochemical generation of so lu te
Again SiO, would offer severa l
14.6 ANALYSIS OF OFF-GAS FROM COMPATIBILITY TESTS OF MSRE
PUMP OIL WITH BF,
C. M. Boyd
A to ta l hydrocarbon detector and a thermal conductivity detector have been used to determine the hydrocarbons and BF, in the g a s from t e s t s on the e f fec ts of BF3 on MSRE pump oil (Gulf-
sp in 35). T h e s e t e s t s are described in an earlier section. A gas sampling manifold permits t he measiirement of inc reases in hydrocarbon concen- tration of an He-BF3 stream on contac t with the oil. A parallel stream of helium through a sepa ra t e oil reservoir s e r v e s 3s a reference. T h e hydro- carbon analyzer was modified by the addition of a sampling pump which draws in the g a s a t near atmospheric pressure, compresses i t , and then p a s s e s i t through the analyzer. T h e portions of the t e s t g a s to b e ana lyzed were first passed through a saturated solution of K F to remove the BF3 and thereby protect t he pump and other components of the analyzer. T h i s solution h a s a low water vapor pressure, which prevents water condensation i n the analyzer. In the first t e s t s , with the B F , a t the 2000-ppm leve l and the oil a t 15O0F, the hydrocarbon leve l i n t h e off-gas was less than 50 p p m ~
T h e thermal conductivity detector w a s used t o monitor t he B F 3 concentration in t h e t e s t gas , which was produced by mixing flows of pure RF, and He. T h e detector and flow capillary were calibrated by pass ing a known volume of the g a s mixture through the detector and then through a trap of dilute NaOH. The solution was analyzed for boron and fluoride, and the B F 3 concentration of the g a s was then calculated. The sens i t iv i ty of th i s detector under the conditions used was +I0 ppm of BF,.
14.7 DEVELOPMENT OF A GAS CHROMATOGRAPH F O R THE MSRE
BLANKET GAS
C. M. Boyd A. S. Meyer
Developinent s tud ie s a r e being made on the design of a gas chromatograph to b e u s e d for the continuous determination of permanent g a s i m - purities and water i n the helium blanket gas of the MSRE. T h e chromatograph will require two columns to separa te t h e components desired. Tests have shown that a parallel column sys tem composed of a SA molecular s i e v e s coluliln and a Porapak S column should be practical for analyzing g a s e s which are not highly radioactive. T h e M,, O,,
7J. P. Young, MSK Program Serniann. Progr. Rept.
'University of Tennessee , Knoxville. Feb . 28, 1967, ORNL-4119, p. 163.
173
N,, CH,, and CO are separated on the molecular s i e v e s column, and t h e H,O and CO, are separated on the Porapak column. T h e chromatograph will require separa te compartments controlled at dif- ferent constant temperatures. The sample valve, columns, and detectors may require different tem- peratures for optimum operation.
T h e requirement that determination of impurities b e made a t sub-, low-, and a l s o a t higher-ppm leve ls n e c e s s i t a t e s the u s e of two different types of sys t ems or detectors . A helium breakdown detector c a n be operated in e i ther the high- and low-sensit ivity modes or in the high-sensit ivity mode in conjunction with a thermal conductivity detector.
T h e chromatograph which is used for analyzing the reactor off-gas will b e subjected to radiation from samples at the I-curie/cc level. T h i s re- quires a system free of organic construction maferials. An all-metal sampling valve and a detectoi unaffected by th i s radiation a re necessary. T h e organic Porapak column cannot b e used at this level of radiation. T h i s eliminated the pos- s ibi l i ty of H,O ana lys is on t h e s e samples . A s i l i ca gel column wil l b e used to resolve CO,.
The problem of radioact ive samples and the transmittal of g a s samples containing ppm leve ls a€ H,O from the source to the detector require the u s e of a heated all-metal sampling valve. Such a valve h a s been designed and constructed. The valve is s i m i l a r to the conventional Phi l l ips s ix- way pneumatically actuated diaphragm valve (Fig. 14.3). The Teflon diaphragm h a s been replaced by a 1-mil-thick Inconel diaphragm which contac ts and seals the redesigned entry or i f ices (Fig. 14.4). With th i s metal diaphragm a spacer is required to allow gas flow without e x c e s s i v e backpressure. Spacers made from 2-mil gold were necessary to give a leak-tight s e a l between the diaphragm and the valve faces . T h e gold was annealed at 1500°F and, after instal la t ion in the valve, subjected to 32,000 p s i pressure. Pressure maintained by the assembly s c r e w s w a s sufficient for retaining th i s s ea l .
The choice of detectors which are sens i t ive to sub-ppm l e v e l s of permanent g a s e s is limited to the helium ionization types. A helium breakdown
voltage detector w a s used on the MrR Capsule Test Fac i l i ty (test 47-63' and was not aEEected by the radiation present in the gas samples . 'This may be explained by the r e ld ive ly high current leve ls (microamperes) used with th i s type of detector. A constant-current power supply is used with th i s detector, and a decrease in breakdown voltage, rather than an increase in ionization cur- rent, ind ica tes a n increase in the electr ical con- ductivity of the gas. T h e breakdown voltage of
pure helium is about 500 v and is lowered by about SO v by 1 ppm of impurity. T h e minimum detectable limit i s controlled primarily by t h e noise level present, but under optimum conditions is below 1
In previous attempts to improve the stabi l i ty of PPb . the detector discharge, various electrode radii were used with the anode and cathode in a con- centr ic arrangement. In th i s early model of the detector, which was contained ins ide a Swagelok tube fitting, it. was impossible to observe the helium discharge. A test detector was therefore constructed which h a s a glass body with Kovar s e a l tube connect ions through which the electrodes are mounted (Fig. 14.5). T h e s e electrodes have temovable t i p s which allow the tes t ing of various electrode s h a p e s and spacings. The effects on the helium discharge can be observed through the glass . T e s t s with th i s detector ind ica te that a minimum noise level is obtained with a smooth flow discharge on t h e anode probe. Maximum sensi t ivi ty d ic ta tes the use of a very pure helium carrier gas, but t h i s purity leve l also causes a sparking or arcing in the helium discharge. The addition of mercury vapor by the presence of a s m a l l source of the metal in the t ip of t h e anode s tabi l ized the discharge. T h e more practical solut ion of adding a contamincant by a controllable gas flow is being tes ted. T h i s approach may also permit addition of larger amounts of contaminant to allow the detector to operate in the less -sens j t ive mode necessary for the determination of h.i@ leve ls of impurities in the blanket gas samples .
'MSR Program Semiann. Pro&. Rept. J I J I Y 31, 1964, ORNL-3708, p. 328.
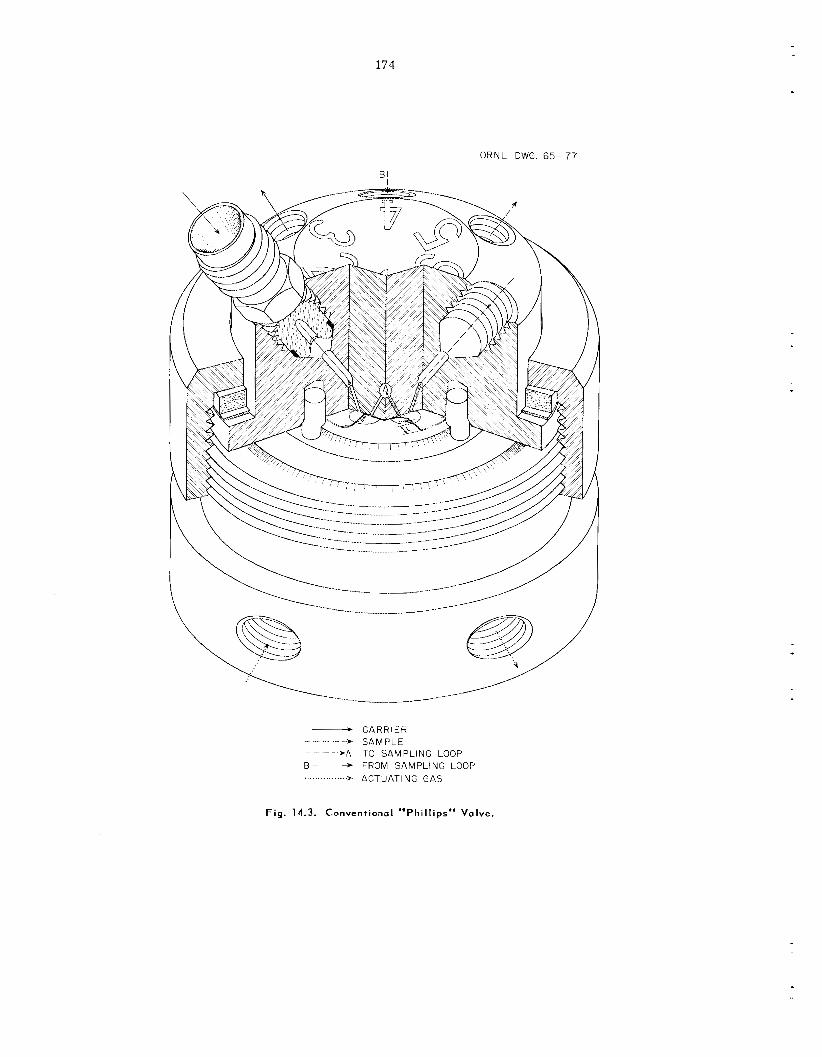
174
O R N L - D W G . 65.- 77
BI I
- C A R R I E R
- ..~ .. -->A ro SAMPLING LOOP
...... -+ S A M P L E -
B - - - + FROM S A M P L I N G LOOP ................ * A C T U A T I N G G A S
F i g . 14.3. Conventional "Phi l l ips" Valve .
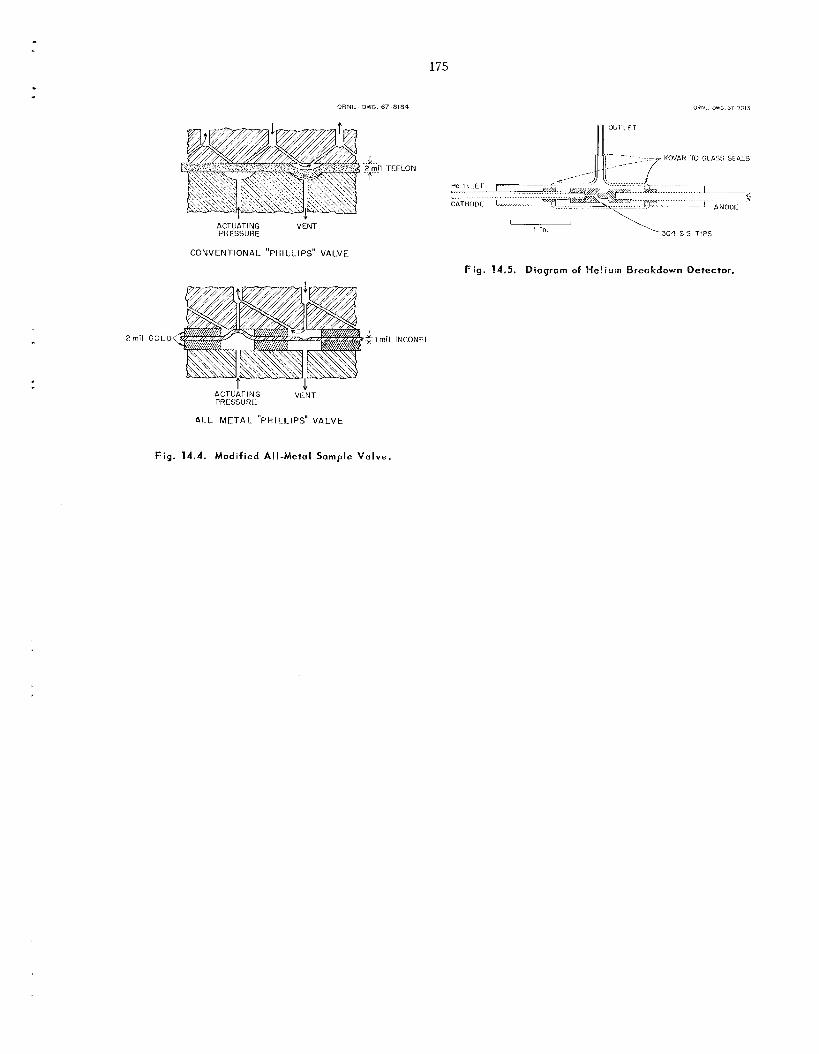
175
O R N L - D W G . 67-8184
..k --Y 2 mil TEFLON
ACTUATING VENT PHESSlJRE
CO NV CN TI ON A L "PH I L L I PS" VALVE
ACTUATING VE'NT PRESSURE
AIL M E T A L "PHILLIPS" VALVE
, 1 in. l 3 C 4 S S TIPS
Fig. 14.5. Diogrom of He!iurn Breakdown Detector.
F ig . 14.4. Modified All-Metal S a m p l e Valve.
olten- I rr
E. G. Bohlmann
Molten-salt breeder reac tors are expected to operate with a high rate of production of fission products a s a result of fuel s a l t power dens i t ies in e x c e s s of 200 w/cc. The e f fec ts of long-term exposure under such conditions on t h e s tab i l i ty of fuel s a l t , the compatibility of s a l t with graphite and metal (Hastelloy N), and the f a t e of the fis- s ion products a r e of in te res t . Undue buildup of fission product poison on core graphite, for ex- ample, could reduce the breeding efficiency of t.he reactor if not mitigated. Init ial loop experiments a re being directed largely a t understanding the fa te of important f ission products.
periment was terminated by t h e appearance of a T h e second thermal convection in-pile loop ex-
crack in the co re outlet pipe, probably caused by radiation embrittlement of t h e alloy and s t r e s s e s encountered during a reactor se tback . Sufficient operating t ime had, however, been achieved to produce fission product concentration leve ls equivalent to those estimated t o b e present a t processing equilibrium in a breeder; therefore, an exhaus t ive evaluation of t h e experiment i s in progress.
Future loops will b e fabricated of Hastelloy N modified by titanium addi t ions shown to inhibit t he radiation e f fec ts . Experiment ob jec t ives in- c lude study of materials compatibility, f i s s ion product behavior, and ef fec ts of operation a t off- design conditions.
E. L . Compere H. C. Savage J . M . Baker
Resu l t s of the first in-pile molten-salt convec- tion loop experiment in th i s program have been r e p r t e d . Irradiation of the second molten-salt convection loop in beam hole HN-1 of the Oak Kidge Research Reactor began' January 1 2 , 1967, and was terminated April 4, 1967, after develop- ment of 8 . 2 x 10 ' * f i ss ions /cc (1.2% ' 5U burnup) in the 7 L i F - B e F ,-%rF,-UF , (65.3-28.2-4.8-1.7 mole %) fuel. Average fuel power dens i t ies u p to 150 w per cc of s a l t were a t ta ined in t h e fuel channels of t h e core of MSRE-grade graphite.
'H. C. Savage, E. L. Compere e t a l . , MSR Program Serniann Progr. Rcpt F e b 28 1967, ORNL-4119, pp. 167---73.
T h e experiment w a s terminated after radioactivi- t y was de tec ted in t h e secondary containment s y s - tems as a resu l t of gaseous fission product leak- age from a crack in the core outlet tube .
Operation and postirradiation examination of the second loop are described below.
A diagram of the second in-pile molten-salt con- vection loop is shown in F ig . 15.1. T h e core sec t ion of t h e loop c o n s i s t s of a 2-in.-diam by 6-in.-long cylinder of MSRE graphite. Eight vertical 'G-in.-diarn ho le s for s a l t flow are bored through the core in an octagonal pattern with
176
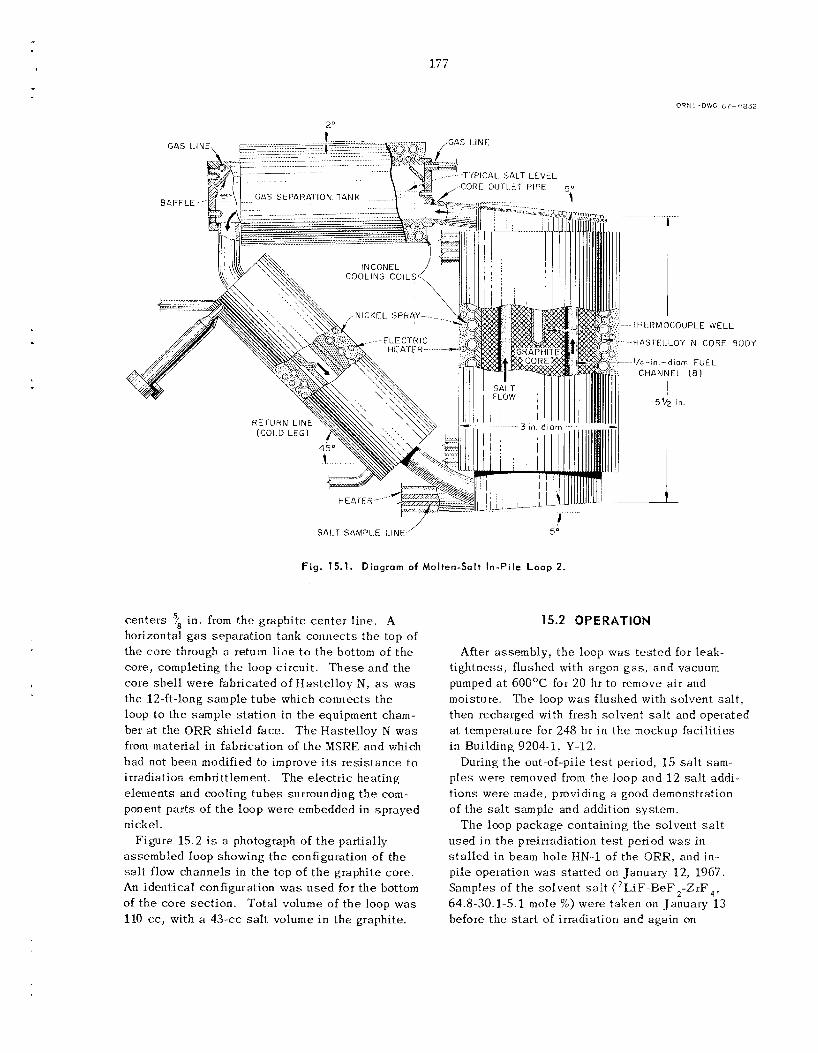
177
....
5"
Fig. 15.1. Diagram of Molten-Salt In-Pile LDOD 2.
centers '/B in. from t h e graphite cen te r l ine . A horizontal g a s separation tank connec ts t h e top of the co re through a return l i ne to the bottom of t h e core, completing t h e loop c i rcu i t . T h e s e a n d the core she l l were fabricated of Has te l loy N, as was the 12-ft-long sample tube which connec ts t h e loop to the sample s ta t ion in the equipment cham- ber a t the ORR shie ld face. T h e Has te l loy N was from material in fabrication of t he MSHE and which had not been modified to improve i t s res i s tance to irradiation embrittlement. T h e e lec t r ic heating elements and cooling tubes surrounding t h e com- ponent par t s of t h e loop were embedded in sprayed ni clt el .
Figure 15 .2 is a photograph of t h e partially assembled loop showing t h e configuration of the salt flow channels in the top of t h e graphite core. An ident ica l configuration w a s u s e d for t h e bottom of t h e core sec t ion . Tota l volume of t h e loop was 110 c c , with a 43-cc s a l t volume i n t h e graphite.
15.2 OPERATION
After assembly , t h e loop was t e s t ed for Ieak- t ightness, f lushed with argon gas , and vacuum pumped at 6 0 0 T for 20 hr to remove a i r and moisture then recharged with fresh solvent s a l t and operated a t temperature for 248 hr in t h e mockup fac i l i t i es in Building 9204-1, Y-12.
During t h e out-of-pile t e s t period, 15 s a l t s a m - p l e s were removed from the loop and 12 sa l t addi- t ions were made, providing a good demonstration of the s a l t sample and addition system.
T h e loop package containing the solvent s a l t used in t h e preirradiation t e s t period was in- s t a l l ed in beam hole I-IN-1 of the ORR, and in- pile operation was s ta r ted on January 12, 1967. Samples of t h e solvent s a l t ( 7LiF-BeF,-ZrF, , 64.8-30.1-5 1 mole %) were taken on January 13 before the s t a r t of irradiation and again on
T h e loop was f lushed with so lvent s a l t ,
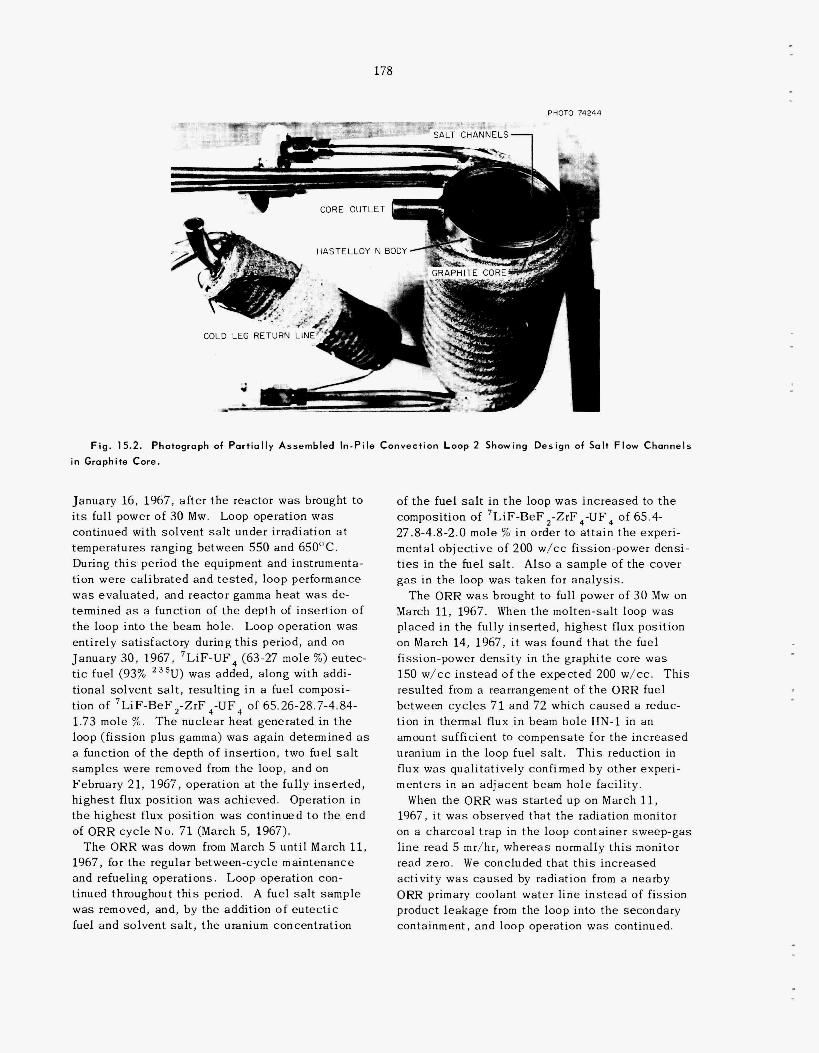
178
PHOTO 74244
I
CORE OUTLET 7
COLD LEG RETURN LIN
Fig . 15.2. Photograph of Par t ia l ly Assembled In -P i le Convection Loop 2 Showing Design of Solt F low Channels
in Graphite Core.
January 16, 1967, af ter t h e reactor was brought to i t s full power of 30 Mw. Loop operation w a s continued with solvent s a l t under irradiation a t temperatures ranging between 550 and 650'C. During th i s period the equipment and instrumenta- tion were calibrated and t e s t e d , loop performance was evaluated, and reactor gamma hea t was de- termined as a function of the depth of insertion of the loop into t h e beam hole. Loop operation was
during t h i s period, and on iF-UF, (63-27 mole %) eutec-
t i c fuel (93% 235U) was added, along with addi- t ional solvent s a l t , result ing in a fuel composi- tion of 7LiF-BeF, -ZrF ,-UF, of 65.26-28.7-4.84- 1.73 mole %. T h e nuclear heat generated in t h e loop (f iss ion plus gamma) was again determined a s a function of t h e dep insertion, two fuel s a l t samples were removed m t h e loop, and on February 21, 1967, op ion a t t h e fully inser ted, highest flux position was achieved. Operation in t h e highest flux posit ion was continued t o the end of ORR cyc le No. 71 (March 5, 1967).
T h e ORR was down from March 5 unt i l March 11 , 1967, for the regular between-cycle maintenance and refueling operations. Loop operation con- tinued throughout t period. A fuel salt sample was removed, and, by the addition of eu tec t ic fuel and solvent s a l t , t h e uranium concentration
of the fuel s a l t in t h e loop w a s increased to t h e posit ion of 7LiF-BeF,-ZrF,-UF, of 65.4-
8-4.8-2.0 mole 76 i n order to a t ta in t h e experi- mental object ive of 200 w/cc fission-power densi- ties in t h e fuel s a l t . Also a sample of t h e cover g a s in the loop was taken for ana lys i s .
The ORR w a s brought to full power of 30 Mw on March 11, 1967. When t h e molten-salt loop was placed in the fully inser ted, highest flux posit ion on March 14, 1967, it was found that t h e fuel fission-power density in t h e graphite core was 150 w/cc in s t ead of t h e expected 200 w/cc. T h i s resulted from a rearrangement of t h e ORR fuel between cyc le s 71 and 72 which caused a reduc- t ion in thermal flux in beam ho le HN-1 in an amount sufficient to compensate for t h e inc reased uranium in the loop fuel salt. T h i s reduction in flux was quali tatively confirmed by other experi- menters i n an adjacent beam hole facility.
1967, it w a s observed that the radiation monitor on a charcoal t rap in the loop container sweep-gas l ine read 5 mr/hr, whereas normally t h i s monitor read zero. W e conclude activity was caused by r Om primary coolant wa product leakage from the loop into the secondary containment, and loop operation w a s continued.
When the ORR w a s s tar ted up on March 1 1 ,
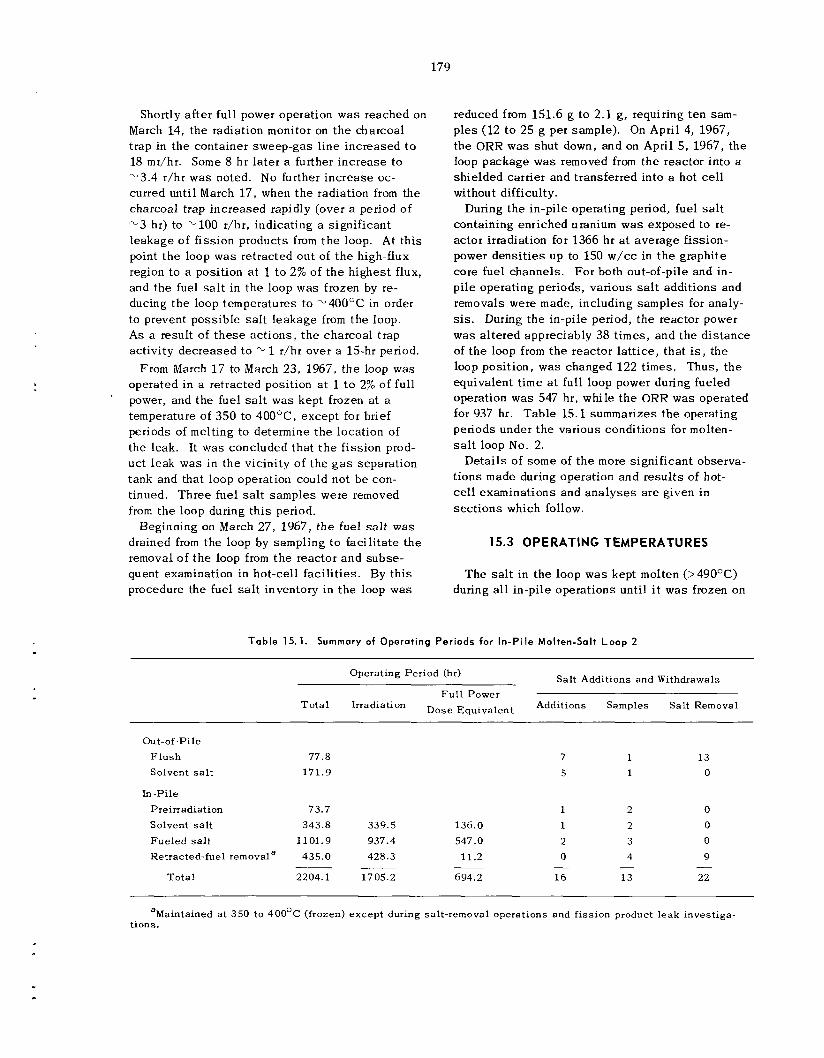
179
Shortly a f te r full power operation was reached on March 14, t he radiation monitor on t h e charcoal trap in t h e container sweep-gas l ine increased t o 18 mr/hr. Some 8 hr later a further increase t o -3 .4 r/hr w a s noted. N o further increase oc- curred until March 17, when t h e radiation from the charcoal trap increased rapidly (over a period of -3 hr) to -100 r/hr, indicating a significant leakage of f i ss ion products from t h e loop. At th i s point t h e loop was retracted out of t h e high-flux region to a position at 1 t o 2% of t h e highest flux, and the fuel s a l t in t he loop was frozen by re- ducing t h e loop temperatures to -400°C in order to prevent poss ib le sa I t l eakage from the loop. As a result of t h e s e ac t ions , t h e charcoal trap activity decreased t o
From March 17 to March 23, 1967, t h e loop was operated in a retracted position at 1 t o 2% of full power, and the fuel s a l t was kept frozen a t a temperature of 350 to 4OO0C, except for brief periods of melting to determine the location of t he leak. It was concluded that t h e f i ss ion prod- uct leak was i n t he vicinity of the g a s separation tank and that loop operation could not b e con- tinued. Three fuel salt samples were removed from the loop during th i s period.
Beginning on March 27, 1967, t h e fuel s a l t was drained from the loop by sampling t o facilitate the removal of t h e loop from t h e reactor and subse- quent examination in hot-cell fac i l i t i es . By th i s procedure the fuel salt inventory in the loop was
1 r/hr over a 15-hr period.
reduced f rom 151.6 g to 2 .1 g, requiring ten sam- p l e s (12 to 25 g per sample). On April 4, 1967, t he ORR was shut down, and on April 5 , 1967, t h e loop package was removed from the reactor into a shielded carrier and transferred into a hot cell without difficulty .
During the in-pile operating period, fuel s a l t containing enriched uranium was exposed to re- actor irradiation for 1366 hr at average fission- power dens i t i e s up to 150 w/cc in t h e graphite core fuel channels. For both out-of-pile and in- pile operating periods, various salt additions and removals were made, including samples for analy- sis. During the in-pile period, t he reactor power was altered appreciably 38 times, and t h e d is tance of t h e loop from t h e reactor la t t ice , tha t is, the loop posit ion, was changed 122 t i m e s . Thus, t h e equivalent t ime at full loop power during fueled operation was 547 hr, while t h e ORR was operated for 937 hr. Table 15.1 summarizes the operating periods under the various conditions for molten- s a l t loop No. 2.
t ions made during operation and resu l t s of hot- cell examinat ions and ana lyses a re given in sec t ions which follow.
Details of some of t h e more significant observa
15.3 OPERATING TEMPERATURES
T h e salt in t h e loop was kept molten (> 490OC) during all in-pile operations until i t was frozen on
T a b l e 15.1. Summary of Operating Periods for In -P i le Molten-Salt Loop 2
Salt Additions and Withdrawals
Additions Samples Salt Removal
Operating Period (hr)
Fu l l Power Dose Equivalent To ta l Irradiation
Ou t-of-Pile F lush Solvent s a l t
In-Pile Preirradiation Solvent s a l t Fue led salt Retracted-fuel removala
To ta l
77.8 171.9
73.7 343.8 339.5
1101.9 937.4 435.0 428.3
2204.1 1705.2
7
5
1 136.0 1 547 .o 2
11.2 0
694.2 16 - -
1 1
2 2 3 4
13 -
13 0
0 0 0
9
22 -
aMaintained a t 350 to 4OO0C (frozen) except during salt-removal operations and fission product leak investiga- tions.
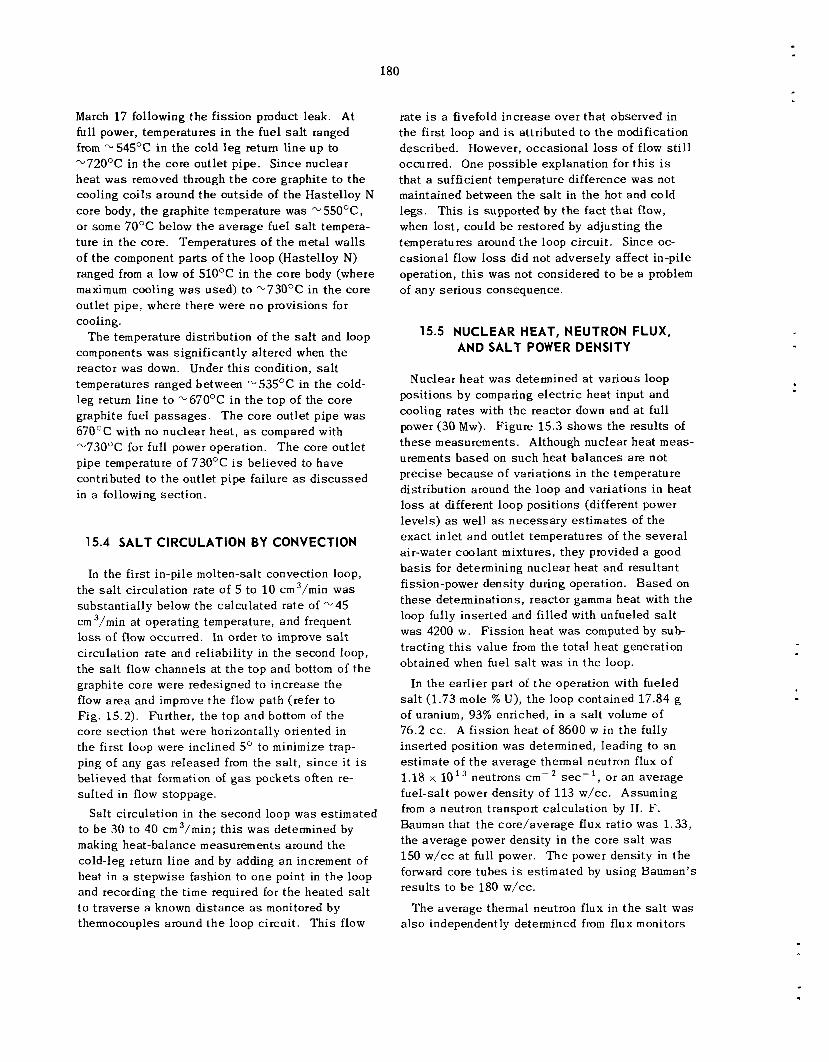
180
March 17 following t h e f i ss ion product leak. At full power, temperatures in t h e fue l s a l t ranged from -,, 545OC i n t h e cold l eg return l i ne u p to *72OoC in t h e core outlet pipe. S ince nuc lear hea t w a s removed through t h e core graphite to t h e cooling coils around t h e outs ide of t h e Hastelloy N core body, t h e graphite temperature was 55OoC, or some 7OoC below t h e average fuel salt tempera- tu re in the core. Temperatures of t h e metal wal l s of the component par t s of t h e loop (Hastelloy N) ranged from a low of 51OOC in t h e core body (where maximum cooling w a s used) to -73OOC in t h e co re outlet pipe, where there were n o provisions for cooling.
components was significantly altered when t h e reactor was down. Under t h i s condition, salt temperatures ranged between rv 535OC in the cold- leg return l i ne t o -670°C i n t h e top of the core graphite fuel pas sages . T h e core outlet p ipe was 67OOC with no nuclear hea t , as compared with "73OoC for full power operation. T h e core outlet pipe temperature of 73OOC is believed to have contributed to t h e outlet p ipe failure as d i scussed in a following sec t ion .
T h e temperature distribution of t h e salt and loop
15.4 SALT CIRCULATION BY CONVECTION
In t h e first in-pile molten-salt convection loop, t he s a l t circulation rate of 5 to 10 cm3/min was subs tan t ia l ly below t h e ca lcu la ted rate of -45 cm 3/min a t operating temperature, and frequent loss of flow occurred. In order to improve salt circulation rate and reliability in t h e second loop, t he s a l t flow channels at t h e top and bottom of t h e graphite co re were redesigned to inc rease t h e flow a rea and improve t h e flow path (refer t o Fig. 15.2). Further, t he top and bottom of t h e co re sec t ion tha t were horizontally oriented in the first loop were inclined S o t o minimize trap- ping of any g a s re leased from t h e sa l t , s i n c e i t is believed that formation of g a s pockets often re- su l ted in flow stoppage.
to b e 30 to 40 cm3/min; t h i s w a s determined by making heat-balance measurements around t h e cold-leg return l i ne and by adding a n increment of heat in a s t epwise fashion to o n e point in t h e loop and recording t h e t ime required for t h e hea ted s a l t t o t raverse a known d is tance as monitored by thermocouples around t h e loop circuit . Th i s flow
Salt circulation in the second loop w a s es t imated
rate is a fivefold inc rease over t ha t observed in the first loop and is attributed to t h e modification described. However, occas iona l loss of flow still occurred. One poss ib le explanation for t h i s is that a sufficient temperature difference w a s not maintained between t h e s a l t in t h e hot and co ld legs. This is supported by the fact that flow, when los t , could b e restored by adjusting t h e temperatures around t h e loop circuit . Since oc- cas iona l flow loss did not adversely affect in-pile operation, t h i s was not considered t o b e a problem of any se r ious consequence.
15.5 NUCLEAR HEAT, NEUTRON FLUX, AND SALT POWER DENSITY
Nuclear hea t w a s determined a t various loop posit ions by comparing e lec t r ic hea t input and cooling ra tes with t h e reactor down and a t full power (30 Mw). F igure 15.3 shows t h e results of t h e s e measurements. Although nuclear hea t meas- urements based on s u c h hea t ba l ances a re not prec ise because of variations in t h e temperature distribution around the loop and variations i n hea t loss a t different loop posit ions (different power leve ls ) as well as necessa ry es t imates of t he exac t in le t and outlet temperatures of t h e severa l air-water coolant mixtures, they provided a good b a s i s for determining nuc lear hea t and resultant fission-power density during operation. Based on these determinations, reactor gamma hea t with t h e loop fully inser ted and fi l led with unfueled s a l t was 4200 w. F i s s ion hea t was computed by sub- tracting t h i s value from t h e to ta l hea t generation obtained when fuel s a l t was in t h e loop.
In t h e ear l ie r part of t h e operation with fueled s a l t (1.73 mole % U), t h e loop contained 17.84 g of uranium, 93% enriched, in a s a l t volume of 76.2 cc. A f i ss ion hea t of 8600 w in t h e fully inserted position w a s determined, leading to an es t imate of t h e average thermal neutron flux of 1.18 x 10l3 neutrons cm-* sec- ' , o r a n average fuel-salt power density of 113 w/cc. Assuming from a neutron transport ca lcu la t ion by H. F. Bauman that t h e core/average flux ratio was 1.33, the average power density in t h e core salt was 150 w/cc at full power. T h e power density in t h e forward core tubes is estimated by using Bauman's resu l t s t o b e 180 w/cc.
T h e average thermal neutron flux in t h e salt was also independently determined from flux monitors
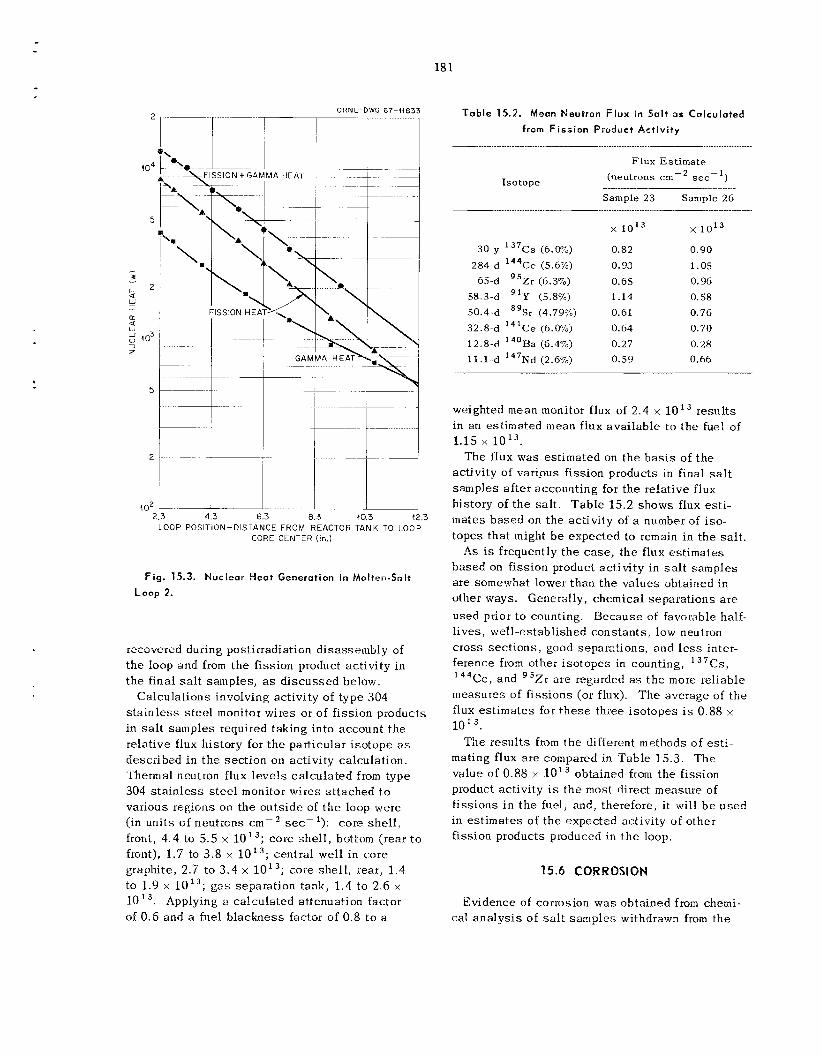
181
0 9 N L- DWG 67- 1 183 3
I 2 3 43 6 3 a 3 40 3 42 3
LOOP POSI l ION-DIS IANCE FROM REACTOR TANK TO LOOP CORE CFNTER (in)
Fig. 15.3. Nuclear Heat Generation in Molten-Snlt Loop 2.
recovered during postirradiation d isassembly of t h e loop and from t h e fission product ac t iv i ty in t h e final s a l t samples , as d i scussed below.
Calculatioiis involving activity of type 304 s t a i n l e s s steel monitor wires or of fission products in s a l t samples required taking into account t h e relative flux history for t h e particular i so topc a s described in t h e sec t ion on activity calculation. Thermal neutron flux l eve l s ca lcu la ted from type 304 s t a i n l e s s s t e e l monitor w i r e s a t tached to various regions on t h e outs ide of t h e loop were (in uni t s of neutrons sec- '>: core sl iell , front, 4 .4 to 5.5 x front), 1 . 7 to 3.8 x 10¹³; cent ra l wel l i n core graphite, 2.7 to 3 . 4 x t o 1.9 x I O i 3 ; g a s separa t ion tank , 1 . 4 to 2.6 x 10 13. Applying a ca lcu la ted attenuation factor of 0.6 and a fuel b lackness factor of 0.8 t o a
cole she l l , bottom (rear t o
core she l l , rear, 1.4
T a b l e 15.2. Mean Neutron F l u x in Salt as Calculated
from F iss ion Product Act iv i ty
Flux Estimate (neutrons cm-' sec - ' )
Sample 23 Sample 26 __.__.I_._ Isotope
~ .... ... . . ... .. . . . .. . . . . . ... . ..... .-..... ..
10 '3 x 10¹³
30-y 1 3 7 C s (6.0%) 281-d 144Ce (5.6%)
65-d " 2 , (6.3%) 58.3-d 'lY (5.8%) 50.4-d "Sr (4.79%) 32.8-d 141Ce (6.Ouibj 12.8-d 140€3a (6.4%) 11.1-d 14'Nd (2.6%)
0.82 0.93
0.65 1.14 0.61 0.64 0.27 0.59
0.90 1.05 0.96 0.58 0.76 0.70 0.28 0.66
weighted mean monitor flux of 2.4 x 10¹³ resu l t s i n an estimated mean flux ava i lab le to t h e fuel of 1.15 10 '3 .
The flux was es t imated on t h e b a s i s of t h e activity of vari-ous fission products i n f inal salt samples a f te r accounting for t h e relative flux history of t h e s a l t . Tab le 15.2 shows flux es t i - mates based on t h e activity of a number of i so- topes tha t might b e expec ted to remain in t h e s a l t .
As is frequently t h e case, t h e flux es t imates based on f i ss ion product ac t iv i ty in s a l t samples a re somewhat lower than t h e va lues obtained in other ways. Generally, chemical separa t ions a r e used prior t o counting. Because of favorable half- l ives , well-established cons tan ts , low neutron c ross sec t ions , good separa t ions , and less inter- ference from other i so topes in counting, ' 37Cs, '44Ce, and "Zr a r e regarded as t h e more reliable measures of f i s s ions (or flux). The average of t h e flux es t imates for t h e s e three i so topes is 0.88 x
T h e r e su l t s from t h e different methods of e s t i - 1013.
mating flux a r e compared in Tab le 15.3. The value of 0.88 x IOi3 obtained from t h e fission product activity is t h e most direct measure of f i ss ions in t h e fuel, and, therefore, i t will b e u s e d in es t imates of t h e expec ted activity of o ther fission products produced in t h e h o p .
Evidence of corrosion w a s obtained from chemi- cal a n a l y s i s of s a l t s amples withdrawn from t h e
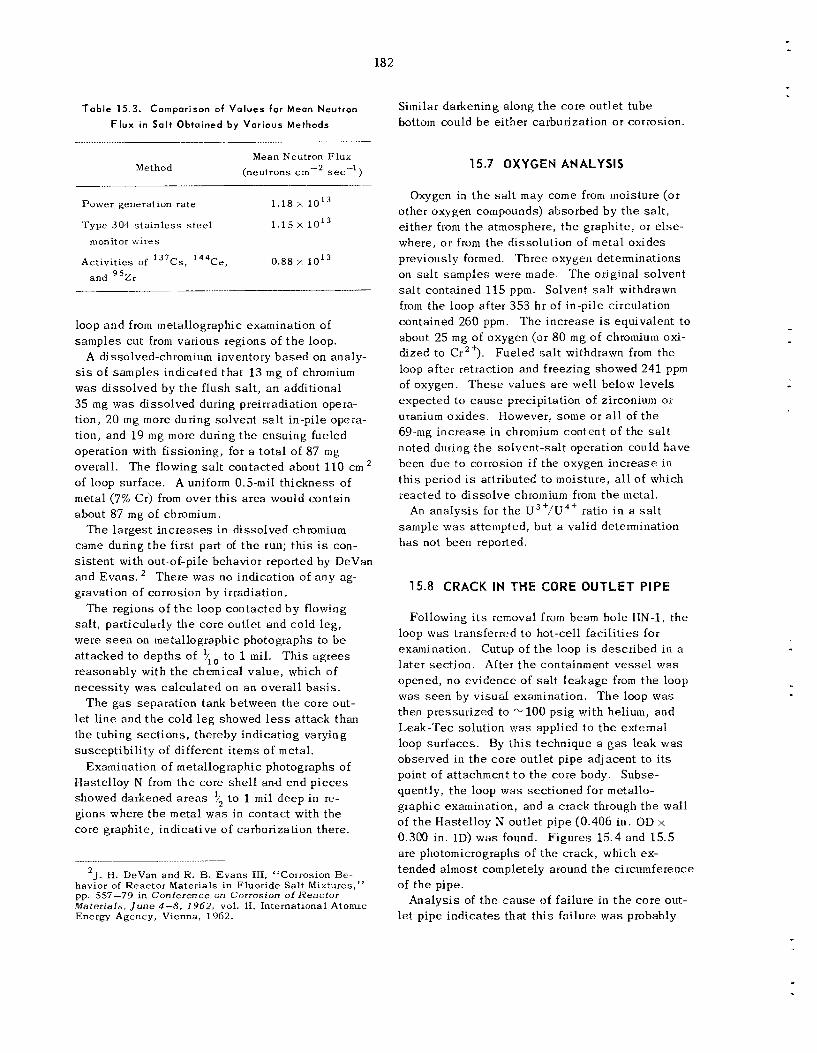
18 2
T a b l e 15.3. Comparison of Values for Meon Neutron
F l u x in Salt Obtained by Various Methods
Similar darkening along t h e core outlet tube bottom could b e either carburization or corrosion.
Mean Neutron Flux Method (neutrons cm-2 sec-')
15.7 OXYGEN ANALYSIS
Power generation rate
Type 304 s t a in l e s s s t ee l
1.18 x 10¹³
1.15 x 10¹³ monitor wires
Activit ies of 137Cs, 144Ce, 0.88 1013 and " 2 ,
loop and from metallographic examination of samples cut from various regions of t h e loop.
sis of samples indicated tha t 13 mg of chromium was d isso lved by t h e flush sa l t , a n additional 35 mg was dissolved during preirradiation opera- tion, 20 mg more during solvent salt in-pile opera- tion, and 19 mg more during t h e ensuing fueled operation with fissioning, for a t o t a l of 87 mg overall. The flowing s a l t contacted about 110 c m 2 of loop surface. A uniform 0.5-mil th ickness of metal (7% Cr) from over t h i s area would contain about 87 mg of chromium.
T h e la rges t i nc reases in d isso lved chromium came during t h e first part of t h e run; t h i s is con- s i s t en t with out-of-pile behavior reported by DeVan and Evans. There was no indication of a n y ag- gravation of corrosion by irradiation.
T h e regions of t h e loop contac ted b y flowing sa l t , particularly t h e core outlet and co ld leg , were s e e n on metallographic photographs to b e a t tacked to depths of \,, t o 1 mil. T h i s agrees reasonably with t h e chemical va lue , which of necess i ty was ca lcu la ted on an overall bas i s .
T h e gas separation tank between the core out- l e t l ine and t h e cold l eg showed l e s s attack than the tubing sec t ions , thereby indicating varying suscept ib i l i ty of different i t ems of metal.
Examination of metallographic photographs of Hastelloy N from t h e core she l l a d end p i eces showed darkened a reas v2 to 1 mil deep in re- gions where t h e metal w a s in contact with t h e core graphite, indicative of carburization there.
A dissolved-chromium inventory b a s e d on analy-
2J. H. DeVan and K. B. Evans 111, "Corrosion Be- havior of Reactor Materials i n Fluoride Salt Mixtures," pp. 557-79 in Conference on Corrosion of Reactor Materials, June 4-8, 1962, vol. 11, International Atomic Energy Agency, Vienna, 1962.
Oxygen in t h e s a l t may c o m e from moisture (or other oxygen compounds) absorbed by t h e sa l t , ei ther from t h e atmosphere, t h e graphite, or e l se - where, o r from the dissolution of metal oxides previously formed. Three oxygen determinations on s a l t samples were made. The original solvent s a l t contained 115 ppm. Solverit salt withdrawn from t h e loop after 353 hr of in-pile circulation contained 260 ppm. The inc rease is equivalent to about 25 mg of oxygen (or 8 0 mg of chromium oxi- dized to Cr2+). Fueled s a l t withdrawn from the loop after retraction and freezing showed 241 ppm of oxygen. T h e s e va lues a re well below l eve l s expected to c a u s e precipitation of zirconium OK uranium oxides . However, some or all of t h e 69-mg inc rease in chromium content of the s a l t noted during t h e solvent-salt operation could have been due to corrosion if t he oxygen inc rease in t h i s period is attributed to moisture, a l l of which reacted to d isso lve chromium from t h e metal.
An ana lys i s for t h e IJ3+ /U4+ ratio i n a s a l t sample was attempted, but a valid determination h a s not been reported.
15.8 CRACK IN THE CORE OUTLET PIPE
Following i t s removal from beam hole HN-1, t h e loop was transferred to hot-cell fac i l i t i es for examination. Cutup of t h e loop is described i n 3
l a te r sec t ion . After t h e containment ves se l w a s opened, no ev idence of sa l t l eakage from the loop was s e e n by v isua l examination. T h e loop was then pressurized to cv 100 ps ig with helium, and Leak-Tec solution was applied t o t h e external loop sur faces . By th i s technique a gas leak was observed in t h e co re outlet pipe ad jacent to i t s point of attachment t o t h e core body. Subse- quently, t h e loop was sec t ioned for metallo- graphic examination, and a crack through t h e wall of t h e Ilastelloy N outlet pipe (0.406 in. OD x 0.300 in. ID) w a s found. F igures 15.4 and 15.5 are photomicrographs of t h e crack, which ex- tended almost completely around t h e circumference of t h e pipe.
Analys is of t h e c a u s e of failure in t h e co re out- l e t pipe ind ica tes tha t t h i s failure w a s probably
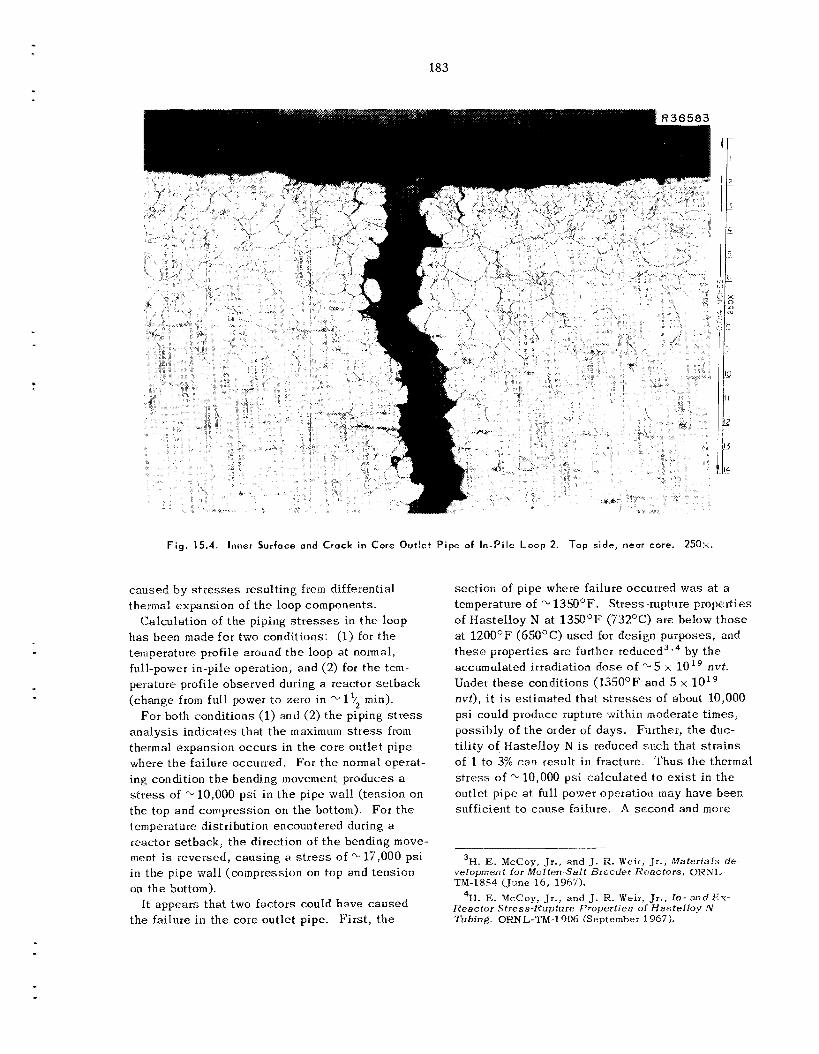
183
Fig. 15.4. Inner Surface and Crock in Core Outlet Pipe of In-Pile Loop 2. Top side, near core. 250~.
caused b y s t r e s s e s result ing from differential thermal expansion of t h e loop components.
h a s been made fo r two conditions' (1) for t h e temperature profile around t h e loop at normal, full-power in-pile operation, and (2) for t h e tem- perature profile observed during a reactor s e tback (change from full power to zero in - 1'/* min).
Fo r both conditions (1) and (2) t h e piping s t r e s s ana lys i s i nd ica t e s tha t t h e maximum s t r e s s from thermal expansion occur s in t h e core out le t p ipe where t h e failure occurred. For t h e normal operat- ing condition t h e bending movement produces a s t r e s s of cv 10,000 ps i i n t h e pipe wall (tension o n the top and compression on t h e bottom). temperature distribution encountered during a reactor se tback , t h e direction of t h e bending move- ment i s reversed, caus ing a s t r e s s of - 17,000 ps i in t h e pipe wall (compression on top and tens ion on the bottom).
I t appears tha t two fac tors could have caused t h e failure in t h e co re out le t pipe. F i r s t , t h e
Calculation of t h e piping s t r e s s e s in t h e loop
For t h e
sec t ion of pipe where failure occurred was at a temperature of 'v 1350OF. Stress-rupture properties of Has te l loy N at 13s0°P; (732OC) a re below those at 1200'F (65OOC) used for design purposes, and t h e s e properties are further reduced394 by t h e accumulated irradiation dose of -'5 x 10l9 nvt. Under t h e s e conditions (1350'F and 5 x l Q 1 9
nvt), i t is estimated tha t s t r e s s e s of about 10,000 psi could produce rupture wjthin moderatc t imes, possibly of t h e order of days . Further, t h e duc- t i l i ty of IIastelloy N i s reduced such that s t r a ins of 1 to 3% c a n result i n fracture. T h u s t h e thermal s t r e s s of -10,000 ps i ca lcu la ted to ex i s t in t h e outlet p ipe at full power nppration may have been sufficient t o c a u s e failure. A second and more
3H. E. McCoy, Jr., and J. R. Weir, Jr . , Materznf s d e velopnient for Molten-Salt Breeder Reactors, OHNL-- TM-1854 (.June 16, 1967).
Reactor Stress- l tupture Properties of Haste l loy N Tubing, ORNL-TM-1906 (September 1967).
'H. E. McCoy, Jr., and J. K. Weir, Jr . , In- n n d E x -
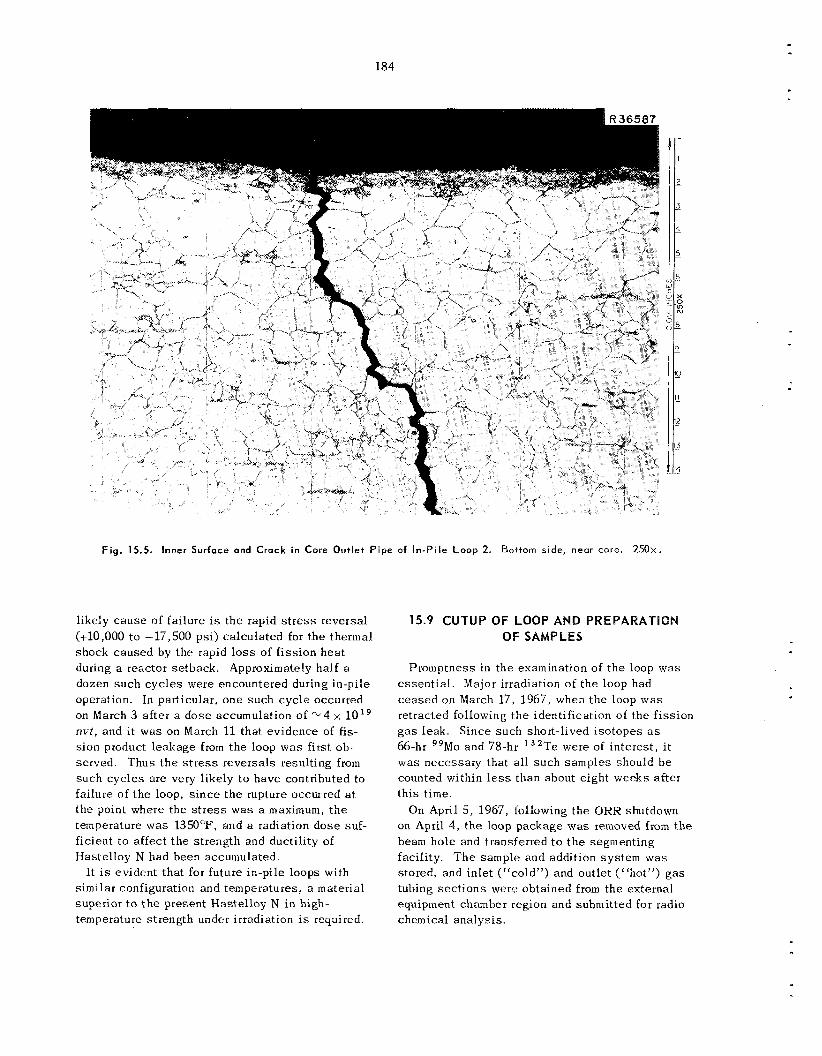
184
likely c a u s e of failure is t h e rapid s t r e s s reversal (+10,000 t o -17,500 psi) ca lcu la ted for t he thermal shock caused by the rapid loss of f i ss ion hea t during a reactor se tback . Approximately half a dozen s u c h cyc le s were encountered during in-pile operation. In particular, one such cyc le occurred on March 3 after a d o s e accumulation of 4 x 10 nvt, and i t w a s on March 11 that ev idence of fis- s ion product leakage from the loop was first ob- se rved . Thus t h e s t r e s s reversa ls resulting from such cyc le s a re very l ikely t o have contributed to failure of t he loop, s i n c e t h e rupture occurred at the point where the s t r e s s was a maxiinurn, t h e temperature w a s 135OoF, and a radiation dose suf - f icient to affect t h e strength and ductil i ty of Hastelloy N had been accumulated.
It i s evident that for future in-pile loops with similar configuration and temperatures, a material superior to t h e present Hastelloy N in high- temperature strength under irradiation is required.
Fig. 15.5. Inner Surface and Crack in Core Outlet Pipe of In -P i le Loop 2. Bottom side, neor core. 250~.
15.9 CUTUP OF LOOP AND PREPARATION OF SAMPLES
Promptness in the examination of t h e loop w a s e s sen t i a l . Major irradiation of the loop had c e a s e d on March 17, 1967, when t h e loop w a s retracted following t h e identification of the f i ss ion g a s leak. S ince such short-lived i so topes a s 66-hr "Mo and 78-hr '?'e were of in te res t , i t was necessary that a l l such samples should b e counted within less than about eight weeks after th i s time.
On April 5, 1967, following t h e ORR shutdown on April 4 , t h e loop package was removed from t h e beam hole and transferred t o t h e segmenting facil i ty. T h e sample and addition system w a s stored, and in le t ("cold") and outlet (''hot") g a s tubing sec t ions werc obtained from t h e external equipment chamber region and submitted for radio- chemical ana lys i s .
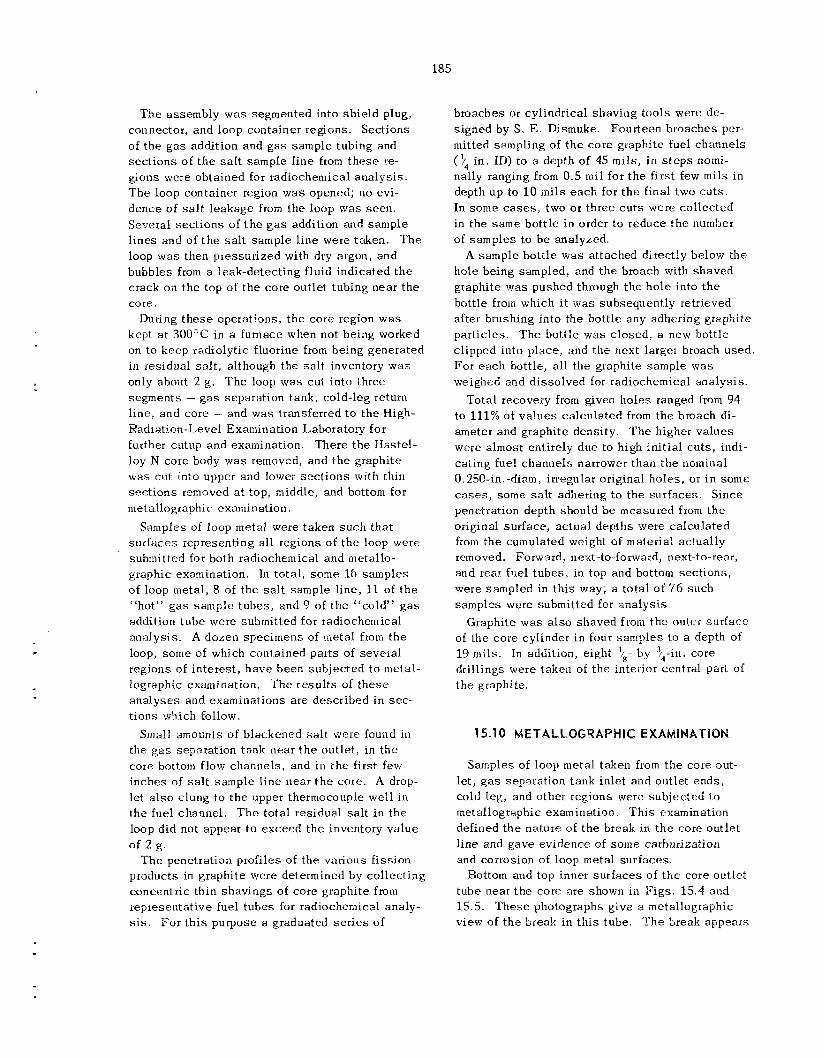
185
T h e assembly was segmented into sh ie ld plug, connector, and loop container regions. Sections of t h e g a s addition and gas sample tubing and sec t ions of t h e s a l t sample l i ne from t h e s e re- gions were obtained for radiocheniical ana lys i s . T h e loop container region w a s opened; no evi- dence of s a l t l eakage from t h e loop w a s seen . Several s ec t ions of t h e g a s addition and sample l i nes and of t h e s a l t sample l i ne were taken. T h e loop w a s then pressur ized wit.h dry argon, and bubbles from a leak-detecting fluid indicated t h e crack on the top of t h e core outlet tubing near t h e core.
During t h e s e operations, t h e co re region w a s kept a t 300°@ in a furnace when not being worked on to keep radiolytic fluorine from be ing generated in residual s a l t , although the s a l t inventory w a s only about 2 g. T h e loop was cut into three segments - g a s separation tank , cold-leg return l ine , and core - and was transferred to t h e High- Radiation-Level Examination Laboratory for further cutup and examination. There t h e Has te l - loy N core body w a s removed, and t h e graphite was cut into upper and lower sec t ions with thin sec t ions removed at top, middle, and bottom for metallographic examination.
Samples of loop metal were taken s u c h tha t su r f aces representing all regions of t h e loop were subiiiitted for both radiochemical and metallo- graphic examination. In to ta l , some 16 samples of loop metal, 8 of t h e s a l t sample l ine, 11 of t h e “hot” g a s sample tubes , and 9 of t h e “cold” g a s additiori tube were submitted for radiochemical ana lys i s . A dozen specimens of metal from t h e loop, some of which contained par t s of severa l regions of in te res t , have been subjec ted t o metal- lographic examination. T h e r e su l t s of t h e s e ana lyses and examinations are descr ibed in s e c - t ions which follow.
Small amounts of blackened s a l t were found in the g a s separation tank near t h e outlet , in t h e core bottom flow channels , and i n t h e first few inches of s a l t sample l ine near t h e core . A drop- let a l s o clung to t h e upper thermocouple wel l in t h e file1 channel. T h e to ta l residual s a l t i n t h e loop did not appear to exceed t h e inventory va lue
T h e penetration profiles of t h e various f i ss ion prodiicts in graphite were determined by co l lec t ing concentric th in shavings of core graphite from representative fue l tubes for radiocheiiiical analy- sis. For t h i s purpose a graduated series of
of 2 g.
broaches or cylindrical shaving tools were de- s igned by S. E. Dismuke. Fourteen broaches per- mitted sampling of t h e core graphite fuel channels ( v4 in . ID) to a depth of 45 m i l s , i n s t e p s nomi- nally ranging from 0.5 mil for t h e first few mils i n depth u p to 10 mils e a c h for t h e final two cu t s . In some cases, two o r th ree c u t s were co l lec ted in the same bot t le i n order t o reduce t h e number of samples to b e analyzed.
hole being sampled, and t h e broach with shaved graphite was pushed through t h e ho le into t h e bottle from which i t w a s subsequently retrieved after brushing into the bottle any adhering graphite particles. T h e bottle was c losed , a new bottle clipped into p lace , and t h e next larger broach used For each bottle, a l l t he graphite sample was weighed and d isso lved for radiochemical ana lys i s .
Total recovery from given ho le s ranged from 94 to 111% of va lues ca lcu la ted from t h e broach di- ameter and graphite density. T h e higher va lues were almost entirely due to high in i t ia l cu t s , indi- ca t ing fuel channels narrower than t h e nominal 0.250-in.-diam, irregular original ho les , or i n some cases, s o m e salt adhering to t h e sur faces . S ince penetration depth should b e measured from t h e original surface, actiial depths were ca lcu la ted from t h e cumulated weight of material ac tua l ly removed. Forward, next-to-forward, next-to-rear, and rear fuel t ubes , in top and bottom sec t ions , were sampled in t h i s way; a to ta l of 76 such samples were submitted far ana lys i s .
of t he core cylinder i n four s amples to a depth of 19 mils. In addition, eight dril l ings were taken of t h e interior central part of t h e graphite.
A sample bot t le w a s attached directly below the
Graphite w a s also shaved f r o m t h e outer sur face
by 3/,-in. core
Samples of loop metal taken from t h e core out- let, gas separation tank in le t and outlet ends , cold leg, and other regions were subjec ted to metallographic examination. T h i s examination defined t h e nature of t h e break in t h e core outlet l ine and gave ev idence of some carburization and corrosion of loop metal sur faces .
tube near t h e core are shown in F igs . 15 .4 and 15.5. T h e s e photographs g ive a metallographic view of t h e break i n t h i s tube. ‘The break appears
Bottom and top inner su r faces of t h e core outlet
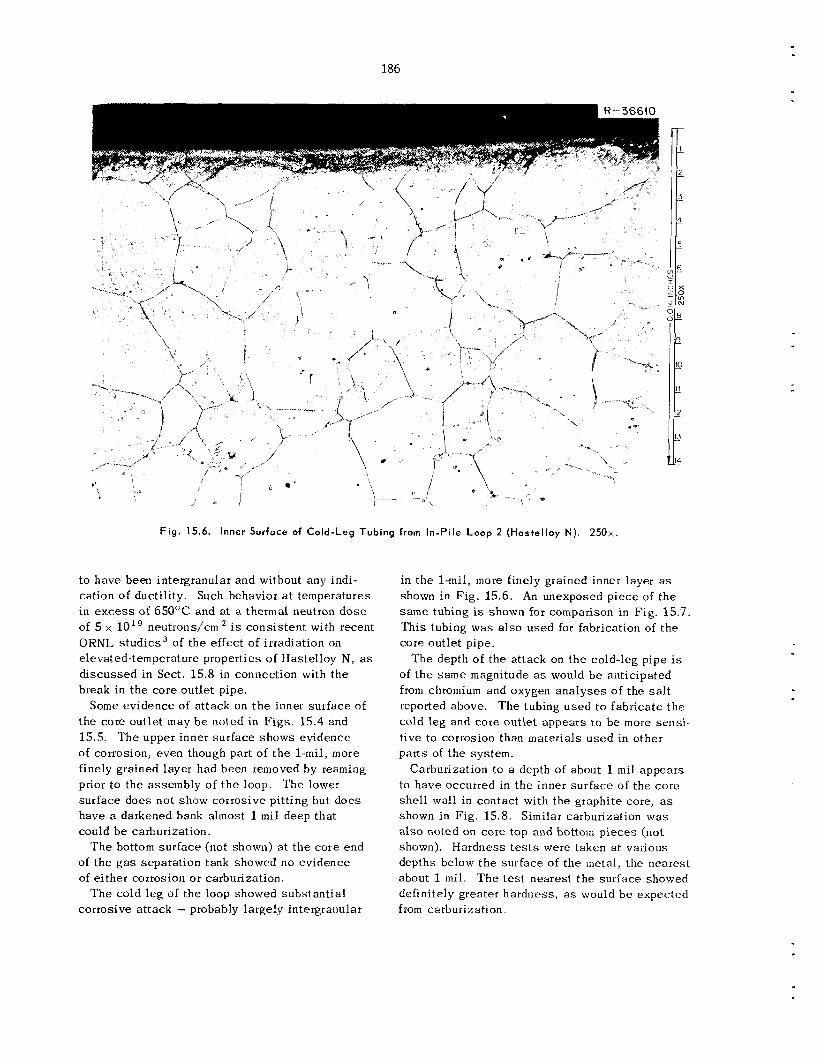
186
F i g . 15.6. Inner Surfoce of Co ld -Leg Tubing from In-Pi le Loop 2 (Hastel loy N). 250x.
t o have been intergranular and without any indi- cation of ductility. Such behavior a t temperatures in e x c e s s of 650°C and at a thermal neutron d o s e of 5 x lo1’ neutrons/cm2 is cons is ten t with recent ORNL s tud ie s3 of t h e effect of irradiation on elevated-temperature properties of Hastelloy N , as d i scussed in Sect. 15.8 in connection with t h e break in t h e core outlet pipe.
the core outlet may b e noted in F igs . 15.4 and 15.5. T h e upper inner sur face shows ev idence of corrosion, even though part of t h e 1-mil, more finely grained layer had been removed hy reaming prior t o t h e assembly of t h e loop. The lower sur face does not show corrosive pit t ing but does have a darkened bank almost 1 m i l deep tha t could b e carburization.
of the g a s separation tank showed no ev idence of either corrosion or carburization.
T h e cold l eg of t h e loop showed subs tan t ia l corrosive a t tack - probably largely intergranular
Some evidence of attack on t h e inner sur face of
T h e bottom sur face (not shown) at t h e core end
in the 1-mil, more finely grained inner layer as shown i n F ig . 15.6. An unexposed p iece of t h e s a m e tubing is shown for comparison in F ig . 15.7. Th i s tubing was also used for fabrication of t h e core outlet pipe.
T h e depth of the attack on t h e cold-leg pipe is of t h e same magnitude as would b e anticipated from chromium and oxygen ana lyses of the s a l t reported above. T h e tubing used to fabr ica te t h e cold leg and core outlet appears t o b e more sensi- tive to corrosion than materials u sed in o ther par t s of t h e system.
to have occurred in t h e inner sur face of the co re she l l wall in contact with t h e graphite core, a s shown in Fig. 15 .8 . Similar carburization was a l so noted on core top and bottom p ieces (not shown). Hardness t e s t s were taken a t various depths below t h e sur face of t h e metal, t he neares t about 1 mil. T h e t e s t nearest t h e sur face showed definitely greater hardness, as would b e expected from carburization.
Carburization to a depth of about 1 mil appears
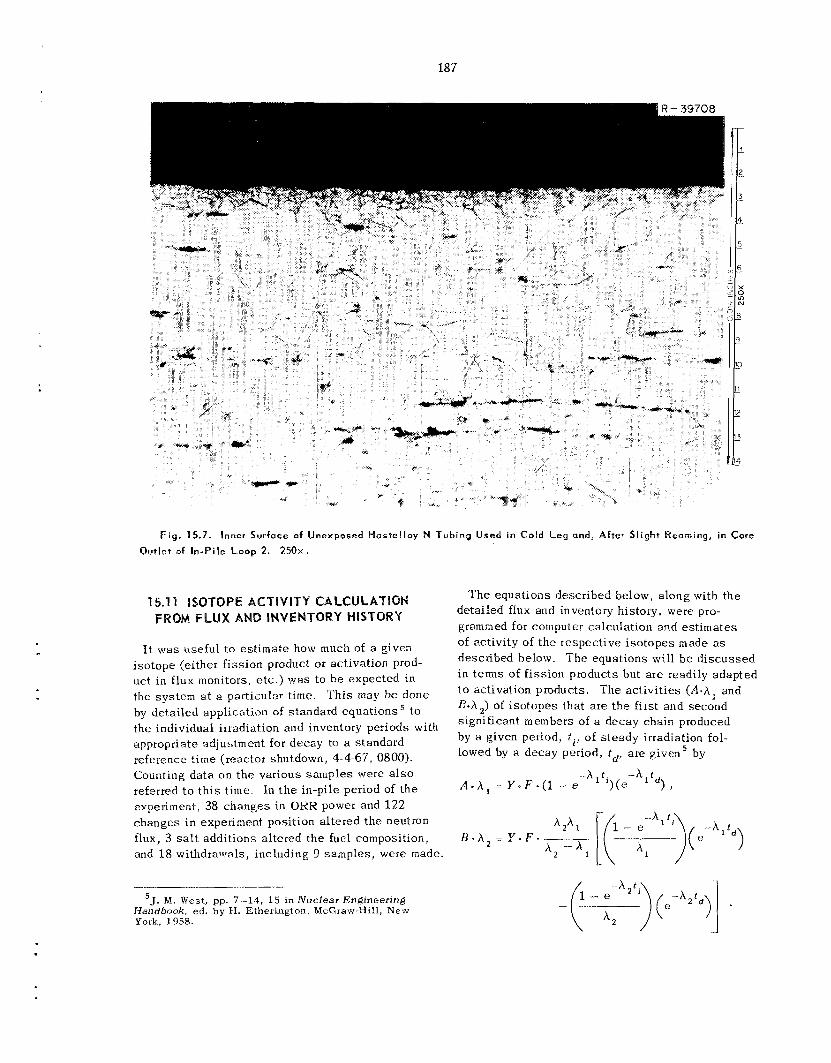
187
.-
F i g . 15.7. Inner Surface of Unexposed Wostelloy N Tubing Used in Cold Leg and, After Sl ight Reaming, in Cora Owtlet of In-Pile l o o p 2. 250~.
I t was useful to es t imate how much of a given i so tope (either f i ss ion product or activation prod- uc t in flux monitors, e t c . ) w a s to b e expected i n the system at a particular time. T h i s may be done by de ta i led application of standard equat ions to the individual irradiation and inventory periods with appropriate adjustment for decay to a standard reference t ime (reactor shutdown, 4-4-67, 0800). Counting da ta o n t h e various samples were a l s o referred to t h i s t ime. In t h e in-pile period of t h e experiment, 38 changes in ORR power and 122 changes i n experiment posit ion a l te red the neutron flux, 3 salt additions altered t h e fuel composition, and 18 withdrawals, including 9 samples , were made.
'J. M. W e s t , pp. 7-14, 15 in Nriclear Engineering Handhook, ed. by €I. Etheritigton, McGraw-Hill , N e w York, 1958.
T h e equat ions described below, a long with t h e detailed flux and inventory history, were pro- grammed for computer calculation and es t imates of activity of t h e respec t ive i so topes made as described below. T h e equations will b e d i scussed in terns of f i ss ion products but a re readily adapted t o activation products. The ac t iv i t ies ( A - A , and B-A,) of i so topes that a re t h e f i r s t and second significant members of a decay chain produced by a given period, ti, of s t eady irradiation fol- lowed by a decay period, t d , are given' by
--A t -A r A . X , = Y . F - ( 1 - e " ) ( e '),
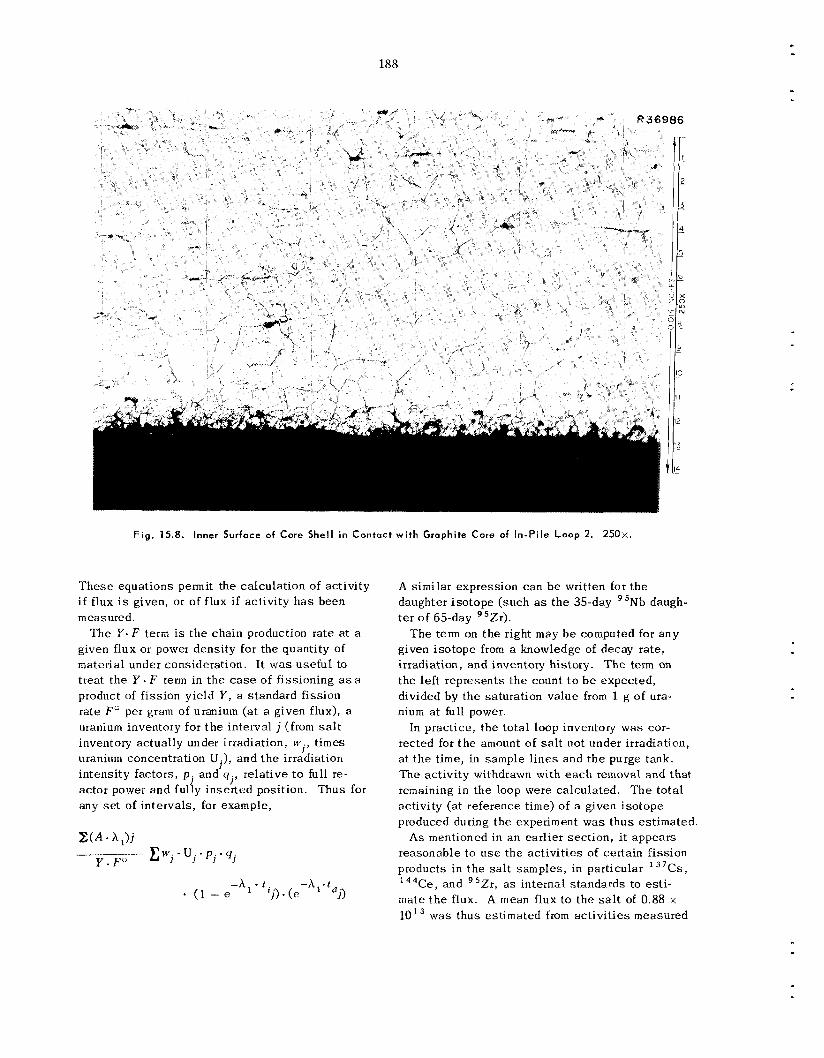
188
Fig. 15.8. Inner Surface of Core Shell in Contact wi th Graphite Core of In-Pile Loop 2. 2 5 0 ~ .
T h e s e equations permit t he calculation of activity i f flux i s given, or of flux i f activity h a s been measured.
given flux or power dens i ty for the quantity of material under consideration. I t was usefu l to treat t he Y . F term in t h e case of fissioning as a product of f i ss ion yield Y , a standard fission rate F" per gram of uranium (at a given flux), a uranium inventory for t h e interval j (from salt inventory actually under irradiation, w ., t imes uranium concentration U .), and t h e irradiation intensity factors, p . and q . , relative to full re- ac tor power and fully inser ted posit ion. Thus for any s e t of in te rva ls , for example,
The Ys F term i s t he chain production rate at a
I
I
1 1
- A , * t -A . t - ( 1 - e ' j ) . ( e ' d j )
A similar expression c a n b e written for t he daughter i so tope ( such a s t h e 35-day t e r of 65-day "Zr).
given i so tope from a knowledge of decay rate, irradiation, and inventory history. T h e term on the left represents t h e count to b e expected, divided by t h e saturation va lue from 1 g of ura- nium a t full power.
In practice, t he to ta l loop inventory was cor- rected for t h e amount of s a l t not under irradiation, a t t h e time, in sample l i nes and t h e purge tank. The activity withdrawn with e a c h removal and that remaining in the loop were calculated. T h e to ta l activity (a t reference time) of a given isotope produced during t h e experiment w a s thus estimated.
A s mentioned in an earlier sec t ion , it appears reasonable to use the ac t iv i t ies of certain fission products in t h e s a l t samples , in particular 37Cs , ' 44Ce , and "Zr, as internal s tandards to esti- mate t h e flux. A mean flux to t h e salt of 0.88 x 10'
5Nb daugh-
T h e term on t h e right may b e computed for a n y
was thus estimated from ac t iv i t ies measured
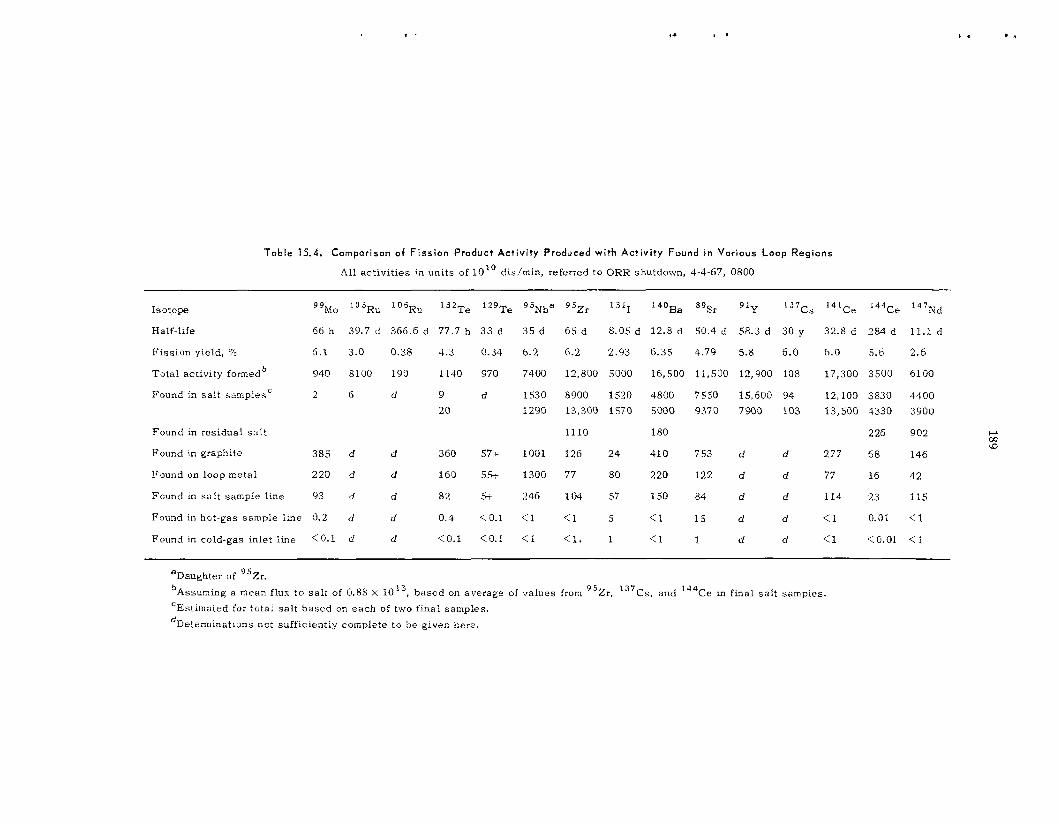
Table 15.4. Comparison of Fission Product Act ivi ty Produced with Act iv i ty Found in Various Loop Regions
A l l activit ies i n units of 10" disimin, referred to ORR shutdown, 4-4-67, 0800
99&*" 103Ru 132 12QTe 9SNbe 95zr 1311 140Ba 89sr Y I y 137cs 14lC, 144Ce 147pjd Isotope
Half-life 66 h 39.7 d 366.6 d 77.7 h 3 3 d 35 d 65 d 8.05 d 12.8 d 50.4 d 58.3 d 30 y 32.8 d 254 d 11.1 d
Fiss ion yield, YO 6.1 3.0 0.38 4.3 0.34 6.2 6.2 2.93 6.35 4.79 5.8 6.0 6.0 5.6 2.6
Total activity formedb 940 8100 190 1140 970 7400 12.800 5000 16,500 11,500 12,900 108 17,300 3500 6100
Found in sa l t samples' 2 6 d 9 d 1530 8900 1520 4800 7550 15,600 94 12,100 3830 4400 20 i290 13,300 1570 5000 9370 7300 103 13,500 4330 3900
Found in residual sal t 1110 1 80 226 902
d 277 68 146 Found in graphite 385 d d 360 57-1- 1001 126 24 410 753 d
Found on loop metal 220 d d 160 5% 1300 77 80 220 122 d d 77 16 42
Found in sal t sample line 93 d d 82 -5t 246 104 57 150 84 d d 114 23 115
0.01 il
< I (0.01 < I
Found in hot -gas sample h e '5.2 d d 0.4 (0.1 < 1 <1 5 < 1 15 d d < I
Found in cold-gas inlet l ine <0.1 d d <0.1 <0.1 < I <l, 1 (1 1 d d
aDaughter of "2,. 'Assuming a mean flux t o sa l t of 0.88 X
CEstimated for :otai s a l t based on each of two final samples. dDetzrrriinations not sufficiently complete to b e given here.
based on average of values from 95Zr, I3'Cs, and '"Ce in final s a l t samples.
190
on final s a l t samples . 'This value w a s used in calculating to ta l activities. of t h e various i so- topes produced in t h e experiment.
15.12 ISOTOPE ACTIVITY BALANCE
T h e calculations above provide a n es t imate of the amount of i so tope to b e accounted for. W e can es t imate how much was actually found in a kind of "isotope activity ba lance" by accounting for all regions of t h e loop in terms of t h e measured activity of samples .
For the various samples of metal, graphite, and s a l t obtained from the loop, activity determina- t ions for t h e 15 i so topes shown in 'Table 15 .4 were requested. determined. Because of t h e short half-life of such i so topes as "Mo and promptly as poss ib le , and o thers were deteimined later. complete. The available da ta will b e examined in temis of activity ba lances for t h e respec t ive i so topes and t h e penetration profiles of t hese i so topes in graphite.
T h e ratio of t h e area of each loop (or fuel channel) region t o the sample representing t h e region was determined so tha t t h e total loop area was accounted for in terms of samples . T h e cumulative ac t iv i ty of a l l shavings from a graphite channel sec t ion was used a s t h e sample from tha t channel . T h e sample ac t iv i t i e s multiplied by the proper ratios have been to ta led for each i so tope under the ca tegor ies of graphite, loop metal, s a l t sample l i nes , g a s l i nes , and s a l t . T h e s e va lues , plus va lues for s a l t based on t h e final sample ac t iv i t ies , are shown in Table 1 5 . 4 . Estimated total ac t iv i t ies from the ca lcu la t ions based on irradiation and inventory history a re a l s o shown.
From Table 15 .4 i t may b e s e e n that over half (and generally less than a l l ) t h e expected activity appeared to be accounted for i n the cases of 99Mo,7 132're, 95Nb, 95Zr, *'SI, 1 3 7 C s , 141Ce, ' 44Ce , and 147Nd. A subs tan t ia l propohion, although l e s s than half, was accounted f o r in the cases of 14'Ba and I 3 ' I . Inasmuch as iodine readily vola t i l i zes from all samples , without doubt espec ia l ly from the powdered graphite, i t i s to b e expected tha t iodine determinations sha l l b e low. Determinations a r e not yet complete in the cases of l o 3 R u , '06Ru, ''''re, "Y, and 137cs.
T h e concentration of ' 35U was a l s o
'Te, t h e s e were run as
Resu l t s for some i so topes a r e not yet
Molybdenum, tellurium, and ruthenium are almost entirely departed from the s a l t , along with sub- s tan t ia l proportions of 89Sr, 95Nb, 14'Ba, and most probably 13'I . Except for 89Sr and possibly
40Ba, which favor graphite, t h e s e elements show no strong preference for graphite or metal but seem to deposit on whatever sur face i s available. The alkali-metal and rare-earth i so topes , includ- ing "Y, 137Cs , 141Ce, 144Ce , and 147Nd, and also "Zr, remain aImost completely in t he s a l t , the amounts found in graphite generally being ascribed to s a l t contained in t h e samples , a s d i scussed la te r
15.13 URANIUM-235 0 GRAPHITE SAMPLES
Uranium-235 on the various graphite and metal samples was a l so determined. technique was u s e d in which delayed neutrons were counted; i t i s s ens i t i ve to l e s s than 1 pg of 235U. T h e determinations served t h e dual purpose of rneasuting small quantit ies of s a l t which could have adhered to su i f ace samples and of determining t h e penetration of uranium in one form or another into t h e graphite.
In seven of t h e eight graphite channels f rom which samples were taken, t h e quantity of 2351J ranged from 1 . 6 to 2 .8 mg (per 8.3 to 9.5 c m '> with over half being found within the f i r s t mil and over 80% generally within the first 3 mils. However, some uranium was detected even in the 35- to 45-mil cu ts . T h e first sample f rom t h e remaining channel weighed 290 mg and contained 18 .9 mg of 2 3 5 U , equivalent to 190 mg of fuel sa l t . 'The samples from deeper cu t s contained uranium a t l eve l s only moderately higher than those from other channels . probably contained a small p iece of fuel s a l t which had remained o n t h e sur face .
X-ray diffraction patterns obtained from t h e sur face of a specimen of graphite cu t from a n exit fuel channel sur face showed patterns of L i 'Bel?, and Li $rF6, with n o indication of oxides or uranium compounds. Such a pattern is characterist ic of normally frozen fuel s a l t , so t hese observations indicated tha t fuel s a l t had adhered to t h e graphite sur face even though not directly visible under ordinary hot-cell viewing conditions.
An activation
Thus , i t appears tha t t h i s sample
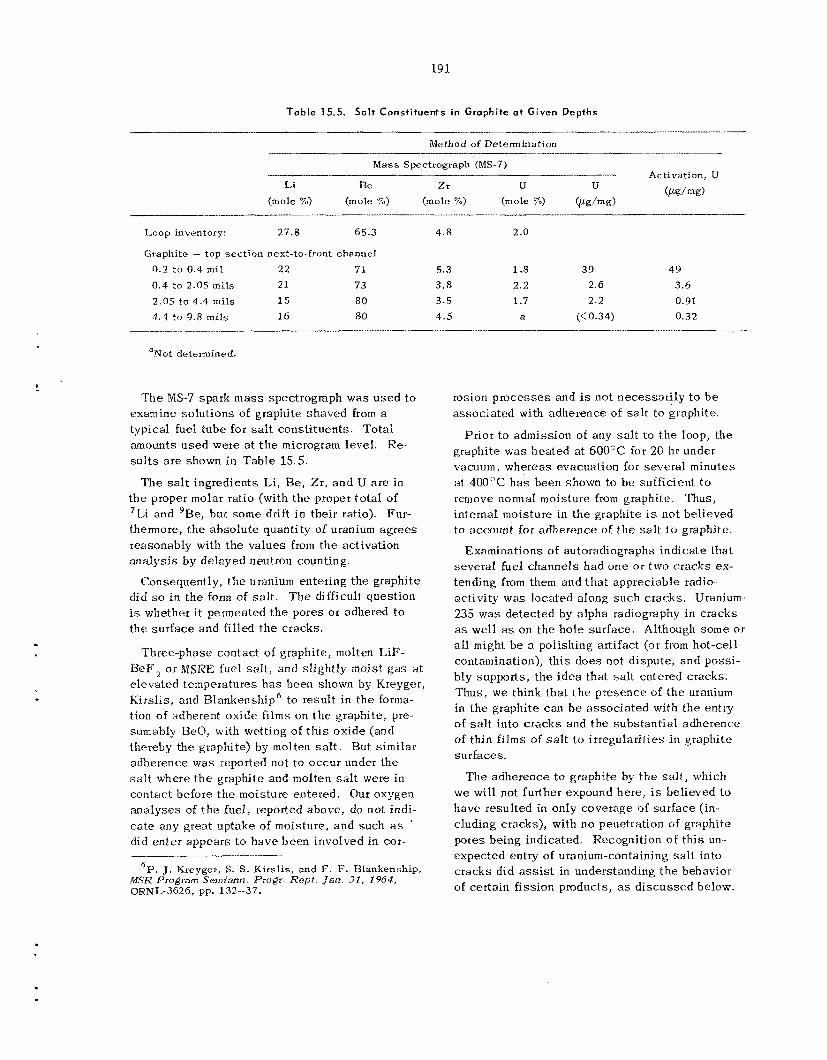
19 1
T a b l e 15.5. Salt Constituents in Graphite a t Given Depths
-_I_
Method of Determination
Mass Spectrograph (MS-7)
Li Be Zr U IJ (mole 70) (mole %) (mole 70) (mole 70) @g/mg)
- Activation, U
(pLg/md
Loop inventory: 27.8 65.3 4.8 2.0
Graphite - top sec t ion next-to-front channel 0.2 t o 0.4 mil 22 71 5.3 1.8 39 49 0.4 to 2.0.5 mils 21 7 3 3,s 2.2 2.6 3.6 2.0.5 to 4.4 mils 15 80 3.5 1.7 2.2 0.91 4.3 to 9.8 m i l s 16 80 4.5 a (< 0.34) 0.32
aNot determined.
T h e MS-7 spark m a s s spectrograph w a s used to examine solutions of graphite shaved from a typical fuel tube for salt cons t i tuents . Total amounts u sed were a t t h e microgram level. s u i t s a r e shown in TabIe 15.5.
Ke-
The s a l t ingredients Li, Re, Zr, and U a re in the proper molar ratio (with the proper to ta l of 71Ai and 'Be, bu& some drift i n their ratio). thennore, t he absolu te quantity of uranium agrees reasonably with the values from the activation ana lys i s by delayed neutron counting.
did so in the forin of sa l t . T h e difficult question is whether i t permeated t h e pores o r adhered to the sur face and filled the cracks.
Fur-
Consequently, t h e uranium entering the graphite
Three-phase contact of graphite, molten LiF- HeF, or MSRE fuel s a l t , and slightly moist gas a t elevated temperatures h a s been shown by Kreyger, K i r s l i s , and BIankenship6 t o result in the forma- tion of adherent oxide films on t h e graphite, pre- sumably BeO, with wetting of t h i s oxide (and thereby the graphite) by molten s a l t . But similar adherence w a s repotted not to occur under the s a l t where t h e graphite and molten salt were in contact before the moisture entered. Our oxygen ana lyses of t h e fuel, reported above, do not indi- cate any great uptake of moisture, and such a s ' did en ter appears t o have been involved in cor-
'E'. J. Kreyger, S. S. Kj t s l i s , and F. F. Blankenship, MSR Program Semiann. Progr. Rcpl . Jan. 31, 1964, ORNL-3626, pp. 1 3 2 - 4 7 .
rosion p rocesses and is not necessar i ly t o b e assoc ia ted with adherence of sa l t to graphite.
Prior to admission of any salt to t h e loop, the graphite was hea ted a t 600°C f o r 20 hr under vacuum, whereas evacuation for severa l minutes a t 400'jC h a s been shown to b e sufficient to remove normal moisture from graphite. Thus, internal moisture in the graphite is not believed to account for adherence of the sa l t t o graphite.
Examinations of autoradiographs indicate tha t severa l fuel channels had one O K two cracks ex- tending from them and tha t appreciable radio- activity was located along such craclts. Uranium- 235 w a s detected by alpha radiography i n c racks as wel l as on the ho le surface. Althoggh some o r all might b e a polishing artifact (or from hot-cell contamination), th i s does not dispute, and possi- bly supports, t he idea that s a l t entered cracks. Thus, we think !.hat t h e presence of t he uranium in the graphite can b e assoc ia ted with the entry of s a l t into c racks and t h e subs tan t ia l adherence of thin f i l m s of salt t o irregularit.ies in graphite s u r faces.
The adherence to graphite by t h e sa l t , which we will not further expound here, is believed to have resulted in only coverage of surface (in- cluding cracks), with no penetration of graphite pores being indicated. Recognition of th i s un-- expected entry of uranium-containing s a l t into cracks did a s s i s t in understanding t h e behavior of certain f i ss ion products, as d i scussed below.
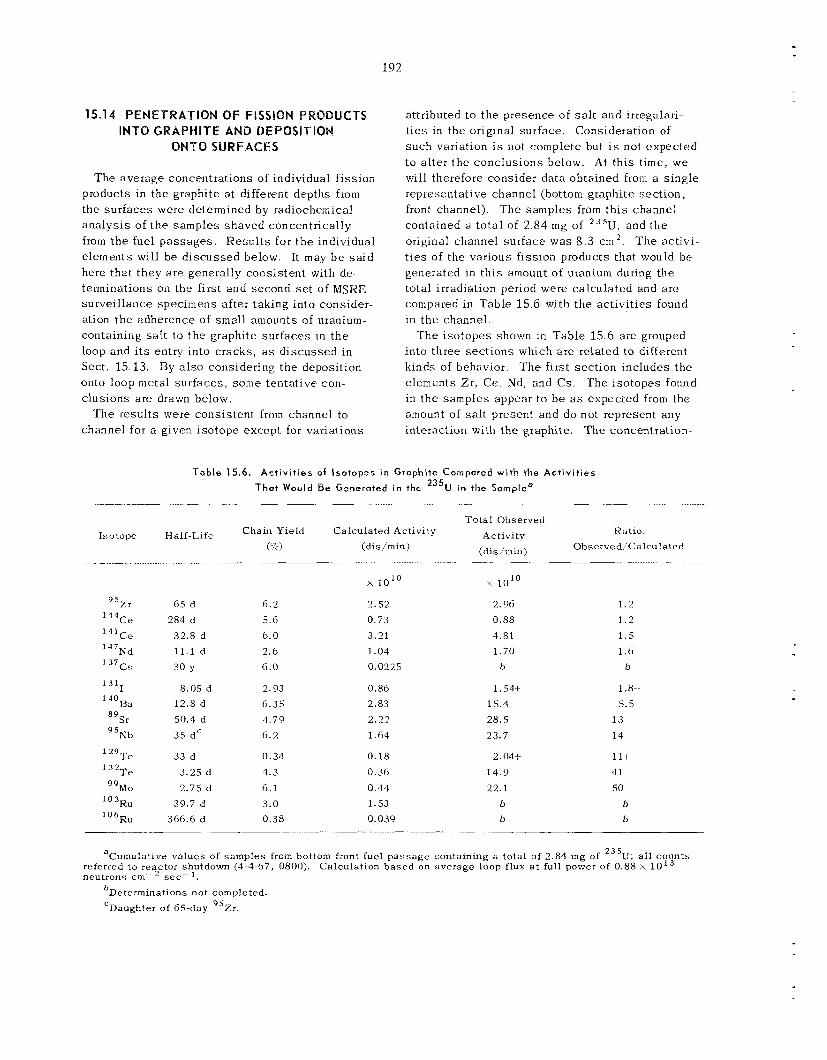
q
9
I'ZZ 6'81
+PO'Z
L'FZ S'8Z b.S 1
+PS ' I
Y OL'1
18 'P
88'0 96'2
0101
6€0'0
ES'I PP'O 9F'O 81'0
P9'1 ZZ'Z E8'Z 98'0
SZZO'Q PO'I 1Z.F EL'O
ZS'Z
0101
8F'O O'F
1.9 € '1..
PF'O
Z '9 6L'P SF'9 €6'2
0'9 9'Z 0'9 9's 2'9
P 9'99E P L'6F
P SL'Z P SZ.F
P FF
>P SF P P'OS P 8'ZI
P S0'8
.c OF P 1.11
P 8'ZF P 082 P c9
193
depth profile of t h e s e i so topes (plotted s e m i - logarithmically) para l le l s that of t h e uranium in the graphite. course, had to remain mostly in t h e s a l t because it necessar i ly mingled with t h e 5 mole 76 of Z r in the s a l t i t se l f .
T h e next group of e lements (I , B a , Sr, and Nb) shows an appreciably greater activity in the samples than can b e accounted for by t h e amount of uranium present. T h e s e e lements (except possibly 'Nb) also show concentration-depth profiles t ha t do not fall off nearly as rapidly as does t h e uranium concentration. Such behavior h a s been descr ibed by Kedl' and o thers (based on MSRE surve i l lance specimen da ta obtained by Kirslis) as being due to gaseous transport of t h e i so tope or a short-lived precursor. Niobium-95 could ex i s t as a volati le pentafluoride, 89Sr h a s a 3-min krypton precursor, and "OB, h a s a 16-sec xenon precursor. Iodine-131 is included in th i s group, s i n c e iod ine vola t i l i zes readily from sam- p les , and the t rue va lues should doubt less b e higher than those reported.
T h e comparatively flat profiles (except fo r t h e first mil or two) imply rapid transport through pores in t h e graphite without very strong tendency for adherence t o graphite sur faces . Niobium-95, t h e profile of which is not as flat as t h e o thers , appeared to be adsorbed appreciably on t h e graph- i t e sur face , though not as strongly as e lements of the group t o follow.
'The third group conta ins e lements Te , Mo, and Ru. (The inclusion of mthenium is a guess , at present, b a s e d on MSRE surve i l lance specimen s tud ie s by Kirs l i s , s i n c e our da t a a re incomplete for t h e ruthenium iso topes . ) T h i s group is charac- terized by t h e h ighes t concentrations in t h e sam- ples , relative t o t h e uranium present. T h e con- centration-depth profiles a re even s teeper than for uranium. It appears evident t h a t t h e s e ele- ments a r e strongly adsorbed by graphite su r faces and are a b l e to penetrate c racks readily, e i ther by rapid diffusion in t h e salt in t h e crack o r by sur face diffusion. They do not tend to penetrate bulk graphite pores t o a comparable degree. The highes t concentration of 99M0 and 'Te pe r un i t of surface, either graphite o r metal, w a s reported for the Has te l loy N thermowell i n t h e front core
F i s s ion product zirconium, of
'R. J . Kedl , A Model for Computing the M i g r a t i o n s of Very Short-Lived Noble Gases in to M S N E Graphite, O K N L - T M - ~ ~ ~ ~ (July 1967).
fuel channel. T h i s impl ies that t he e lements i n t h i s group tend to depos i t on the first sur face en- countered, whether metal o r graphite.
15.15 GAMMA IRRADIATION OF FUEL SALT IN THE SOLID PHASE
T h e fuel s a l t i n molten-salt in-pile loop 2 w a s kept frozen at temperatures generally above 300'C for a number of days before the sa l t w a s re- moved from t h e loop. At temperatures below 100°C, fission product or gamma radiolysis of fluoride s a l t is known to result in t h e generation of fluorine g a s to appreciable pressures . Fluorine could oxidize various s p e c i e s (U, Wo, Ku, Nb, etc.) to produce vola t i le fluorides which could then b e transported to other patts of t h e sys tem. Al- though a temperature of 3Q0°C was expected t o b e m o r e than adequate to suppres s such radiolysis completely, direct da ta were not ava i lab le but appeared readily obtainable. Since t h e phenome- non is also of general in te res t in t h e MSR program, the experiment descr ibed below was undertaken.
Solid MSR fuel s a l t ( L i F - B e F ,-ZrF,-UF,, about 65-28-5-2 mole %) from t h e s tock used to supply fuel for in-pile loop 2 was subjec ted to very-high-intensity gamma irradiation in a spent HFIR fuel element at a temperature of 320°C to determine poss ib l e radiation e f f ec t s on the s a l t and i t s compatibil i t ies with graphite and Has te l - loy N.
For t h e irradiation experiment, HFIR fuel e l e - ment 9 was placed in a s torage rack i n the HFIR pool, and the experiment assembly w a s placed in t h e center of t h e fuel element as shown in F ig . 15.9. T h e capsule- type irradiation assembly cons is ted of a Ilastelloy N capsule , 0 .93 in . OD x 0.78 in. ID x 3.5 in. long, containing two CGB graphite tes t spec imens , 3 . 0 x 0.87 x 0.125 in . , p laced back to back in t h e capsule . 'I'wenty- five grams of fue l s a l t was added to t h e capsule , melted, and then allowed to solidify. A pressure transducer was connected to t h e g a s s p a c e above the sa l t , and t h e capsu le assembly w a s welded shut . A hea ter assembly using Nichrome V heater wire surrounded t h e capsule , and thermocouples were located in the capsu le wal l to monitor tem- peratures. The experiment assembly was then placed in an aluminum container to i so la te i t from t h e pool water, as shown in F ig . 15.10.
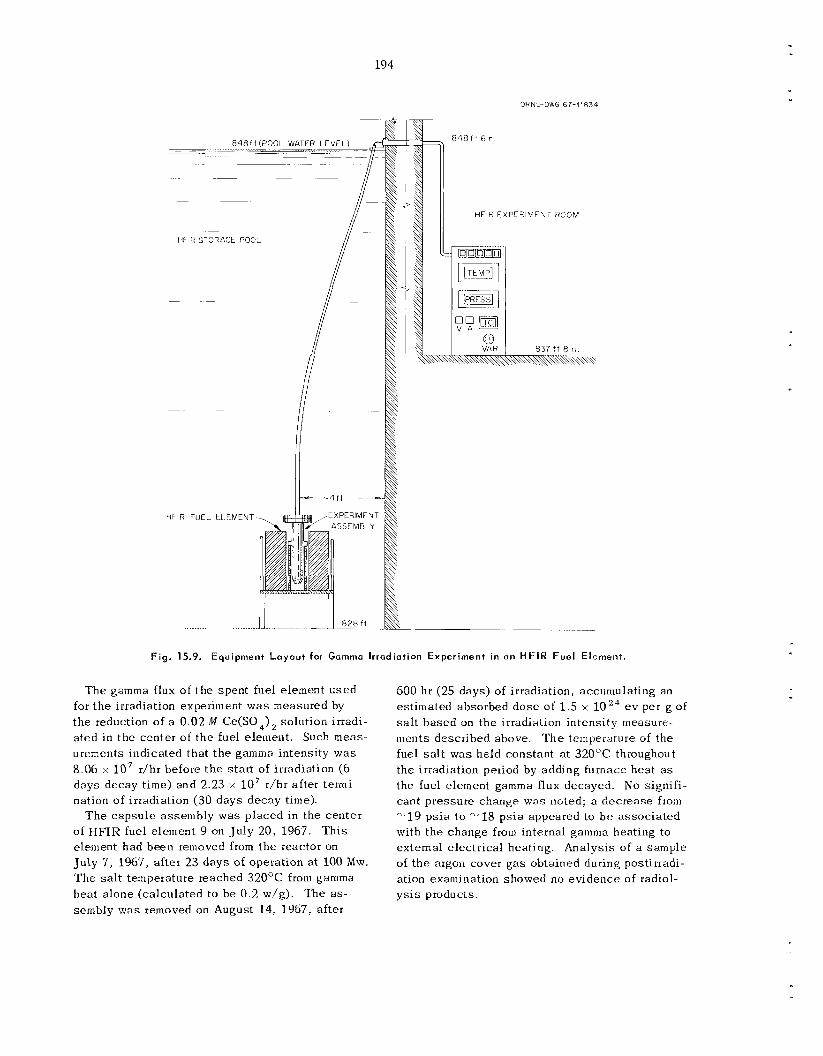
194
ORNL-DMIG 67-11834
HFIR FUEL ELLEMENT ,EXPERIMEUT
Fig. 15.9. Equipment Layout for Gamma Irradiation Experiment in an HFIR F u e l Element.
T h e gamma flux of t h e spent fuel element u s e d for t h e irradiation experiment w a s measured by the reduction of a 0.07. M Ce(SO,), solution irradi- a t ed in t h e center of t h e fuel element. Such m e a s - urements indicated that t h e gamma intensity w a s 8.06 x lo7 d h r before t h e s ta r t of irradiation (6 days decay time) and 2.23 x I O 7 r/hr after t e m i - nation of irradiation (30 days decay time).
of HFIR fuel element 9 on July 20, 1967. Th i s element had been removed from t h e reactor on July 7 , 1967, after 23 d a y s of operation at 100 Mw. T h e s a l t temperature reached 32OOC from gamma hea t a lone (calculated to be 0.2 w/g). The a s - sembly w a s removed on August 14, 1967, after
T h e capsu le assembly was p laced in the cen te r
600 hr (25 days) of irradiation, accumulating an estimated absorbed d o s e of 1 . 5 x s a l t based on the irradiation intensity measure- ments described above. T h e temperature of t he fuel s a l t was held constant a t 320GC throughout t h e irradiation period by adding furnace hea t as the fucl element gamma flux decayed. N o signifi- cant pressure change was noted; a dec rease from -19 ps ia to I-u 18 ps i a appeared to b e a s soc ia t ed with the change f r o m internal gamma heating to external e lec t r ica l heating. Analys is of a sample of t h e argon cover g a s obtained during postirradi- ation examination showed no ev idence of radiol- y s i s products.
e v per g of
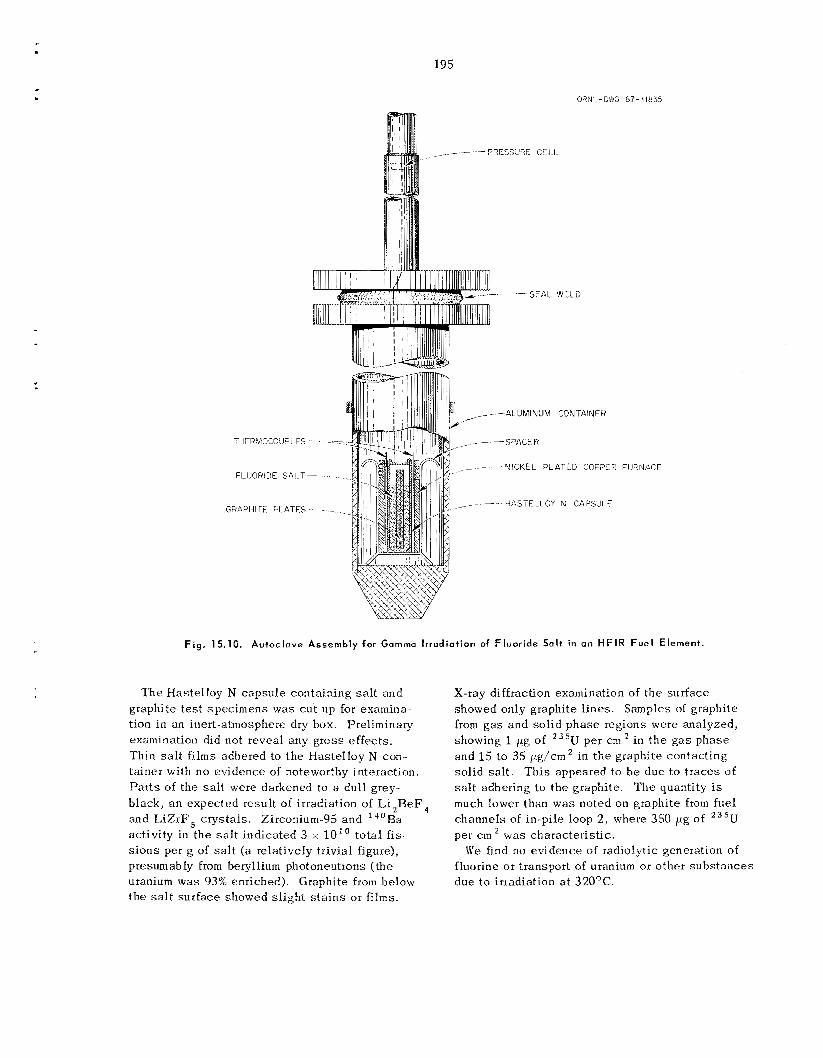
195
SEAL WFLD
-SPACER
Fig. 15.10. Autoclave Assembly for Gamma lrrodiation of Fluoride Salt in an HFlR F u e l Element.
T h e Hastelloy N capsu le containing s a l t and graphite test spec imens was cu t up for examina- tion i n an inert-atmosphere dry box. Preliminary examination did not reveal any gross e f fec ts . Thin s a l t f i l m s adhered to t h e Hastelloy N con- tainer with no ev idence of noteworthy interaction. Parts of the s a l t were darkened to a dull grey- black, a n expected result of irradiation of L i ,ReF , and L iZrF , c rys ta l s . Zirconium-95 a n d "Ba activity in the salt indicated 3 x 10" to ta l f i s - s i o n s per g of s a l t ( a relatively trivial figure), presurnab ly from beryllium photoneutrons ( the uranium was 93% enriched). t h e s a l t sur face showed s l igh t s t a i n s or f i lms .
Graphite from below
X-ray diffraction examination of t h e sur face showed only graphite l i n e s Samples of graphite from g a s and so l id phase regions were analyzed, showing 1 pg of 235U per cm * in t h e g a s phase and 15 to 35 pg/cm in t h e graphite contacting so l id sa l t Th i s appeared to be due to t r aces of s a l t adhering to the graphite much lower than w a s noted on graphite from fuel channels of in-pile loop 2, where 350 pg of 2 3 5 U per c m w a s characterist ic.
W e find no ev idence of radiolytic generation of fluorine or transport of uranium or other subs t ances due to irradiation a t 32OoC.
Thc quantity is

terial t H. E. McCoy J. R. W e i r
Our materials program h a s been concerned both with the operation of the MSRE and with t h e de- velopment of materials for an advanced MSBR. 'The primary role of the materials program in the operation of the MSRE h a s been a surveil lance program in which we follow the property changes of the MSRE graphite and Hastelloy N as the reactor operates, We have surveil lance fac i l i t i es in the re- actor core and on the outs ide of the core tank.
T h e success fu l operation of the MSRE h a s strengthened our confidence in the molten-salt r e -
actor concept, and we have init iated a materials program in support of an MSBR. In th i s reactor t he graphite will be a primary structural material, s i n c e i t s epa ra t e s the breeder and the fuel s a l t s . Hastelloy N wil l be the metall ic structural material, and i t will be necessary to develop a joint between graphite and Has te l loy N. search effort is concerned with the structural ma- terials, graphite and Hastelloy N, and the jo in t be- tween thcm.
Thus, most of our re.
16. AA
16.1 GENERAL DESCRIPTION OF THE SURVEILLANCE FACILITY AND
OBSERVATlONS ON SAMPLES REMOVED
W. H. Cook
The ef fec ts of the operational environments of the MSKE on its unclad moderator of grade CGB graph- i te and i t s structural alloy of Hastelloy N continue to be monitored periodically with surveil lance spec i - mens of these materials. The surveil lance assembly , the general sampling schedule , and the examination program have been described previously.
stringer RS2, h a s been removed from the core a f te r accumulating peak fast- ( E > 0.18 M e V ) and thermal- neutron d o s e s of approximately 1 x l o z 1 and 4 x lo2 neutrons/cm2 respectively. T h e s e specimens were subjec ted to a temperature of 1190 +_ 18OF for 5500 hr. T h e first group of ves se l specimens,
The second group of reactor core specimens,
' M S R Program Semiann. Progr. R e p t . Aug. 3 1 , 1965, ORNL-3872, pp. 87-92.
stringer X1, w a s a l s o removed. The peak thermal- neutron dose on t h e s e is approximately 2.5 x 10' ' neutrons/cm2. 'The estimated temperature range on these specimens w a s 900 to 1200°F, and the time a t temperature w a s approximately 11,000 hr. Init ial results of examination of these groups have not re- vealed any unexpected or ser ious effects. T h e s e two groups have been replaced with new s e t s of specimens which a r e being exposed in the MSRE environments together with other groups that were not sampled a t t h i s time.
To review briefly, the reactor core surve i l lance specimens cons i s t of both graphite and Has te l loy N mounted approximately 3 in. away from, and parallel with, the axia l cen ter l ine of the moderator core. The reactor v e s s e l specimens a re Hastelloy N mounted approximately 4'5 in. outside the reactor vesse l . T h e reactor core spec imens a re exposed to the molten fluoride fuel, and the reactor ves se l specimens a re exposed to the nitrogen-2 to 5 vol % oxygen atmosphere of t he reactor containment cell. The result is that the current and future irradiation
196
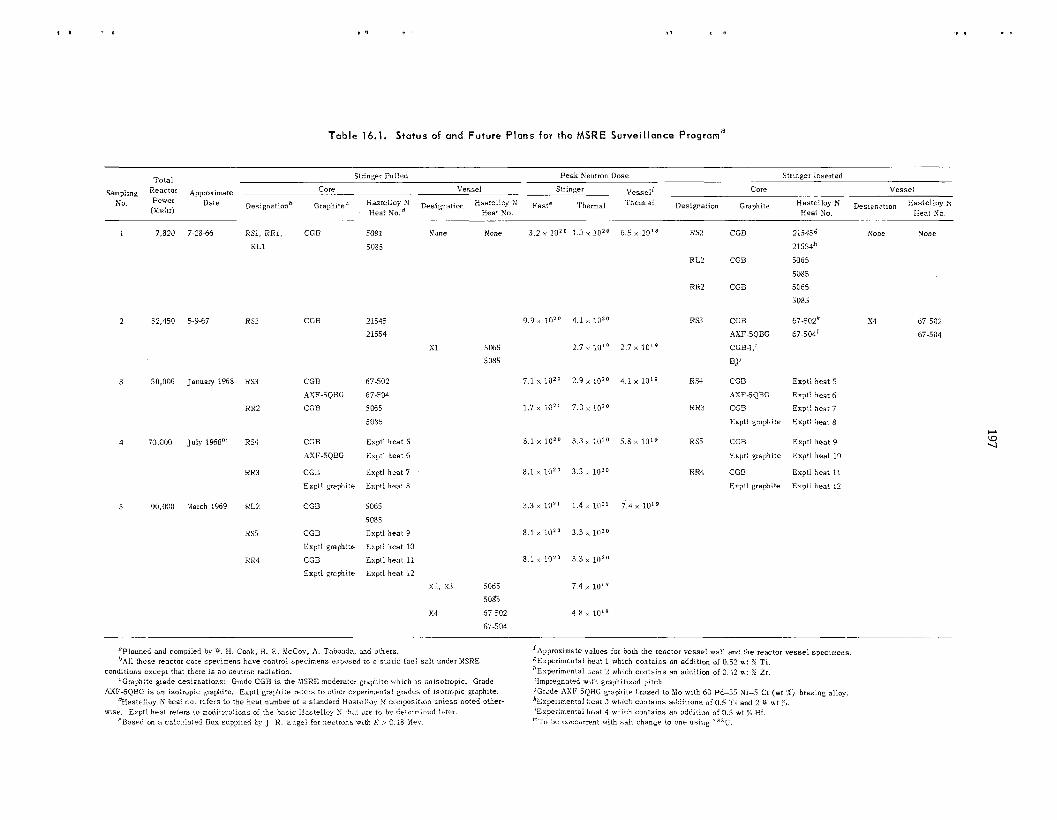
, ? P
Table 16.1. Status of and Future Plans for the MSRE Surveillance Program"
Stringer Inserted Stringer Pulled Peak Heutron Dose Tota l Sampiing Approximare Core Vesse l Stringer \lessel' Core Vesse l
Designarion Graphite Hasteiloy Desigcation hastelioy Heat No.d Heat ?lo. Heat No. Heat No
Nu Power Date Des:gnatlonb Gral,h,tec Has1e:loy ?J Designation Hsstelloy N Faste i-hermaI Thermai (Mwhr)
I 7,820 7-28-56
2 32,450 5-9-67
3 50,000 January 1968
4 Ti),@OO J u l y 1 9 6 P
5 90.000 March 1969
~~ ~~ .--
None 3.2 x lozo 1.5 x lozo RS1, R R I , CGB mi None
RL1 5085
RSZ
RS3
RX2
RS4
RR3
RL2
H S 5
KR4
CGB 21545
21554
X1 5065
5085
CGR 67-502
A S r - j g S G 67-504 CGY 5 0 6 5
5085
CGB Exptl heat 5
AXF-5QSG Exptl heat 5
CGB Exptl heat 7 Exptl graphite Exptl hea: 3
CGB 5065
5085
CGB Exptl heat 9
Expil graphi:e Exptl heat 10
CGB Expti heat 11 Exprl graphite Expil heat 12
x2, x3
):4
9.9 x 1OZo 4.1 x IOzo
2.7 10'9
7.1 x l o z o 2.9 x 10"
1.7 x i o 2 ' 7.0x i o z o
8.1 x 1 0 2 0 3.3 x 10²⁰
3.1 x IO2' 3.3 x io2'
3.3 1 0 2 1 1.4 i n * '
8.1 x iozo 3.3 x l o z o
3 3 x 10²⁰
5065 7.4 x 10'0
5085
57-532 4.8 x 10'0
8.1 x 1 0 2 0
67.504
6.5 x RS2 CGB 215458 Xone None
21554h XL2 CCB 5065
5085
RR2 CGB 5065
5085
RS3 CGB 67-5OZk x4 67-502
AXF-5QBG 67-504' 67-504
2.7 1019 CGB-I,'
BJ'
4.i x loi9 RS4 CGB Exptl heat 5
AXF-SQBG Expti heat 6 Exp:i sea: 7
Exptl graphite Expt; !heal 8
Exptl hea: 9
RRS CGB
RS5 CGB 5.6 x 10¹⁹
Expt: graphite Exptl heat 10
Exptl heat 11 Erpt l grephite Exp!l heat I:!
R R 4 CGB
7.4 x 10'9
'Planned and compi!ed by a. H. Cook, 13. E. licCoy, A. Taboada, and others. bAll these reactor core specmens have control spec inens exposed io a s ta t ic fuei S ~ C under MSRE
.Graphite grade designations: Grade CGB 1s the MSRE moderator graphite which IS anisotropic. Grade
'Has:e::oy N hcat no. :efers to the heat number of a standard H a s t e h y M composition unless noted other-
"Based on a cdcula ted iiux sup:,lied by J . H. Engei for nrulmns wtth E > 0.13 Llev
conditions rrctp that there i s n o neutroi: radiation.
AXF-5QBG is s n isotropic graphite. Enptl graphi:e iefers t o otber experin;entaI grades of isotropic graphite.
w.se. Enptl heat refers i o modifications of the basic Ilasteiloy N :ha! are to bo detuinined later.
'Api)rormate values :or both the reactor vesse? wa!! and the reactor vesse l specmens . CExperimental heat 1 which contains an addltion of 0.52 w t :; TI. 'Experimcntai heat 2 which contains an addition of 0.42 w: % Zr. 'Impregnated with graphjtlzed pitch. :Grade AXF-5QBG grapiitr Lrazed to $10 xi th GO Pd-35 XI-5 Cr (wt % j brazing alloy. kExper inec td hear 3 which conta ins a3di:lans oiO.5 Ti and 2 IU wt $. 'Exgeiimental heat 4 which contains an addition of 0.5 W: % Hf.
"To bP c ~ n c ~ i r r m t with sa l t change to one using 2 3 3 U .
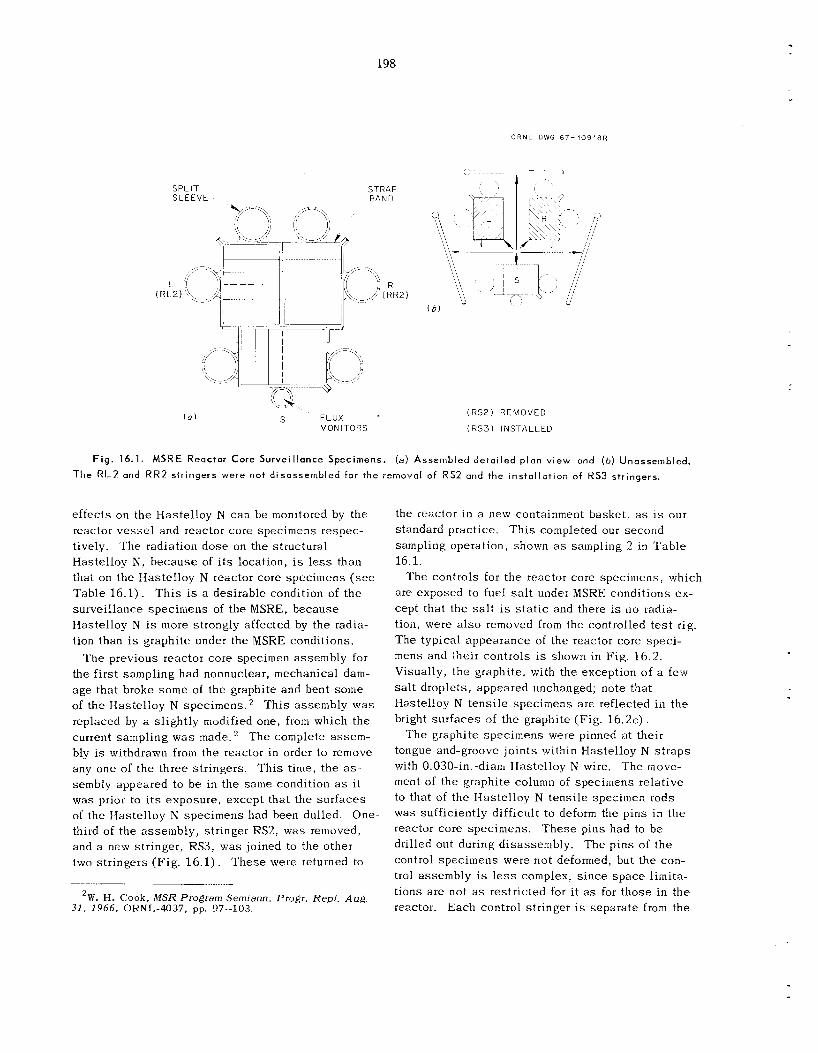
198
O R N L - O l V G 67 -10918R
SPLIT STRAP S L E E V E BAND
( a ) S FLUX MONITORS
i R S 2 ) R E M O V E D
( R S 3 ) I N S - I A L L E D
F i g . 16.1. MSRE Reactor Core Surveillance Specimens. (a) Assenibled detai led p lan v iew and ( b ) Unassambled. The RI-2 and R R 2 stringers were not disasserrlbled for the removal of RS2 and the insta l la t ion of RS3 stringers.
e f fec t s on the Hastelloy N can be monitored by the reactor ves se l and reactor core specimens respec- tively. 'The radiation dose on the structural Hastelloy N, because of i t s location, is l e s s than that on the Has te l loy N reactor core spec imens ( s e e Table 16.1). T h i s i s a desirable condition of t he surveil lance specimens of the MSRE, because Hastelloy N i s more strongly affected by the radia- tion than i s graphite under the MSRE conditions.
'The previous reactor core specimen assembly for the f i r s t sampling had nonnuclear, mechanical dam- age that broke s o m e of the graphite and bent s o m e of the Hastelloy N spec imens .2 T h i s assembly w a s replaced by a s l igh t ly modified one, f rom which the current sampling w a s made. * The complete a s s e m - bly is withdrawn from the reactor in order to remove any one of the three stringers. T h i s time, the a s - sembly appeared to be in t he s a m e condition a s i t was prior to i t s exposure, except that the su r faces of the I-Iastelloy N specimens had been dulled. One- third of the assembly , stringer RS2, was removed, and a new stringer, RS3, vias joined to the other two stringers (Fig. 16 .1 ) . T h e s e were returned to
2W. H. Cook, M S R Program Semiann. Progr . Rept . Aug 3 1 , 1966, OKNL-4037, pp. 97---103.
the reactor in a new containment basket, as i s o u r standard practice. T h i s completed our second sampling operation, shown as sampling 2 in Tab le 16.1.
are exposed to fuel s a l t under MSRE conditions ex- cept that the s a l t i s s t a t i c and there is n o tadia- tion, were also removed from the controlled t e s t rig. The typical appearance of the reactor core spec i - mens and the i t controls is shown in Fig. 16 .2 , Visually, t he graphite, with the exception of a few s a l t droplets, appeared unchanged; note that Hastelloy N tens i le spec imens a re reflected i n the bright su r f aces of the graphite (Fig. 1 6 . 2 ~ ) .
tongue-and-groove jo in ts within Hastelloy N s t r aps with 0.030-in.-diam Hastelloy N wire. The move- ment of the graphite column of specimens re la t ive to that of the Hastelloy N tens i le specimen rods w a s sufficiently difficult to deform the pins i n t he reactor core specimens. 'These pins had to b e drilled out during disassembly. The p ins of the control spec imens were not deformed, but the con- trol assembly is less complex, s ince s p a c e limita- t ions a re not as restricted for it as for t hose i n the reactor. Each control stringer is separa te f rom the
, \ 1 he controls for t he reactor core specimens, which
T h e graphite specimens were pinned a t their
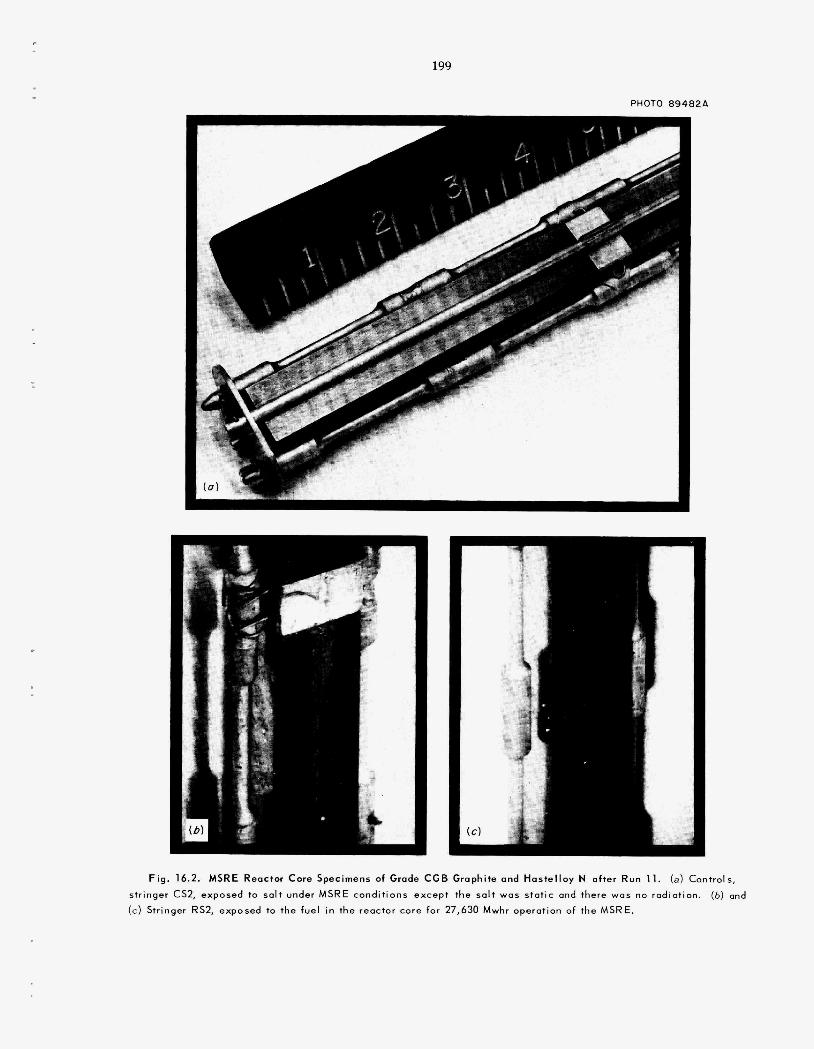
c
199
PHOTO 894824,
A
7
8
P
F ig . 16.2. MSRE Reactor Core Specimens of Grade CGB Graphite and Haste l loy N after Run 11. (a) Controls,
stringer CS2, exposed to sal t under MSRE condit ions except the salt was stat ic and there was no rodiation.
(c) Stringer RS2, exposed to the fuel in the reactor core for 27,630 Mwhr operation of the MSRE. (6) and
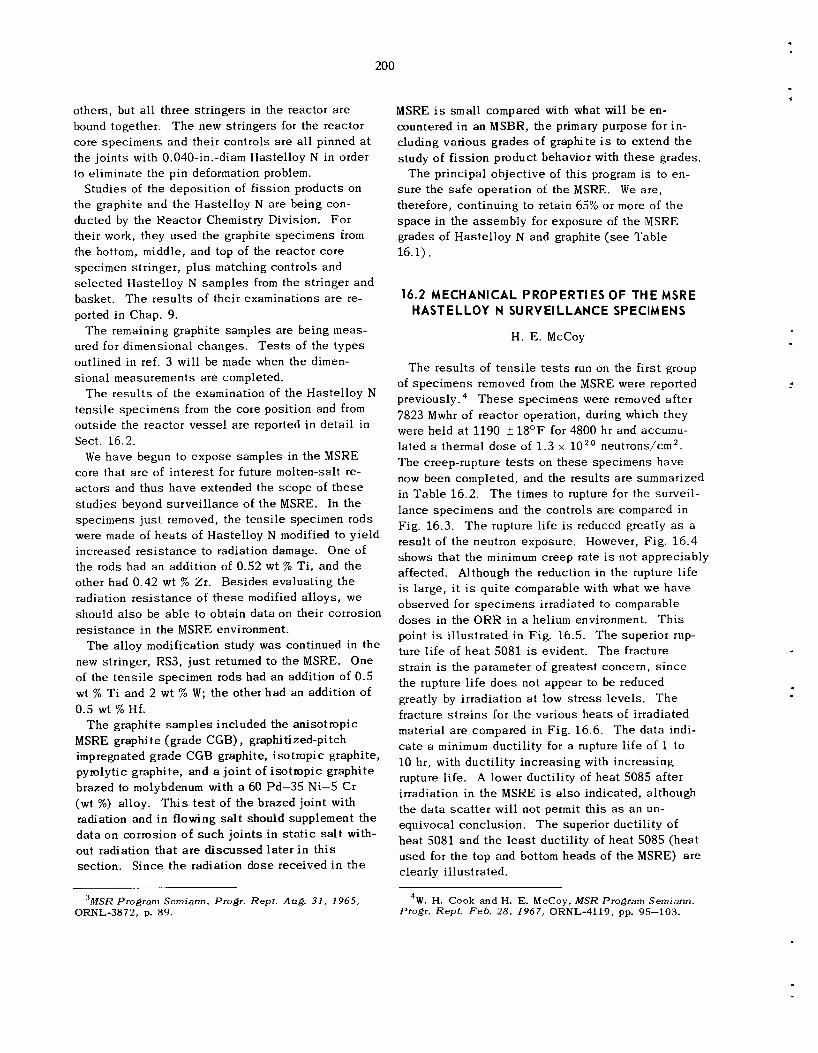
200
others, but a l l three s t r ingers in the reactor are bound together. T h e new stringers for the reactor core specimens and their controls a r e a l l pinned at the jo in ts with 0.040-in.-diam Hastelloy N in order to eliminate the pin deformation problem.
Studies of the deposit ion of fission products on the graphite and the Has te l loy N are being con- ducted by t h e Reac tor Chemistry Division. Fo r their work, they used the graphite specimens from the bottom, middle, and top of the reactor core specimen stringer, p lus matching controls and se lec ted Has te l loy N samples from the stringer and basket. T h e r e su l t s of their examinations a r e re- ported in Chap. 9.
T h e remaining graphite samples a re being meas- ured for dimensional changes . T e s t s of the types outlined in ref. 3 will b e made when the dimen- s iona l measurements a re completed.
t ens i le specimens from the core position and from outside the reactor v e s s e l a r e reported in de ta i l i n Sect. 16.2.
W e have begun to expose samples in the MSRE core that a r e of in te res t for future molten-salt re- ac tors and thus have extended the scope of t h e s e s tud ies beyond surve i l lance of the MSRE. In the specimens j u s t removed, the tens i le specimen rods were made of h e a t s of Hastelloy N modified to y ie ld increased r e s i s t ance to radiation damage. One of the rods had an addition of 0.52 wt % T i , and the other had 0.42 wt % Zr. Bes ides evaluating the radiation r e s i s t ance of t h e s e modified alloys, we should also be ab le to obtain da t a o n their corrosion res i s tance in the MSRE environment.
T h e alloy modification study was continued in the new stringer, RS3, j u s t returned to the MSRE. One of the t ens i l e specimen rods had a n addition of 0.5 wt % Ti and 2 wt % W; t h e other h a d a n addition of 0.5 wt % Hf.
T h e graphite s amples inc luded the anisotropic MSRE graphite (grade CGB), graphitized-pitch impregnated grade CGB graphite, i so t ropic graphite, pyrolytic graphite, and a j o in t of i so t ropic graphite brazed to molybdenum with a 60 Pd-35 Ni-5 Cr (wt %) alloy. Th.is t e s t of t h e brazed joint with radiation and in flowing salt should supplement t h e da t a on corrosion of such jo in t s i n s t a t i c s a l t with- out radiation tha t a r e d i scussed l a t e r i n this section. S ince t h e radiation d o s e received i n t h e
T h e resu l t s of the examination of the Has te l loy N
3MSR Program Semiann. Progr. R e p t . Aug. 31, 1965, ORNL-3872, p. 89.
MSRE is small compared with what will b e en- countered i n an MSBR, t h e primary purpose for in- cluding various grades of graphite is to extend the study of f i ss ion product behavior with t h e s e grades.
T h e principal ob jec t ive of th i s program is to en- sure the safe operation of the MSRE. W e a re , therefore, continuing to retain 65% or more of the s p a c e in the assembly for exposure of the MSRE grades of Has te l loy N and graphite (see Tab le 16.1).
16.2 MECHANICAL PROPERTIES OF THE MSRE HASTELLOY N SURVEILLANCE SPECIMENS
H. E. McCoy
T h e r e su l t s of t ens i l e tests run on the f i r s t group of specimens removed from the MSRE were reported previously. T h e s e specimens were removed af te r 7823 Mwhr of reactor operation, during which they were he ld a t 1190 k 18'F for 4800 hr and accumu- lated a thermal d o s e of 1 . 3 x 10'' neutrons/cm2. T h e creep-rupture t e s t s on these spec imens have now been completed, and the resu l t s a r e summarized in Tab le 16.2. T h e t imes to rupture for the surveil- l ance specimens and the controls a r e compared in Fig. 16.3. T h e rupture life is reduced greatly as a result of the neutron exposure. However, F ig . 16 .4 shows that t he minimum creep rate is not appreciably affected. Although the reduction in the rupture life is large, i t is qu i t e comparable with what we have observed for specimens irradiated to comparable doses in the ORR in a helium environment. T h i s point is i l lus t ra ted in Fig. 16.5. T h e superior rup- ture life of h e a t 5081 is evident. T h e fracture strain is the parameter of grea tes t concern, s i n c e the rupture l i fe d o e s not appear to be reduced greatly by irradiation a t low s t r e s s levels. T h e fracture s t r a ins for t h e various hea t s of irradiated material a r e compared in Fig. 16.6. T h e da ta indi- c a t e a minimum ductil i ty for a rupture l i fe of 1 to 10 hr, with duc t i l i ty increas ing with increas ing rupture l ife. A lower ducti l i ty of hea t 5085 af te r irradiation in t h e MSRE i s also indicated, although the da t a sca t t e r will not permit this as a n un- equivocal conclusion. T h e superior ducti l i ty of hea t 5081 and the l e a s t ducti l i ty of hea t 5085 (hea t used for t he top and bottom heads of the MSRE) a r e clearly i l lustrated.
4W. H. Cook and H. E. McCoy, MSR Program Semiann. Progr. R e p t . Feb . 28 , 1967, ORNL-4119, pp. 95-103.
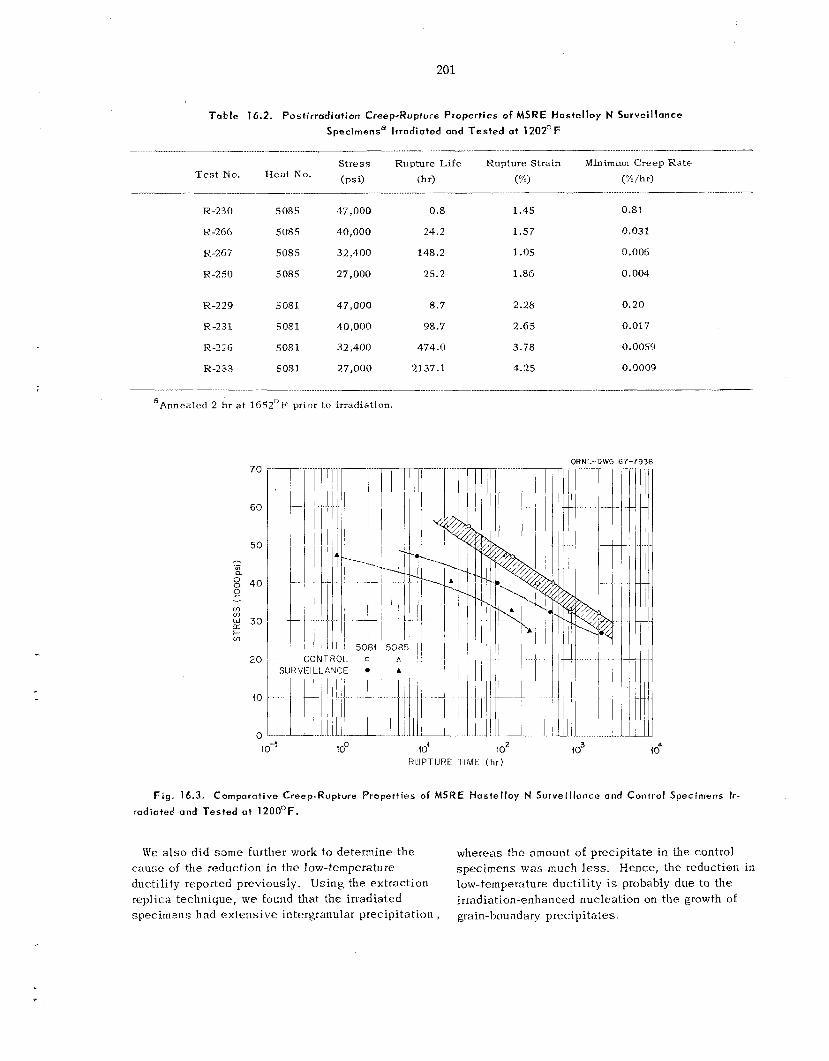
201
T a b l e 16.2. Post irradiat ion Creep-Rupture Propert ies of MSRE Haste l loy N Survei l lance
Specimensa Irradiated and Tested at 1202OF ........... ................... __._.I ...
Stress Rupture Life Rupture Strain Minimum Creep Kate
R-230
R-266
R-267
R-250
K-229
R-231
R-226
R-233
508.5 47,000
5085 40,000
5085 32,400
5085 27,000
5081 47,000
5081 40,000
5081 32,400
5081 27,000
0.8
24.2
148.2
2.5.2
8 .7
98.7
474.0
2137.1
1.45
1.57
1 .os 1.86
2.26
2.65
3.78
4.25
0.81
0.031
0.006
0.004
0.20
0.017
0.0059
0.0003
__ .................... __ ......... __ ....____
aAnnealed 2 hr a t 1652°F prior to irradiation.
ORRIL-DWG 67-793a 70
1 0-' 10' io2 HUPTIJRE TIME ( h r )
Fig. 16.3. Comparative Creep-Rupture Properties of M S R E Hastef loy N Surveillance and Control S p e c i m e n s I r -
radiated and Tested a t 120OOF.
We also did some further work to determine the whereas the amount of precipitate in h e control spec imens was much l e s s . Hence, the reduction i n low-temperature ducti l i ty is probably due to the irradiation-enhanced nucleation on t h e growth of grain-bourldary precipitates.
c a u s e of the reduction in the low-temperature ductility reported previously. Using the extraction replica technique, w e found that the irradiated specimens had ex tens ive intergranular precipitation ,
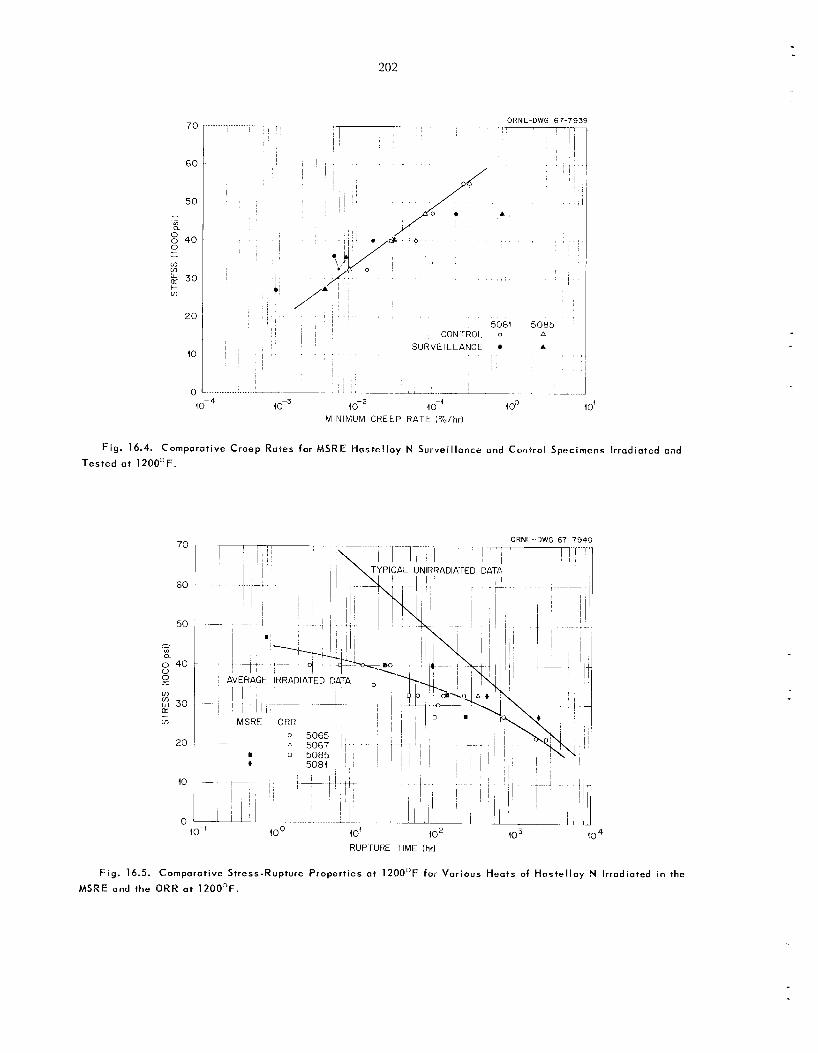
202
70
60
5 0 - Y) a
40 - - (0 m
+ m
30
20
40
ORNL-DWG 67-7939 -- 7 --
I S U R V C I L L A N C C A 1 1
10-" 1 6 ' 10-' 1 00 40' MINIMUM CREEP R A T E ( % / h r )
F i g . 16.4. Comparative Creep Rates for MSRE H a s t e l l o y N Surveil lance and Control Specimens Irradiated and T e s t e d a t 1200'F.
70
60
50
I .- ur Q
8 40
- 0
L5
v) 2 30
0 5065 A 5067 0 5085
5084
RUPrURE TIME (hr)
F i g . 16.5. Comparative Stress-Rupture Propert ies at 1200°F for Various Heats of H o s t e l l o y N I r radiated i n the MSRE arid the O R R a t 1200'F.
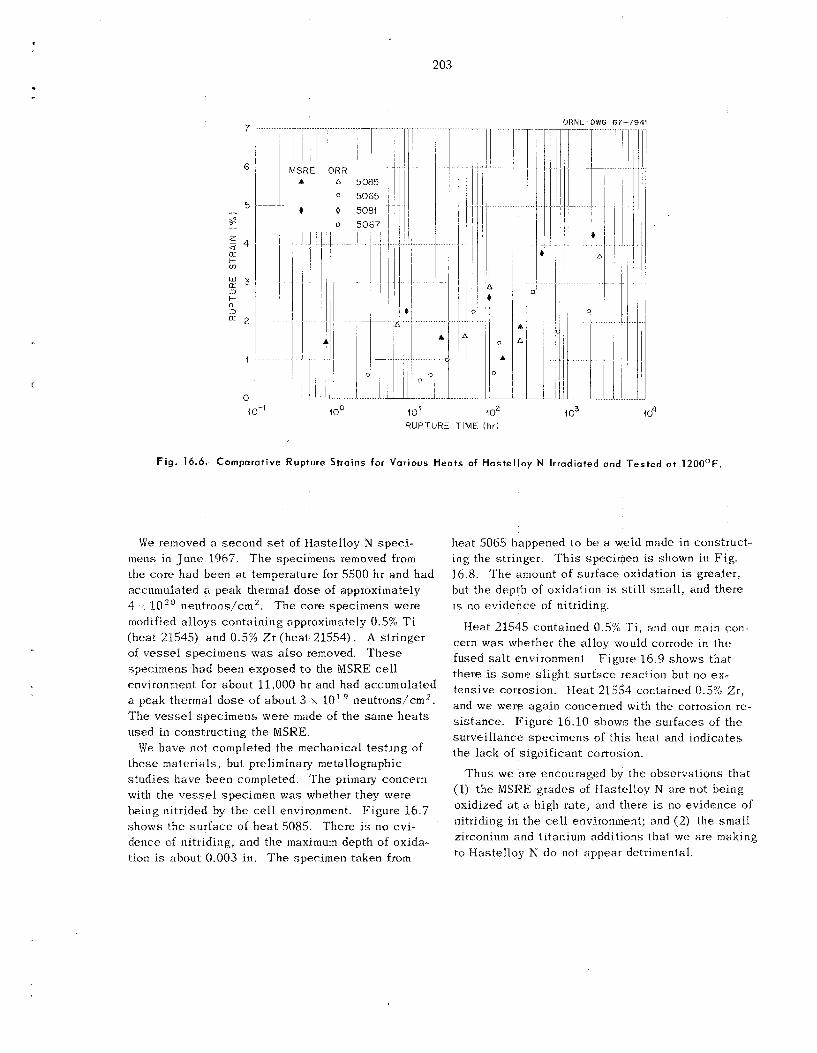
203
7
6
5 r.
- $ 4 OT I- ul
E 3 3 t-
3 a
E 2
1
0 10-1 10'
RUPTURE TIME (hr)
ORNL -DWG 67-7941
1 o3
i I. I
.rO4
Fig. 16.6. Comparutive Rupture Strains for Various Heats of Haste l loy N Irradiated and Tested a t 1200'F.
We removed a second s e t of Hastelloy N spec i - mens in June 1967. T h e specimens removed from the core had been a t temperature for 5500 h t and had accumulaied a peak thermal dose of approximately 4 i lo2 ' ) neutroms/ctn'. T h e core specimens were modified a l loys containing approximately 0.5% T i (heat 31545) and 0.5% Zr (hea t 21554). A stringer of v e s s e l spec imens was also removed. T h e s e specimens had been exposed to the MSRE ce l l environment for about 11,000 hr and had accumulated a peak thermal dose of about 3 x 10'' neutrons/cm2. The vesse l specimens were made of the same h e a t s used in constructing the MSRE.
W e have not completed the mechanical t e s t ing of these m a t e r ia Is, but preliminary metallo graphic s tud ies have been completed T h e primary concern with the v e s s e l specimen was whether they were being nitrided by the ce l l environment. F igure 16.7 shows the sur face of h e a t 5085. There is no evi- dence of̂ nitriding, and the maximum depth of oxida- tion is about 0.003 in. T h e specimen taken from
heat 5065 happened to be a weld made in construct- ing the stringer. T h i s specimen is shown in F ig . 16.8. T h e amount of sur face oxidation is greater, but t he depth of oxidation is still. small , and there is no ev idence of nitriding.
Heat 21545 contained 0.5% Ti , arid our main con- cern was whether t he alloy would corrode in the fused s a l t environment. Figure 16.9 shows that there is s o m e s l igh t sur face reaction but no ex- tensive corrosion. Hea t 21554 contained 0.5% Zr, and we were aga in concerned with the corrosion re- s i s tance . F igure 16.10 shows the sur faces of the surveil lance spec imens of this hea t and ind ica tes the lack of significant corrosion.
T h u s we a r e encouraged by the observations that (1) the MSRE grades of Hastelloy N are not being oxidized a t a high rate, and there is no ev idence of nitriding in the cell environmeni; and (2) the smal l zirconium and titanium additions tha t we are making to Hastelloy N d o not appear detrimental.
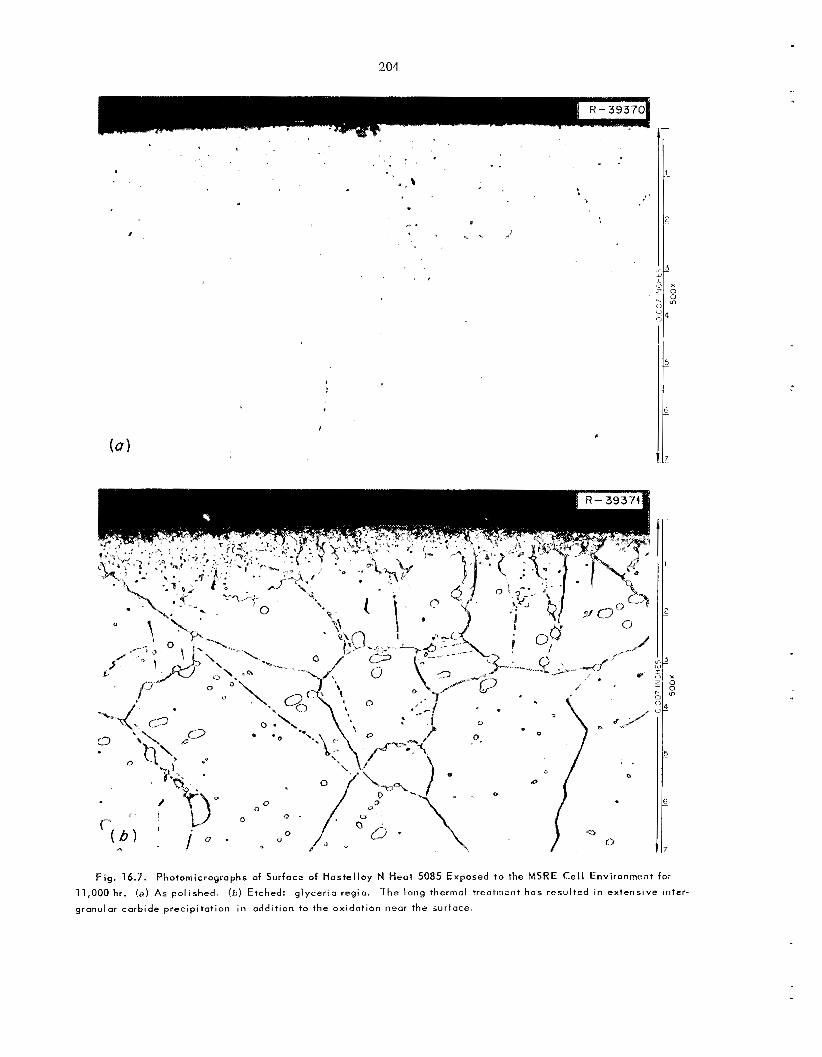
204
Fig . 16.7. Photomicrographs of Surface of Hostel loy N H e a t 5085 Exposed to the MSRE C e l l Environment for
11,000 hr. ( a ) As polished. ( b ) Etched: glyceria regia. T h e long thermal treotrrient has resulted in extensive inter.
granular carbide precipitation in addition to the oxidcltion near the surface.
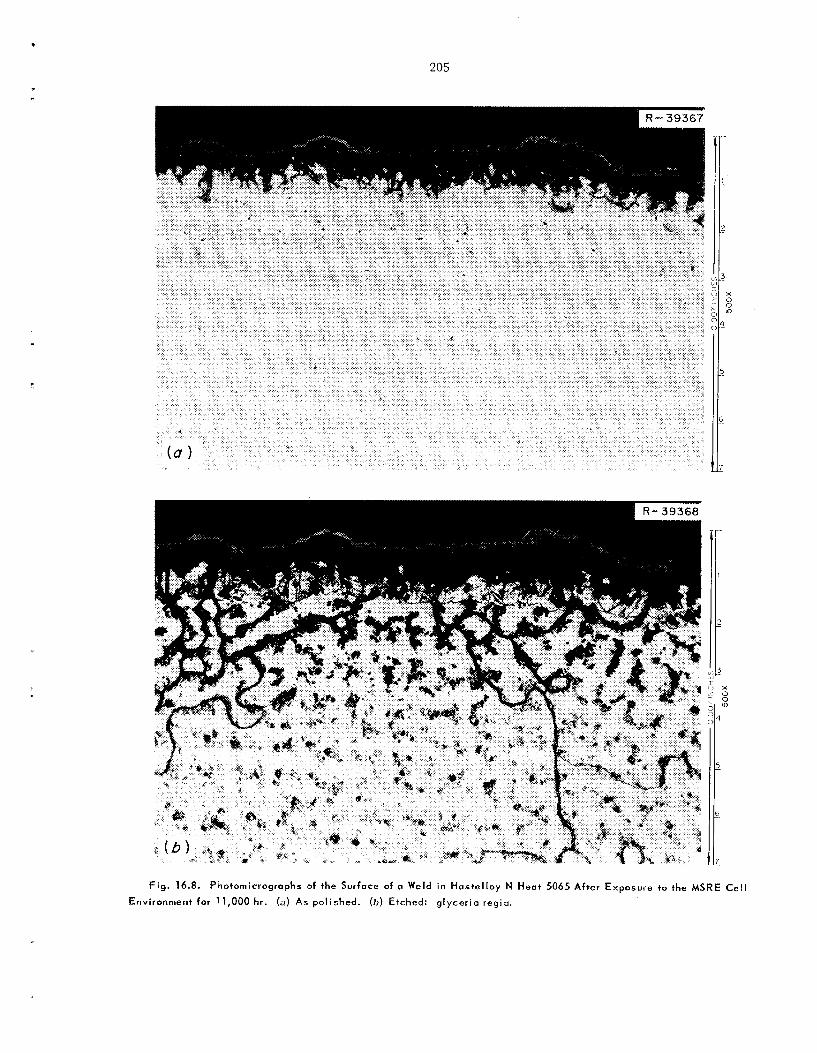
. 205
X 0
5:
F i g . 16.8. Photomicrographs of the Surface of a Weld in Haste l loy N H e a t 5065 After Exposure to the MSRE Cell Environment for 11,000 hr. (a) A s polished. (b) Etched: g lycer ia regia.
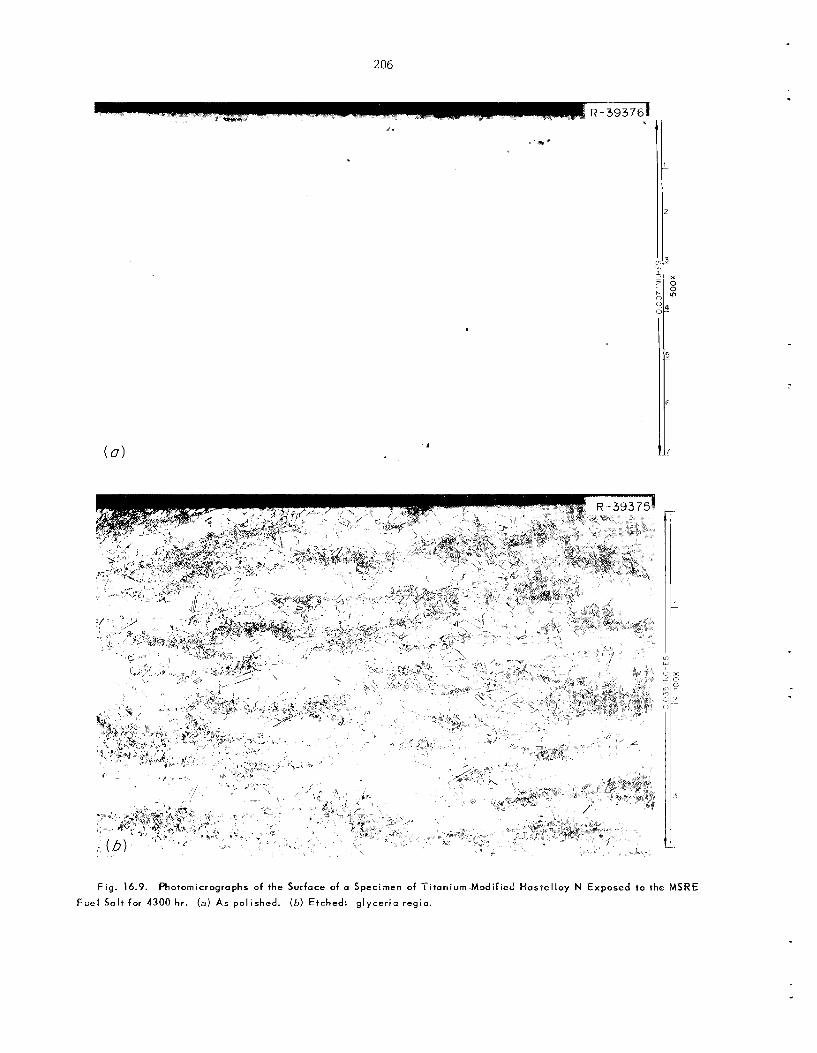
206
Fig . 16.9. Photomicrographs of the Surfoce of a Specimen of Titanium-Modified Hustel loy N Exposed to the MSRE F u e l Salt for 4300 hr. (a) A s polished. ( b ) Etched: glycerio regia.
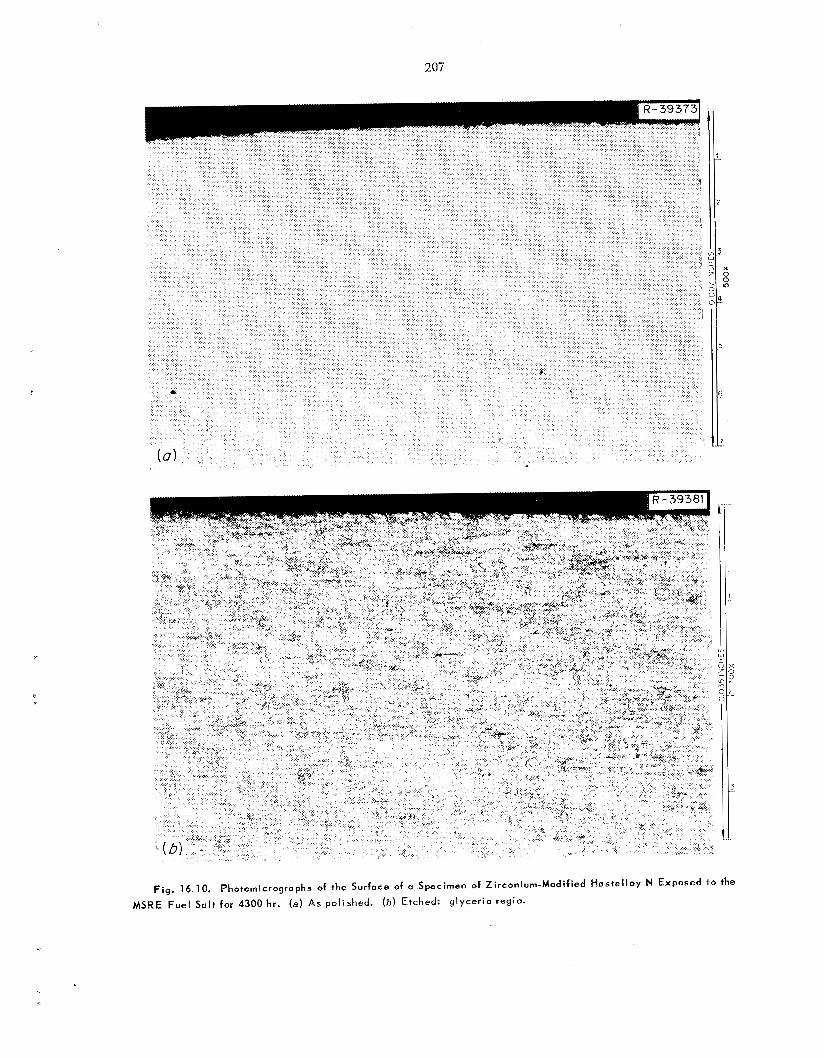
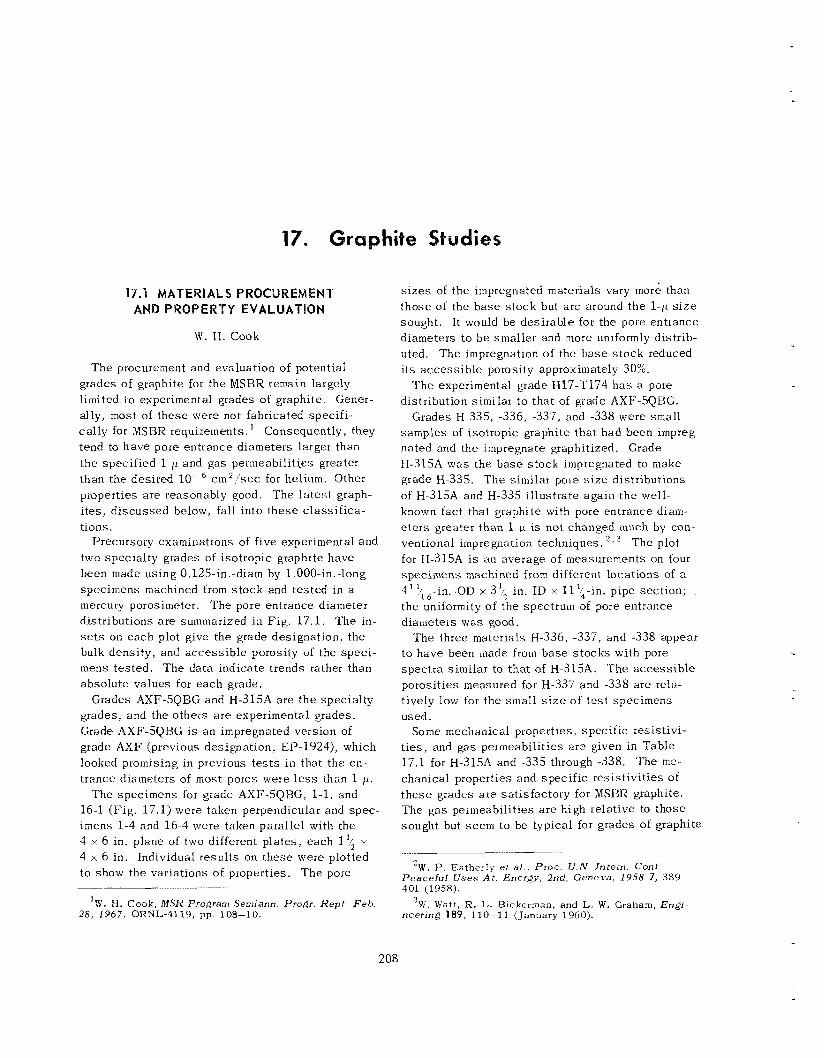
17.1 MATERIALS PROCURE ANDPROPERTY EVALUATION
wl. H. Cook
The procurement and evaluation of potential grades of graphite for the MSBR remain largely limited to experimental grades of graphite. Gener- ally, most of t hese were not fabricated specifi- ca l ly for MSBR requirements. Consequently, they tend to have pore en t rance diameters larger than the spec i f ied 1 /L and gas permeabiliti-es greater than the des i red c m 2 / s e c €or helium. Other properties a r e reasonably good. The l a t e s t graph- i tes , d i scussed below, fall into t h e s e c l a s s i f i ca - tions.
two spec ia l ty grades of isotropic graphite have been made us ing 0.125-in.-diam by l.OOO-in.-long spec imens machined from s tock and tes ted in a mercury porosimeter. 'The pore entrance diameter distributions a r e suinmarized in Fig. 17.1. The in- s e t s on each plot give the grade designation, the bulk dens i ty , and access ib l e porosity of the spec i - mens tes ted . The data ind ica te trends rather than absolute values for each grade.
Grades .4XT;-SQBG and H-315A are the spec ia l ty grades, and the others a re experimental grades. Grade AXF-5QHG i s an impregnated version of grade AXF (previous designation, EP-1924), which looked promising in previous t e s t s in that t he en- t rance diameters of most pores were l e s s than 1 p.
The spec imens for giade AXF-SQ'CX, 1-1, and 16-1 (F ig . 17.1) were taken perpendicular and spec - imens 1.-4 and 16-4 were taken parallel with the 4 x 6 in. plane of two different p la tes , each 1'; x 4 x 6 in. Individual resu l t s on these were plotted to show the variations of properties. The pore
Precursory examinations of five experimental and
...................
' W . 11, Cook, M S R Program Semiann Pro& Hept. Feb. 28, 1967, ORNL-4119, p p ~ 108-10.
s i z e s of t he impregnated materials vary more than those of the b a s e s tock but are around the 1-/L s i z e sought. It would be des i rab le for the pore entrance diameters to b e smaller and more uniformly distrib- uted. The impregnation of the b a s e s tock reduced i t s access ib l e porosity approxiinately 30%.
T h e experimental grade H17-'1'174 h a s a pore distribution similar t o tha t of grade AXF-SQBG.
Grades II-335, -336, -337, and -338 were small samples of isotropic graphite that had been impreg- nated and the impregnate graphitized. H-315A was the b a s e s tock impregnated to make grade €3-335. T h e similar pore s i z e distributions of H-315A and H-335 i l lus t ra te aga in the well- known fact that graphite with pore entrance diam- e t e r s greater than 1 p i s not changed much by con- ventional iinpregnatjon techniques. 2 . 3 The plot for II-315A is an average of measurements on four specimens machined from different locations of a 4' 1i1 ,-in.-OD x 3'/,-in.-IU x 11'2-in. pipe sec t ion ; the uniformity of the spectrum of pore entrance diameters was good.
'The three materials H-336, -337, and -338 appear t o have been made from base s tocks with pore spec t r a similar to tha t of H-315A. T h e access ib l e porosit ies measured for H-337 and -338 a re rela- tively low for the small s i z e of t e s t specimens. used .
t i e s , and gas perrneabilities a i2 given in Table 17.1 for H-315A and -335 through -338. The mz- chanical properties and spec i f ic res i s t iv i t ies of t h e s e grades are sa t i s fac tory for MSHR graphite. The g a s permeabilities a r e high relative to those sought but s eem to be typical for grades of graphite
Grade
Some mechanical properties, spec i f ic resist ivi-
2 W . P. Eather ly et a l . , Proc. U . N . Intern. Con f . Peace fu l U s e s A t . Energy, 2nd , Geneva. 1958 7, 389.- 401 (1958).
3W. Watt , R. L. Bickerman, and L, W. Graham, Engi- neering 189, 110-1 1 (January 1960).
208
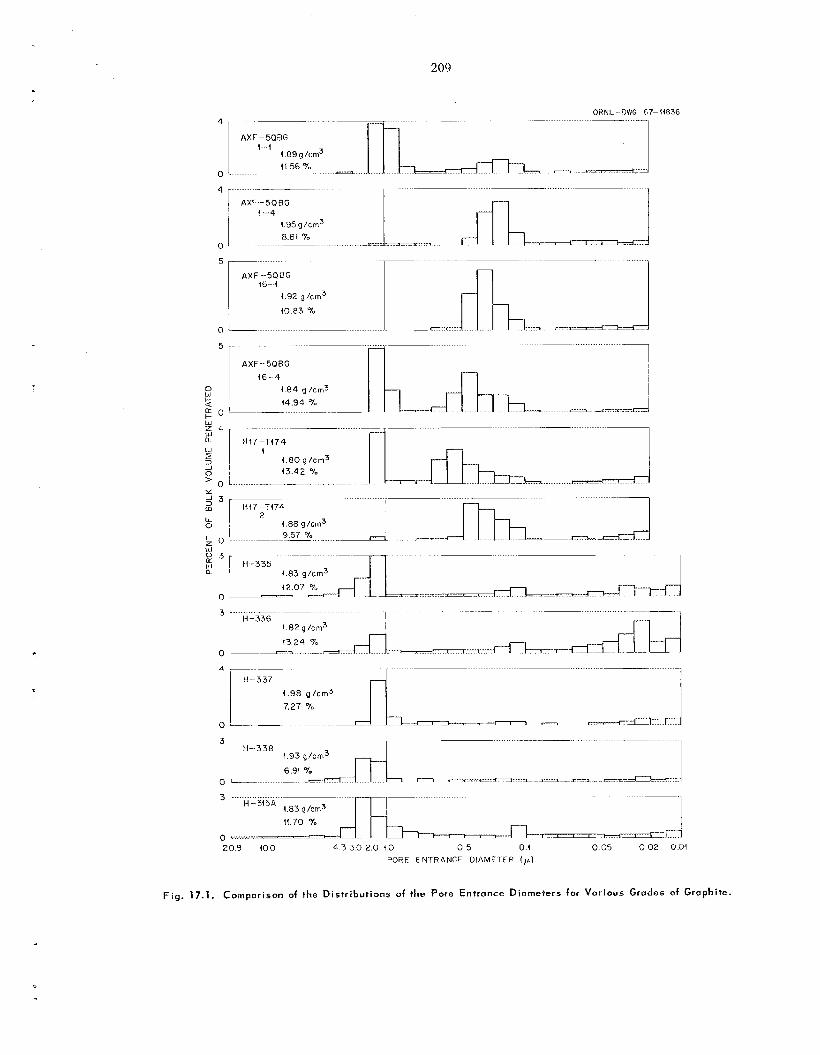
ORNIL --I)WG t'7-IiR3G
AXF-5QRG 4 - 4
4 a 9 g / r m 3 4 f 56 %
~
AXF--SQBG iG- - . i
L92 g / c m 3
40.83 yo
i 6 - 4 1 84 3 /cm3 14.94 7" h ,17, I
2 0 9 100 4 3 3 0 2 0 i o 0 5 04 0 05 0 0 2 001 PORE ENiFlANCE DIAMETER (pL)
Fig. 17.1. Comparison of the Distributions of the Pore Entrance Diameters for Various Grades of Graphite.

Table 17.1.
210
Summary of Some o f the Properties of lsntropic Graphite
Bulk Graphite Orienta tiona Dens i t y
(g/cm Grade
Specific Flexural Fracture Modulus of Permeability Res is tance Strength Strain Elas t ic i ty to Helium Porosity
(rnicrohms/cm) (psi)' e%) (psi)' (cm2isec) ' (a)
x 106 x
H-315A 1 I-L 1.830(29)d 985") 4790(4) 0.49(4) 1.35(4) 8.ge 11 .70y)
c 890(') 5880(4) 0.19(4) 1.65(4)
H-335 I I-L 1.820'' 3 , 973(13) 4240(6) 0.48(6) 1.29(6) 6.8 12.07
11-336 ' 1-1, 1.823(13) 850( l3) 49OOc6) 0.49(6) 1.47(6) 3.6 13.24
H-337 1 I-L 1.967(13) 901(13) 7210(6) 0.70(6) 1.82(6) 7.27
H-338 I I-', 1 . 9 2 0 ( ' ~ ) 1235(13) 6320(6) 0.54(6) 1.81(6) 6.91 ~~
a"ll-L" indicates that the length of the specimen was taken parallel with the length of the stock.
bWork performed by C. R. Kennedy. 'Work performed by R. B. Evans 111. dThe superscript numbers in parentheses indicate the number of values aberaged. Absence of superscript
numbers indicates that the data are from a single specimen. eMeasured perpendicular to the length of the stock.
"C" indicates that the length of the specimen was taken parallel with a chord in the pipe circle.
Table 17.2. Current Fobr ico t ion of Graphite P i p e for MSBR Studies .... . . . . . . . . . . . . . . . .... ~ .... ~~~~ ~
Nominal P ipe Dimensions (in.)
OD ID Tota l Length Remarks ................... Graphite Grade Manufacturer Type
-. ....................
1425-61 A Anisotropic 39; 2 14 306a Received 12-23-66
H-337 B Isotropic 5 2235, 36' To be shipped by 10-1-67 or sooner
2j/4 1 '4 768'
BY12 C Isotropic 5 223/2 C To be supplied during F Y 1968
2 1/, 1 5 C
aRandom lengths, 38 to 51 in. 'Random lengths, 10 t o 36 in. 'Random lengths, 10 to 48 in.; to ta l lengths not fixed a t this time.
that approach MSBR requirements. Reducing the permeability below these by orders of magnitude appears to be difficult with conventional tech- niques. This h a s prompted the backup work on sea l ing graphite with metal or pyrolytically de.- posited graphite that is d i scussed later in this sec t ion .
We are receiving potential irradiation samples of anisotropic and isotropic graphites in smal l quanti- t i e s from Carbon Products Division of Union Car- bide Corporation, the Chemical Engineering Devel- opment Department of t he Y-12 P lan t ,4 Great L a k e s
40perated by the Union Carbide Corporation for the -~
U.S. Atomic Energy Commission.
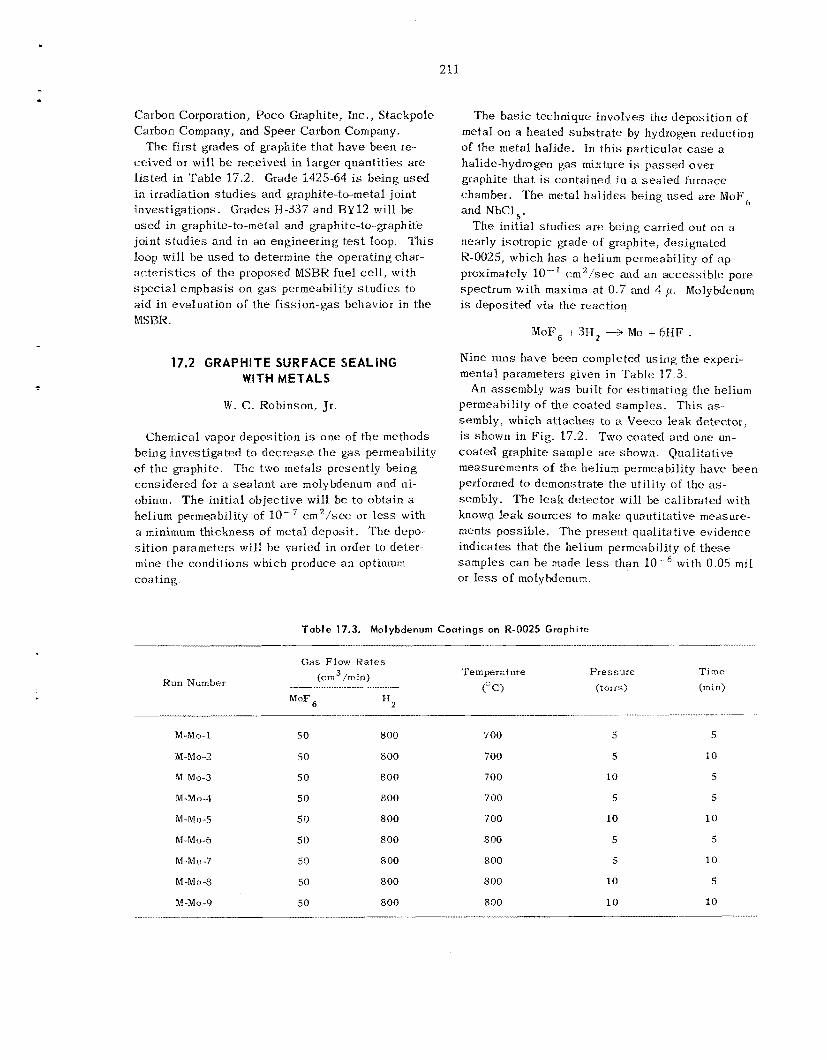
211
Carbon Corporation, Poco Graphite, Inc., Stackpole Carbon Company, and Speer Carbon Company.
T h e first grades of graphite tha t have been re- ce ived or will b e received in larger quantit ies are l i s ted in Table 17.2. Grade 1425-64 is being used in irradiation s tud ie s and graphite-to-metal joint investigations. Grades 13-337 and BY12 will be used in graphite-to-metal and graphite-lo-graphite joint s tud ie s and in an engineering test loop. This loop will b e used to determine the operating char- ac t e r i s t i c s of the proposed MSHR fuel ce l l , with spec ia l emphasis on gas permeability s tud ie s to aid in evaluation o f the f i ss ion-gas behavior in the MS BR .
17.2 GRAPHITE SURFACE SEALING WITH METALS
W. C. Robinson, Jr.
Chemical vapor deposit ion is one of the methods being investigated to dec rease the gas permeability of the graphite. The two metals presently being considered for a sea l an t a r e molybdenum and ni- obium. T h e init ial objective will be to obtain a helium permeability of 10W7 cm2/sec or l e s s with a minimum thickness of m e t a l deposit . The depo- s i t ion parameters w i l l be varied in order to deter- mine the conditions which produce an optimum coat in g.
The bas i c technique involves the deposit ion of metal o n a heated subs t ra te by hydrogen reduction of the metal halide. In t h i s particular case a halide-hydrogen gas mixture is passed over graphite that is contained in a sea l ed furnace chamber. The metal ha l ides being used are MoF', and NbCl,.
The init ial s tud ies are being carried out on a neatly isotropic grade of graphite, designated K-0025, which has a helium permeability of ap- proximately lo-' c m 2 / s e c and an access ib le pore spectrum with maxima a t 0 .7 and 4 /p. Molybdenum is deposited via the reaction
MoF, -t 3I3, 3 MO t fjHF .
Nine runs have been completed using the experi- mental parameters given in Table 17 .3 .
permeability of the coated samples . Th i s as- sembly, which a t taches to a Veeco leak detector, is shown in F ig . 17.2. Two coated and one un- coated graphite sample are shown. Qualitative measurements of the helium permeability have been performed to demonstrate t he utility o f the as- sembly. T h e leak detector will be calibrated with know? leak sources to make quatitit.ative measure- ments possible. T h e present quali tative evidence indicates that the helium permeability O E these samples can b e made less than with 0.05 mil or less of molybdenum.
An assembly was built for estimating the helium
Table 17.3. Molybdenum Coatings on R-DO25 Graphite
Gas Flow Rates Temperature Pressure (c m /m in)
. . . . . .- PO (torrs) Run Number
H 2 M o F
M-Mo-1 50 800 700 5
M-Mn-2 50 8 00 700 5
bf-Mo-3 50 800 700 10
M-Mo-4 50 800 700 5
M-Mo-5 5 0 8 00 700 10
M-M+6 50 8 00 8 00 5
M-Mo-7 50 800 800 5
M-Mo-5 so 800 800 10
M-Mo-9 50 800 800 10
T i m e (min)
5
10
5
5
10
5
10
5
10
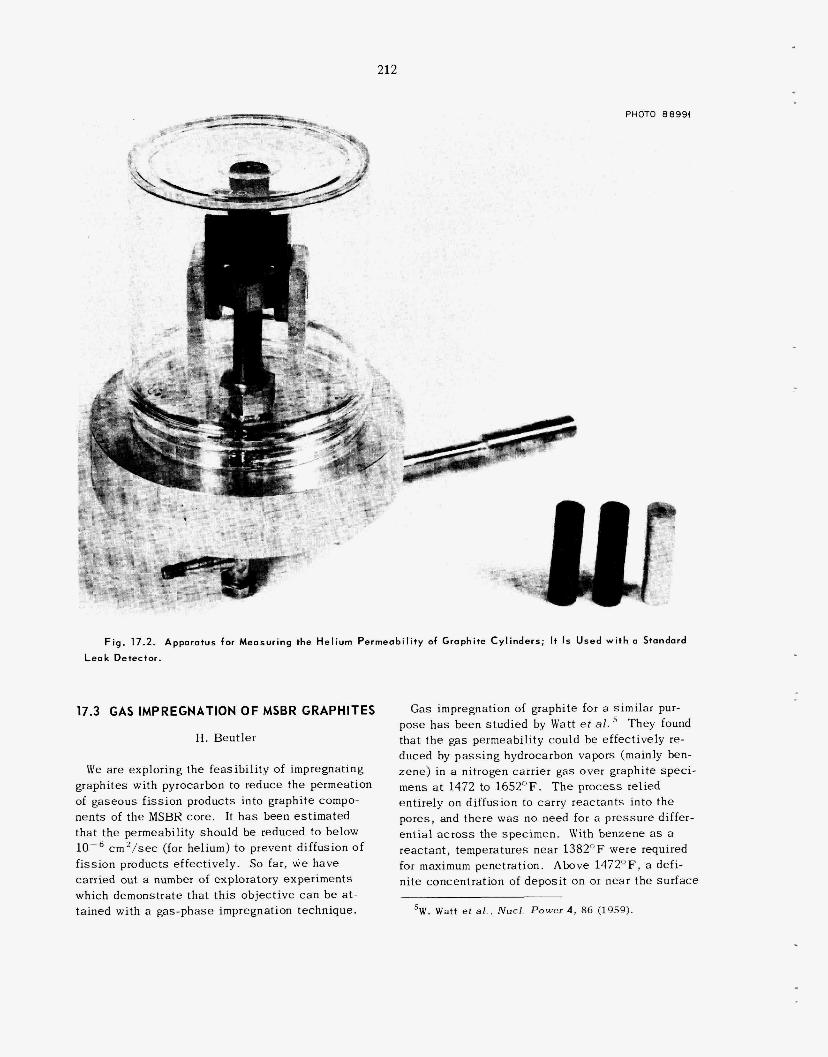
212
PHOTO 88994
I
F i g . 17.2. Apparatus for Measuring the Hel ium Permeabil i ty of Graphite Cylinders; I t I s Used w i t h a Standord
Leak Detector.
17.3 GAS IMPREGNATION OF MSBR GRAPHITES
H. Beutler
We are exploring the feasibi l i ty of impregnating graphites with pyrocarbon to reduce the permeation of gaseous f i ss ion products into graphite compo- nents of the MSBR core. It h a s been est imated that the permeability should be reduced to below
f iss ion products effectively. So far, we have carried out a number of exploratory experiments which demonstrate that this object ive c a n b e at- tained with a gas-phase impregnation technique.
cm2/sec (for helium) to prevent diffusion of
Gas impregnation of graphite for a similar pur- pose h a s been s tudied by Watt et ai. ' They found that the gas permeability could be effectively re- duced by p a s s i n g hydrocarbon vapors zene) in a nitrogen carrier gas over gr mens at 1472 to 1652°F. T h e process relied entirely on diffusion to carry react pores, and there was no need for a entia1 across the specimen. With benzene as a reactant, temperatures near 1382" F were required
mum penetration. Above 1472OF, a defi- ni te concentration of deposi t on or near the surface
'W. W a t t et a1 , Nucl Power 4, 86 (1959).
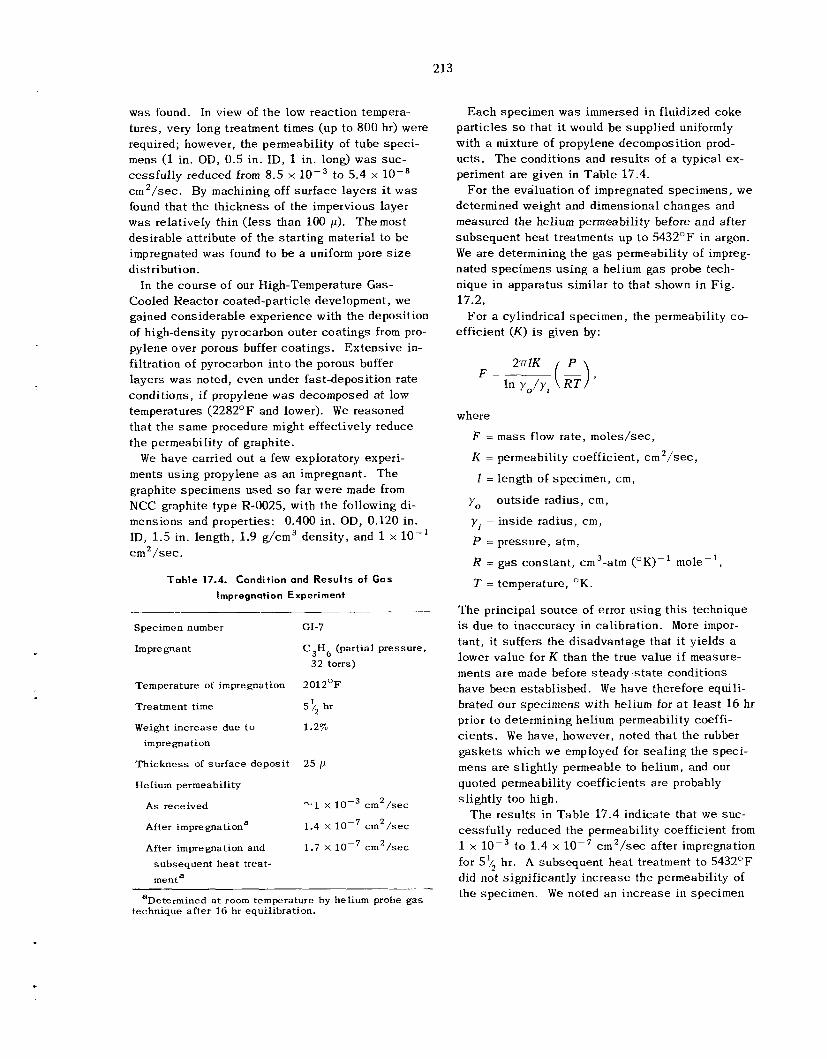
213
was found. In view of the low reaction tempera- tures, very long treatment times (up to 800 hr) were required; however, the permeability of tube spec i - mens (1 in. OD, 0.5 in. ID, 1 in. long) was suc - cess fu l ly reduced from 8.5 x to 5.4 x lo-' c m 2 / s e c . By machining off sur face layers it w a s found tha t the th ickness of the impervious layer was relatively thin (less than 100 p). Themos t desirable attr ibute of the s ta r t ing material to b e impregnated was found to b e a uniform pore size distribution.
In the course of our High-Temperature Gas- Cooled Reactor coated-particle development, we gained cons iderable experience with the deposit ion of high-density pyrocarbon outer coatings from pro- pylene over porous buffer coa t ings . Extens ive in- filtration of pyrocarbon in to the porous buffer layers was noted, even under fast-deposition rate conditions, i f propylene w a s decomposed a t low temperatures (2282OF and lower). W e reasoned tha t t he s a m e procedure might effectively reduce the permeability of graphite.
W e have carried out a few exploratory experi- ments us ing propylene as an impregnant. The graphite specimens used so far were made from NCC graphite type R-0025, with the following di- mensions and properties: 0.400 in . OD, 0.120 in. ID, 1.5 in. length, 1.9 g/cm3 dens i ty , and 1 x lo- ' c m 2 /sec.
Table 17.4. C o n d i t i o n a n d Results of Gas Impregnation Exper iment
Specimen number
Impre gnant
Temperature of impregnation
Treatment time
Weight increase due t o impregnation
Thickness of surface deposit
Helium permeability
As received
After impre gnationa
After impregnation and subsequent hea t treat- menta
GI-7
C,H, (partial pressure, 32 torrs)
2012OF
5% hr
1.2%
-1 x 1 0 - ~ cm2/sec
1.4 X lop7 cm2/sec
1.7 X lop7 cm2/sec
aDetermined a t room temperature by helium probe gas technique af ter 16 hr equilibration.
Each specimen was immersed in fluidized coke particles so tha t it would b e supplied uniformly with a mixture of propylene decomposition prod- ucts. T h e conditions and resu l t s of a typical ex- periment a re given in Tab le 17.4.
determined weight and dimensional changes and measured the helium permeability before and after subsequent hea t treatments up t o 5432OF in argon. W e a r e determining the g a s permeability of impreg- nated spec imens us ing a helium gas probe tech- nique in apparatus s i m i l a r t o tha t shown in Fig. 17.2.
efficient ( K ) is given by:
For the evaluation of impregnated specimens, we
For a cylindrical specimen, the permeability co-
where
F = m a s s flow rate, moles/sec,
K = permeability coefficient, cm2/sec,
I = length of specimen, cm,
yo = outs ide radius, c m ,
y j = inside radius, cm,
P = pressure, atm,
R = g a s constant, cm3-atm (OK)-' mole-' ,
T = temperature, OK.
The principal source of error us ing th i s technique is due to inaccuracy in calibration. More impor- tant, it su f f e r s the disadvantage that it yields a lower value for K than the true value i f measure- ments a r e made before s teady-s ta te conditions have been es tab l i shed . W e have therefore equili- brated our specimens with helium for a t l e a s t 16 hr prior t o determining helium permeability coeffi- c ien ts . W e have, however, noted tha t the rubber gaske ts which we employed for s ea l ing the spec i - mens are slightly permeable to helium, and our quoted permeability coefficients are probably slightly too high.
The resu l t s in Table 17.4 indicate that we suc- cess fu l ly reduced the permeability coefficient from 1 x l o p 3 to 1 .4 x l o p 7 c m 2 / s e c after impregnation for 5'/2 hr. A subsequent hea t treatment t o 5432OF did not significantly increase the permeability of the specimen. W e noted an increase in specimen
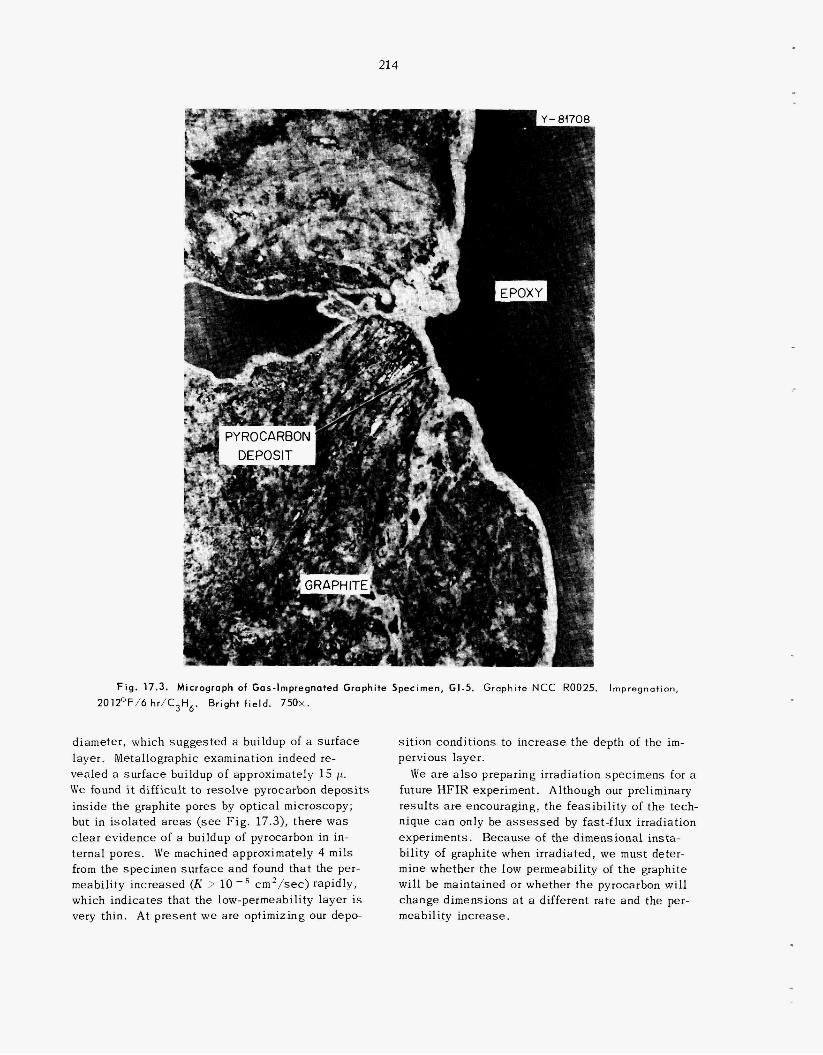
214
SRAPHITE
m 1 Y - A47nR
F i g . 17.3. Micrograph of Gos-Impregnated Graphite Specimen, GI-5. Graphite NCC R0025. Impregnation,
2O1Z0F/6 hr/C3H6. Bright f ie ld. 750~.
diameter, which suggested a buildup of a sur face layer. Metallographic examination indeed re- vealed a sur face buildup of approximately 15 p.
W e found it difficult t o resolve pyrocarbon depos i t s inside the graphite pores by opt but in isolated a reas (see Fig. 17.3), there was
e of a buildup of pyrocarbon in in- We machined approximately 4 m i l s
from the specimen sur face and found that the per- meability increased (K > 10 --5 cm'Jsec) rapidly, which indicates that the low-permeability layer is
n . At present w e a r e optimizing our depo-
s i t ion conditions to incre pervious layer .
future HFIR experiment. Although our preliminary resu l t s a r e encouraging, the feasibi l i ty of the tech- nique can only be a s s e s s e d by fast-flux irradiation experiments. Because of the dimensional insta- bility of graphite when i r radiated, we must deter- mine whether the low eabi l i ty of t h e graphite will be maintained or whether the pyrocarbon will change dimensions at a different ra te and the per- meability increase.
e the depth of the im-
W e a re also preparing irradiation s p e c i
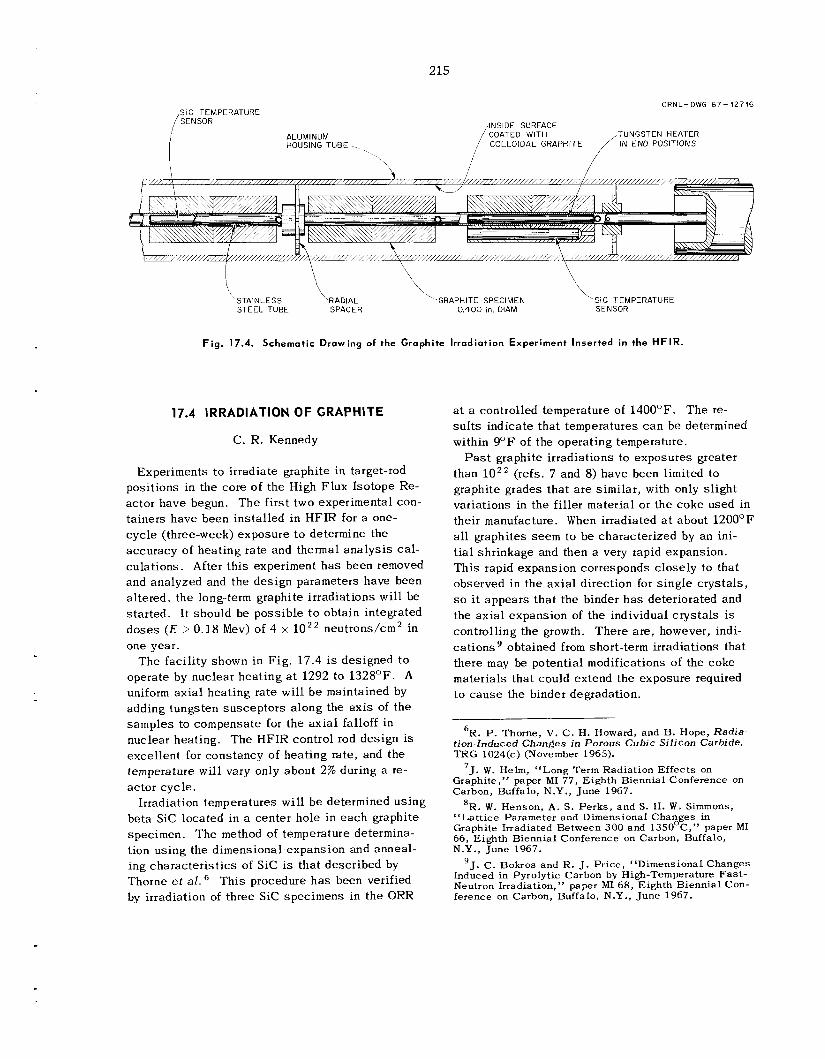
215
GRNL-DWG 67-12716 SIC TEMPERATURE
INSIDE SURFACE COATED WITH TUNGSTEN HEATER ALUMINUM
HOUSING TUBE , COLLOIDAL GRAPHITE IN END POSITIONS
\
SIC TEMPERATURE SENSOR
RADIAL i\....-GRAPi+rE SPECIMEN 0400 in DlAM SPACER
STAINLESS STEEL TUBE
F i g . 17.4. Schematic Drawing of the Graphite Irradiation Experiment Inserted in the HFIR.
17.4 IRRADIATION OF GRAPHITE
C. R. Kennedy
Experiments to irradiate graphite in target-rod posit ions in the core of the High Flux Isotope Re- actor have begun. The f i r s t two experimental con- ta iners have been instal led in HFIR for a one- cyc le (three-week) exposure to determine the accuracy of heat ing rate and thermal ana lys i s ca l - culat ions. After th i s experiment h a s been removed and analyzed and the des ign parameters have been al tered, the long-term graphite i r radiat ions wil l be s ta r ted . I t should be possible t o obtain integrated d o s e s ( E > 0.18 Mev) of 4 x 10” neutrons/cm2 in one year.
The faci l i ty shown in F ig . 17.4 is designed to operate by nuclear hea t ing a t 1292 to 1328°F. A uniform axia l heat ing rate will b e maintained by adding tungsten susceptors a long the ax is of the samples to compensate for the ax ia l falloff in nuclear heating. T h e HFIR control rod design is excel lent for constancy of heat ing rate, and the temperature will vary only about 2% during a re- actor cyc le .
beta S i c located in a center hole in e a c h graphite specimen. The method of temperature determina- tion using the dimensional expansion and anneal- ing charac te r i s t ics of S i c is tha t descr ibed by Thorne et al. T h i s procedure h a s been verified by irradiation of three S i c specimens in the ORR
Irradiation temperatures will be determined using
a t a controlled temperature of 1400OF. The re- s u l t s indicate that temperatures c a n be determined within 9OF of the operating temperature.
Past graphite irradiations to exposures greater than 10” (refs. 7 and 8) have been limited to graphite grades that a r e s imilar , with only s l ight variations in the filler material or the coke used in their manufacture. When irradiated a t about 1200OF all graphites s e e m to be characterized by an ini- t i a l shr inkage and then a very rapid expansion. T h i s rapid expansion corresponds closely to that observed in the ax ia l direction for s ing le c rys ta l s , so it appears tha t the binder h a s deteriorated and the ax ia l expansion of the individual c rys ta l s is controll ing the growth. The re are , however, indi- ca t ions there may be potential modifications of the coke materials that could extend the exposure required to c a u s e the binder degradation.
obtained from short-term irradiations that
~~
6R. P. Thorne, V. C. H. Howard, and B. Hope, Radia- tion-Induced Changes in Porous Cubic Silicon Carbide, TRG 1024(c) (November 1965).
Graphite,” paper MI 77, Eighth Biennial Conference on Carbon, Bnffalo, N.Y., June 1967.
8R. W. Henson, A. S . Perks, and S . H. W. Simmons, “Lat t ice Parameter and Dimensional Changes in Graphite Irradiated Between 300 and 135OoC,” paper MI 66, Eighth Biennial Conference on Carbon, Buffalo, N.Y. , June 1967.
’J. C. Bokros and R. J. Pr ice , “Dimensional Changes Induced in Pyrolytic Carbon by High-Temperature Fas t - Neutron Irradiation,” paper MI 68, Eighth Biennial Con- ference on Carbon, Buffalo, N.Y., June 1967.
J. W. Helm, “Long Term Radiation Effects on 7
216
I t is the purpose of our s tud ie s to develop grades of graphite which will circumvent the breakdown of the binder phase tha t l i m i t s t he lifetime expec- tancy of the graphite core. T h e tailoring of a graphite for u s e in a molten-salt reactor will very likely require the u s e of impregnates and/or sur- face-sealing techniques to obtain the required pore s i z e and permeability. Therefore, s tud ie s of the
e f fec ts that t hese treatments will have on the irra- diation behavior wi l l be made. T h e s tud ie s must include examinations to demonstrate tha t the core lifetime is not reduced either through the loss of e f fec t iveness of the s e a l i n g techniques or through an enhanced potential of breakdown of the binder phase.
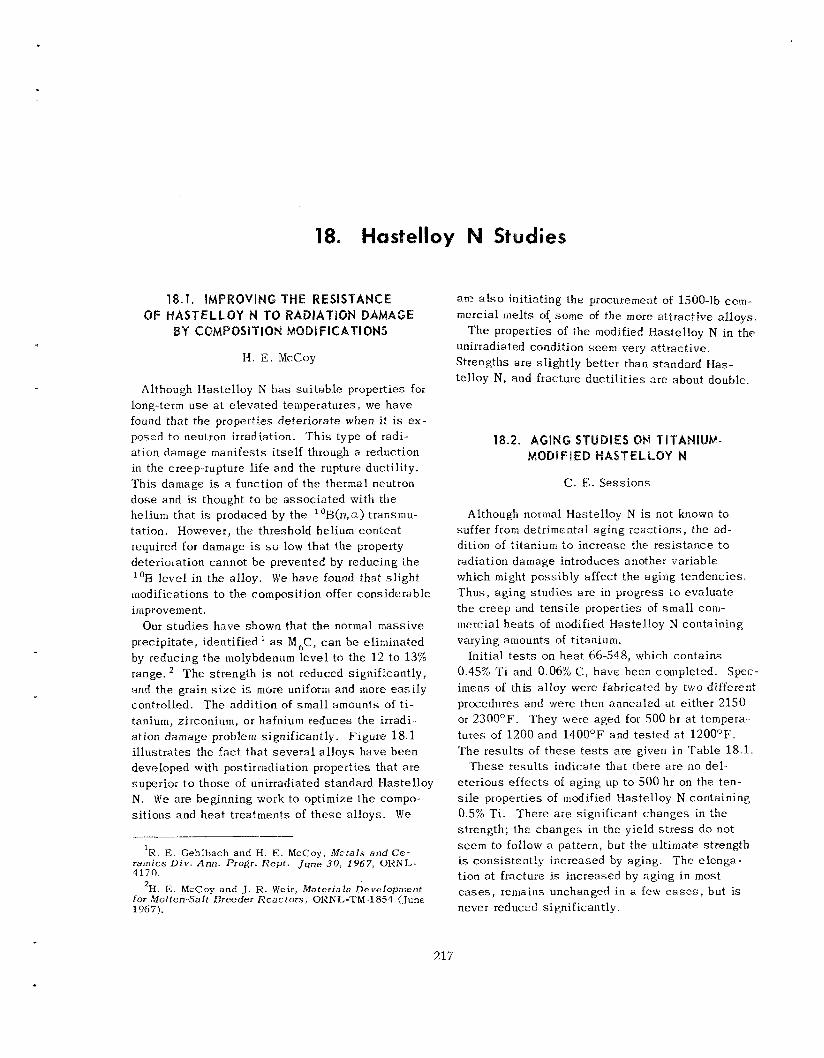
18.1. IMPRQVING THE RESISTANCE OF MASTEbbQY N TO RADIATION ~ A ~ A ~ ~
BY COMPOSITI089 MODIFICATIONS
1-1. E. McCoy
Although Hastelloy N h a s su i tab le properties for long-term u s e at e leva ted temperatures, we have found that the propertiks deteriorate when i t is ex- posed to neutron irradiation. T h i s type of radi- ation damage manifests i tself through a reduction in the creep-rupture life and the rupture ducti l i ty. Th i s damage is a function of t he thermal negtron dose and is thought t o be assoc ia ted with the helium that is produced by the 1°B(n,a) transmu- tation. Hnwcver, the threshold helium content required. for damage is so low that the property deterioration cannot b e prevented by reducing the 'OB l eve l i n the alloy. We have found that s l igh t modifications to the composition offer considerable improvement.
Our s tud ie s have shown that the normal mass ive precipitate, identified ' as M,C, c a n b e eliminated by reducing the molybdenum leve l t o the 12 to 13% range. * T h e strength is not reduced significantly, and the grain s i z e is more uniform and more eas i ly controlled. T h e addition of smal l amounts of t i - tanium, zirconium, o r hafnium reduces the irradi-. at ion damage problem significantly. F igure 18.1 il lustrates the fact that seve ra l a l loys have been developed with postirradiation properties that a r e superior to those of unirradiated standard Hastelloy N. \Ne are beginning work to optimize the compo-. s i t ions and hea t treatments of t hese alloys. W e
are a l s o initiating the procurement of 1500-lb coni- mercial melts of. some of the more attractive a l loys .
T h e properties of the modified Hastelloy N in the unirradiated condition seem very attractive. Strengths a r e s l igh t ly better than standard Has- telloy N, and fracture duc t i l i t i es aw about double.
18.2. AGING STUDIES ON TITANIUM- MODIFIED HASTELB-OY N
C. E. Sess ions
Although normal Hastelloy N i s not known to suffer from detrimental aging reac t ions , the ad- dition of titanium to increase the res i s tance to radiation damage introduces another variable which might possibly affect the aging tendencies. Thus , aging s tud ie s a r e in progress to eva lua te the c reep and tens i le properties of s m a l l c o m - inercial h e a t s of modified Hastelloy N containing varying amounts of titanium.
0.45% Ti and 0.06% (2, have been coinpleted. Spec- imens of this alloy were fabricated by two different procedures a i d were then annealed at either 2150 or 2300°F. They were aged for 500 hr a t tempera- tures of 1200 and 1400OF and tes ted a t 1200OF. The resu l t s of t h e s e t e s t s a re given in Table 18.1.
T h e s e resu l t s ind ica te that there are no del- eterious e f f ec t s of aging up to 500 hr on the ten- sile properties of modified Hastelloy N containing 0.5% Ti . There ate significant changes in the
Init ial t e s t s on hea t 66-548, which conta ins
strength; the changes in the yield s t r e s s do not ..__ __ seem to follow a pattern, but the ultimate strength is cons is ten t ly increased by aging. The elonga-
'R. E. Gehlbach and H. E. McCoy, Metals and Ce- rarnics D i v . Ann. Proar. Reut. lune 30. 1967. ORNL-
I . " - 41 70. tion a t fracture is increased by aging in most
L H . E. McCoy and J. R. W e i r , Materiafs D e v e l o p n e n f for Molten S a l t Breeder Reactors, OKNL-TM-1854 (June 1967). never reduced significantly.
cases, remains unchangcd i n a few c a s e s , but i s
217
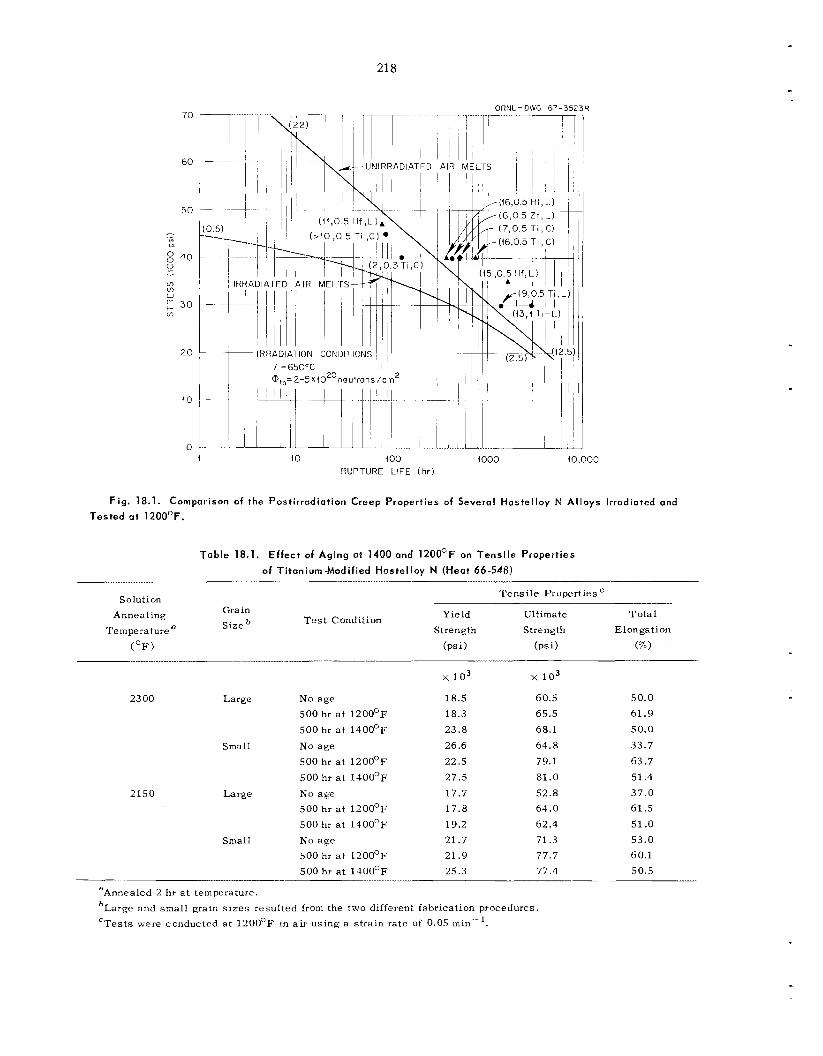
218
ORNL-DWG 67-3523R 70
60
5 0
- - LD a
8 40 0 - v) m W
30 0
2 0
10
0 I IO 400
RUPTURE LIFE (h r ) io00 10,000
Fig. 18.1. Tested a t 120OOF.
Comparison of the Postirradiation Creep Properties of Several Haste l loy N Al loys lrra iated an
T a b l e 18.1. Effect of Aging at 1400 and 1200°F on T e n s i l e Properties of T i tanium-Modi f ied Haste l loy N (Heat 66-548)
Solution Annealing
Temperature a
(OF)
Tens i le Properties
Y ie Id Ultimate Tota l Grain
Size Strength Strength Elongation Test Condition
x i o 3 18.5 18.3 23.8 26.6 22.5 27.5 17.7 1 7 . 8 19.2 21.7 21.9 25.3
x i o 3 60.5 65.5 68.1 64 .8 79.1 81.0 52.8 64.0 62.4 71.3 77.7 77.4
23 00
2150
Large N o age 500 hr a t 1200°F 500 hr a t 1400'F
Small No age 500 hr a t 1200'F 500 hr a t 1400'F
Large N o age 500 hr a t 1200°F 500 hr a t 1400°F
Small No age 500 br a t 1200°F 500 hr a t 1400'F
50.0 61 .9 50.0 33.7 63.7 51.4 37 .0 61.5 51.0 53.0 60.1 50.5
aAnnealed 2 hr a t temperature. 'Large and small grain sizes resulted from the two different fabrication procedures. 'Tests wr're conducted a t 1200°F in a i r using a s t ra in rate of 0.05 miii.-.l.
219
T h e s e aging s t u d i e s will b e expanded to include longer aging t imes , a l loys with varying titanium and carbon l eve l s , and complete metallographic examination to a sce r t a in metallurgical changes .
18.3. PHASE IDENTIFICATION STUDIES IN HASTELLOY N
R. E. Gehlbach
The effects of thermornechanical treatments on the mechanical properties of I-Iastelloy N indicated the need for an electron microscope investigation to understand the nature of the elevated-tempera- ture embrittlement problem. It w a s noticed that the transit ion from transgranular to intergranular failurs i n the temperature range of the ducti l i ty decrease indicated probable formation of a brit t le grain-boundary product - either a fine precipitate or segregation of impurity e lements t o grain bound- a r ies .
mission e lec t ron microscopy showed precipitation occurring in the same temperature range as that of the pronounced ductil i ty change . 'rhus a de ta i led study of precipitation in Hastelloy N was init iated to identify the various types, morphologies, and compositions of precipitates and t o determine their relationship t o the mechanical properties.
used for the purposes of precipitate identification. Thin-foil transmission microscopy i s employed for observations of fine matrix precipitate, d i s loca t ion structure, and, to a l e s se r extent, grain-boundary precipitate. Due to the heterogeneous nature of precipitation in Hastelloy N, sampling problems a re encountered with transmission rriicroscopy. Th i s technique is a l s o limited in that the true nature of the precipitates is not apparent and that very thin grain-boundary f i l m s a r e frequently un- detectable.
transmission l imitations. Here, conventional metallographic specimens a re lightly etched t o remove the polished sur face and to reveal pre- c ip i ta tes and are then coated with a layer of car- bon. Extraction rep l icas a re obtained by heavy electrolytic e tch ing through the carbon film, which d i s so lves the matrix, leaving the precipitates ad- hering to the carbon subs t ra te . T h i s permits ob- servation of precipitates in the same distribution
Preliminary examination of thinned foils by t rans-
Severa l complementary approaches a r e being
Extraction replication techniques overcome t h e
as that ex is t ing in the bulk sample with the ex- ception tha t grain-boundary precipitates a r e no longer supported by the matrix and co l lapse aga ins t the subs t r a t e as shown in F ig . 18.2. Th i s allows direct observation of the grain-boundary precip- i t a t e s on e s sen t i a l ly the sur face of the original grain boundary, providing inforiliation on true pre- c ip i ta te morphology and permitting examination of thin films.
Identification of precipitates is simplified with extraction rep l icas , s ince interference from the matrix is eliminated. Selected area electron dif- fraction is being used for the identification of c rys ta l structure and the determination of la t t ice parameters.
Semiquantitative cornpositional ana lys i s of in- dividual par t ic les is being performed us ing an electron probe microanalyzer accessory on one of the electron microscopes. T h u s , by coordinating various approaches ava i lab le in electron micros- copy, precipitation processes may b e studied carefully.
Much of our effort h a s been concentrated on standard Hastelloy N. The microstructure of th i s material i s characterized by s t l ingers of mass ive M,C carb ides , t he metallic cons t i tuents being primarily nickel. and molybdenum with some chro- mium. pared with the matrix. On aging or t es t ing in the temperature range 1112 to 1652OF, a fine grain- boundary precipitate forms (Fig. 18.2). T h i s precipitate i s also M,C with the same la t t ice pa- rameter (approximately 11 .0 A ) as the large blocky carbides. Work is in progress to attempt to de tec t any compositional differences between the two morphologies of M,C carb ides . Init ial microprobe work us ing extraction rep l icas ind ica tes that the grain-boundary carb ides a re richer in s i l i con than the large blocky type. A l l precipitates found in Hastelloy N which h a s not been subjec ted to tem- peratures in e x c e s s of 2372°F have been M,C carbides.
When standard Hastelloy N is annealed a t tem- peratures above about 2372OF, the M,C begins t o transform to a n intergranular lamellar product. Autoradiography, us ing 14C a s a tracer, shows that t h i s product is not a carbide and that the carbon seems t o b e rejected (F ig . 18.3). The blocky precipitates (Fig. 18.3) a re s e e n t o be
T h e carb ides a re very rich in s i l i con c o m -
~ ........_.. - 3H. E.. McCoy, MSR Program Semiann. Progr . R e p t .
A u g . 3 1 , 1965, ORNL-3872, pp. 91-102.
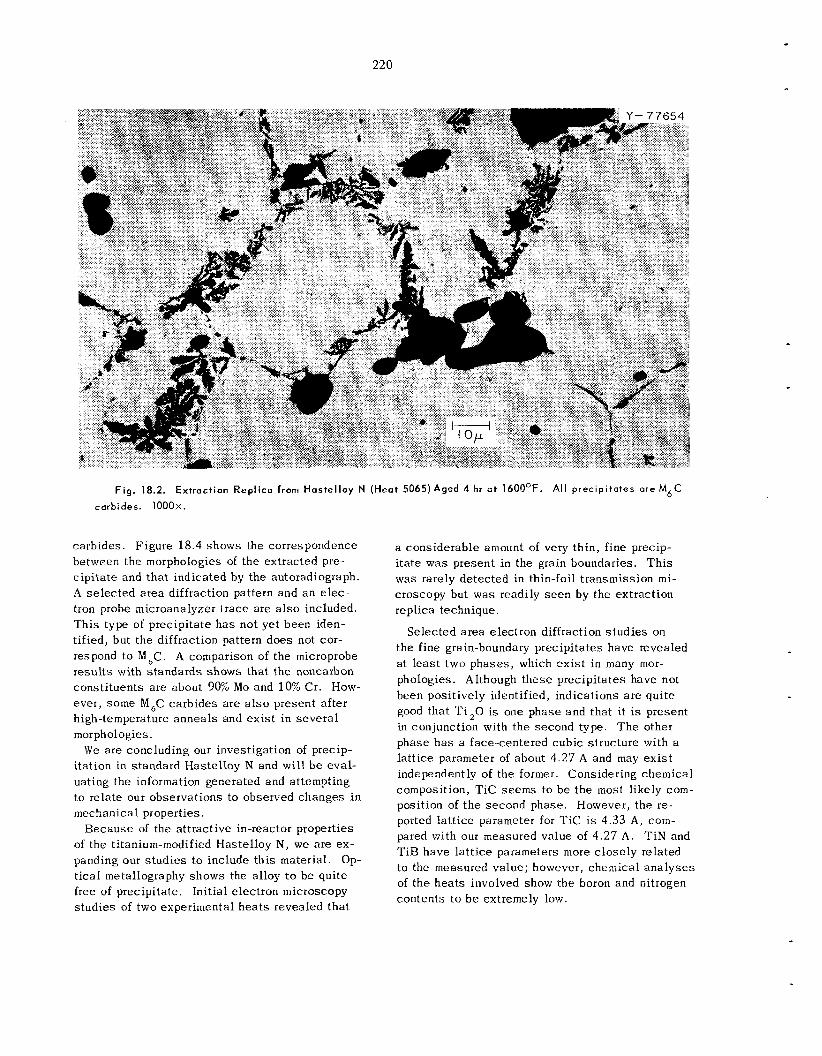
220
carbides. Figure 18.4 shows the correspondence between the morphologies of the extracted pre- c ip i ta te and tha t indicated by the autoradiograph. A se l ec t ed area diffraction pattern and a n elec- tron probe microanalyzer t race a re also included. Th i s type of precipitate h a s not yet been iden- t if ied, but the diffraction pattern does not cor- respond to MbC. A comparison of the microprobe resu l t s with s tandards shows that the noncarbon consti tuents a re about 90% Mo and 10% Cr. How- ever, some M,C carbides a re a l s o present after high-temperature annea l s and ex i s t in s eve ra l morphologies.
We a re concluding our investigation of precip- itation in standard Hastelloy N and wi l l b e eval- uating the information generated and attempting to re la te our observations to observed changes in mechanical properties.
Because of the attractive in-reactor properties of the titanium-modified Hastelloy N, we a re ex- panding our s tud ie s to include th i s material. t i ca l metallography shows the alloy to be quitc free of precipitate. Init ial electron microscopy s tudies of two experimental h e a t s revealed tha t
Op-
a considerable amount of very thin, f ine precip- i t a t e was present in the grain boundaries. T h i s was rarely detected in thin-foil transmission m i - croscopy but was readily s e e n by the e x t r a c t i m replica technique.
Selected a rea electron diffraction s tud ie s on the fine grain-boundary precipitates have revealed a t l ea s t two phases , which ex i s t in many mor- phologies. Although these precipitates have not been positively identified, indications a r e qui te good that Ti ,O is one phase and that i t i s present in conjunction with the second type. T h e other phase h a s a face-centered cubic structure with a latt ice parameter of about 4.27 A and may ex i s t independently of the former. Considering chemical composition, TIC seems to b e the most likely com- position of t he second phase. However, the re- ported la t t ice parameter for Tic is 4.33 A, com- pared with our measured value of 4.27 A. T iN and T i B have la t t ice parameters more c lose ly related to the measured value; however, chemical ana lyses of the hea t s involved show the boron and nitrogen contents t o b e extremely low.
F i g . 18.2. carbides. 1 0 0 0 ~ .
Extraction Rep l ica from Haste l loy N (Heat 5065)Aged 4 hr a t 1600OF. Al l precipi tates are M 6 C
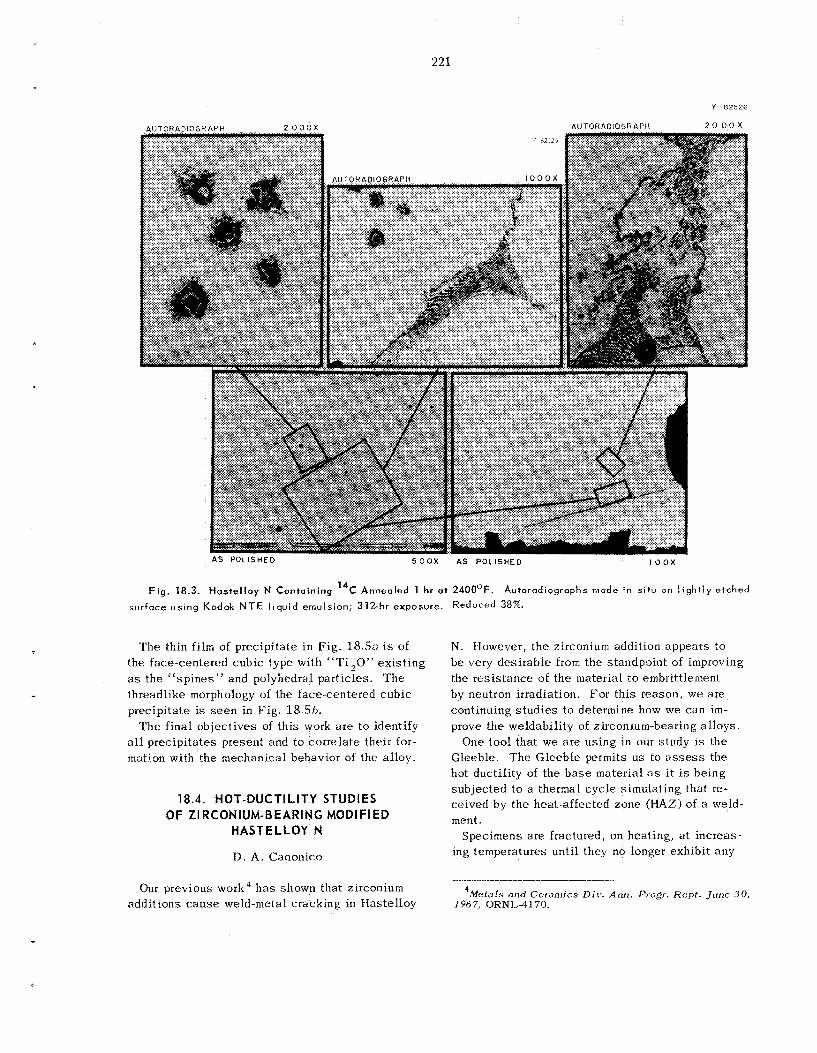
221
F i g . 18.3. Hastellay N Containing 14C Annealed 1 hr a t 240OOF. Autoradiographs made in situ o n lightly e t c h e d
surface us ing Kodak NTE l iquid emulsion; 312-hr exposure. Reduced 38%.
T h e thin film of precipitate i n Fig. 18.5a is of the face-centered cubic type with “Ti 20’’ ex i s t ing as the “ sp ines” and polyhedral particles. T h e threadlike morphology of the face-centered cubic precipitate is s e e n in F ig . 18.Sh.
T h e final ob jec t ives of th i s work a r e to identify all prec ip i ta tes present and to correlate their for- mation with the mechanical behavior ot the alloy.
N. However, t he zirconium addition appears to b e very des i rab le from the standpoint of improving the res i s tance of the material to embrittlement by neutron irradiation. For th i s reason, we are continuing s t u d i e s to determine how we can im- prove the welda t i l i ty of zirconium-bearing a l loys .
One tool that we a re us ing in our study is the Gleeble. T h e Gleeble permits us to assess the hot ducti l i ty of the b a s e material as it is being subjec ted to a thermal cyc le simulating tha t re- ceived by the heat-affected zone (HAZ) of a weld-
Specimens a re fractured, on heating, a t increas-
18.4. HOT-DUCTILITY STUDIES
HASTELLOY N
D. A . Canonico
OF ZI RCONIUM-BEARING MODlFlED ment.
ing temperatures until they no longer exhibit any
~
4Meta1s and Ceramics Div. Ann. Progr. R e p . J ~ m e 30 , Our previous work4 h a s shown that zirconium additions c a u s e weld-metal cracking in Hastelloy I 96 7, ORNT .-4 1 70.
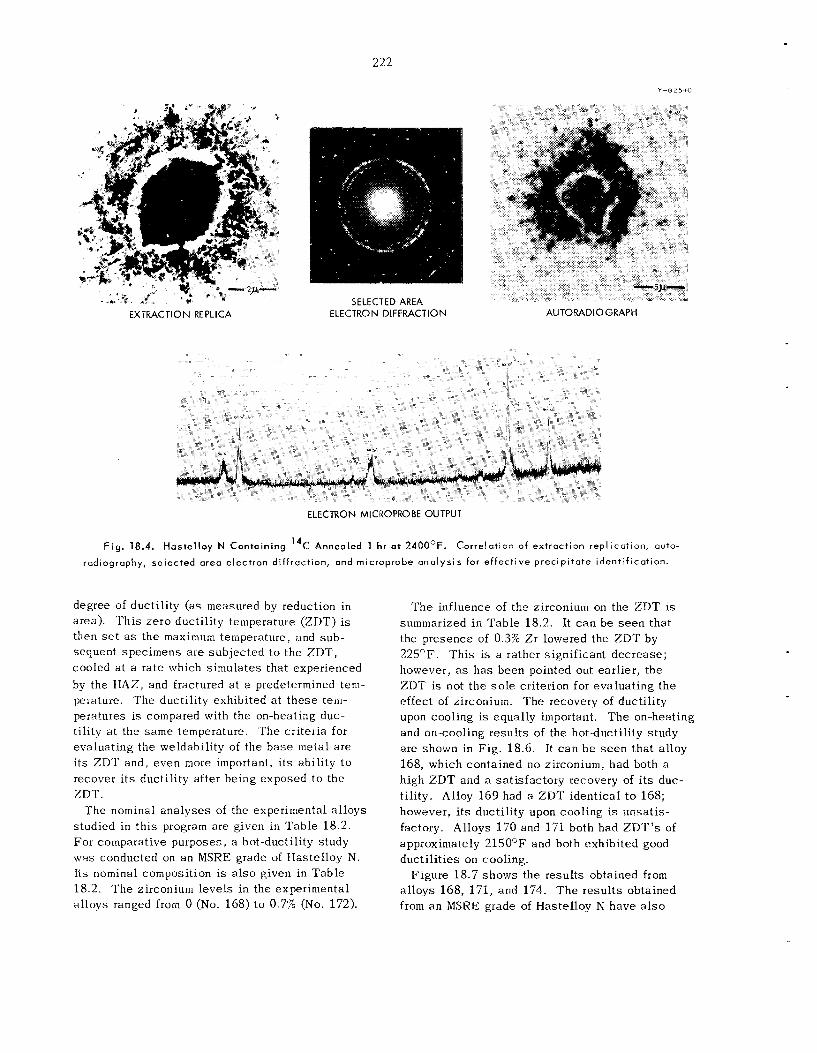
222
Y--8254C
EX TRAC T I 0 N RE PLICA SELECTED AREA
ELECTRON DIFFRACTION AUTO M D l O GRAPH
ELECTRON MICROPROBE OUTPUT
F ig . 18.4. Haste l loy N Containing 14C Annealed 1 hr a t 24OOOF. Correlat ion of extract ion repl icat ion, auto-
radiography, selected area electron di f f ract ion, and microprobe ana lys is for e f fec t i ve p rec ip i ta te ident i f icat ion.
degree of ducti l i ty (as measured by reduction in area). 'This zero ductility temperature (ZDT) is then s e t a s the maximum temperature, and sub- sequent specimens a re subjec ted to the ZDT, cooled a t a rate which s imula tes that experienced by the IIAZ, and fractured a t a predetermined tem- perature. The ductility exhibited a t t hese tem- peratures i s compared with the on-heating duc- tility a t the same temperature. 'The cri teria for evaluating the weldability of the b a s e metal a r e i t s Z D T and, even more important, i t s abil i ty t o recover i t s ducti l i ty after being exposed to the m ' r .
'The nominal ana lyses of the experimental a l loys studied in th i s program are given in 'Table 18.2. For comparative purposes, a hot-ductility study w a s conducted on an MSRE grade of Hastelloy N. Its nominal composition is a l s o given in Table 18.2. T h e zirconium leve ls i n the experimental a l loys ranged from 0 (No. 168) to 0.7% (No. 172).
T h e influence of the zirconium on the ZDT is summarized in Table 18 .2 . Kt c a n be s e e n tha t the presence of 0.3% Zr lowered the ZDT by 225°F. Th i s is a rather significant decrease ; however, as h a s been pointed out earlier, the ZDT i s not t he s o l e criterion for eva lua t ing the effect of zirconium. The recovery of ductil i ty upon cooling is equally important. T h e on-heating and on-cooling resu l t s of the ho tduc t i l i t y study are shown in F ig . 18.6. It c a n b e s e e n that alloy 168, which contained no zirconium, had both a high ZDT and a satisfactory recovery of i t s duc- t i l i ty. Alloy 169 had a ZDT ident ica l t o 158; however, i t s ducti l i ty upon cooling is unsa t i s - factory. Alloys 170 and 171 both had ZDT's of appioxirnately 2150OF and both exhibited good ductil i t ies on cooling.
F igure 18.7 shows the results obtained from a l loys 168 , 171, and 174. T h e resu l t s obtained from a n MSRE grade of Hastelloy N have a l s o

223
Fig. 18.5. Hasvellcy N (T i tanium Modified, H e a t 66-
548) Annealed 1 hr a t 215OoF, Aged 30 min a t About
1200" F. by extraction repl ica technique.
Typi caI precipi tote morphologies determined
been included. It c a n b e s e e n in Fig. 18.73 tha t t h e Hastelloy N modified by reducing the molyb- denum content (No. 168) is superior to the corn- mercial inaterial (INSRE grade Has te l loy N). T h e addition of 0.5% Z r to the modified alloy lowers the ZDT by 225°F. As is shown in Fig. 18.7b,
T a b l e 18.2. The Z e r o Duct i l i ty Temperature
of the Base Mater ia ls Studied
K educ ti on Identification Composition (wt X )
1 Wuinber N i Mo Cr Fe Z r ("F) ZDT in AreaB
(a)
I G R ha1 1 2 7 2350 22 169 bal 12 7 0.1 2350 21 1 7 0 bal 12 7 0.3 2125 2 0 171 ba l 12 7 0.5 2125 32 172 ba l 12 7 0.7 2120 5
lllSRE grade bal 16 4 2300 3 Hastelloy N
aMeasured a t 50°F below ZDT.
the recovery of al l four of these a l loys i s quite good. Exce l len t recovery is exhibited by alloy 174. Its recovery of ducti l i ty was nearly instan- taneous and t o a rather high level; however, from the standpoint of weldability, its low ZDT is not acceptab le .
Further efforts wi l l be made to develop a zir- conium-bearing alloy with a higher ZDT. If we c a n find a combination of alloying elements that will r a i se the ZDT and retain the good recovery charac te r i s t ics , w e s h a l l proceed further with the development of th i s alloy sys tem.
18.5. RESIDUAL STRESS MEASUREMENTS IN HASTELLOY N WELDS
A. G. Cepolina
Welding inherently l eads to large residual s t r e s s e s . T h e s e s t r e s s e s c a n lead to dimensional changes and c a n even b e large enough t o c a u s e c racks in the weldment. For t h e s e reasons we have init iated a study t o investigate the s t r e s s distribution in and near welds in Hastelloy N. A technique was developed which allowed con- tinuous reading of the s t r e s s va lues , thus making it poss ib le to know, with sufficient precision, the s t r e s s gradient ad jacent to the weld axis. Fo r th i s s tudy , a 12-in.-diam, '/,-in.-thick p iece of Hastelloy N b a s e metal was used . Two circular bead-on-plate welds were simultaneously made, one on each s i d e of the plate. 'The diameter of the
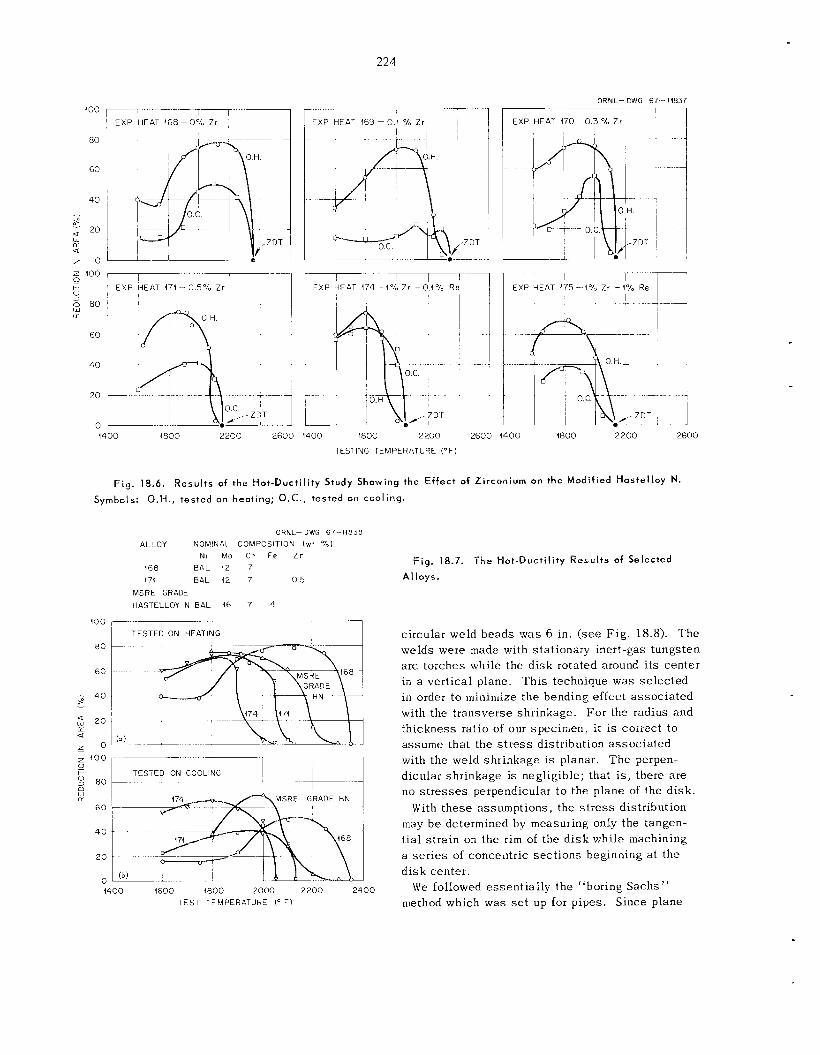
224
ORNL--DWG 6 1 (1837 ~ - -1 - _.
EXP HEAT 168-0% Zr
t -
L
z 100 i , e
n 80
EXP HEAT 171 - 0 5% Z r 0 3
Id u
EXP HEAT 169 - 0 4 % Z r , EXP HEAT 169 - 0 4 % Z r
- I 1 1 EXP HEAT 474-1% Z r -0.1% R e I
, EXP HEAT 170 -0.3 % Z r i
EXP HEAT 115 - - - 1 % L r - 4 % Re
4400 1800 2200 2 6 0 0 4400 1800 2 2 0 0 2 6 0 0 1400 1800 2 2 0 0 2 6 0 0
TESTING TEMPERATURE (OF)
Fig . 18.6. Results of the Hot-Duct i l i ty Study Showing t h e Ef fec t of Zirconium on the Modified Hastel loy N. Symbols: O.H., tested on heating; O.C., tested on ccol ing.
URNL-DWG 67 11838 ALLOY NOKlhiAL COMPOSITION ( w t % I
NI Mo C r F e Z r 168 B A L i 2 7 474 BAL 12 7 0 5
MSRE GRADE HASTELLOY N B A L 46 7 4
”O r T E S T E b I N G 8 0
60
- 4 0 a-” I
5 2 0 lx a r O - z 100 0
3 8 0 a IT MSRF GRADE H N
60
TESTED ON COOLING 0
1.1
40
2 0
0 1409 1600 1800 2000 2 2 0 0 2 4 0 0
TEST TEMPERATURE F)
Fig . 18.7. The Hot -Duct i l i ty Results of Selected
Al loys.
circular weld beads was 6 in. ( s ee F ig . 18.8). The welds were made with stationary inert-gas tungsten arc torches while the d isk rotated around i t s center in a vertical plane. i n order t o minimize the bending effect a s soc ia t ed with the transverse shrinkage. For the radius and th ickness ratio of our specimen, it is correct t o assume that the s t r e s s distribution a s soc ia t ed with the weld shrinkage is planar. T h e perpen- dicular shrinkage is negligible; that i s , there are no s t r e s s e s perpendicular t o the plane of the d isk .
With these assumptions, the s t r e s s distribution may b e determined by measuring only the tangen- t ia l s t ra in on the r i m of the d i sk while machining a s e r i e s of concentric sec t ions beginning at the d i sk center .
We followed essent ia l ly the “boring Sachs” nrethod which w a s s e t up for pipes . Since plane
Th i s technique was se lec ted

225
ORFIL-UIWG 67-11440 ORWL-DWG 67-tIP39
!- in -THICK PLATE
Fig . 18.8. Sketch Showing the Locat ion of the Weld
Bead in Re la t ion to the Overal l Specimen Geometry.
s t ra in and s t r e s s problems c a n be s tudied with the same equations, the relationships for t he pipe will be valid for t he d i s k with the elimination of t he terms due to the longitudinal s t r e s s e s : F i g . 18.9. P ic tor ia l Explanat ion ob the Symbols Used
in the Stress Distr ibut ion Equations.
< j t = E ( A , - A ) - - - [ dA A o + A e l 2 A
(see Fig . 18.9),
where
i~~ = radial s t r e s s ,
ct = tangential s t r e s s ,
E = Young’s modulus for t h e d i sk material,
e = to ta l t angent ia l s t ra in measured on the ex terna l rim,
R , = disk radius, R = internal hole radius,
A , = in i t ia l d i sk a rea ,
A = hole a rea .
T h e tangent ia l s t ra in is measured by s t ra in gages that a r e mounted on the ex terna l rim with their a x e s oriented along the middle of the rim th ickness (see Fig. 18.10). We used the gages recommended for s t r e s s measurement, type MM EA06 500 BH. T h e s e self-compensated strain gages have low t ransversa l sens i t iv i ty and a r e s t ab le over a relatively long t ime period. ’The
F i g . 18.10. Locat ion of the Strain Gages Used t o
Measure the Tangential Strain.
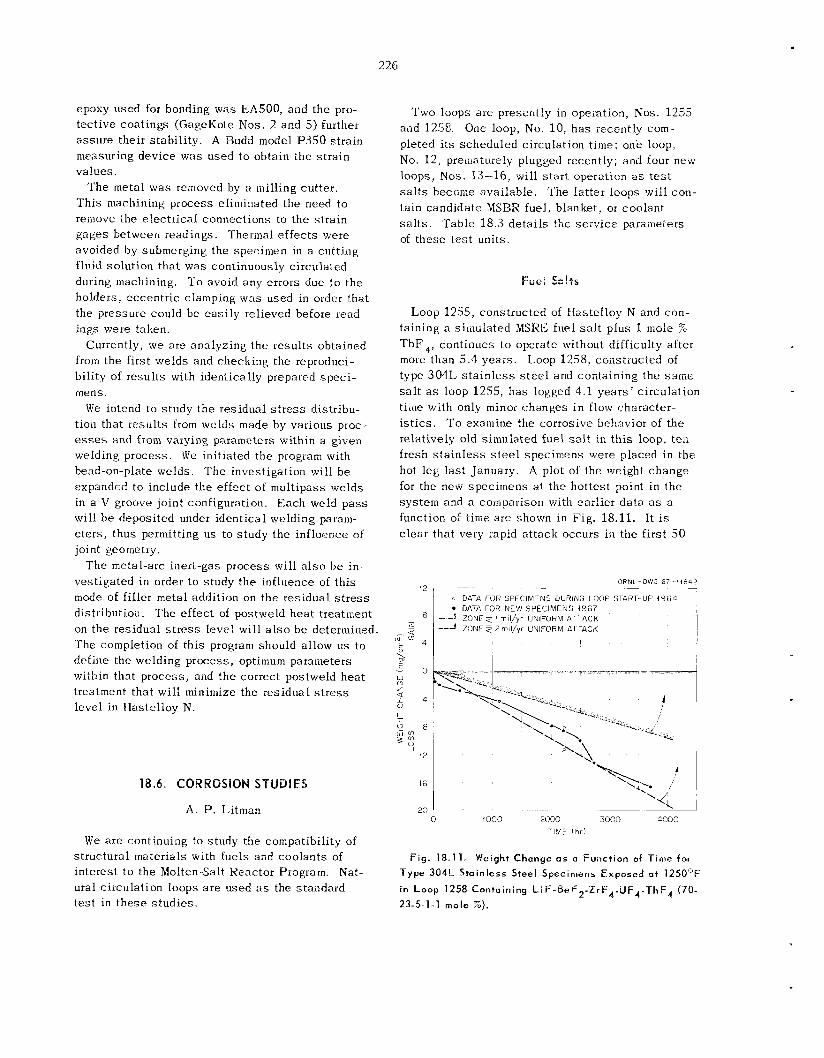
226
12
5 _ a
N W
E 4
epoxy used for bonding was EA500, and the pro- tective coatings (GageKote Nos. 2 and 5 ) further a s su re their s tab i l i ty . A Budd model P.350 strain mcnsuring device was used t o obtain t h e s t ra in va lues .
The metal was removed by a milling cu t te r , Th i s machining process eliminated the need to reiilove the e lec t r ica l connections to the strain gages between readings. Thermal e f fec ts were avoided by submerging the specimen in a cutt ing fluid solution tha t was continuously circulated during machining. To avoid any errors due to the holders, eccent r ic clamping was used in order that the pressure could be eas i ly relieved before read- ings were taken.
Currently, we are analyzing the resu l t s obtained from the first welds and checking the reproduci- bility of resu l t s with identically prepared spec i - mens.
We intend to study the residual s t r e s s distribu- tion that resu l t s from weld:; made by various proc- esses and from varying parameters within a given welding process . We initiated the program with bead-on-plate welds. The investigation will b e expanded to include the e f fec t of multipass welds in a V-groove joint configuration. Each weld p a s s will be deposited under ident ica l welding param- e te rs , thus permitting u s to study the influence of joint geometry.
T h e metal-arc inert-gas process will a l s o b e in - vestigated in order t o study the influence of this mode of filler metal addition on the residual s t r e s s distribution. The effect of postweld hea t treatment on the residual s t r e s s leve l will a l s o be determined The completion of th i s program should allow us to define the welding process, optimum parameters within that p rocess , and the correct postweld hea t treatment that will minimize the residua1 s t r e s s level in Hastelloy N.
~-~ DATA FOR SPECIMENS DURING LOOP STfiRT-UP 4964 DfiTfi FOR NCW SPEC'NIFV5 1967 - -' LONE 7 1 rnil/yr UNIFORM ATTACK
z mi/yr UNIFORM ATTACK --A LONC
1
18.6. CORROSION STUDIES
A . P. Litman
T w o loops a re presently in operation, Nos. 1255 and 1258. One loop, No. 10, h a s recently com- pleted i t s scheduled circulation time; one loop, No. 12 , prematurely plugged recently; and four new
s a l t s become ava i lab le . The latter loops will con- ta in candidate MSBR fuel, blanket, or coolant s a l t s . Table 18 .3 de ta i l s the se rv ice parameters of these t e s t units.
loops, N o s . 13-16, will start. operation a, = t e s t
Loop 12.55, constructed of Hastelloy N and con- taining a simulated MSRE fuel s a l t plus 1 mole % T h F 4 , continues to operate without difficulty after more than 5.4 years . Loop 1258, constructed of type 304L s t a i n l e s s s t e e l and containing the same s a l t a s loop 12.55, h a s logged 4.1 yea r s ' circulation time with only minor changes i n flow character- i s t i c s . To examine the corrosive behavior of the relatively old simulated fuel s a l t in th i s loop, ten fresh s t a i n l e s s steel specimens were placed in the hot l eg l a s t January. A plot of thc weight change for the new specimens a t the hottest point i n the sys tem and a comparison with earlier data a s a function of time are shown in Fig. 18.11. It is c lear that very rapid a t tack occurs in the first 5 0
ORNL-DWG 5 7 ~ 1 1 8 4 2
1000 2000 3000 4000 T l V E (h r )
0
We a r e continuing to study the compatibility of structural materials with fue l s and coolan ts of interest t o the Molten-Salt Reactor Program. Nat- ural-circulation loops a r e used a s the standard t e s t in t hese s tud ie s .
Fig. 18.11. Weight Change a s a Funct ion of T i m e for
Type 304L Stainless Steel Specimens Exposed at 1250°F in Loop 1258 Containing L i G - B e f 2 - Z r F q . U F q - T h F ~ (70- 23-5-1-1 mole %),
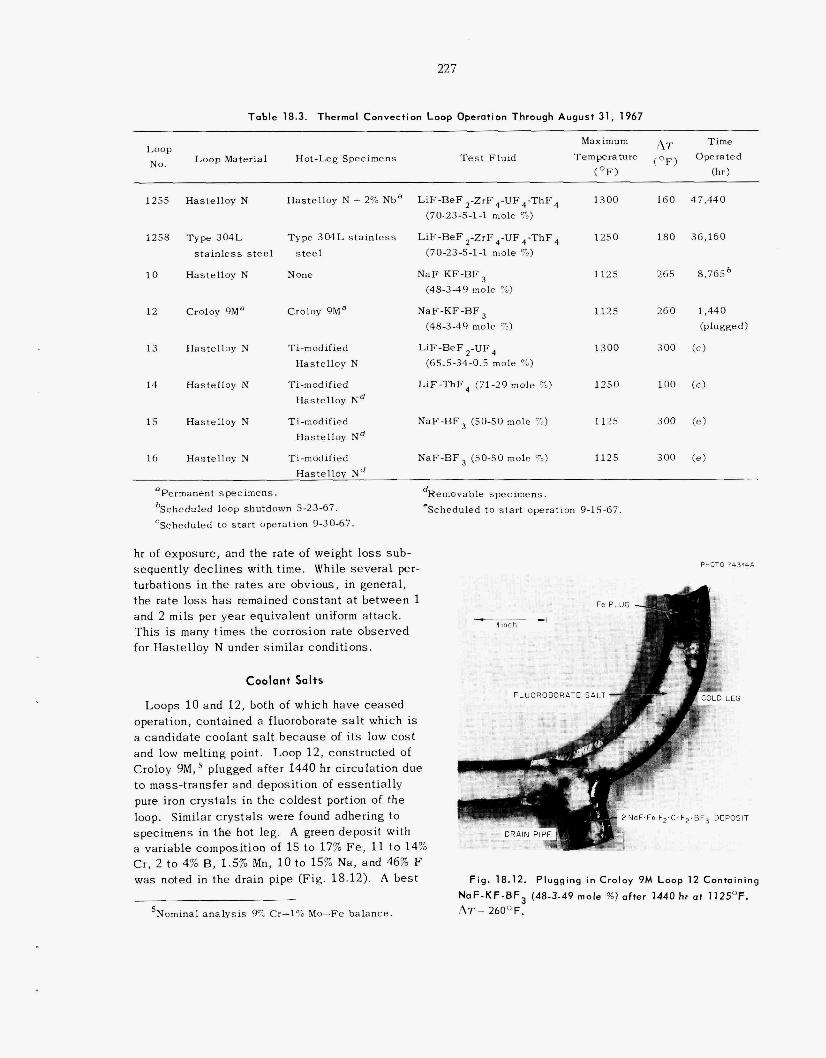
227
Toble 18.3. Thermal Convection Loop Operation Through August 31, 1967
1255 Hastelloy N Hastelloy N + 2% Nba
1258 Type 304L Type 304L s t a i n l e s s
s t a i n l e s s s t e e l s t e e l
1 0 Hastelloy N None
12 Croloy 9Ma
13 Hastelloy h
14 Hastelloy N
15 Hastelloy N
Croloy 9Ma
Ti-modified Hastelloy N
TI-modified Hastelloy Nd
Ti-modified Hastelloy Nd
16 Hastelloy N Ti-modified
‘Scheduled to s t a r t operation 9-30-67.
LiF-BeF 2-ZrF ,-UF,-ThF, (70-23-5-1-1 mole 70)
LiF-BeF ,-ZrF,-UF,-ThF, (70-23-5-1-1 mole 70)
NaF-KF-BF (48-349 mole X)
NaF-KF-BF (48-3-49 mole %)
LiF-BeF 2-UF4 (65.5-34-0.5 mole %)
LiF-ThF, (71-29 mole X)
NaF-BF3 (SO-SO mole %)
NaF-BF3 (SO-SO mole 7%)
1300 160 47,440
1250 180 36,160
1125
1125
1300
1250
1125
1125
265 8,765b
100 ( c )
300 (e)
300 (e)
hr of exposure, and the rate of weight loss sub- sequently dec l ines with t i m e . While s eve ra l per- turbations in the r a t e s are obvious, i n general, the ra te loss h a s remained cons tan t at between 1 and 2 mils per year equivalent uniform at tack. This is many times the corrosion rate observed for Hastelloy N under similar conditions.
Coolant Salts
Loops 10 and 12, both of which have ceased operation, contained a fluoroborate s a l t which is a candida te coolant salt because of its low c o s t and low melting point. Loop 12 , constructed of Croloy 9M, t o mass-transfer and deposit ion of essent ia l ly pure iron c rys t a l s in the co ldes t portion of the loop. Similar c rys t a l s were found adhering to specimens in the leg. A green dep a variable compo Cr, 2 to 4% B, 1.5% Mn, 10 to 15% Na, and 46% F was noted in the drain pipe (Fig. 18.12). A bes t
plugged after 1440 hr circulation due
n of 15 to 17% Fe, 11 t o 14%
~
dRemovable specimens. eScheduled to s ta r t operation 9-15-67.
SNommal ana lys i s % Cr-1% Mo-Fe balance.
Fig . 18.12. Plugging in Croloy 9M Loop 12 Containing
N a F - K F - B F 3 (48-3-49 mole %) after 1440 hr at 1125OF. A T = 260OF.
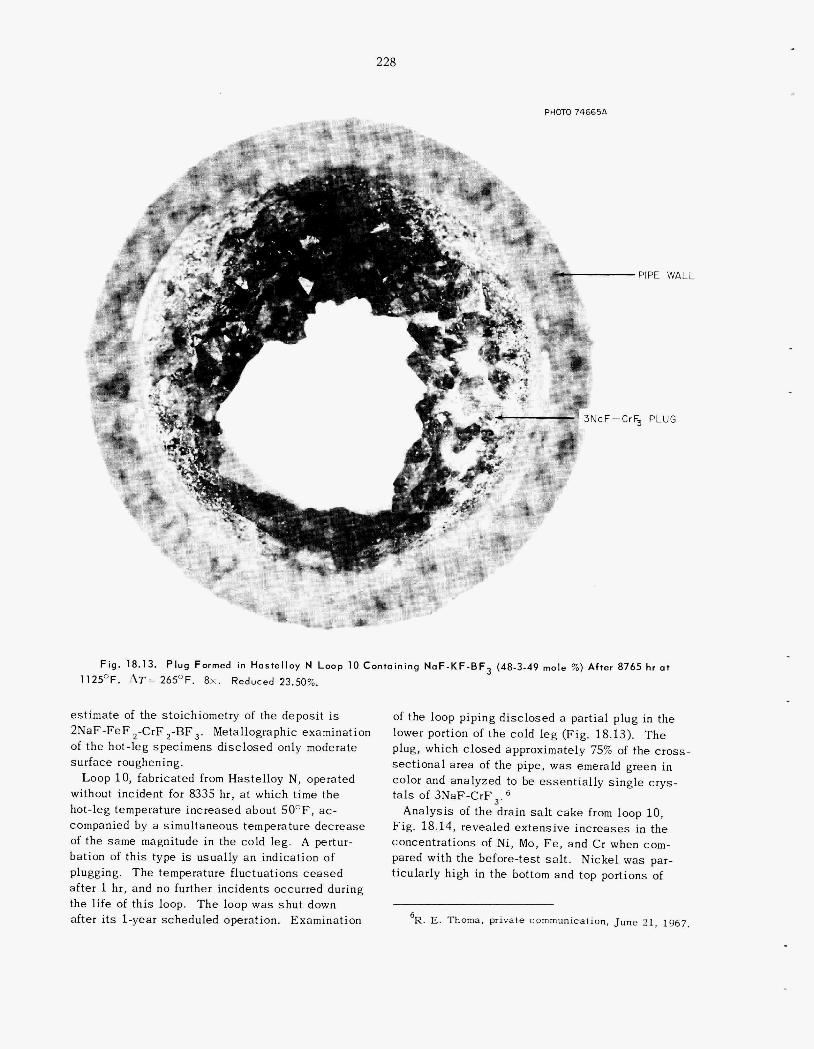
228
PHOTO74665A
c
Pi PE - P
F - 0 5 PLI
W A l
J G
L
Fig. 18.13. P l u g Formed in H a s t e l l o y N Loop 10 Conta in ing N a F - K F - B F 3 (48-3-49 mole %) After 8765 hr a t
1125OF. A T = 265OF. 8 ~ . Reduced 23.50%.
estimate of the stoichiometry of the deposit i s 2NaF-FeF ,-CrF ,-BF,. Metallographic examination of the hot-leg specimens d isc losed only moderate surface roughening.
Loop 10, fabricated from Hastelloy N, operated without incident for 8335 hr, a t which time the hot-leg temperature increased about 50"F, ac- companied by a simultaneous temperature decrease of the same magnitude in the cold leg. A pertur- bation of th i s type is usually an indication of plugging. The temperature fluctuations ceased after 1 hr, and no further incidents occurred during the life of t h i s loop. The loop was shu t down after i t s 1-year scheduled operation. Examination
of the loop piping d isc losed a partial plug in the lower portion of the cold leg (Fig. 18.13). T h e plug, which c losed approximately 7 sec t iona l a r ea of the pipe, was emerald green in color and analyzed to be essent ia l ly s ing le crys- t a l s of 3NaF-CrF,.6
Analysis of the drain s a l t cake from loop 10, Fig. 18.14, revealed ex tens ive inc reases in the concentrations of Ni, Mo, Fe, and Cr when com- pared with the before-test salt. Nickel was par- ticularly high in the bottom and top portions of
'R. E. n o m a , private c
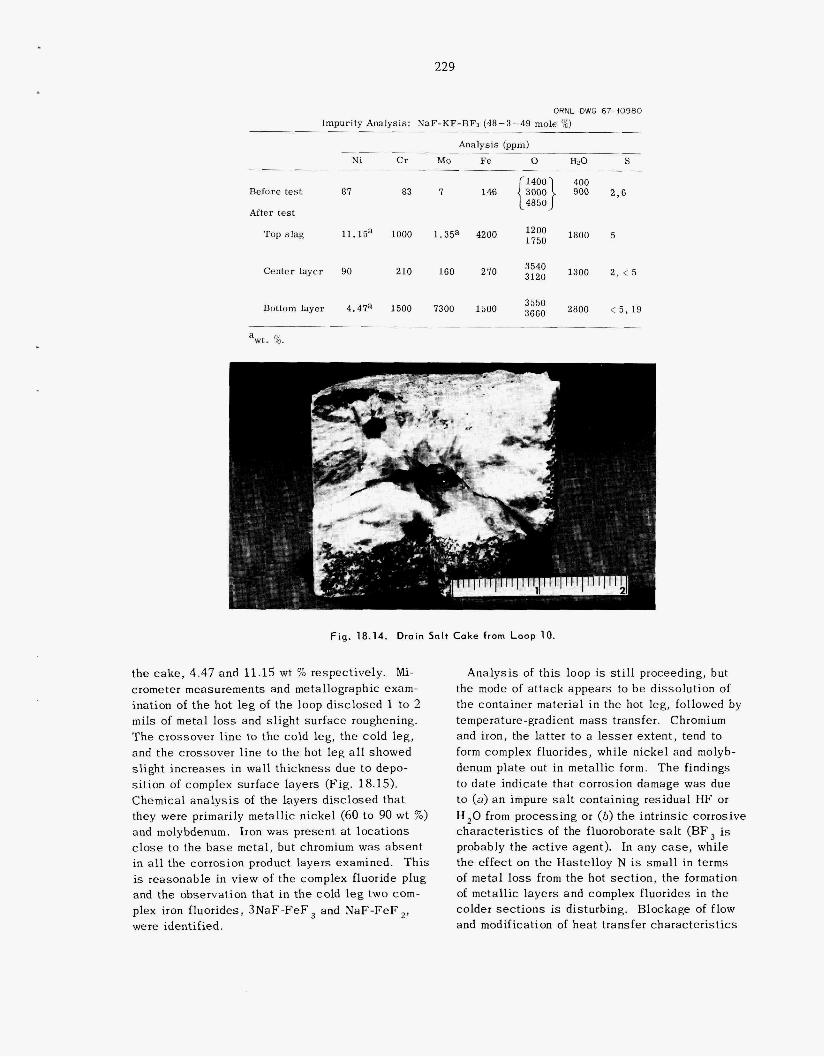
229
ORNL-DWG 67-io980 Impurity Analysis: NaF-KF-BFs (48-3-49 mole %)
Analysis (ppm)
Ni Cr Mo Fe 0 HZO S
Before test 87 83 7
After
Top slag 11.15a 1000 1 . 3 5 ” 4200 1800 t
Center layer 90 210 160 270 3120 3540 1300 2, < 5
Bottom layer 4.4Ta 1500 7300 1500 2800 < 5 , 19
Fig. 18.14. Drain Salt Cake from Loop 10.
the cake , 4.47 and 11.15 wt % respectively. Mi- crometer measurements and metallographic exam- ination of the hot l e g of the loop disclosed 1 to 2 m i l s of metal l o s s and s l igh t surface roughening. T h e crossover l ine to the cold leg, the cold leg, and the crossover l ine to the hot l e g all showed slight increases in wall thickness due to depo- s i t ion of complex surface layers (Fig. 18.15). Chemical ana lys i s of the layers d i sc losed tha t they were primarily metall ic nickel (60 to 90 wt %) and molybdenum. Iron was present at locat ions close to the b a s e metal, but chromium was absent in all the corrosion product layers examined. T h i s is reasonable in view of the complex fluoride plug and the observation tha t in t h e cold l e g two com- plex iron f luorides , 3 N a F - F e F 3 and NaF-FeF 2 ,
were identified.
Analysis of this loop is still proceeding, but the mode of a t tack appears to b e dissolution of the container material in the hot leg, followed by temperature-gradient m a s s transfer. Chromium and iron, the la t ter to a l e s s e r extent , tend to form complex fluorides, while nickel and molyb- denum plate out i n metall ic form. T h e findings tQ da te indicate that corrosion damage was due to (a ) a n impure s a l t containing residual HF or H,O from processing or (b) t h e intr insic corrosive charac te r i s t ics of the fluoroborate s a l t (BF is probably the ac t ive agent). In any case, while the effect on the Hastel loy N is small in terms of metal loss from the hot sect ion, the formation of metall ic layers and complex fluorides in the colder s e c t i o n s is disturbing. Blockage of flow and modification of h e a t transfer character is t ics
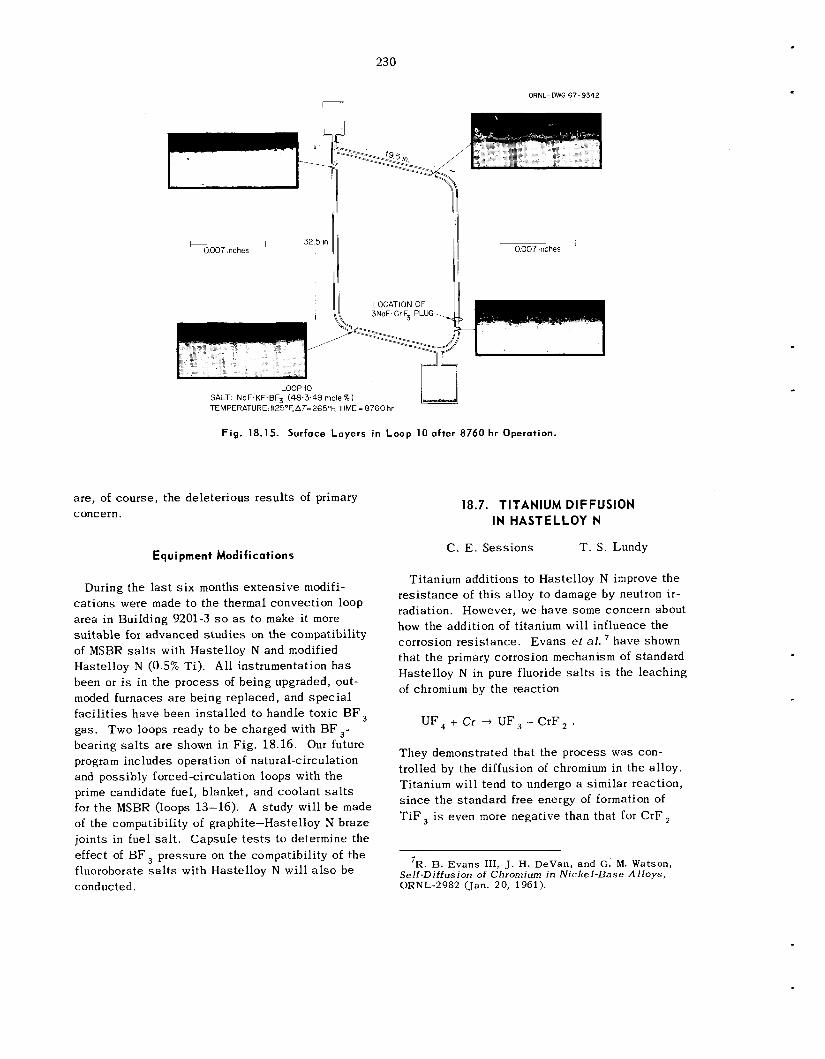
230
ORNL-DWG67-9342 iTi
I I
' 32 5 in 0007 inches
I
LOOP 10 SALT NoF KF BF3 (48 3 49 mole%) TEMPERATURE 1125DF,AT=2650F; TIME = 8760 hr
F i g . 18.15. Surface Layers in Loop 10 after 8760 hr Operation.
are, of course , the deleterious resu l t s of primary concern.
Equipment Modifications
During the last s i x months ex tens ive modifi- ca t ions were made t o the thermal convection loop area in Building 9201-3 s o a s t o make i t more su i t ab le for advanced s tud ie s on the compatibility of MSBR salts with Hastelloy N and modified Hastelloy N (0.5% Ti) . All instrumentation h a s been or i s in the process of be ing upgraded, out- moded furnaces a r e being replaced, and spec ia l fac i l i t i es have been installed to handle toxic BF, gas. Two loops ready t o b e charged with BF,- bearing salts are shown in F ig . 18.16. Our future program inc ludes operation of natural-circulation and possibly forcedc i rcu la t ion loops with the prime candida te fuel, blanket, and coolant s a l t s for t he MSBR (loops 13-16). A study will b e made of the compatibility of graphite-Hastelloy N braze joints in fuel s a l t . Capsu le t e s t s t o determine the e f fec t of BF, pressure on the compatibility of the fluoroborate s a l t s with Hastelloy N will also be conducted.
18.7. TITANIUM DIFFUSION IN HASTELLOY N
C. E. Sess ions T . S. Lundy
Titanium additions to Hastelloy N improve the res i s tance of th i s alloy to damage by neutron ir- radiation. However, we have some concern about how the addition of titanium will influence the corrosion res i s tance . Evans e t al. have shown that t h e primary corrosion mechanism of standard Hastelloy N in pure fluoride s a l t s is the leaching of chromium by the reaction
UF , + Cr -+ UF, + C r F ,
They demonstrated that the process was con- trolled by the diffusion of chromium in the a l loy . Titanium will tend to undergo a similar reaction, s i n c e the s tandard free energy of formation of TiF i s even more negative than that for C r F ,
'R. B. Evans 111, J. H. DeVan, and G. M. Watson, Self-Diffusion of Chromium in Nicke l -Base A l loys , ORNL-2982 (Jan. 20, 1961).
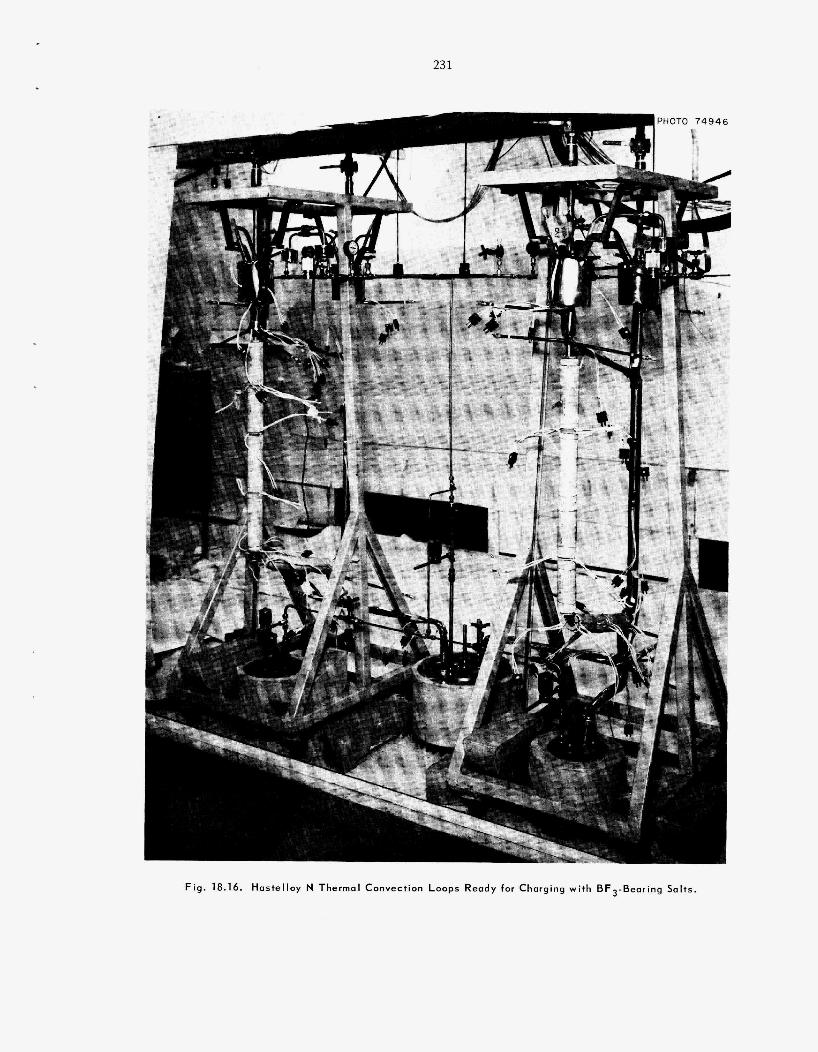
231
Fig. 18.16. Hastelloy N Thermal Convection Loops Ready for Charging wi th BFg-Bear ing Salts.
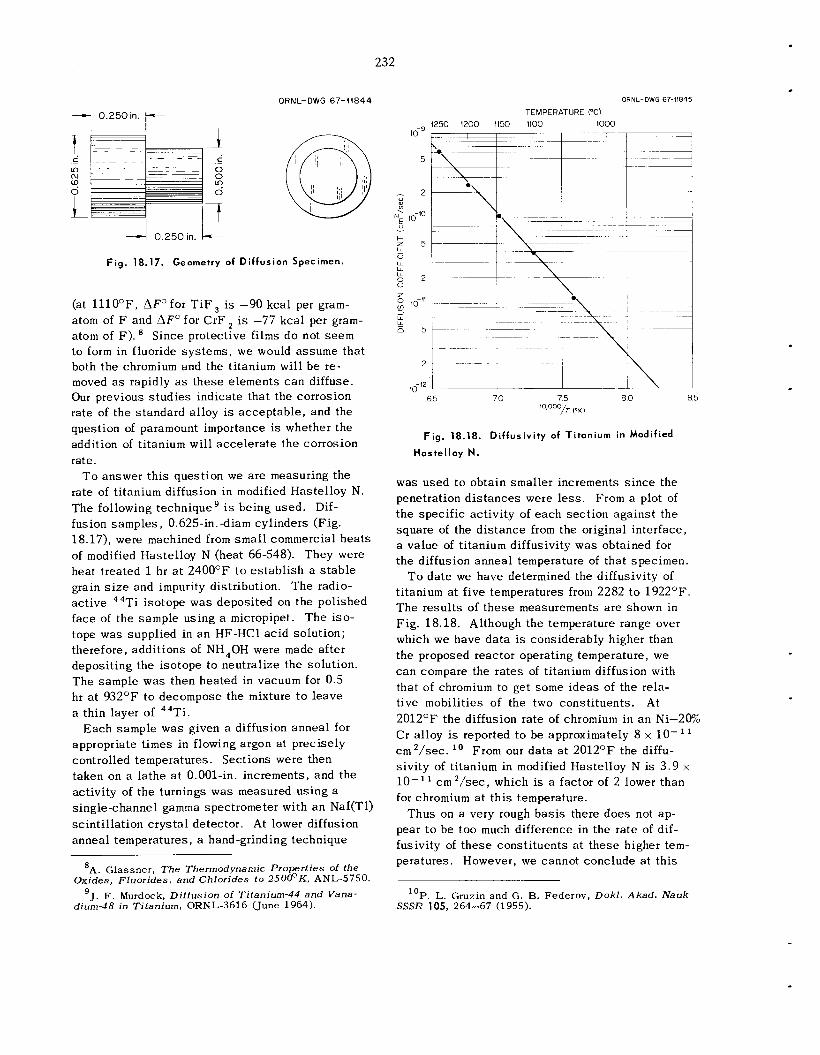
232
ORNL-DWG 67-14844
0.250in. It
4 0.250in. I-
Fig . 18.17. Geometry of Di f fus ion Specimen.
(at 1110"F, AFo for TiF, is -90 kca l per gram- atom of F and AFOfor C r F , is -77 kca l per gram- atom of F). to form in fluoride sys tems, we would assume tha t both the chromium and the titanium will b e re- moved as rapidly as these e lements c a n diffuse. Our previous s tud ie s indicate tha t t he corrosion rate of the s tandard alloy is acceptab le , and the question of paramount importance is whether the addition of titanium will acce le ra te t he corrosion rate.
To answer th i s ques t ion we a r e measuring the rate of titanium diffusion in modified Hastelloy N. The following techniqueg i s be ing used . Dif- fusion samples , 0.625-in.-diam cylinders (Fig. 18.17), were machined from sma l l commercial hea t s of modified Hastelloy N (heat 66-548). They were hea t treated 1 hr a t 2400°F t o e s t ab l i sh a s t a b l e grain size and impurity distribution. T h e radio- ac t ive 44Ti i so tope w a s deposited on the polished face of the sample us ing a micropipet. T h e iso- tope was supplied in a n HF-HC1 ac id solution; therefore, addi t ions of NH40H were made after deposit ing the i so tope to neutralize the solution. T h e sample was then hea ted in vacuum for 0.5 hr a t 932°F t o decompose the mixture to l eave a thin layer of 44Ti.
appropriate t imes in flowing argon a t precisely controlled temperatures. Sections were then taken on a la the a t 0,001-in. increments, and the activity of the turnings w a s measured us ing a single-channel gamma spectrometer with a n NaI(T1) sc in t i l l a t ion c rys t a l detector. At lower diffusion annea l temperatures, a hand-grinding technique
S ince protective films d o not seem
Each sample w a s given a diffusion annea l for
'A. Glassner , The Thermodynamic Properties o f the Oxides , Fluorides, and Chlorides to 250@K, ANL-5750.
'J. F . Murdock, D i f fus ion of Titanium-44 and Vana- dium-48 in Titanium, ORNL-3616 (June 1964).
ORNL-DWG 67.11845
TEMPERATURE 1250 1200 1150 It00 1000
10.'
5
Fig . 18.18. Haste l loy N.
Di f fus iv i ty of T i tanium in Modified
was used t o obtain smaller increments s i n c e the penetration d i s t ances were less. From a plot of t he spec i f ic activity of e a c h sec t ion aga ins t t he square of the d i s t ance from the original interface, a value of titanium diffusivity w a s obtained for t he diffusion annea l temperature of tha t specimen.
To da te we have determined the diffusivity of titanium at f ive temperatures from 2282 to 1922°F. T h e resu l t s of t h e s e measurements a r e shown in F ig . 18.18. Although the temperature range over which w e have da ta is considerably higher than the proposed reactor operating temperature, we c a n compare the r a t e s of titanium diffusion with that of chromium to get some i d e a s of the rela- t ive mobili t ies of the two consti tuents. At 2012°F the diffusion rate of chromium in a n Ni-20% Cr alloy is reported to be approximately 8 x 10- l 1
cm2/sec . l o From our da t a a t 2012°F the diffu- s iv i ty of titanium in modified Hastelloy N is 3.9 x lo - ' for chromium a t t h i s temperature.
Thus on a very rough b a s i s there does not ap- pear t o be too much difference in the rate of dif- fusivity of these cons t i tuents at t hese higher tem- peratures. However, we cannot conclude a t t h i s
c m '/set, which is a factor of 2 lower than
lop. L. Gruzin and G . B. Federov , Dokl . Akad . Nauk SSSR 105, 264-67 (1955).
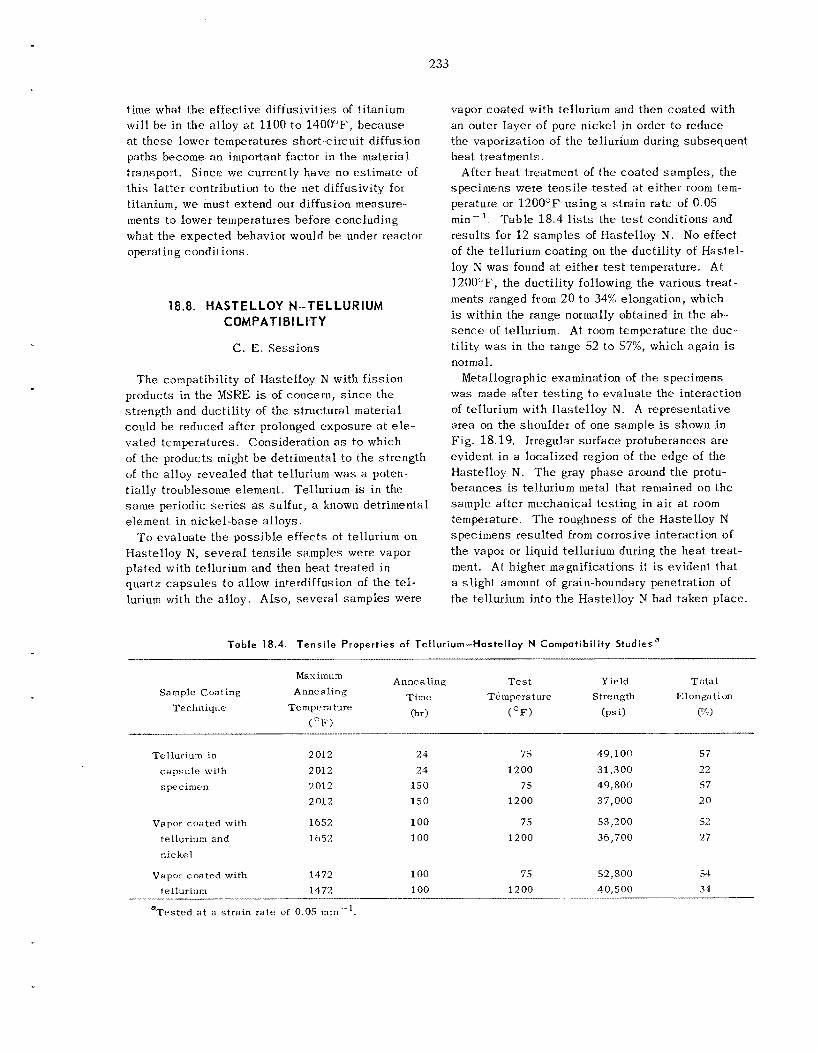
233
time what the effective diffusivit ies of titanium wil l be in the a l loy a t 1100 to 1400°F, because a t t hese lower temperatures short-circuit diffusion paths become a n important factor i n the materia1 transport. S ince we currently have no es t imate of this latter contribution to the net diffusivity for titanium, we must extend our diffusion measure- ments to lower temperatures before concluding what t he expected behavior would b e under reactor operating condil ions .
18.8. HASTELLOY N-TELLURIUM COMPATIBILITY
C. E . Sess ions
The compatibility of IJastelloy N with f i ss ion products in the MSRE is of concern, s i n c e the strength and ductil i ty of the structural material could b e reduced after prolonged exposure a t ele- vated temperatures. Consideration a s to which of t he products imight b e detrimental to the strength of the alloy revealed that tellurium was a poten- t ially troublesome element. Tellurium is i n the same periodic s e r i e s as sulfur, a known detrimental element in nickel-base a l loys .
'Yo eva lua te the poss ib le e f f ec t s of tellurium on Hastelloy N, s eve ra l t ens i le samples were vapor plated with tellurium and then hea t treated in quartz capsu le s to allow interdiffusion of the tel- lurium with t h e alloy. Also, s eve ra l samples were
vapor coa ted with tellurium and then coated with an outer layer of pure nickel in order to reduce the vaporization of the tellurium during subsequent heat treatments.
After hea t treatment of the coa ted samples , the specimens were t ens i l e t e s t ed a t ei ther room tem- perature or 1200°F us ing a s t ra in rate of 0 05 min-'. Tab le 18.4 lists the t e s t conditions and results for 12 samples of Ilastelloy N. No effect of the tellurium coat ing on the ducti l i ty of Has te l - loy N was found a t either t e s t temperature. At 1200"F, the ducti l i ty following the various treat- ments ranged from 20 to 34% elongation, which is within the range normally obtained in the a b - s e n c e of tellurium. At room temperature the duc- t i l i ty was in the range 52 to 57%, which aga in is normal.
Metallographic examination of the specimens was made after t e s t ing to eva lua te the interaction of tellurium with Hastelloy N. A representative area on t h e shoulder of one sample is shown i n F ig . 18 19. Irregular sur face protuberances a r e evident i n a localized region of the edge of the tIastelloy N. 'The gray phase around t h e protu- berances is tellurium metal that remained on the sample a f te r mechanical tes t ing in a i r a t room temperature. T h e roughness of the Hastelloy N specimens resu l ted f rom corrosive interaction of t h e vapor or liquid tellurium during the hea t treat- ment. At higher magnifications it is evident that a s l igh t amount of grain-boundary penetration of the tellurium into t h e Hastelloy N had taken place.
T a b l e 18.4. T e n s i l e Properties of Tel lur ium-Haste l loy N Compatibi l i ty Studies"
Anne a ling T e s t Yield T ota 1 Maximum
Time Tempera turf Strength Elongation Sample Coating Anne a ling
(hr) ( O F ) (ps i ) (%) Technique Temperature
( O F )
Tellurium in 2012 24 7 5 capsule with 2012 24 1200 spec iinen 2012 150 75
2012 150 1200
Vapor coated with 1652 100 75 tellurium and 1652 100 1200
Vapor coated with 1472 100 75 tellurium 1472 100 1200
nickel
-~ aTes ted a t a s t ra in ra te of 0.05 minC1
49,100 31,300 49,800 37,000
53,2 00 36,700
52,800 40.500
57 22 57 2 0
52 27
54 34
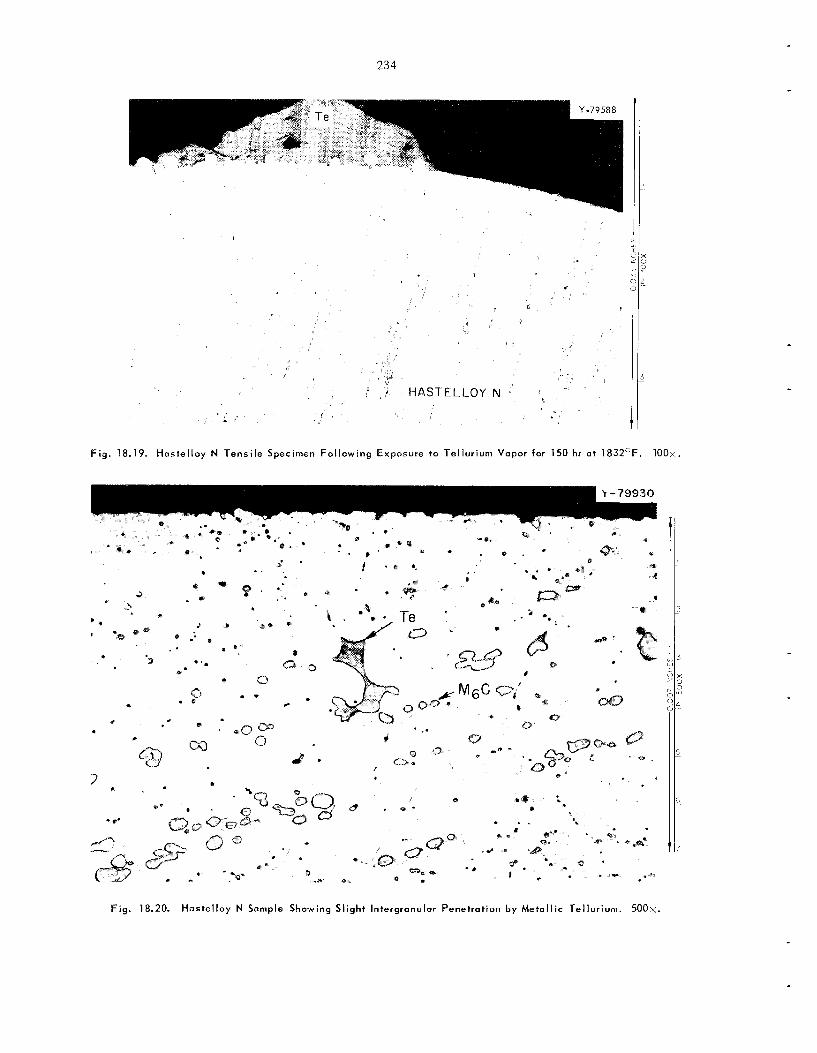
234
F i g . 18.19. Hostelloy N Tensile Specimen Fol lowing Exposure to Tellurium Vapor for 150 hr o t 1832OF. 1OOx.
b
Q
*" *
t
Q-. 0 Q
. 1 .
d
Fig . 18.20. Hastelloy N Sample Showing Slight Intergranular Penetration by Meta l l i c Tellurium. 500x.
235
Figure 18.20 shows an area near t he edge of the sample, where grain boundaries contain a tellurium- rich phase. Electron microprobe examination oE th is region confirmed the presence of tellurium and indicated that it w a s preferentially a s soc ia t ed with the large carb ide precipitates within grain bound- a r ies .
T h e penetration of the tellurium into t h e alloy was only about 0.005 in. following t h e 1832°F hea t treatment. No penetration was found for samples hea t treated at 1472 or 1652'F.
tellurium phase shown in Fig. 18.19 indicated Elementa l s c a n s of the microprobe within the
tha t manganese and chromium were also present. T h e s e e lements were preferentially segrega ted into bands within the tellurium matrix and un- doubtedly resulted from the leaching of t h e s e ele- ments from the Hastelloy N during the 1832°F heat tree tments.
The resu l t s of t hese t e s t s indicate that liquid and/or vaporized tellurium metal interacts with Hastelloy N to a minor extent under the conditions tes ted , which included up to 150 kr in contact a t 1832'F. elevated-temperature ducti l i ty was found. T h e s e t e s t s wi l l b e extended to longer exposure times.
No reduction in room-temperature or
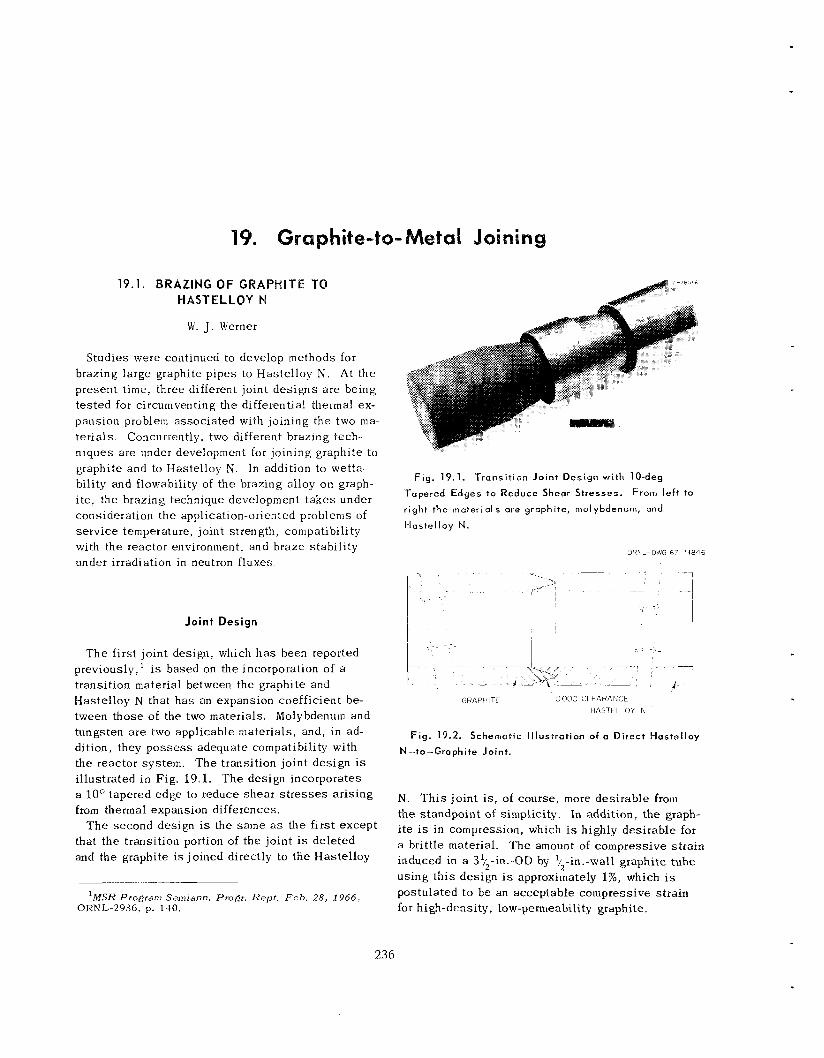
ra phite-to-
19.1. BRAZING OF GRAPHITE TO HASTELLOY N
W. J . Werner
S tudies were continued to develop methods for brazing large graphite p ipes to Hastelloy N . At t he present time, three different joint des igns are being tes ted for circumventing the differential thermal ex- pansion problem assoc ia ted with joining the two m a - t e r ia l s . n iques a re under development for joining graphite to graphite and to Hastelloy N. In addition to wetta- bility and flowability of the brazing alloy on graph- i te , the brazing technique development t a k e s under consideration the application-oriented problems of se rv i ce temperature, joint strength, compatibility with the reactor environment, and braze stabil i ty under irradiation in neutron fluxes
Concurrently, two different brasing tech-
Fig . 19.1. Transit ion Joint Des ign wi th 10-deg
Tapered Edges to Reduce Sheor Stresses.
r ight t h e materials are grophite, molybdenum, and
t iaste l loy N.
F r o m l e f t to
ORNL-OWG 61-11846
. ,~ . . , . - , r-
Joint Design
T h e first joint design, which h a s been reported previously, ' i s based on the incorporation of a transition material between the graphite and Hastelloy N that h a s an expansion coefficient be- tween those of the two materials. Molybdenum and tungsten are two applicable materials, and, in ad- dition, they p o s s e s s adequate compatibility with the reactor system. T h e transition joint design i s i l lustrated in Fig. 19.1. The design incorporates a IOo tapered edge to reduce shea r s t r e s s e s a r i s ing from thermal expansion differences.
that t h e transition portion of the joint i s de le ted and the graphite i s joined directly to the Hastelloy
T h e second design i s the s a m e as the first except
GRAPYITE COO0 CLEARGhZE HASTELLO'I lil
Fig. 19.2. Schematic l l lustrution of a D i rec t Hustel loy
N - t o-Gro ph i t e Joint.
N. T h i s jo in t is, of course, more des i rab le from the standpoint of simplicity. In addition, the graph- i t e i s i n compression, which is highly des i rab le for a hrittle material. The amount of compressive s t ra in induced in a 31/2-in.-OD by 1/2-in.-wall graphite tube using th i s design i s approximately 1%, which is postulated t o be an acceptable compressive strain for high-density, low-permeability graphite.
'MSH Program Serniann. Progr. R e p t . Feb. 28, 1966, ORNL-2936, p. 140.
236
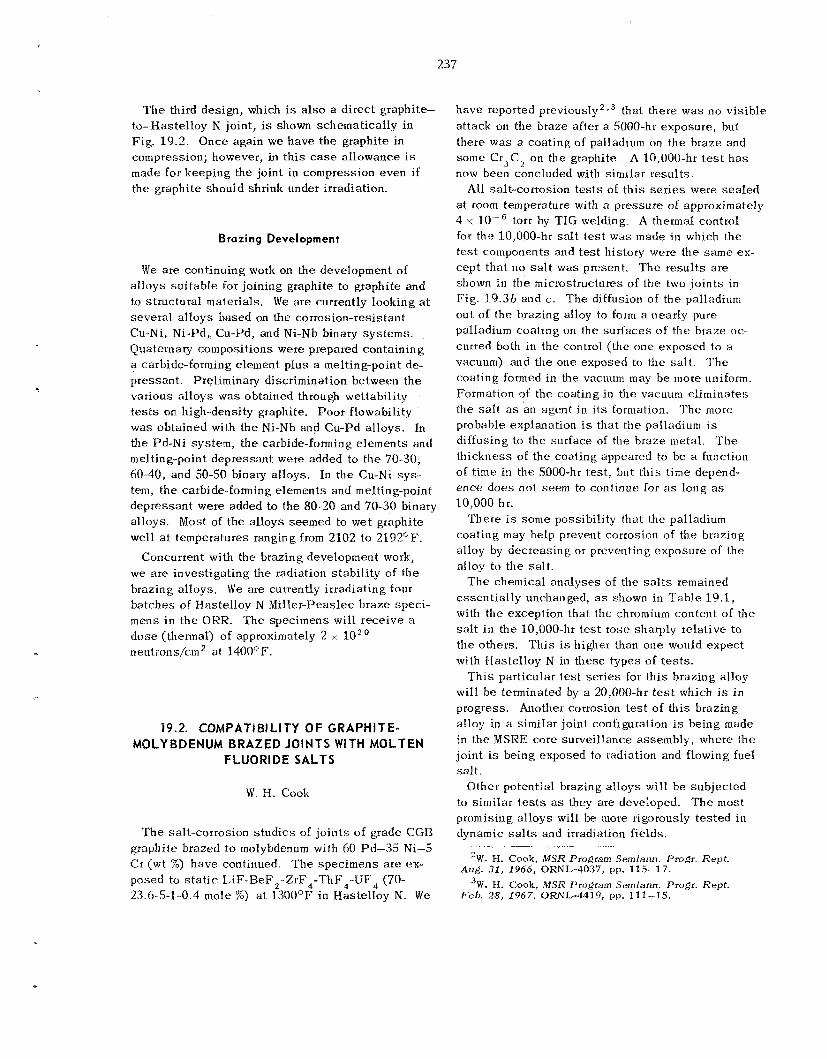
237
T h e third design, which i s a l s o a di rec t graphite- to-Hastelloy N joint, is shown schematically in Fig. 19.2. Once again we have the graphite in compression; however, in th i s case al lowance is made for keeping the joint in compression even if the graphite should shrink under irradiation.
Firozing Development
We are continuing work on the development of alloys su i tab le for joining graphite to graphite and to structural materials. W e are currently looking a t severa l a l loys based on the corrosion-resistant Cu-Ni, Ni-Pd, Cu-Pd, and Ni-Nb binary sys tems. Quaternary compositions were prepared containing a carbide-forming element plus a mel t ingpoin t de- pressant. Preliminary discrimination between the various a l loys was obtained through wettability t e s t s on high-density graphite. Poor flowability w a s obtained with the Ni-Nb and Cu-Pd alloys. In the Pd-Ni system, the carbide-forming e lements and tnelting-point depressant were added to the 70-30, 60-40, and SO-SO binary alloys. In the Cu-Ni sys - tem, the carbide-forming elements and melting-point depressant were added to the 80-20 and 70-30 binary alloys. Most of the alloys seemed to wet graphite well at temperatures ranging from 2102 to 2192°F.
Concurrent with the brazing development work, we are investigating the radiation s tab i l i ty of the brazing alloys. W e are currently irradiating four ba tches of IJastelloy N Miller-Peaslee braze speci- mens in t he OKR. The specimens will rece ive a dose (thermal) of approximately 2 r: 10 neutrons/cm2 a t 1400OF.
19.2. COMPATISILITY OF GRAPHITE- MOLYBDENUM BRAZED JOINTS WITH MOLTEN
FLUORIDE SALTS
W. H. Cook
T h e salt-corrosion s tudies of j o in t s of grade CGB graphite brazed to molybdenum with 60 Pd-35 Ni-5 Cr ( w t %) have continued. T h e spec imens are ex- posed to s t a t i c L,iF-BeF,-ZrF4-ThF4-UF4 (70- 23.6-5-1-0.4 mole %) a t 1300'F in HasteIIoy N. W e
have reported previously2P3 that there w a s no visible attack on the braze after a 5000-hr exposure, but there was a coating of palladium on the braze and some Ct3C2 on the graphite. A 10,000-hr t e s t has now been concluded with similar results.
All salt-corrosion t e s t s of th i s s e r i e s were sea l ed a t room temperature with a pressure o f approximately 4 x l owf i torr by TIG welding. A thermal control for the 10,000-hr salt t e s t was made i n which the t e s t cotnponents and tes t history were the same ex- cep t tha t no s a l t was present. T h e r e s u l t s are shown i n the microstructures of the two jo in ts in Fig. 19.36 and c. T h e diffusion of the palladium out of the brazing alloy to form a nearly pure palladium coating on the sur faces of the braze oc- curred both in the control ( the one exposed to a vacuum) and the one exposed to the sa l t . T h e coating formed in the vacuum may be more uniform. Formation of the coating in the vacuum eliminates the s a l t as an agent in i t s formation. The more probable explanation is that the palladium is diffusing to the surface of the braze metal. 'The th ickness of the coating appeared to be a function of time i n the 5000-hr tes t , but th i s time depend- ence does not s e e m to continue for as long a s 10,000 hr.
The re i s some possibility that the palladium coating may help prevent corrosion o f the brazing alloy by decreasing or preventing exposure of the alloy to the sa l t .
The chemical ana lyses of the s a l t s remained essent ia l ly unchanged, as shown in Tab le 19.1., with the exception that the chromium content of the s a l t in the 10,000-hr t e s t rose sharply relative to the others. T h i s is higher than one would expect with Hastelloy N in these types of t e s t s .
T h i s particular t e s t s e r i e s for t h i s brazing alloy will he terminated by a 20,000-hr t e s t which is in progress. Another corrosion t e s t of this brazing alloy in a similar joint configuration is being made in the MSRE core surveil lance assembly, where the joint is being exposed to radiation and flowing fuel salt.
Other potential brazing a l loys will be subjec ted to similar t e s t s as they are developed. T h e most promising a l loys will be more rigorously tes ted in dynamic s a l t s and irradiation fields.
'W. H. Cook, M S R Program Semiann. Pro@. Rept.
3W. EI. Cook, MSR Program Serniann. Progr. R e p t .
Aug. 31, 1966, ORNL-4037, pp, 115-17.
Feh. 28, 1967, ORNL-4419, pp. 111-15 .
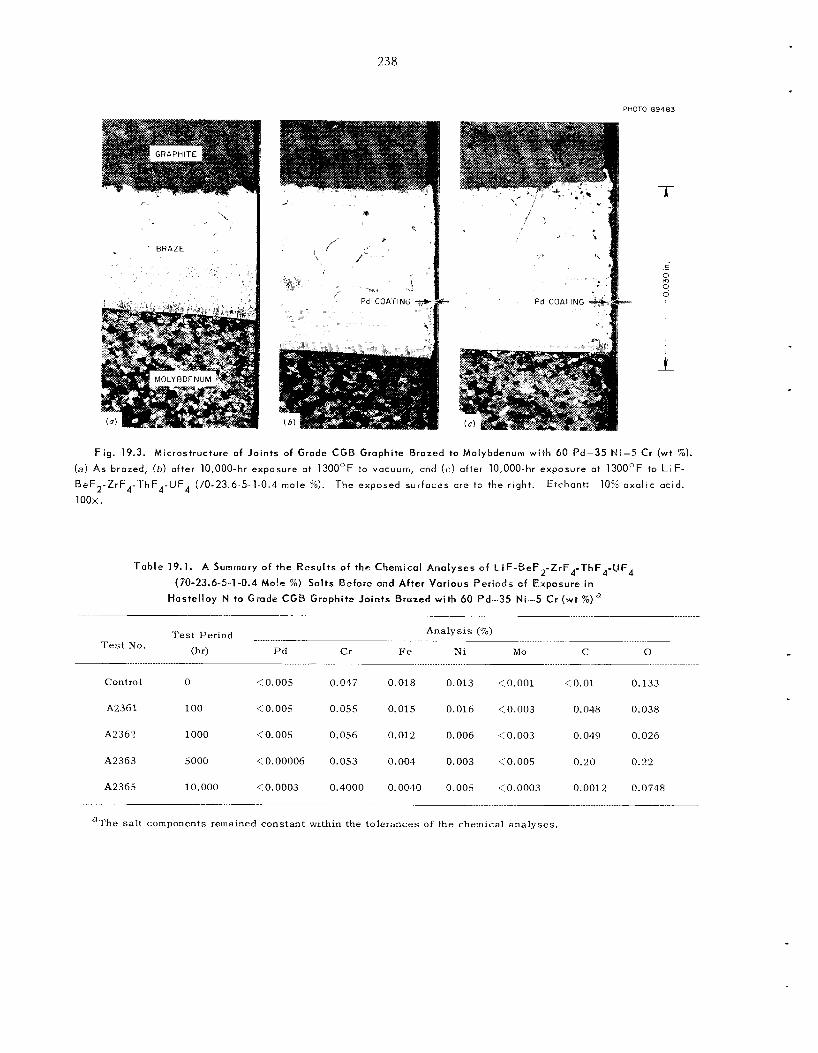
238
PHOTO 89483
r
Fig. 19.3. Microstructure of Joints of Grade CGB Graphite Brazed to Molybdenum w i t h 60 Pd-35 Hi-5 Cr (wt %). ( a ) As brazed, ( b ) after 10,000-hr exposure a t 130OoF to vacuum, a n d ( c ) after 10,000-hr exposure at 1300OF to LiF- BeF2-ZrF4-'l-hF4-UF4 (70-23.6-5-1-0.1 mo le 5%). The exposed su r faces are t o the right. Etchant: 10% oxalic acid. loox.
Table 19.1. A Summary of the Results of the Chemical Analyses of LiF-5eF2-ZrF4-ThF4-UFq
Hastel loy N to Grade CGB Graphite Joints Brazed with 60 Pd-35 Ni-5 Cr ( w t % ) a
(70-23.6-5-1-0.4 Mole %) Salts &Leiore and After Various Periods af Exposure in
Analysis (%) .- -___. T e s t Period
(W P d C r F e Ni M o C Test No.
Control 0 < 0.005 0.047 0.018 0.013 <0.001 <0.01
A2361 100 < 0.005 0.055 0.015 0.016 ( 0 . 0 0 3 0.048
A2362 1000 < 0.005 0.056 0.012 0.006 <0.003 0.049
A2363 5000 <0.00006 0.053 0.004 0.003 <0.005 0.20
A2365 10,000 <0.0003 0.4000 0.0040 0.005 <0.0003 0.0012
0
0.133
0.038
0.026
0.22
0.0748
aThe sa l t components remained constant within the tolerances of the chemical analyses .
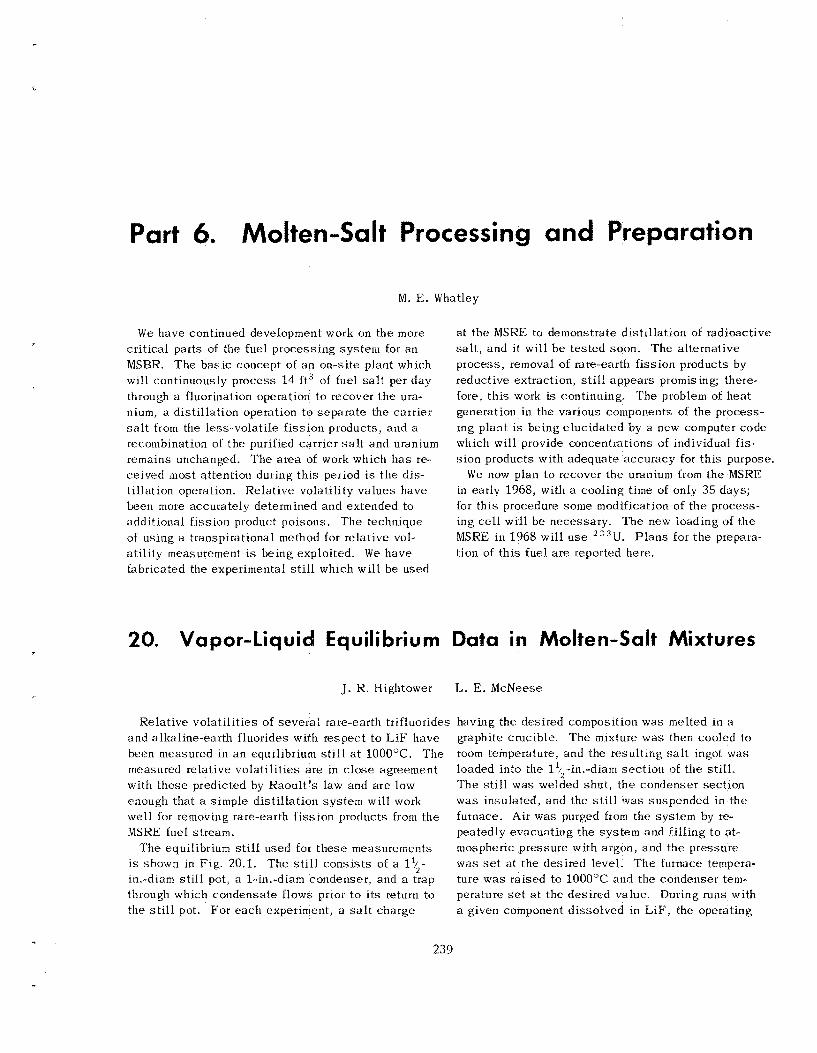
Part 6. Molten-Salt Processing and Preparation
M. E. Whatley
W e have continued development work on the more c r i t i ca l parts of the fuel process ing sys t em for an MSBR. T h e bas i c concept of a n on-site plant which will continuously process 14 ft3 of fuel s a l t per day through a fluorination operation to recover the ura- nium, a d is t i l l a t ion operation t o sepa ra t e the carrier s a l t from the lees-volati le f i ss ion products, a n d a recombination of the purified car r ie r s a l t and uranium remains unchanged. T h e a rea of work which h a s re- ceived most attention during th i s period is t h e dis- t i l lat ion operation. Rela t ive volatility va lues have been more accurately determined and extended to additional f i s s ion product poisons. T h e technique of using a transpirational method for relative vol- ati l i ty measurement is being exploited. We have fabricated the experimental s t i l l which wi l l be used
a t the MSRE to demonstrate d i s t i l l a t ion of radioactive s a l t , and it will b e tes ted soon. T h e alternative process , removal of rare-earth f i ss ion products by reductive extraction, s t i l l appea r s promising; there- fore, th i s work is continuing. T h e problem of hea t generation i n the various components of the process- ing plant is being e luc ida ted by a new computer code which will provide concentrat.ions o f individual fis- s ion products with adequate accuracy for t h i s purpose.
W e tiow plan to recover the uranium from the MSRE in early 1968, with a cooling t.ime of only 35 days ; for t h i s procedure some modification of t h e process- ing cell will be necessary . The new loading of the MSRE in 1968 will u s e 2 3 3 U . P l a n s for t h e prepara- tion of th i s fuel a r e reported here.
20. Vapor-Liquid Equilibrium Data in Molten-Salt Mixtures
J. K. Hightower L. E. McNeese
Rela t ive vola t i l i t i es of seve ra l rare-earth trifluorides having the desired composition was melted in a arid alkaline-earth fluorides with respec t to LiF have been measured in a n equilibrium s t i l t a t 1000°C. T h e measured relative vola t i l i t i es a r e in close agreement with those predicted by Kaoult's l aw and a r e low enough that a s imple d is t i l l a t ion sys t em will work wel l for removing rare-earth f i ss ion products from the MSRE fuel stream.
T h e equilibrium s t i l l used for t h e s e measurerrients is shown in F ig . 20.1. T h e s t i l l cons i s t s of a 1%- in.-diam s t i l l pot, a 1-in.-diam conderiser, and a trap through which condensa te flows prior to its return to the s t i l l pot. For e a c h experiment, a salt charge
graphite crucible. T h e mixture was then cooled to room temperature, and the result ing s a l t ingot was loaded into the 1 '$-in.-diarn sec t ion of t h e still. T h e s t i l l was welded shut , t h e condenser sec t ion was insulated, and the s t i l l was suspended in the furnace. Air was purged from the system by re- peatedly evacuat ing the sys t em and fi l l ing to at- mospheric pressure with argon, and the pressure was s e t a t the desired level. T h e furnace tempera- tu re w a s raised to 1000°C and the condenser tern- perature s e t a t t he des i red value. During runs with a given component d i sso lved in LiF, the operating
239
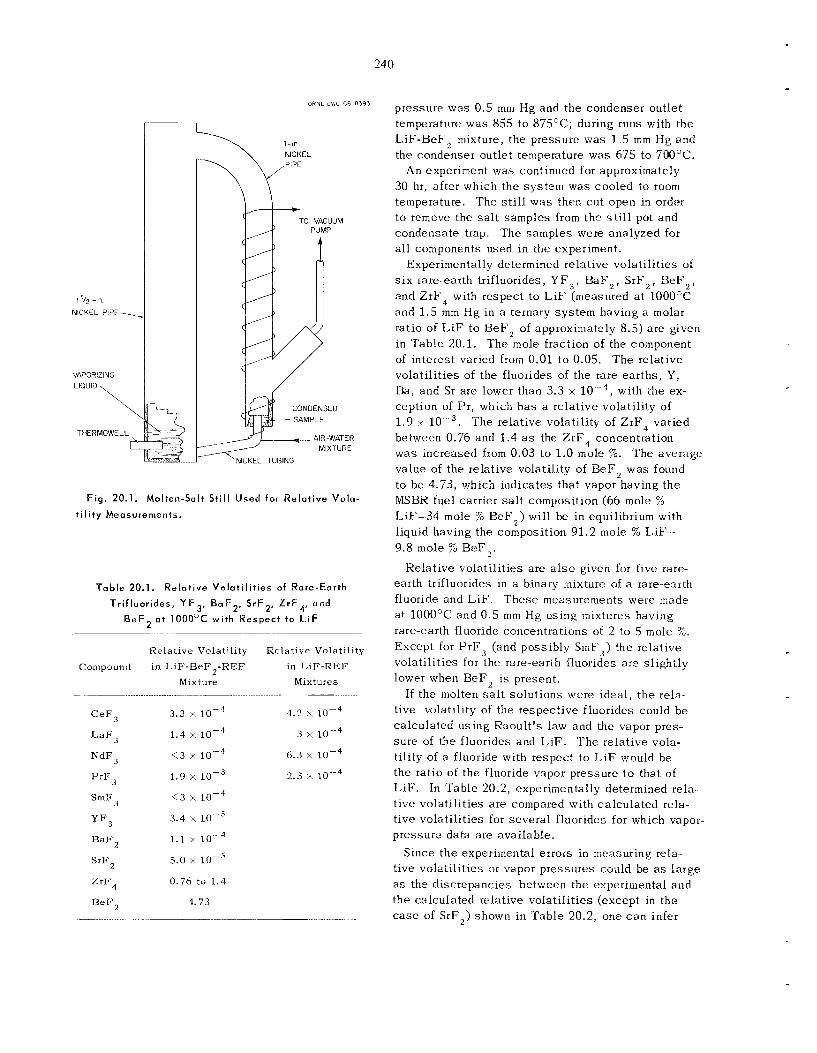
240
ORNL UWG 66 E393
VAPOR1 LlQlJlD
THERMCWELL
Fig. 20.1. Molten-Salt St i l l Used for Relat ive Vola-
t i l i t y Measurements.
Table 20.1 Relat ive Vo la t i l i t i es of Rare-Earth Trif luorides, Y F 3 , B a F 2 , S r F Z , LrF4, and
B e F 2 a t 1000°C wi th Respect to LiF
Relat ive Volatility Rela t ive Volatility Compound in LiF-BeF,-REF in LiF-REF
Mixture Mixtures
CeF,
LaF3
NdF,
P T F ,
YF3
S m F 3
BaF,
SrF,
ZrF4
BeF,
3.3 x 4.2 x
1.4 x lo-, 3 x
<3 X l o r 4 6.3 x
1.9 x 2.3 x IO--,
< 3 x lo-, 3.4 Y l o r 5 1.1 x
5.0 x l o r 5 0.76 to 1 . 4
4.73
pressure was 0.5 inm I-Ig and the condenser outlet temperature was 855 to 875°C; during runs with the L iF -BeF2 mixture, the pressure was 1.5 mm Hg and the condenser outlet temperature was 675 to 700°C.
An experiment was continued for approximately 30 hr, after which the system was cooled to room temperature. The s t i l l was then cu t open in order t o remove the s a l t samples from the s t i l l pot and condensa te trap. The samples were ana lyzed for a l l components used in the experiment.
Experimentally determined relative volati l i t ies of s i x rare-earth trifluorides, Y F 3 , EaF , , SrF,, BeF, , and Z r F 4 with respect t o LiF (measured a t 1000°C and 1.5 mm Hg in a ternary system having a molar ratio of L i F to BeF, of approximately 8.5) are given in ‘Table 20.1. The m o l e fraction of the component of interest varied from 0.01 to 0.05. The relative volati l i t ies of the fluorides of the rare ear ths , Y, Ha, and Sr are lower than 3.3 x 10V4, with the ex- ception of Pr, which h a s a relative volatility of 1.9 x 10W3. The relative volatility of ZrF4 varied between 0.76 and 1.4 as the ZrF, concentration was increased from 0.03 to 1.0 mole %. The average value of the relative volatility of BeF, w a s found to be 4.73, which indicates that vapor having the MSBR fuel carrier s a l t composition (66 m o l e % LiF-34 m o l e % B e F 2 ) will be in equilibrium with liquid having the composition 91.2 mole 74 LiF- 9.8 m o l e % BeF,.
Rela t ive volati l i t ies a re also given for five rare- earth trifluorides in a binary mixture of a rare-earth fluoride and L i F . T h e s e measurements were made a t 1000°C and 0.5 mm Hg using mixtures having rare-earth fluoride concentrations of 2 to 5 mole %. Except for P r F , (and possibly SmF‘,) the ie la t ive volati l i t ies for the rare-earth fluorides a re sl ightly lower when BeF, i s present.
If the molten s a l t so lu t ions were ideal, t h e rela- tive volatility of the respective fluorides could b e calculated us ing Raoult’s law and the vapor pres- s u r e of the fluorides and LiF. T h e relative vola- tility of a fluoride with respect to L i F would be the ratio of the fluoride vapor pressure t o that of LiF. In Table 20.2, experimentally determined rela- t ive volati l i t ies a re compared with ca lcu la ted rela- t ive volati l i t ies for severa l fluorides. for which vapor- pressure data a re available.
Since the experimental errors in measuring rela- tive volati l i t ies or vapor pressures could be as la rge a s the d iscrepancies between the experimental and the calculated relative volati l i t ies (except in the case of SrF,) shown in Tab le 20.2, one c a n infer
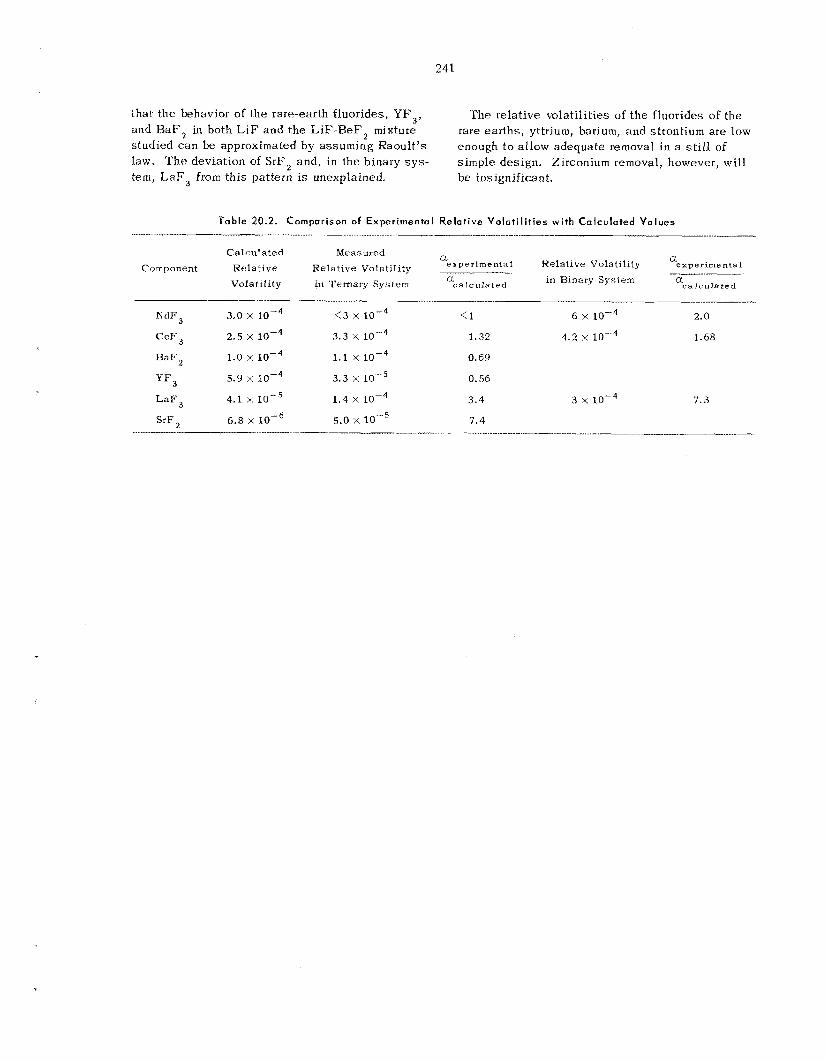
241
that t h e behavior of the rare-earth fluorides, YF,, and BaFz in both LiF and the LiF-BeF2 mixture studied can be approximated by assuming Raoult 's law. T h e deviation of SrF, and , in the binary s y s - tern, LaF3 from th is pattern is unexplained.
T h e relative volati l i t ies of t h e fluorides of the rare ear ths , yttrium, barium, and sf rontium ace low enough to allow adequate removal in a s t i l l of simple design. Zirconium removal, however, will be iris ignifican t.
Table 20.2. Comparison of Experimental Relat ive Vo la t i l i t i es with Calculated Values ............... -__- _ __
Calculated Measured Relative Volatility Okxperimental Relative Volatility aexperirnenta I
Component Rela t ive - a ca IC iila t e d in Binary System Volatility in Ternary System %C s I c nla t e d
N d F 3 3.0 x IO-^ <3 x < I 6 x lo-' 2.0
4.2 1.68 CeF3 2.5 i( 3.3 x 1.32 1 r 4
YF 3 LaF3 4.1 x 1.4 x 3.4 3 x 7. 3
RaFg 1.0 x 1.1 x 0.69
5.9 x 3 . 3 x l o r 5 0.56
SrF 6.8 x 5.0 x 7.4 .....
_____I ___I I__ -- _._I___ .~ __..___ ....
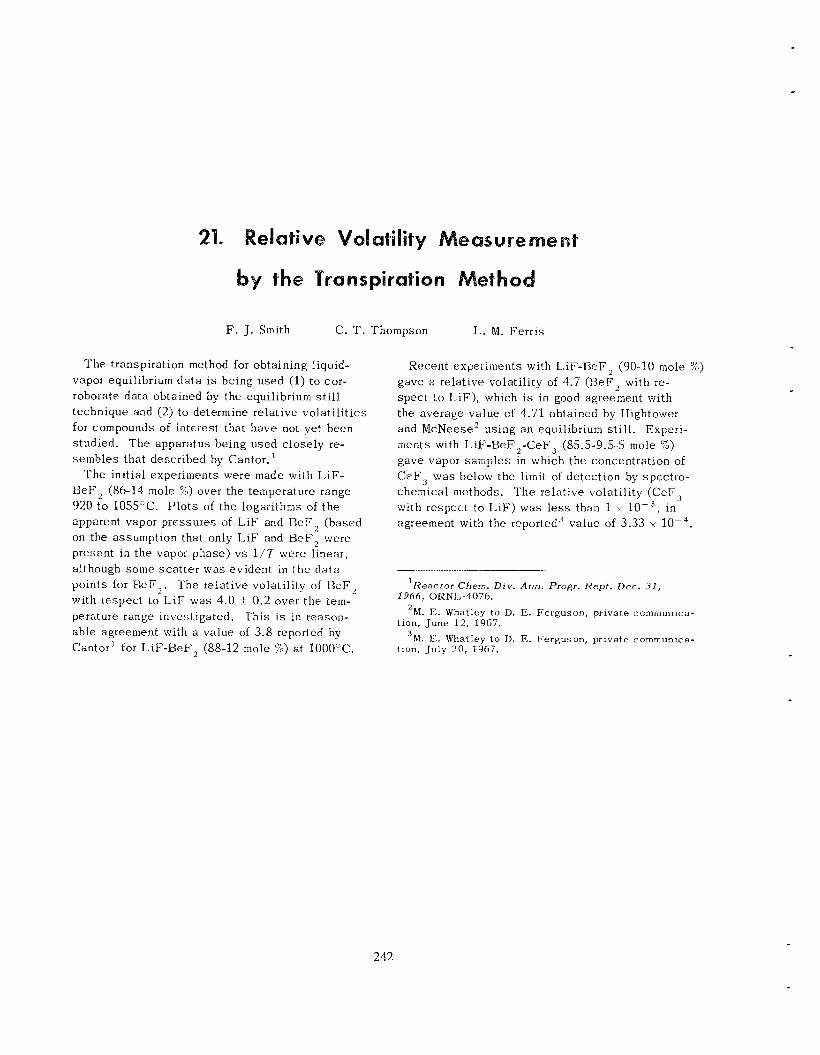
t
L. M. Fer r i s F. J. Smith C. T. Thompson
T h e transpiration method for obtaining liquid- vapor equilibrium da ta is being used (1) to cor- roborate da ta obtained by the equilibrium s t i l l technique and (2) t o determine relative vola t i l i t i es for compounds of interest that have not yet been studied. The apparatus being used closely re- seiiibles that described by Cantor.'
'The initial experiments were made with LiF- BeF , (86-14 mole %) over the temperature range 920 t o 1055OC. P l o t s of the logarithms of the apparent vapor pressures of LiF and BeF, (based on the assumption that only LiF and BeF, were present in the vapor phase) v s 1 / T were linear, although some sca t t e r was evident in t h e da t a points for BeF , . The relative volatility of EeF, with respect t o LiF was 4.0 I 0.2 over t h e tem- perature range investigated. Th i s is in i-eason- able agreement with a value of 3.8 reported by Cantor' for LiF-BeF, (88-12 mole %) a t 1000°C.
Recent experiments with L.iF-BeF, (90-10 mole %) gave a relative volatility of 4.7 (WeF, with re- spec t t o LiF), which is in good agreement with the average value of 4.71 obtained by Hightower and McNeese' using an equilibrium s t i l l . Experi- ments with LiF-BeF,-CeF, (85.5-9.5-5 m o l e %) gave vapor samples in which the concentration of CeF, was below the limit of de tec t ion by spcctio- chemical methods. The relative volati l i ty (CcF, with respec t t o LiF) was l e s s than 1 x lo-, , in agreement with the reported3 value of 3.33 x 10W4.
'Reac !or Chem. Div. Ann. Progr. Rep!. D e c . 31,
'M. E. Whatley to I). E. Ferguson, private communica-
,M. E. Whatley t o D. E. Ferguson, private communica-
1966, ORNL-4076.
tion, June 12, 1967.
tion, July 20 , 1967.
242
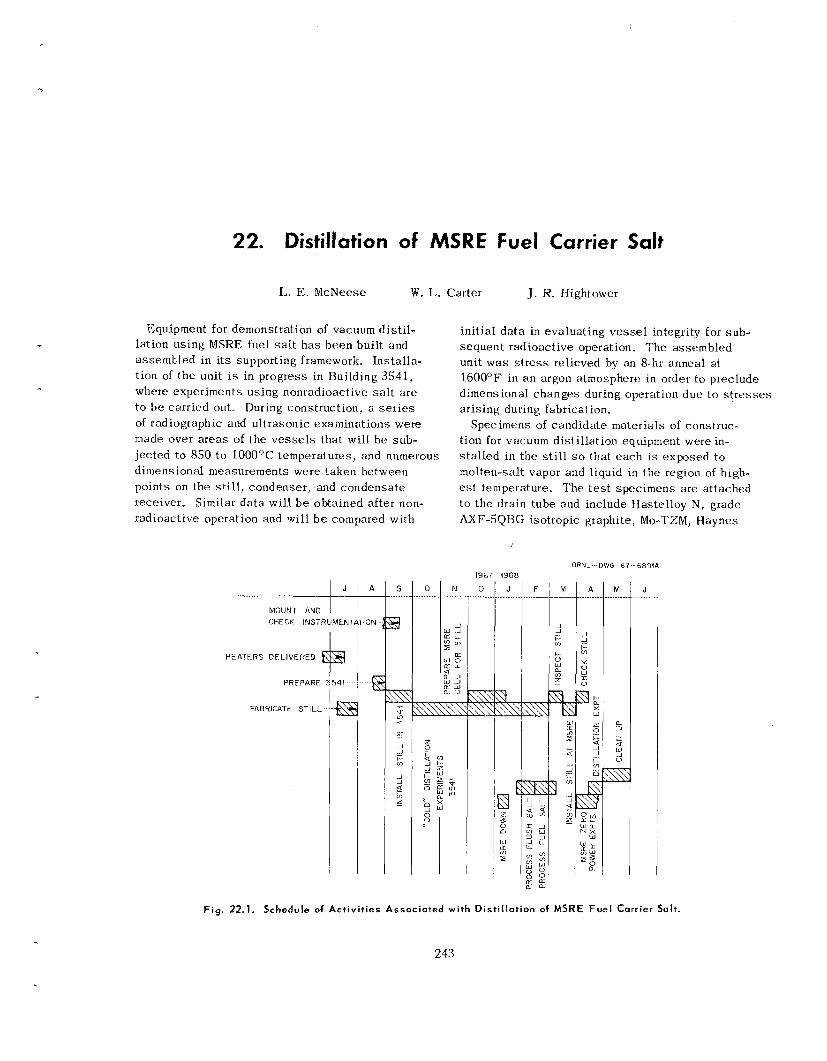
22. Distillation of MSRE Fuel Carrier Salt
1,. E. McNeese W, L. Carter J. R. Hightower
Equipment for demonstration of vacuum dis t i l - lation us ing MSRE fuel s a l t h a s been built and assembled in i t s supporting framework. Installa- t ion of t h e unit i s in progress in Building 3541, where experiments us ing nonradioactive s a l t a r e t o b e carried out. During construction, a s e r i e s of radiographic and ultrasonic examinations were made over a reas of the v e s s e l s that will be sub- jected to 850 to 1000°C temperatures, and numerous dimensional measurements were taken bctween points on the s t i l l , condenser, and condensa te receiver. Similar da ta will b e obtained after non- radioactive operation and will b e compared with
CHECK INSTRUMENTATION -- MOUNT AND I I I@
HFATERS DFLIVEREQ
PREPARE 354i --
FABHICATE STILL I!@
in i t ia l da t a i n evaluating v e s s e l integrity for sub- sequent radioactive operation. The assembled unit w a s s t r e s s relieved by an 8-hr anneal at 1600°F in a n argon atmosphere in order 1 0 preclude dimensional changes during operation due t o s t r e s s e s a r i s ing during fabrication.
tion for vacuum disti l lat ion equipment were in- s t a l l ed in the s t i l l so that each i s exposed t o molten-salt vapor and liquid in the region of high- e s t temperature. The t e s t specimens are attached t o the drain tube and include Hastelloy N, grade AXF-SQBG isotropic graphite, Mo-TZM, CIaynes
Specimens of candidate materials of construc-
1967
D ......
ORNL---DWG C7-6891A
J
Fig. 22.1. Schedule of A c t i v i t i e s Associated wi th D is t i l l a t ion of MSRE Fuel Carrier Salt.
243
244
alloy No. 25, and an experimental alloy (alloy No. 82) having the composition 18 Mo-0.2 Mm--0.05 Cr-bal Ni.
Activit ies assoc ia ted with t h e sys tem during the past two months and scheduled ac t iv j t ies through completion of radioactive operation are shown in Fig. 2 2 , l . Sti l l fabrication h a s been completed, and the thermal insulation and e lec t r ic heaters have been received. Four faulty hea te r s out of a total of 41 were rejected, and replace- ments have been ordered. Instrumentation work i s 90% complete. The first of severa l 48-liter s a l t charges for nonradioactive operation i s being prepared by Reactor Chemistry Division personnel. Experiments using nonradioactive s a l t will begin
in early October and will continue through Feb- ruary 19G8. The s t i l l will then be inspected for radioactive operation and installed a t the MSRE s i t e in the spare ce l l ad jacent to t h e fuel process ing cell .
T h e equipment will then b e used for d i s t i l l ing 48 l i t e rs of radioactive MSKE fuel salt (decayed 90 days) from which uranium h a s heen removed by fluorination. It was determined that the roof plugs in the spa re ce l l do not provide adequate biological shielding for 90-day-old sa l t ; the plugs have been redesigned and will cons i s t of 30-in.-thick bary tes concrete rather than the present 24-in. ordinary conciete.
23. Steady-State Fission Product Concentrations and
Heat Generation in an MSBR and Processing Plant
J. S. Watson L. E. McNeese W. L. Carte1
Concentrations of f i ss ion products and t h e hea t generation a s soc ia t ed with the i r decay a r e re- quired for des ign of sys t ems €or process ing the fuel and fert i le s t r eams of an MSBR. A method for ca lcu la t ing the s teady-s ta te concentration of f i ss ion products in an MSBR will be descr ibed , and heat-generation r a t e s i n t h e fuel s t ream wi l l b e given. Changes in heat-generation ra te re- su l t ing from removal of f i ss ion products in both the reactor and the fuel-stream process ing sys t em will b e shown.
Several simplifying assumptions were made in ca lcu la t ing the concentration of f i ss ion products i n the fuel stream of a n MSBR. T h e differential equation used t o define t h e concentration of a given i so tope was
where
V c / V , = core volume/total fuel volume, T - processing cyc le time €or i so topes
z with atomic number 2 (sec),
t : t ime (sec).
T h e reactor was assumed to b e at s teady s t a t e
/ d t -: 0 ; so t he differential equation with respec t t o all f i ss ion products. At s teady s t a t e , dN reduces to
Z , A
which def ines the steady-state Concentration of each isotope. T h i s equation was solved f o r each isotope using an IHM 7090. The ca lcu la t ions used 2 3 5 U y ie lds given by Blomeke and Todd; ' y ie lds for 2 3 3 U were obtained by distributing "mass yields" reported by England' among the i so topes in each mass chain s o that each isotope had the same fraction of t he mass yield as reported for 2 3 5 U . Decay cha ins were simplified and approxi- mated by "straight" cha ins considering only be ta decay. Where isomeric transit ions or other complications were noted, personal judgment was used to approximate the res1 process with straight beta decay.
N z , A = number of atoms of an isotope with atomic number 2 and mass number A , . .. .. .. .-
P - power (w), ' 1. 0. Rlomeke and M a r v F. Todd. Umninm-235 , - ... ~
Y = primary yield of isotope of atomic Fission-Product Production a s a Function of Thermal Neutron I'lux, Irradiation Time, and D e c a y Time. 1 .
number and number A (atoms/ Atomic Coricentrafions and Gross Totals , ORNL-2127 f iss i on), (part I.), vol. 1.
'~liemia? andKesonance Absorption Cross Sections matil Rev i s ions azld Colculationa1 Extensions) , WAPD- TM-333, addendum No. 1.
+ = flux (neutrons sec-' cm-'), 'T. R. England, Time-Dependent Fission-Product
( 2 7 c r o s s sec t ion of i so tope with atomic number 2 and mass number A (cm'),
% , A
245
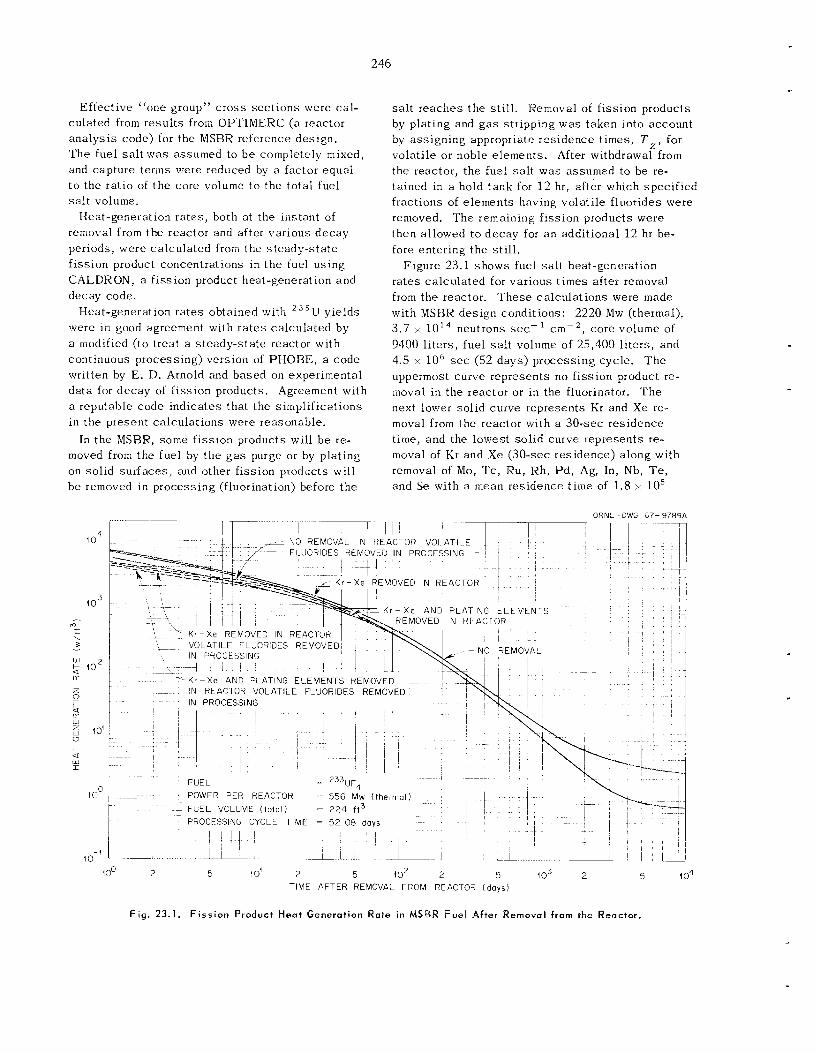
246
Effective “one group” c ross sec t ions were ca l - culated from resu l t s from OPTIMERC (a reactor ana lys i s code) for the MSBR reference design. The fuel s a l t was assumed to b e completely mixed, and capture terms were reduced by a factor equal t o the ratio of the core volume t o the total fucl s a l t volume.
Heat-generation r a t e s , both at the instant of removal f r o m the reactor and after various decay periods, were ca lcu la ted from the s teady-s ta te f i ss ion product concentrations in t h e fuel us ing CALDRON, a fission product heat-generation and decay code.
Heat-generation ra tes obtained with 2 3 5 U yie lds were i n good agreement with r a t e s ca lcu la ted by a modified (to treat a s teady-s ta te reactor with continuous processing) version of PHOSE, a code written by E. D. Arnold and based on experimental data for decay of fission products. Agreement with a reputahle code ind ica tes that the simplifications i n the present ca lcu la t ions were reasonable.
In the MSRR, s o m e f i ss ion products will b e re- moved from the fuel by t h e gas purge or by plating on solid sur faces , and other fission products will b e removed in processing (fluorination) before the
sa l t reaches the s t i l l . Removal of fission products by plating and g a s stripping was taken into account by ass igning appropriate res idence t imes, T z , for volati le or noble elements. After withdrawal f r o m the reactor, the fuel s a l t was assumed to be re- tained in a hold tank f o r 12 hr, after which spec i f ied fractions of elements havjng volati le fluorides were removed. The remaining fission products were then allowed to decay for a n additional 12 hr be- fore entering the s t i l l .
Figure 23.1 shows fuel s a l t heat-generation ra tes ca lcu la ted for various t imes after removal from the reactor. ‘These ca lcu la t ions were made with MSRK design conditions: 2220 Mw (thermal), 3.7 x iO14 neutrons sec-’ cm-’, cote volume of 9400 l i te rs , fuel s a l t volume of 25,400 li ters, and 4.5 x l o 6 sec (52 days) processing cycle. T h e uppermost curve represents no f i ss ion product re - moval in the reactor or in the fluorinator. ‘The next lower solid curve represents Kr and Xe re- moval from the reactor with a 30-sec res idence time, and the lowest so l id curve represents re- moval of Kr and Xe (30-sec residence) along with removal of Mo, T c , Ru , X<h, P d , Ag, In, Nb, T e , and Se with a mean res idence t ime of 1.8 x l o 5
OrlNL - DWG 67- 9789A
lo3
t w a r
I O0
1 00 2 5 1 0‘ 2 5 102 2 5 103 2 5 I o4 TIME AFTER REMOVAL FROM REACTOR (days )
Fig. 23.1. Fiss ion Product Heot Generation Rate in M S B R F u e l After Rernovol from the Reactor.
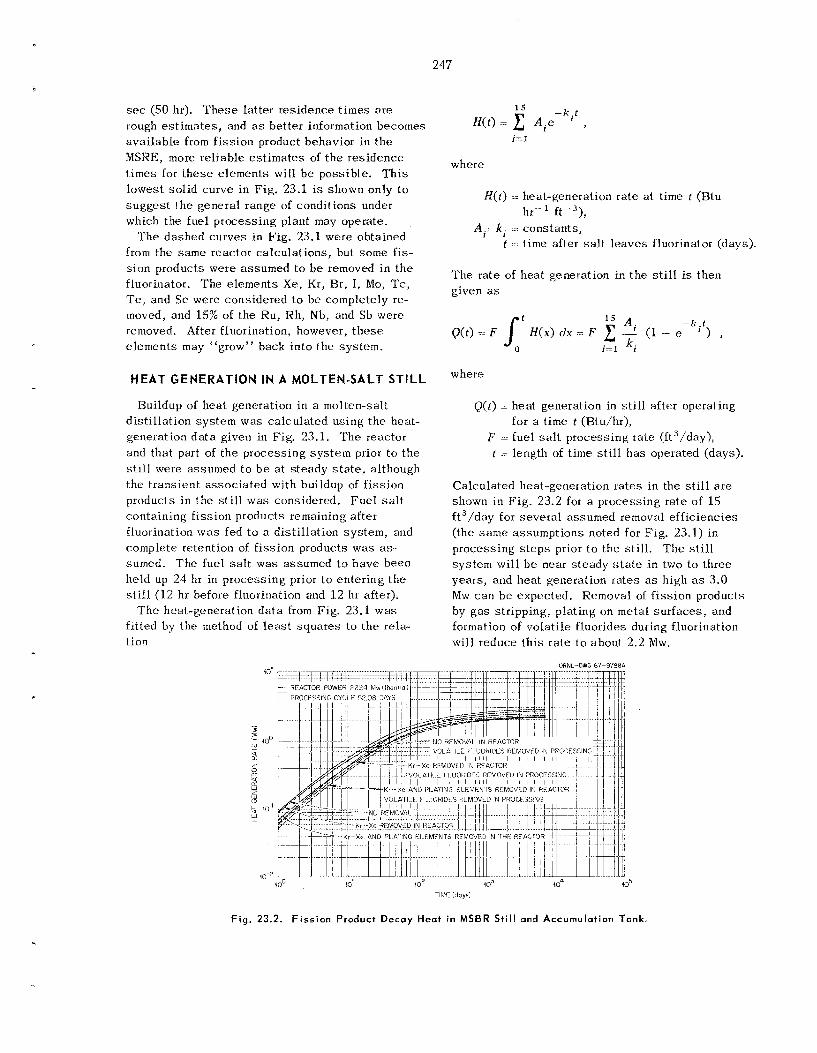
247
sec (50 hr). T h e s e latter res idence t imes a re rough es t imates , and a s better information becomes ava i lab le from f i ss ion product behavior in the MSKE, more reliable es t imates of t h e r e s idence t imes for t h e s e e lements will b e possible. This lowes t solid curve in Fig. 23.1 is shown only to sugges t t he genera l range of conditions under which the fuel process ing plant may operate.
T h e dashed curves in Fig. 23.1 were obtaincd from the same reactor ca lcu la t ions , but some fis- sion products were assumed to b e removed i n t h e fluorinator. The e lements Xe, Kr, R t , I , Mo, Tc, T e , and Se were considered to b e completely re- moved, and 15% of the Ru, Rh, Nb, and Sb were removed. After fluorination, however, t h e s e e lements may “grow’’ back in to the system.
HEAT GENERATION IN A MOLTEN-SALT STILL
Buildup of hea t generation in a molten-salt d i s t i l l a t ion system was ca lcu la ted using t h e heat- generation da ta given in Fig. 23.1. T h e reactor and that part of the process ing s y s t e m prior to the s t i l l were assumed t o b e a t s teady s t a t e , although the t rans ien t assoc ia ted with buildup of f i ss ion products i n the s t i l l was considered. F u e l s a l t containing f i ss ion products remaining after fluorination w a s fed t o a disti l lat ion sys tem, and complete retentjon of f i ss ion products was as- sumed. The fuel s a l t was assumed to have been held up 24 hr in process ing prior t o entering the still (12 hr before fluorination and 1 2 h t after).
T h e heat-generation da ta from Fig. 23.1 was fitted by the method of l e a s t squa res to the rela- tion
where
H ( t ) == heat-generation rate a t time t (Htu ), hr- 1 ft.-’3
A , , k . ::: cons tan ts , 1 1
t ::: time after sal t l eaves fluorinator (days).
T h e rate of hea t generation in t h e s t i l l is then given as
where
Q(r) = heat generation in still after operating
F - fuel s a l t p rocess ing rate (ft3/day), for a time t (Wtu/hr),
t - length of time s t i l l has operated (days).
Calculated heat-generation ra tcs in the s t i l l a r e shown in F ig . 23.2 for a p iocess ing rate of 15 ft3/day for severa l assumed removal e f f ic ienc ies (the s a m e assumptions noted for Fig. 23.1) i n processing s t e p s prior to t h e st i l l . T h e s t i l l sys tem wi l l b e near s teady s t a t e in two to three years , and hea t generation ra tes as high as 3.0 Mw c a n b e expected. Removal of fission products by g a s stripping, plating on metal sur faces , and formation of volati le fluorides during fluorination will reduce t h i s ra te t o about 2.2 Mw,
ORNL-DWG 67-9/38A
Fig. 23.2. Fiss ion Product D e c a y Heat in MSBR Sti l l and Accumulation Tank.
L. M. Fe r r i s C. E. Schilling J . F. Land
One alternative to the disti l lat ion process for decontaminating MSBR fuel s a l t involves reductive extraction of t h e rare ea r ths (and other f i ss ion products) after t he uranium h a s been recovered f r o m the s a l t by fluorination. ’-’ T h e reductant currently being considered is ’Li dissolved i n molten metals s u c h as bismuth or lead which a re immiscible with the sa l t . Studies in the Reactor Chemistry Division’ n 2 j 4 have def ined t h e equi- librium distribution of s eve ra l rare ear ths between Li-Ri solutions and LiF-BeF, (66-34 mole X) a t 600°C. The resu l t s of t h e s e s tud ie s indicate that the rare ea r ths can b e effectively extracted in such a system.
T h e apparent stoichiometry of the extraction reaction is such that, under t h e experimental con- dit ions employed, the lithium concentration in the metal phase should not change detectably, even if t he rare ear th were quantitatively ex t rac ted . However, in t hese , and similar, experiments, usi-ially 50 t o 75% of the lithium originally present in the Li-Bi solution appainntly was consumed. T h e mechanism by which lithium is “ los t” i n t hese sys t ems h a s not yet been elucidated.
In order to properly eva lua te the practicali ty of the reductive extraction process, t h e behavior of lithium in t h e s e sys tems must b e clearly defined. Knowledge of i t s behavior i s espec ia l ly important in designing a multistage extraction sys tem, be- c a u s e t h e extent t o which the rare ea r ths a r e ex-
‘R. B. B ~ i g g s , M S R Program Semiann. Pro@. R e p t .
’M. W. Rosenthal, MSR Program Semiann. Progr.
’D. E. Ferguson , Chem. Technol. Div. Ann. Progr.
‘W. R. Cirmles, Rear tor Chern. Uiv. A n n . Progr.
AI@. 3 1 , 1966, ORNL-4037.
R e p t . Feb. 28, 1967, ORNL-4119.
R e p t . Map 31, 1966, ORNL-3915.
R e p t . D e c . 31 , 1966, ORNL-4076.
tracted (at equilibrium) is directly related to the lithium concentration in the metal phase. 1 r 2 , 4
Consequently, m o r e experiments have been con- ducted, with the primary objective be ing the de- termination of t h e c a u s e of the apparent lithium loss . As d i scussed below, these experiments did not produce a definite answer to the question, and more study will b e required. In e a c h experi- ment a rare-earth fluoride, usually EuF, , w a s added to the sa l t t o provide a b a s i s for compari- son with the resu l t s of ear l ie r s tud ie s and t o allow u s t o obtain preliminary information on the e f f ec t of temperature on the distribution of europium be- tween the two phases .
Experimentally, solutions of lithium in bismuth (usually about 7 at . % Li ) and of EuF, in L i F - BeF, (66-34 mole %; mole fraction of EuF,, about lo-‘) were prepared at 600°C in sepa ra t e mild s t e e l or graphite c ruc ib les , us ing pure argon as a blanket gas . Then , the s a l t was transferred to the c ruc ib le containing the Li-Bi alloy, and the sys tem w a s equilibrated a t high temperature in an argon atmosphere, Fil tered samples ( s t a in l e s s s t ee l samplers ) of both phases were removed periodic a1 1 y for ana lys i s .
No de tec tab le “ los s” of lithium occurred during preparation of t h e Li-Bi alloys in either mild s t ee l or graphite crucibles. When the sys tem w a s not agitated (by sparging with argon), t h e t ime required to achieve equilibrium was generally about 24 hr. T h e low ra te of dissolution of lithium in bismuth when t h e sys tem is quiescent h a s been observed by others.’ The rate-controlling s t e p may be t h e dissolution of Li,Bi, a high-nelt ing, insoluble c o n p u n d that probably forms rapidly when mixtures of the two meta ls a r e heated. After about 24 hr at 600°C, the lithium concentra- tion in the solution, as determined by chemical
248
249
ana lys i s of f i l tered samples and thermal ana lys i s of t he system, usua l ly reached t h e expec ted value. When t h e system w a s sparged with argon, equilibrium w a s reached in 1 to 2 hr or l e s s .
(30 to 70%) dec rease in the lithium concentration i n the metal phase occurred during equ i l ib r c~ t ’ ion of s a l t and Li-Ri solutions at 500 to 70OoC. Several poss ib l e c a u s e s of t h i s phenomenon were considered: (1) disso lu t ion of lithium in the s a l t , (2) reduntion of BeF, from the salt by lithium with formation of L i F and beryllium metal (which i s insoluble in both t h e s a l t and bismuth), and (3) reaction of the lithium with water t ha t w a s in- advertently admitted to the system. Neither of t.he €irst two inechanisms seems likely, based on the experimental ev idence . I€ either lithium or beiyllium metal were present in the salt in t h e amounts expected from the lithium “loss,” d is - solution of the s a l t in hydrochloric ac id should have resu l ted in t h e evolution of more than 10 cc (STP) of hydrogen per gram of sa l t . However, i t WBS found that samples of both filtered and un- filtered salt generally gave less than 0.2 cc of 13, per gram. T h i s finding, along with thcrmo-
As was t h e case in other s tud ie s , a significant
dynamic cons idera t ions , e i ther of t h e s e mechanisms.
T h e inadvertent admittance of water into t h e system (as a contaminant i n the s a l t and/or blanket gas , or during sampling) seems to be a more reasonable explanation for t h e consumption of lithium. Although th i s hypothesis h a s not ye t been confirmed, s eve ra l observations have been inadc which support t.his mechanism. ‘The s a l t after equilibration i s invariably permeated with a n insoluble material which t ends to concentrate a t t he salt-metal interface. T h e presence of t h i s phase d o e s not appear to be related to the presence of a rare ear th , and, on t h e b a s i s of chemical ana lys i s , is not the result of corrosion of t he crucible or samplers. High oxygen concentrations (about 0.5%) have been de tec ted in s a l t samples , and, i n a few ins tances , the presence of Be0 in t h e sys tem h a s been confirmed, T h e s e results, i f c aused by t h e presence of water, a re cons is ten t with a mechanism in which the water r eac t s f irst with BeF, to form insoluble Be0 and gaseous HF which, in turn, r eac t s with lithium to form LiF that d i s so lves in t h e sa l t . Accordingly, the LiF concentration in the s a l t would increase and t h e
appears t o rule out
T a b l e 24.1. Distr ibut ion of Europium Between L i F - B e F 2 (66-34 Mole %) ond Lithium-Bismuth Solutions
L i t h i u m Approximatk Amount C o n c e n t r a t i o n in T e m p e r a t u r e of Europ ium in
D” E x p e r i m e n t Sample Meta l Phase (OC) Metal Phase
(tnolr 7’0) (70)
CES75 1 0.85’ 608 5 2 b 1.2’
CES66 3 2.6’ 602 83. ‘ 5.4’
CES66 2 3.46 583 936 17.1b
JFL64 3 3.9b
JFL64 2 4. 0’
JFL64 1 4. 0’
JFLG4 1 4.8d
CES66 1 5.0b
JFL64 2 5. I*
5 00
G O 5
7 00
6 OS
583
700
92 ‘ 84 ’ 88 ’ 81 ‘ 93b
88‘
14.8“
6.7“
9.1‘
6.7‘
16.8’
9.1‘
mole f r a c t i o n of Eu i n m e t a l p h a s e
mole f r a c t i o n of E u in s a l t p h a s e aDef ined a5 D :
’Emiss ion spec t rog ra ,ph ic a n a l y s e s . ‘Neutron a c t i v a t i o n a n a l y s e s . ‘k-lame pl iotometr ic a n a l y s e s .
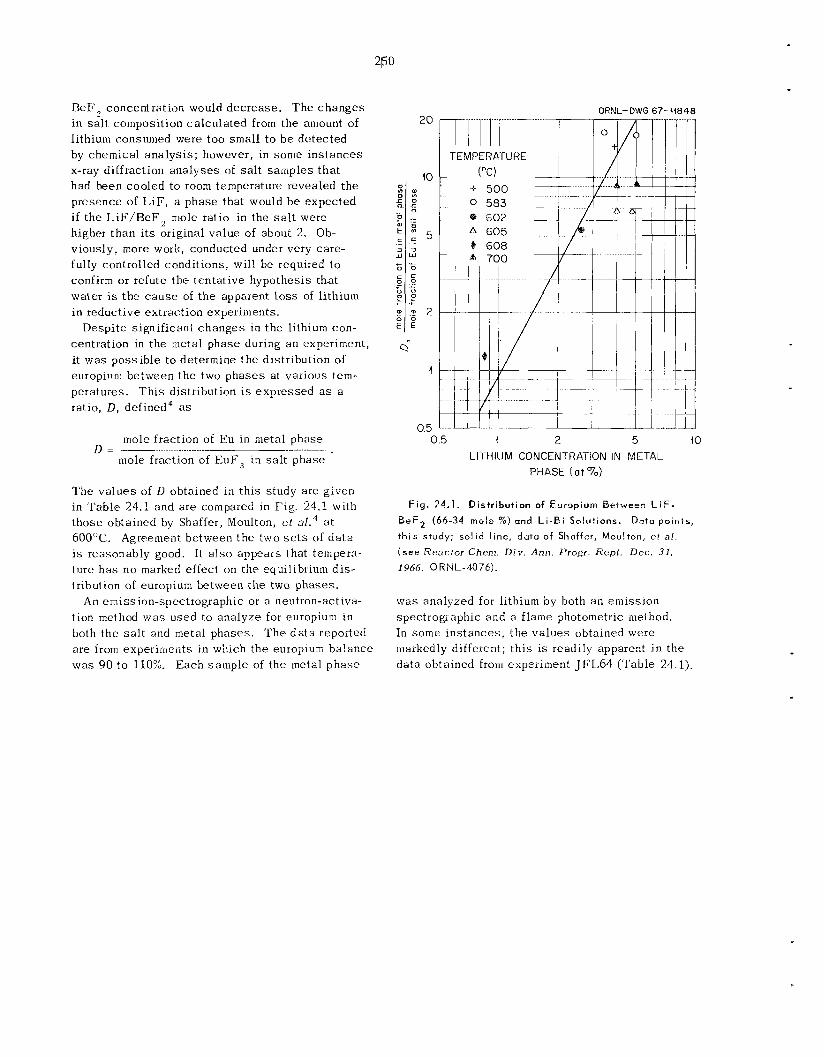
250
c
BeF', concentration would decrease . The changes in s a l t composition ca lcu la ted from the amount of lithium consumed were too s m a l l to b e detected by chemical ana lys i s ; however, in some ins t ances x-ray diffraction anal.yses of s a l t samples tha t had k e n cooled t o room temperature revealed the presence of L i F , a phase that would b e expected if t he L iF /BeF , mole ratio in the s a l t were higher than i t s original va lue of about 2. Ob- viously, more work, conducted under very care- fully controlled conditions, will be required t o confirm or refute the ten ta t ive hypothesis that water is the c a u s e of t h e apparent loss of lithium in reductive extraction experiments.
Despite significant changes i n t he lithium con- centration in the metal phase during an experiment, it was poss ib le to determine the distribution of europium between t h e two phases at various tem- peratures. T h i s distribution i s expressed a s a ratio, D, defined4 as
mole fraction of Eu in metal phase
mole fraction of EuF, in sa l t phase D=- ...................
The va lues of D obtained in th i s study are given in Table 24.1 and a re compared in Fig. 24.1 with those obtained by Shaffer, Moulton, et ~ 3 1 . ~ a t 6OOOC. Agreement between t h e two s e t s of d a t a i s reasonably good. It a l so appears that ternpera- tiire h a s no marked effect on the equilibrium d i s - tribution of europium between the two phases ,
tion method w a s used to ana lyze for europium i n both t h e s a l t and metal phases . T h e da ta reported a re f rom experiments in which the europium ba lance was 90 to 110%. Each sample of the metal phase
An emission-spectrographic or a neutron-activa-
T-
TEMPERA WKE
f 500 0 583 -
GO2 ~
* 605 -
Q 608 A 700 , , 1 1 1
+ill1 /I
ORNL-DWG 67-44848
0.5 1 2 5
LITHIUM CONCENTRATION IN METAL PHASE ( a t "70)
io
Fig . 24.1. Distr ibut ion of Europium Between LiF- BeF2 (66-34 mole %j and L i - B i Solutions.
t h i s study; solid l ine, datu of Shoffer, Moulton, et af.
( s e e Reactor Chem. D i v . Ann. Progr. Rept. Dec . 31,
1966, ORNL-4076).
Data points,
was analyzed for lithium by both an emiss ion spectrographic and a flame photometric method. In some ins tances , t h e va lues obtained were markedly different; t h i s i s readily apparent i n the data obtained from experiment JF:1,64 ('Table 24.1).
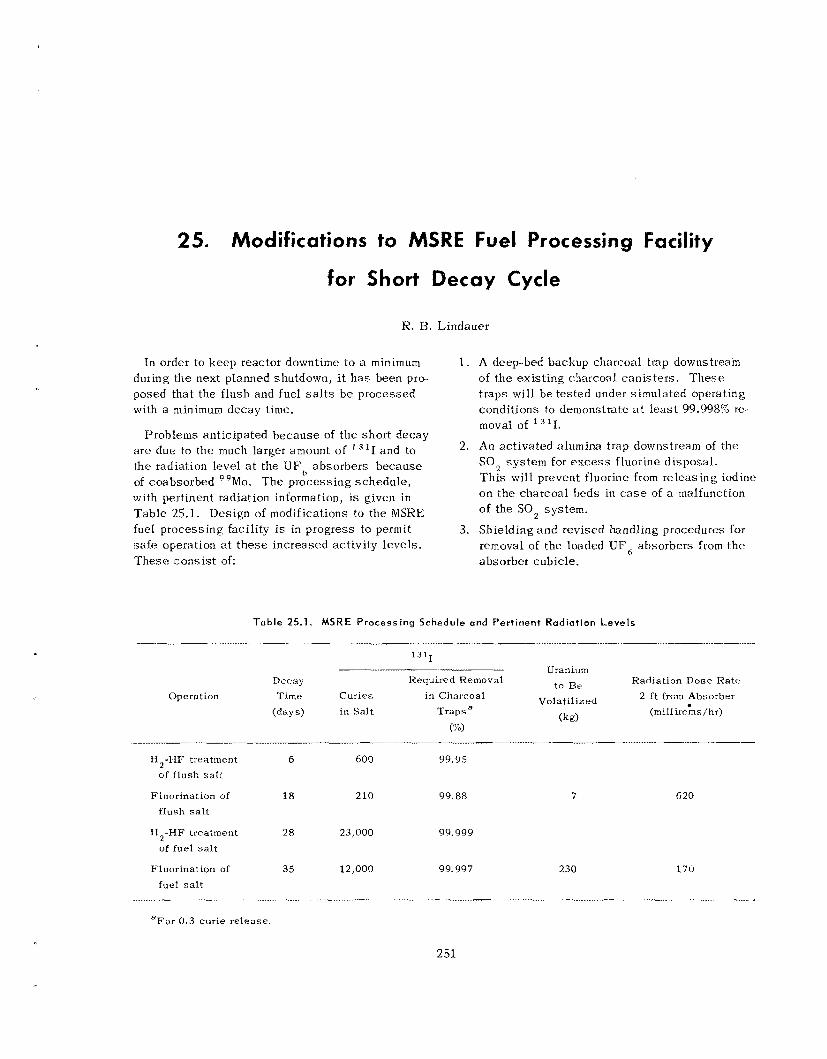
25. Modifications to MSRE Fuel Processing Facility
for Short Decay Cycle
K. R. Lindauer
In order to keep reactor downtime to a minimum during the next planned shutdown, i t h a s been pro- posed that t he flush and fuel s a l t s b e processed with a minimum decay time.
1. A deep-bed backup charcoal trap downstream of the ex is t ing charcoal can is te rs . T h e s e t raps will b e tested under simulated operating conditions to demonstrate a t l e a s t 99.998% re- moval of I.
2. An ac t iva ted alumina trap downstream of t h e SO2 sys t em for e x c e s s Eluorine d isposa l . T h i s will prevent fluorine from re leas ing iodine o n t h e charcoal beds in case of a malfunction of the SO2 system.
IJroblems anticipated because of t h e shor t decay a r e due to the much larger amount of 1 3 1 1 and to t h e radiation level at the U F 6 absorbers because of coabsorbed ‘’Tvlo. The process ing schedu le , with pertinent radiation information, is given in Table 25.1. Design of modifications to the MSRE fuel process ing facil i ty i s in progress to permit safe operation at t h e s e increased activity leve ls . T h e s e cons i s t of: absorber cubicle.
3. Shielding and revised handling procedures for removal of the loaded U F 6 absorbers from t h e
Table 25.1. MSRE Processing Schedule and Pert inent Radiation Leve ls
1 3 1 1
Uranium to Be
Volatilized
Radiation Dose Rate 2 f t from Absorber
(millirems /hr)
Decay Required Removal
(days) in Salt Traps* Operation T i m e Curies in Charcoal
(kg) (“I)
H,-WF treatment 6 600 99.9s of flush s a l t
Fluorinat-ion of 18 210 99.88
flush salt
H2-HF treatment 28 23,000 99.999
of fuel s a l t
Fluorination of 35 12,000 99.997
fuel s a l t
7
230
620
170
aFor 0 . 3 curie release.
251
f 243uUF,-7biF Fuel
for the
J. M. Chandler
P l a n s are nosv being made for refueling and op- erating the MSXE with 2 3 3 U fuel ear ly in 1968; approximately 40 kg of 2 3 3 U a s 2 3 3 U F 4 - 7 L i F (27 and 73 mole %) eutec t ic s a l t will be required. Th i s material must be prepared in a sh ie lded fa- cil i ty because of the high 2 3 2 U content (240 ppm) of the 233U. T h e following sec t ions descr ibe the process , equipment, and s t a tus of t he fuel prep- aration process.
PROCESS
'The process for preparing eu tec t ic - UF4-T,iF (27 and 73 mole %) s a l t for the original MSRE charge s ta r ted with UF4 and L i F . ' Since 2 3 3 U i s avail- ab l e only as the oxide, the process was modified. The UO, i s charged to a nickel-lined vesse l , and L i F is added on top of it. 'The charge is heated, under helium, to 9QOOC to melt the LiF, which wets the oxide and thermally decomposes the UO, to a n average composition of U 0 2 . 6 . 'The charge is treated with H, to reduce the U 0 2 , 6 to U 0 2 and then hydrofluorinated with H,-HF (approximately 1O:l mole ratio) to convert the UO, to UF4. T h e progress of the reaction of 1J02 to form U F 4 is followed by the changes in the liquidus tempera- ture of the binary mixture a s the melting point of the charge dec reases from the init ial melting point of 845OC for the LiF to 49OOC for the U F 4 - L i F (27 and 73 mole %) eutec t ic product. Hydrogen fluoride utilization and water production are a l s o indicative of the progress of the reaction. After
M S R Program Semiann. Progr. H e p t . Feb. 28, 1965 , OHNL-3812, pp. 149-50.
E. L. Nicholson
a final H, sparge to reduce impurities, s u c h a s iron and nickel fluorides, to metals and to sweep out dissolved H F , the s a l t i s sampled, filtered, and stored in a product container. T h i s process has been satisfactorily tes ted on a small s c a l e , and the results indicate that t he processing t ime will be about 15 days/batch.
'Tentative plans are to make three 12-kg 2 3 3 U ba tches of s a l t , which will be used for t h e major additions to the barren s a l t in the MSRE, and one 7-kg 2 3 3 U batch, which will be loaded into 60 en- riching capsules .
EQUIPMENT AND OPERATIONS
The scheiiiatic equipment flowsheet for s a l t preparation is shown in Fig. 26.1. The c a n s of U03 , each containing about 500 g of uranium, will be transported in a sh ie lded c a s k from t h e 2 3 3 U s torage Bcili ty in Building 3019 to the T U R F building (7930) and introduced into ce l l G. All operations in ce l l G will be done remotely. k?y the u s e of manipulators, the cans will b e loaded into the alpha-sealed can opener and the dunipei box, which d ischarges the oxide into the heated nickel- lined 8-in.-diarn by 3-ft-high reaction vesse l and routes t h e empty c a n s to s torage for subsequent removal from the ce l l . the reaction vesse l via the dumper. P r o c e s s g a s e s a re supplied from outside the ce l l , and instrumentation is provided to control g a s flows and processing temperatures. Waste gases are filtered t o remove entrained 2 3 3 U and scrubbed with KOH to remove unreacted WF before dis- posa l to the radioactive off-gas sys tem. After sampling, the product i s transferred via a heated
T h e 'LiF i s charged to
252
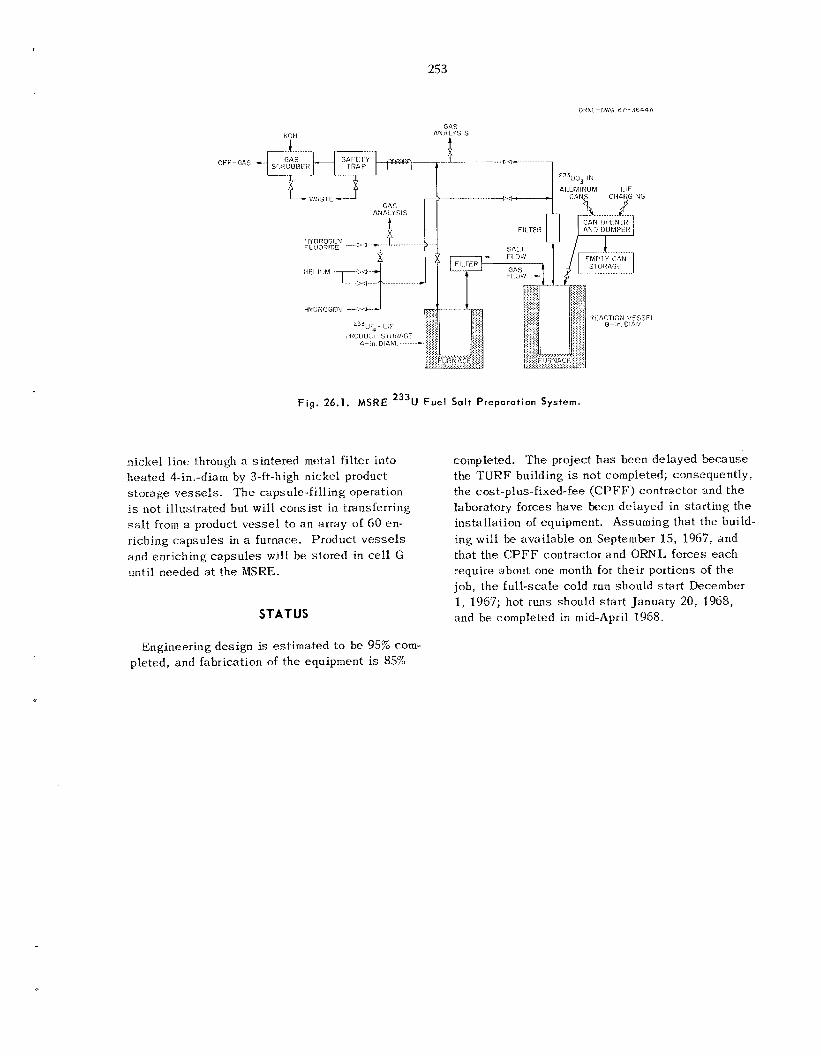
253
KOH I
GAS AN A LYS IS
F i g . 26 , l . MSRE 233U Fuel Salt Preparation System.
nickel l ine through a s in te red metal filter into hea ted cl-in.-diam by 3-ft-high nickel product s torage vesse l s . T h e c a p s de - f i l l i ng operation is not i l lustrated but will cons i s t in transferring salt horn a product v e s s e l to a n array of 60 en- riching capsu le s in a furnace. Product v e s s e l s and enriching capsu le s will be s tored in cell G until needed at the MSRE.
STATUS
completed. T h e project h a s been de layed because the T U R F building is not completed; consequently, the cost-plus-fixed-fee (CPFF) contractor and t h e laboratory forces have beten de layed in s ta r t ing t h e installation of equipment. Assuming that the build- ing will bc ava i lab le on September 15, 1967, and that t h e CPFF contractor and ORNI, Eorces each require dbout one month for their portions of t he job, the fu l l - sca le cold run should s t a r t December 1, 1967; hot tuns should s t a r t January 20, 1968, and be completed in mid-April 1968.
Engineering des ign is es t imated to be 95% com- pleted, and fabrication of the equipment is 85%

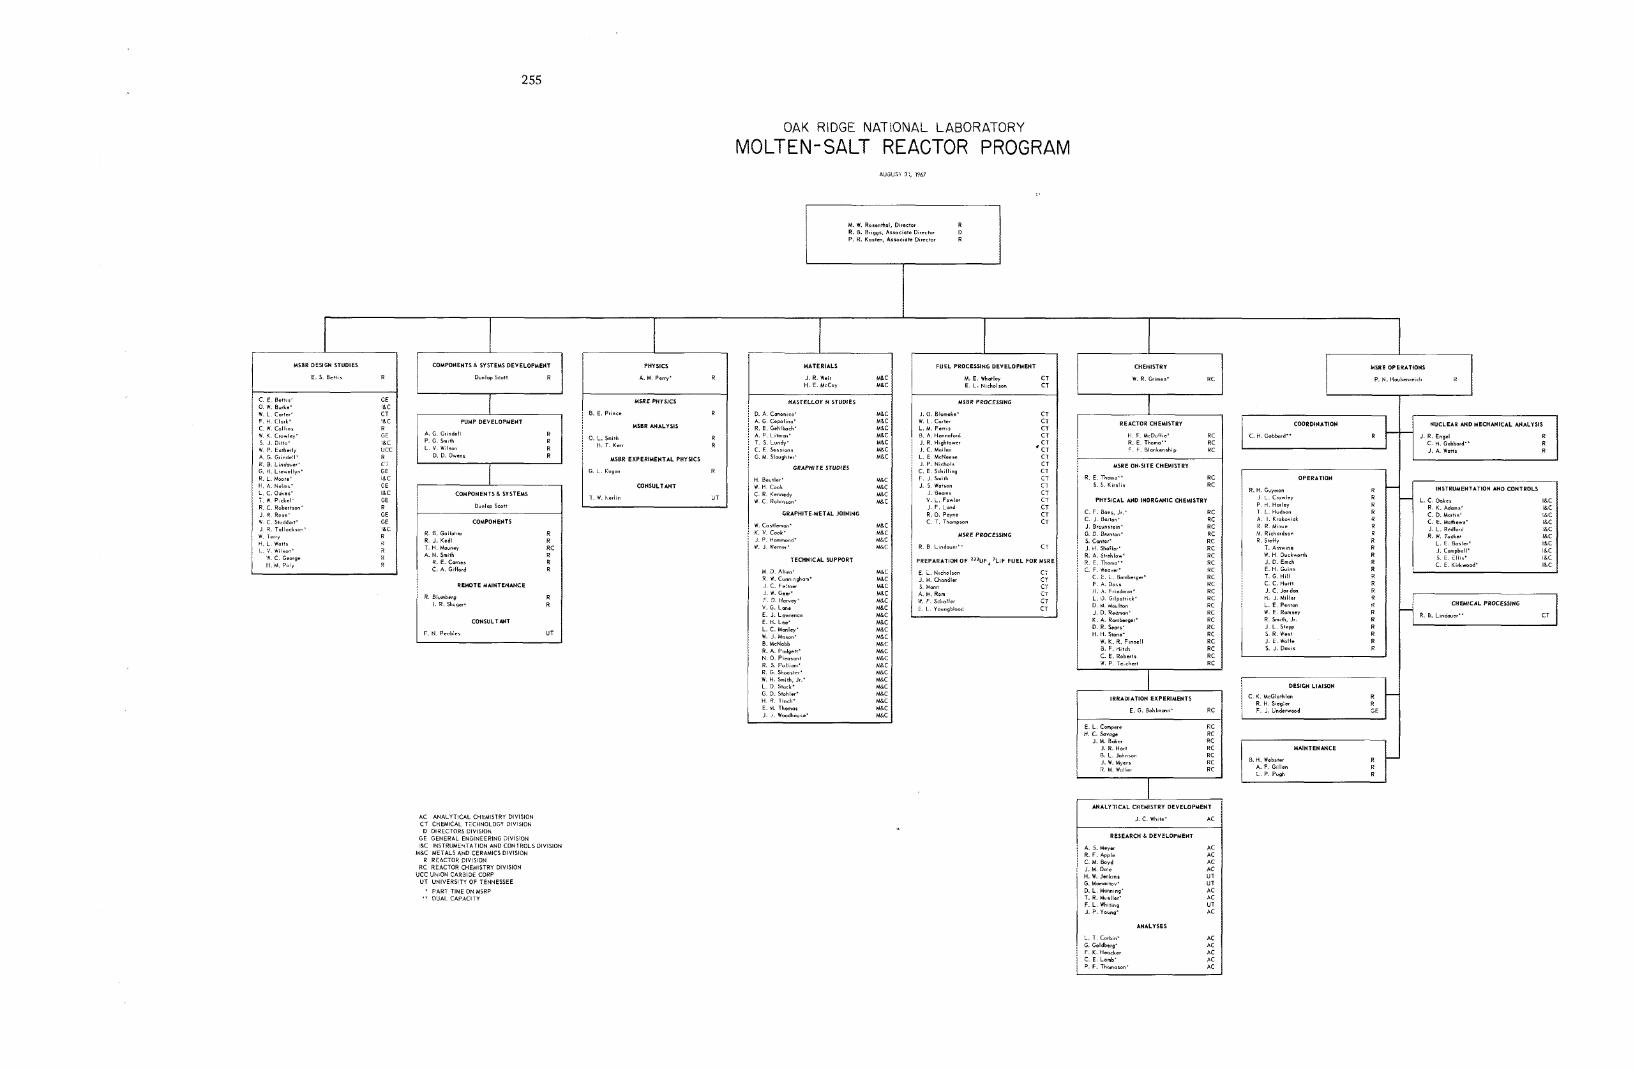
255
t l F McDufiie" R. E Thoma" RC
F Blankenship RC
MSRE ON.SITE CHEMISTRY
R E ?homo" RC 5. S. Kirrl ir RC
PHYSICAL AND INORGWIC CHEMISTRY
C F. Boer, Jr.' RC C J Barton* RC J Brounrteln' RC G D Brunton* RC 5. c.ntor* RC J il Shdler' RC R. A. S t r e h l o r * RC R E. Thorno" RC C. F. Newer' RC
RC C. E i. Bombcrgd F. A. 305s RC ti. A Friedman- RC L. U Gtlpmtrtck~ RC 0. M Modton RC J. D. Redmon' RC K. A. RomLrgcr* RC D R. Scars' RC H. H. Stone' RC
W. K. R. Finncll RC 0. F. d i t ch RC C. E. Roberts RC W P Te.chert RC
OAK RIDGE NATIONAL LABORATORY MOLTEN-SALT REACTOR PROGRAM
CT F J .Smth i? J. 8 Wotson CT
J. Beoms C? V. L. F o r l s r CT J F. Land CT R. 0. Payne CT C i Thompsan CT
' C. E. Schilllng
M I R E PROCESSING
AiiGiiS' 3:. 1967
MSBR DESIGN STUDIES
E. S Bents R
C E Bcttlr ' GE 0 W. Burke' lac w. L Cmrter' CT F. H Clork' lac c w C.ll,nr R w. Y C,~Wl."~ GE S J Ditto'
W. P. Eoherly A. G Grinde'l' R. 8. Lmdwuer'
R. L. Moore' tl A N e l m r * L C. Oukcsw 7 w P ckel ' R C. Robertson' J. R Rose' W C Shddort- J R. Tallockscn'
W Terry H. L w.,tr L v W , l r o n ~
'V C George tl M P o l y
G. n L ~ ~ ~ ~ I I ~ ~ -
lac ucc R C i GE lac CE 1 IC GE R GE GE ILC R 4 R a 9
COMPONENTS 8 SYSTEMS DEVELOPMENT
Dunlap Scoif
PUMPDEVELOPMENT
A. G Grindell P G h t h L v W,lran
D. D. Owens
I
I D d o p Scott I I COMWNENTS 6 SYSTEMS
COMPONENTS
R 8. Golloher R J. Ked1 T H. Mouney A. N. Smith
R. E Carner i'/ REHOTE MAINTENANCE
, R Blumbcrp I . A. 5h"go.l
CONSULTUIT
F. N PecWrr
AC ANALYTICAL CHEMISTRY DIVISION C T CHEMICAL TECHNOLOGY OlVlSlDN
D DIRECTORS DIVISION GE GEhERA. Eh; hCER h G V S O h 31 h'>TR..M:%lAl 0 h A h D l O h l K O . S U d SUh
u I C META-8 AI.D CERAM CSD v s 3h a R;~C-III. " v i oh
RC REACTOR CHEMISTRY DIVISION
UT UNIVERSITY OF TENNESSEE dCC 8 h l D N CARBIDC CORP
' PART TIME ON MSRP * * DUAL CAPACITY
PHYSICS
A.M. Perry' R
M I R E 4(161CI
E. E. Prince R
MSBR ANALYSII
0. L. Smlth R H T K r r r R
MSBR EXPERIMENTAL PHYSICS
G L. Ragon R
CONSULTANT
T. W. hcrlin UT
MATERIALS
J. R. Weir H E McCoy
R A I T E L L O I N ITUDlES
0. A. Cononico' A G Cepolino' R. E. GchlLch ' A P Litrnm*
GRAPHITE STUDIES
H Beutler' W H Cook C. R Kennedy W C. Robinson'
CRAPHITE-METAL JOINING
w Coderno"' K. V Cook' J. P Hommond- W. J Ylcmer'
TECHNICAL SUPPORT
M 2 Allcn' R W. Cumnghom* J C. Fc:tner J. A. Gccr' 7 3. Harvey'
v. G. Lmn. E. J. Lawrence E H. Lee' L. C. Monley' W. J Mason' 8. McNabb R. A Podgcw- N 0 Pieoron+ R. 5. Pu l l~m* R. G ShoortEr3 W. H. Smith, Jr.' L D Stock' G. 2. Stohler' H R Tinch' E. 4. Thomas J I Woodhouse'
MLC MLC -
MLC M I C M X MLC M I C M C MLC
W C W C W C MBC
M a c MLC M U MLC
M&C MLC M C UPC MAC MKC M I C MLC M a c MLC M C W C h%C h% C M8C M6C MAC M I C MLC M I C W C
IRRADIATION EXPERIMENTS
E. G Bohlmmn'
E L Compere H C. S a v n g .
J. M. Boker J. R. Hart B L.Johnron J. W. Myers 9 M. Wnller RC
ANALYTICAL CtlEMlITRY DEVELOPMENT
J. C White' AC
RESEARCHLDEVELOPMENT
A. 5. Mcyer AC R. F. Apple AC C M. & i d AC J. M Dole AC ti. W. Jenkins UT G. Momontovf UT D. L Manning' AC T. R. Mueller' AC F. L Whmtlng UT J P. Young. AC
ANALYSES
MLRE OPLRATIONS
P. N. H m b c n r e l i R
COORDINATION t C. H. Gobbard-.
OPERATION
R. H. Guymon J L Crowlcy P. d. Harley T L Hudson A. I. Krokoviak R R Minve 44 Richardson R S k l l r
T. A rn r ine W tl D u r k w r L J. D. Emch E. H Gvinn T G H i l l c c. nvrtt J. C. J w d m H. J. Mil lor L. E Pcnmn W E Romrcy R Smith, Jr J L . Stepp S R. W e d J E. V d l c 8. J. Dgvir
R R R R R R R R R R R R
R R R
R R R R R A
a
C K McGlothlan DESIGN L IA IY IN
R H Sicg:cr F. ;. Under rmd
0. H Webrter MAINTENANCE
A. F Gillcn L P P"gh
NUCLEAR ANDMECHANICAL ANALYSIS
J R. Engcl C H Gobbord-' J. A W m s
INSTRUMENTATION AND CONTROLS
R K. Adorns'
C. E. Mdhews' J. L. Redlord R. W . Tucker
C. D. Mortm'
L. E Oorler' J. Campbell' 5 E t l l i r ' C. E. KmBwood'
CHEMICAL PROCESSING 1 R . 6. L8ndou.r" CT
L. T Corbin' G. Goldberg* F K. Hcorkcr C E Lamb'
AC AC AC AC
P F. Thomoron' AC

ORNL-4191 UC-80 - Reactor Technology
INTERNAL DISTRIBUTION
1. R. K. Adams 2. G. M. Adamson 3. R. G. Affel 4. L. G. Alexander 5. R. F. Apple 6. C. F. Baes 7. J. M. Baker 8. S. J. Bal l 9. C. J. Barton
10. H. F. Bauman 11. S . E. Beall 12. M. Bender 13. C. E. Bett is 14. E. S . Bett is 15. D. S. Bi l l ington 16. R. E. Blanco 17. F. F. Blankenship 18. J. 0. Blomeke 19. R. Blumberg 20. A. L. Boch 21. E. G. Bohlmann 22. C. J. Borkowski 23. G. E. Boyd 24. J. Braunstein 25. M. A. Bredig 26. E. J. Breeding
27-41. R. B. Briggs 42. H. R. Bronstein 43. W. E. Browning 44. F. R. Bruce 45. G. D. Brunton 45. G. H. Burger 47. D. A. Canonico 48. S. Cantor 49. D. W. Cordwell 56). W. L. Carter 51. G. I. Cathers 52. J. M. Chandler 53. C. W. Col l ins 54. E. L. Compere 55. J. A. Conlin 56. W. H. Cook 57. L. T. Corbin 58. W. B. Cottrell
59. G. A. Cristy 60. S, J. Cromer (K-25) 61. J. L. Crowley 62. F. L. Culler 63. J. M. Dale 64. D. G. Davis 65. W. W. Davis 66. R. J. DeBakker 67. J. H. DeVan 68. S. J. Ditto 69. R. G. Donnelly 70. N. E. Dunwoody 71. A. S. Dworkin 72. D. A. Dyslin 73. W. P. Eatherly 74. M. C. Edlund (K-25) 75. J. R. Engel 76. E. P. Epler 77. W. K. Ergen 78. D. E. Ferguson 79. L. M. Ferris 80. A. P. Fraas 81. H. A. Friedman 82. J. H Frye, Jr. 83. C. H. Gabbard 84. W. R. Gall 85. R. B. Gallaher 86. R. G. Gi l l i land 87. H. E. Goeller 88. W. R. Grimes 89. A. 6. Grindell 90. R. H. 6uymon 91. R. P. Hammond 92. B. A. Hannaford 93. P. H. Harley 94. D. G. Harmon 95. C. S. Harri l l 96. P. N. Haubenreich 97. F. A. Heddleson 98. P. G. Herndon 99. R. F. Hibbs (Y-12)
100. J. R. Hightower 101. M. R. H i l l 702. E. C. Hise
257
258
103. H. W. Hoffman 104. V. D. Hol t 105. P. P. Holz 106. R. W. Horton 107. A. S. Householder 108. T. L. Hudson 109. H. lnouye 110. W. H. Jordan
111-115. P. R. Kasten 116. R. J. Ked1 117. M. T. Kel ley 118. M. 4. Kel ly 119. C. R. Kennedy 120. ‘T. W. Kerlin 121. ti. T. Kerr 122. R. F. Kimball 123. S. S. Kirs l is 1211. D. J. Knowles 125. A. I . Krakoviak 126. J. W. Krewson 127. C. E, Lamb 128. J. A. Lane 129. C. E. Larson 130. E. J. Lawrence 131. T. A. Lincoln 132. R. 8. Lindouer 133. A. P. L i t m a n 134. J. L. L iverman 135. R. S. Livingston 136. G. H. L lewe l l yn 137. M. I. Lundin 138. R. N. Lyon 139. H. G. MacPherson 140. R. E. MacPherson 141. F. C. Maienschein 142. D. L. Manning 143. C. D. Martin 144. W. R. Martin 145. C. E. Mathews 146. T. H. Mauney 147. H. McClain 148. R. W. McClung 149. H. E. McCoy 150. I-1. F, McDuffie 151. C. K. McGlothlan 152. C. J. McHargue 153. L. E. McNeese 154. A. S. Meyer 155. E. C. Miller 156. C. A. Mi l l s 157. R. L. Minue
158. W. R. Mixon 159. R. 1.. Moore 160. K. Z. Morgan 161. J. C. Moyers 162. bl. A. Nelms 163. J. P. Nichols 164. E, L, Nicholson 165. L.. C. Oakes 166. W. R. Osborn
167-168. R. B. Parker 169. L, F. Parsly 170. P. Patriorca 171. 1-1. 2. Payne 172. A. M. Perry 173. T. W. Piekel 174. 1-1. B. Piper 175. B. E. Prince 176. G. L. Ragan 177. J. L. Redford 178. M. Richardson 179. R. C. Robertson 180. W. c. Robinsoil 181. H , c. Rol ler
182-316. M, W. Rosenthal 317. H. C. Savage 318. A. W. Savolainen 319. W. F. Schaffer 320. C, E. Schil l ing 321. Dunlap Scott 322. J. L. Scott 323. H. E. Seagren 324. C. E. Sessions 325. J. Id. Shaffer 326. E. D, Shipley 327. M. J. Skinner 328. 6. M. Slaughter 329. A. N. Smith 330. F. J. Smith 331. G. P. Smith 332. 0. L. Smith 333. P. G, Smith 334. A. 11. Snell
336. I. Spiewak 337. R. C. Steffy 338. C. E. Stevenson 339. W. C. Stoddart 340. H. H. Stone 341. R. A. Strehlow 342. D. A. Sundberg 343. J. R. Tallaskson
335. W. F. Spencer
259
344. E. H. Taylor 345. W. Terry 346. R. E. Thoma 347, G. M. Tolson 348. L. M. Toth 349. D. 5. Trauger 350. R. W. Tucker 351. W. C. Ulr ich 352. D. C. Watkin 353. G. M. Watson 354. J. 5. Watson 355. H. L. Watts 356. C. F. Weaver 357. B. H. Webster 358. A. M. Weinberg 359. J. R. Weir
360. W. J. Werner 361. K. W. West 362. M. E. Whatley 363. J. C. White 364. G. C. Wi l l i ams 365. L. V. Wilson 366. G. J . Young 367. J. P. Young 368. F. C. Zapp 369. Biology Library
370-373. ORNL - Y-12 Technical Library Document Reference Section
374-376. Central Research Library 377-41 1. Laboratory Records Department
412. Laboratory Records, ORNL R.C.
EXTERNAL DlSTRlBUTlON
413. W. 0. Allen, Atomics International, P.O. Box 309, Canoga Park, California 91204 414. J. G, Asquith, Atomics International, P.O. Box 309, Canoga Park, California 91304 415. J. C. Bowman, Union Carbide Technical Center, 12900 Snow Road, Parma, Ohio 44130 416. G. D. Brady, Materials Systems Division, UCC, Kokomo, Indiana 46901 417. J. H. Brannan, Carbon Products Division, 270 Park Avenue, New York, New York 10017 418. W. S . Butler, Dow Chemical Company, Ludington, Michigan 419. R. A. Charpie, UCC Electronics Division, 270 Park Avenue, New York, New York 10017 41’0. Paul Cohen, Westinghouse Electric Corp., P.O. Box 355, Pittsburgh, Pennsylvania 15230
421-422. D. F. Cope, Atomic Energy Commission, RDT Site Office (ORNL) 42’3. J W. Crawford, Atomic Energy Commission, Washington 20545 424. M. W, Croft, Bobcock and Wilcox Company, P.O. Box 1260, Lynchburg, Virginia 24505 425. C. B. Deering, Atomic Energy Commission, RDT Site Office (ORNL) 426. D. A. Douglas, Materials Systems Division, UCC, Kokomo, Indiana 46901 427. H. L. Falkenberry, Tennessee Valley Authority, 303 Power Building, Chattanooga, Tenn. 37401 428. C. W. Fay, Wisconsin Michigan Power Company, 231 W. Michigan Street, Milwaukee, Wisconsin 429. Gregory Flynn, General Motors, 12 Mi le and Mound Roads, Warren, Michigan 430. A. Giambusso, Atomic Energy Commission, Washington 20545 431. Gerold Golden, Argonne National Laboratory, 9700 S. Cass Avenue, Argonne, I l l inois 60439 432. W. W . Grigorieff, Assistant to the Executive Director, Oak Ridge Associated Universit ies 433. J. T. Kehoe, Burns and Roe, Inc., 700 Kinderkamack, Oradell, New Jersey 07649 434. L. W. Long, Douglas United Nuclear, 703 Bldg., Richland, Washington 99352 435. W. J. Larkin, Atomic Energy Cornmission, O R 0 436. J. A. Lieberman, Atomic Energy Commi ssion, Washington 20545 437. R. A. Lorenzini, Foster Wheeler, 110 S. Orange, Livingston, N.J. 07039 438. W. D. Manly, Material Systems Division, UCC, 270 Park Avenue, New York, New York 10017 439. C. L.. Matthews, Atomic Energy Commission, RDT Site Off ice (ORNL) 440. J. P. Mays, Great Lakes Research Corporation, El izabethton, Tennessee 441. W. B. McDonald, Bottel le-Pacif ic Northwest Laboratory, Hanford, Washington 99352
442-443. T. W. McIntosh, Atomic Energy Commission, Washington 20542
260
444. 445. 446. 417. 448. 449. 450. 451. 452. 453. 454. 455. 456. 457. 458. 459. 460. 461. 462. 463, 464. 465. 466, 467. 448.
471 -733. 469-470.
W. J . Mordarski, Nuclear Development, Combustion Engineering, Windsor, Connecticut Sidney Parry, Great Lakes Carbon, P.O. Box 667, Niagara Falls, New York 14302 Worth Percival, General Motors, 12 Mi le ana' Mound Roads, Warren, Michigan G. J. Petretic, Atomic Energy Cornmission, 'iVashington 20515 M. A. Rosen, Atomic Energy Commission, Washington 20545 H. M. Roth, Atomic Energy Commission, O R 0 R. W. Schmitt, General Electric Co., Schenectady, N.Y. 12301 M. Shaw, Atomic Energy Commission, Washington 20545 Rem0 Silvestrini, United Nuclear Corporation, 5 New Street, White Plains, N.Y. 10601 E. E. Sinclair, Atomic Energy Commission, Washington 20545 W. L. Smalley, Atomic Energy Commission, OR0 T. M. Snyder, General Electric Co., 175 Curtner Ave., San Jose, California 95103 L. D. Stoughton, IJCC, P.O. Box 500, Lawrenceburg, Tennessee 38464 J. A. Swartout, UCC, 270 Park Avenue, New York, New York 10017 R. F. Sweek, Atomic Energy Commission, Washington 20545 Richocd Tait, Poco Graphite, P.O. Box 1524, Garland, Texas 75040 D. R. Thomas, Commonwealth Assiciates, Inc., 209 E. Washington Ave., Jackson, Michigan 49201 M. I sou , General Motors, 12 Mi le and Mound Roads, Warren, Michigan J. IN. l l l lmann, UCC, P.O. Box 278, Tarrytown, New York 10591 C, H. Waugaman, Tennessee Valley Authority, 303 Power Bui Iding, Chattanooga, Tenn. 37401 D. 13. Weaver, Tennessee Valley Authoriiy, New Sprankle Bldg., Knoxville, Tennessee G. 0. Wessenauer, Tennessee Val1 ey Authority, Chattanooga, Tennessee 37401 M. J. Whitman, Atomic Energy Commission, Washington 20545 H. A. Wilber, Power Reactor Development Company, 1911 F i rs t Street, Detroit, Michigan James Wright, Westinghouse Electric, P.O. Box 344, Pittsburgh, Pa. 15230 Laboratory and University Division (ORO) Given distribution a s shown in TID-4500 under Reactor Technology category (25 copies-CFSII)