orporate social responsibility: taking root - csr...
TRANSCRIPT

IiAS Comment | 5 January 2016
1 iias.in January 2016
Institutional EYE
1 Average profit before tax of the preceding three years has been calculated based on numbers available on Prowess database of Centre for Monitoring Indian Economy (CMIE). It includes profits arising from branches outside India.
Focus
First Reaction
Governance Spotlight
Regulatory Overview
Thematic Research
Event Based Research
General
Corporate Social Responsibility: Taking root IiAS believes that corporates are embracing Corporate Social Responsibility (CSR) enthusiastically. Although the spend was 26% lower than the prescribed amount, the S&P BSE 100 companies spent Rs.52.4 bn on CSR in FY15 up almost 75% from Rs.30.0 bn in FY13. And this amount is further expected to increase to Rs.85.0 bn in the current financial year. Even as CSR is entering corporate consciousness, the next two to three years will remain a ‘learning period’ for industry. CSR in India has moved from a voluntary activity to a compulsory requirement backed by law. India is the first country to mandate a minimum spend on CSR. Clause 135 of the Companies Act 2013 (the Act) requires companies above a certain financial threshold to spend at least 2% of their average net profits of the preceding three years on CSR. However, the Act has taken a ‘comply or explain’ approach. IiAS studied the FY15 CSR initiatives and disclosures of the S&P BSE 100 companies to understand and evaluate how these companies fared. The CSR spend of these 100 companies, aggregated to Rs.52.4 bn. Of these, however, 95 companies were required to comply with the requirements of CSR spend under the Act – the CSR spend for these 95 companies aggregated Rs.51.9 bn. Five companies were not required to spend on CSR mandatorily because they recorded three-year average losses yet these companies spent Rs.0.5 bn (in aggregate) on CSR.
Even before the statutory CSR norms were put in play, the larger companies were spending on social and environmental causes. In FY13, these S&P BSE 100 companies spent Rs.30.0 bn on CSR. This was, on an average, 0.9% of the average profit before tax1 of the preceding three years of these companies. This is evidence of the fact that companies in India recognize the need to undertake socially responsible activities. PSU’s trail behind While PSUs have been required to spend on CSR since 2010 as per the Department of Public Enterprises (DPE) guidelines, non-PSUs have had no such obligation. Yet, of the Rs.30.0 bn spent in FY13, non-PSUs typically spent 1.0% of their average profit before tax of the preceding three years while PSUs spent 0.6% of their average profit before tax of the preceding three years. This trend has continued. In FY15, CSR spends of the S&P BSE 100 companies aggregated 1.5% of their three year average profits. Non-PSUs spent 1.6% and the 21 PSUs spent 1.3% of their average profit in the preceding three years, respectively. Given that PSUs had a head start, they should have been in a better position to scale up their CSR activities.
Write to us Institutional Investor Advisory Services India Limited 15th Floor, West Wing, PJ Tower Dalal Street, Mumbai -400 001 Email: [email protected] www.iias.in
Write to us Institutional Investor Advisory Services India Limited 15th Floor, West Wing, PJ Tower Dalal Street, Mumbai – 400 001 www.iias.in
Subscribe to IiAS Research Write to us [email protected]
Related research CSR: Review of current policies, practices, and disclosures Mandatory CSR: How should shareholders think about it while evaluating companies?

Corporate Social Responsibility: Taking root
2 iias.in January 2016
Institutional
EYE
Additionally, not all PSUs have followed the prescribed disclosure under the Act, and some have not even explained the reason for the shortfall in CSR spends (as is required under the comply or explain approach). Enacting laws without a follow-through on implementation reduces the seriousness of the government’s diktat – more so given that PSUs are large in size and impact overall spends in a meaningful way. Ownership-wise spend in FY15
What are companies spending on? Around 65% of the aggregate FY15 CSR spend, by these 100 companies was philanthropic: some instances include, 19 companies contributed Rs.610.7 mn towards the Prime Minister’s National Relief Fund and seven companies contributed Rs.470.6 mn towards Swachh Bharat Kosh. While these causes need support, having companies undertake CSR also contains the added agenda of using corporate execution and managerial capabilities to achieve a larger national agenda. Break-up of CSR spend as per Schedule VII activities
(Amounts in Rs. mn)
*Overheads refer to the expenditure on building CSR capacities of the company and/or implementing agencies
7,493.0
2,266.6
25,411.1
17,179.9
2,719.9
756.9
4,545.4
10,129.9
0% 20% 40% 60% 80% 100%
Institutionally owned companies
Multinational companies
Promoter owned companies
Public sector undertakings
Actual CSR spend (Rs. mn) Unspent (Rs. mn)
0.0
1.3
180.6
482.6
610.7
1,098.4
2,022.7
4,668.1
5,370.5
5,435.2
14,660.0
14,968.8
Technology incubators
Armed forces veterans
Sports
National heritage
PM's National Relief Fund
Overheads*
Reducing inequalities
Rural development projects
Environmental sustainability
Multiple sectors/others
Education
Hunger, poverty, and healthcare

Corporate Social Responsibility: Taking root
3 iias.in January 2016
Institutional
EYE
2 Project Kaushalya by Aditya Birla Nuvo and Tata Motors are two distinct projects
At least 39 companies successfully undertook activities that tie back to their businesses. Some examples of these are: Aditya Birla Nuvo launched Project Kaushalya2, a skills training centre in
collaboration with Confederation of Indian Industry (CII). So far Aditya Birla Nuvo has trained and certified 1,036 youngsters in trades such as handling and repair of electrical equipment, auto service technicians, retailing, data entry operators, tailoring, and salon care.
Similarly, Tata Motors trains youth in technical and automotive trades through its project Kaushalya2.
Godrej Consumer Products launched Godrej Vijay in 2011 – a training programme in channel sales to help skill unemployed youth and build a talent pipeline for the fast moving consumer goods industry. The programme has trained 38,999 youth across 44 locations in channel sales.
Kotak Mahindra Bank conducted Financial Literacy Camps where over 60 activities were conducted in different locations across Maharashtra. Also, Kotak Unnati is a vocational training program for youth drop-outs from schools / colleges. This program includes a financial literacy module developed and co-sponsored by National Institute of Securities Markets (NISM).
Maruti Suzuki conducts a ‘road safety’ programme that provides training on driving skill and behaviour. For the initiative, the company has partnered with (i) State governments to set up Institutes of driving and traffic research and (ii) Its dealers to set up Maruti Driving Schools. Further, the company is working with 88 Industrial Training Institutes (ITIs) spread across 21 states to upgrade automobile related trades and create employment options for them in automobile service workshops.
Colgate-Palmolive (India) conducts a program called ‘Bright Smiles, Bright Futures’ wherein it reaches out to influencers – such as school teachers and the anganwadi teachers in communities – to improve oral health. For this program, it has partnered with the Indian Dental Association and committed dental professionals.
Asian Paints conducts livelihood enhancement projects in the form of basic and specialized painter training programmes to unemployed youth and painting applicators/contractors.
Dr. Reddy’s Laboratories undertakes capacity building of health service providers.
Dabur India undertakes employment enhancing vocational skills development through vocational training centres and provides bee‐keeping training.
Through Campus Connect, launched in May 2004, Infosys shares some of its best practices with engineering colleges, thus aligning the needs of institutions, faculty, and students with those of the information technology industry.
UPL conducts Suraksha Abhyaan to create awareness among ITI students on occupational health and safety especially in chemical industry.
Hindustan Unilever conducts a Hand Washing Behaviour Change Programme which promotes the benefits of handwashing with soap in schools and anganwadis (pre-school centres). The company also partnered with Children’s Investment Fund Foundation (CIFF) and the Government of Bihar to promote handwashing behaviour change among children in Bihar with the aim to help prevent childhood illnesses and mortality.

Corporate Social Responsibility: Taking root
4 iias.in January 2016
Institutional
EYE
Sector-wise break-up of CSR spend as per Schedule VII activities
Common reasons for not meeting the 2% target (no. of companies)
0% 20% 40% 60% 80% 100%
Retail and FMCG
Power and telecom
Pharmaceuticals
Others
Oil and gas
Metals and mining
Infrastructure and real estate
Information technology (IT)
Cement
Capital goods
Banks and NBFCs
Automobile
Agrochemicals
Hunger, poverty, and healthcare Education
Reducing inequalities Environmental sustainability
National heritage Armed forces veterans
Sports PM's National Relief Fund
Technology incubators Rural development projects
Overheads Multiple sectors/others
1
1
1
1
1
9
9
14
22
Lower than budgeted fund requirement
Pending on account of documentation
Some of the initiatives are not eligibleunder the CSR rules
2014-15 was used as a preparatory year
Delay in implementation
Delay in establishing baseplatform/expertise
Delay in project identification and relateddelays
No specific reason given
Funds committed but not spent
Del
ays

Corporate Social Responsibility: Taking root
5 iias.in January 2016
Institutional
EYE
3 Independent Director as defined by IiAS 4 The MSCI Emerging Markets ESG Index was launched on 6 June 2013. Data prior to the launch date is back-tested data (i.e. calculations of how the index might have performed over that time period had the index existed).
Of the 100 companies, 20 companies currently carry out CSR initiatives through company owned trusts/foundations and 19 companies do so through promoter owned trusts/foundations. The CSR spend through promoter owned trusts/foundations aggregates Rs.11.2 bn. IiAS is of the opinion that companies have a better opportunity to align CSR initiatives along the lines of their core business activity if they conduct programmes through their own entities. IiAS also assessed whether the committees that overlook the CSR function have at least one independent director3. While regulations require companies to have at least one independent director on the CSR committee, IiAS observes that 16% of the companies do not comply with this provision. In fact 5% of the companies have not disclosed the Chairperson of the committee. Modes of spending
IiAS policy snapshot – tenure for independent directors
With regards to tenure, the IiAS policy follows the limits specified in the Companies Act 2013 – maximum tenure being limited to two consecutive terms of five years each. After ten years, an independent director will not be eligible for re-appointment for a period of an additional three years. Existing tenure will be taken into account for this.
Although the CSR rules do not require companies to undertake an impact assessment of their CSR activities, 41 companies conducted one: this reflects on the seriousness and responsibility with which companies are approaching their CSR spends. Does undertaking CSR create shareholder value? The Morgan Stanley Capital International Emerging Markets Environmental, Social and Governance (MSCI EM ESG) Index4 outperformed the MSCI EM Index over a period of eight years (2007-15). The MSCI EM ESG Index, is a capitalization weighted index that provides exposure to companies with high
70%
30%
Implementing agencies
Directly
15%
42%
43%
CSR arm (not a related party)
Related party
External implementing agencies

Corporate Social Responsibility: Taking root
6 iias.in January 2016
Institutional
EYE
5 EM countries include: Brazil, Chile, China, Colombia, Czech Republic, Egypt, Greece, Hungary, India, Indonesia, Korea, Malaysia, Mexico, Peru, Philippines, Poland, Russia, Qatar, South Africa, Taiwan, Thailand, Turkey and United Arab Emirates. 6 The Moskowitz Prize is a global award that recognizes outstanding academic research on a topic germane to the field of sustainable, responsible, impact (SRI) investment industry.
ESG performance relative to their sector peers. MSCI EM ESG consists of large and mid-cap companies across 23 Emerging Markets (EM) countries5.
Source: www.msci.com/esg-indexes
In November 2014, Allen Ferrell, Harvard Law School, and Hao Liang and Luc Renneboog, both from Tilburg University, Netherlands, were awarded the Moskowitz Prize6 at the 25th annual Socially Responsible Investing (SRI) Conference. Their study suggested that good corporate governance correlates with higher CSR initiatives. And in turn, these increased CSR practices contribute to shareholder wealth. The paper’s findings, that higher CSR performance is closely related to how much firms retain in cash holdings and higher pay-for-performance returns – support the view that CSR increases shareholder value. The authors sought to test two widely acknowledged views concerning CSR. The first is that firms that practice CSR maximize shareholder wealth in addition to providing societal good. The second view (known as the agency view), argues that CSR can be detrimental by distracting managers from their core responsibilities. The study concluded that CSR can counterbalance the negative effects of managerial entrenchment – when managerial interests outweigh that of their shareholders – and lead to higher shareholder value. The regulatory framework for CSR is a step in the right direction as it encourages companies to broaden their remit beyond their immediate stakeholders. However, CSR needs to be sustainable for it to continue to enthuse corporates and to have meaningful long-term impact. For this, companies need to have skin in the game: IiAS believes this will happen when companies integrate CSR to their strategic goals.

Corporate Social Responsibility: Taking root
7 iias.in January 2016
Institutional
EYE
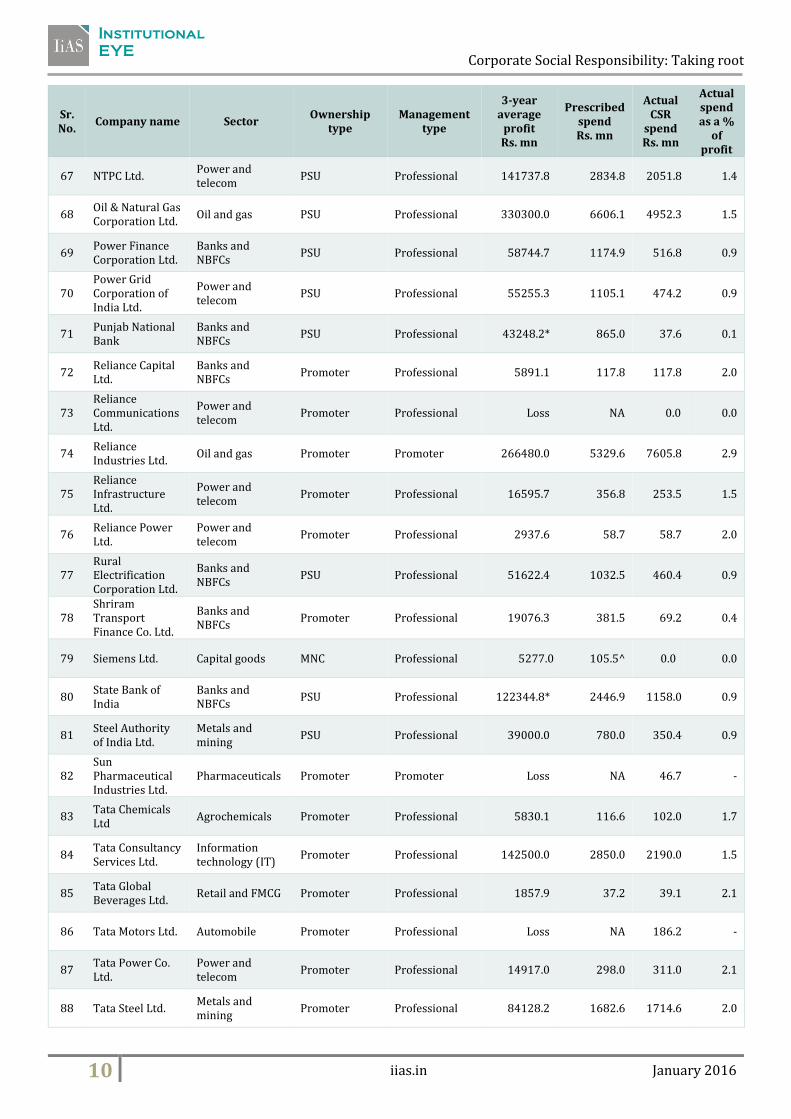
Annexure: List of the S&P BSE 100 companies
Sr. No.
Company name Sector Ownership
type Management
type
3-year average
profit Rs. mn
Prescribed spend Rs. mn
Actual CSR
spend Rs. mn
Actual spend as a %
of profit
1 ABB India Ltd. Power and telecom
Promoter Promoter 2496.1* 49.9 5.5 0.2
2 ACC Ltd. Cement MNC Professional 13600.0 272.0 274.5 2.0
3 Adani Ports and Special Economic Zone Ltd.
Infrastructure and real estate
Promoter Promoter 17900.0 357.9 359.0 2.0
4 Aditya Birla Nuvo Ltd.
Others Promoter Promoter 4704.2 94.1 96.1 2.0
5 Ambuja Cements Ltd.
Cement MNC Professional 16960.0 340.0 384.0 2.3
6 Ashok Leyland Ltd.
Automobile Promoter Professional 860.0 17.2 17.7 2.1
7 Asian Paints Ltd. Retail and FMCG Promoter Professional 14937.3 298.7 190.1 1.3
8 Aurobindo Pharma Ltd.
Pharmaceuticals Promoter Professional 6992.0 139.8 81.3 1.2
9 Axis Bank Ltd. Banks and NBFCs
Institutionally owned
Professional 66886.7 1337.7 1232.2 1.8
10 Bajaj Auto Ltd. Automobile Promoter Promoter 43164.9 863.3 429.1 1.0
11 Bank of Baroda Banks and NBFCs
PSU Professional 46762.5* 935.3 178.3 0.4
12 Bank of India Banks and NBFCs
PSU Professional 27187.1* 543.7 118.5 0.4
13 Bharat Forge Ltd. Automobile Promoter Promoter 3558.6 71.2 112.3 3.2
14 Bharat Heavy Electricals Ltd.
Capital goods PSU Professional 82223.3 1644.5 1020.6 1.2
15 Bharat Petroleum Corporation Ltd.
Oil and gas PSU Professional 38005.3 760.1 339.5 0.9
16 Bharti Airtel Ltd. Power and telecom
Promoter Promoter 69986.0 1400.0 411.0 0.6
17 Bosch Ltd. Automobile MNC Professional 13594.0 271.9 103.5 0.8
18 Cairn India Ltd. Oil and gas Promoter Professional 64898.2 1298.0 703.6 1.1
19 Canara Bank Banks and NBFCs
PSU Professional 28643.3 572.9 304.0 1.1
20 Cipla Ltd. Pharmaceuticals Promoter Promoter 17432.1 348.6 134.3 0.8
21 Coal India Ltd. Metals and mining
PSU Professional 12021.2 240.4 246.2 2.0
22 Colgate-Palmolive India Ltd.
Retail and FMCG MNC Professional 6583.9 131.7 132.8 2.0

Corporate Social Responsibility: Taking root
8 iias.in January 2016
Institutional
EYE
Sr. No.
Company name Sector Ownership
type Management
type
3-year average
profit Rs. mn
Prescribed spend Rs. mn
Actual CSR
spend Rs. mn
Actual spend as a %
of profit
23 Crompton Greaves Ltd.
Capital goods Promoter Professional 6771.6 135.4 65.9 1.0
24 Cummins India Ltd.
Capital goods MNC Professional 7948.0 159.0 54.9 0.7
25 Dabur India Ltd. Retail and FMCG Promoter Professional 7326.8 146.6 147.1 2.0
26 Divi's Laboratories Ltd.
Pharmaceuticals Promoter Promoter 8857.0 177.1 51.5 0.6
27 DLF Ltd. Infrastructure and real estate
Promoter Promoter 6410.0 128.2 128.2 2.0
28 Dr. Reddy's Laboratories Ltd.
Pharmaceuticals Promoter Promoter 18307.8 366.2 291.7 1.6
29 Eicher Motors Ltd.
Automobile Promoter Promoter 2262.6 45.3^ 0.0 0.0
30 Exide Industries Ltd.
Automobile MNC Professional 6851.4 137.0 35.8 0.5
31 Federal Bank Ltd.
Banks and NBFCs
Institutionally owned
Professional 11917.5 238.3 72.8 0.6
32 Gail India Ltd. Oil and gas PSU Professional 59333.7 1186.7 716.9 1.2
33 Glenmark Pharmaceuticals Ltd.
Pharmaceuticals Promoter Promoter 3886.6 77.7 57.7 1.5
34 GMR Infrastructure Ltd.
Infrastructure and real estate
Promoter Promoter 1132.2 22.6 29.2 2.6
35 Godrej Consumer Products Ltd.
Retail and FMCG Promoter Professional 6207.2 124.1 160.8 2.6
36 Grasim Industries Ltd.
Retail and FMCG Promoter Professional 10020.0 200.0 167.1 1.7
37 HCL Technologies Ltd.
Information technology (IT)
Promoter Promoter 44992.7 899.9 61.6 0.1
38 HDFC Bank Ltd. Banks and NBFCs
Institutionally owned
Professional 98563.5 1971.3 1185.5 1.2
39 Hero MotoCorp Ltd.
Automobile Promoter Promoter 22020.0 440.4 23.7 0.1
40 Hindalco Industries Ltd.
Metals and mining
Promoter Professional 17419.4 348.4 324.2 1.9
41 Hindustan Petroleum Corporation Ltd.
Oil and gas PSU Professional 17014.9 340.3 340.7 2.0
42 Hindustan Unilever Ltd.
Retail and FMCG MNC Professional 39909.3 798.2 823.5 2.1
43 Hindustan Zinc Ltd.
Metals and mining
Promoter Professional 75780.0 1526.4 592.8 0.8
44
Housing Development & Infrastructure Ltd.
Infrastructure and real estate
Promoter Promoter 2183.4 43.8 0.0 0.0

Corporate Social Responsibility: Taking root
9 iias.in January 2016
Institutional
EYE
Sr. No.
Company name Sector Ownership
type Management
type
3-year average
profit Rs. mn
Prescribed spend Rs. mn
Actual CSR
spend Rs. mn
Actual spend as a %
of profit
45
Housing Development Finance Corporation
Banks and NBFCs
Institutionally owned
Professional 61307.3 1226.1 269.1 0.4
46 ICICI Bank Ltd. Banks and NBFCs
Institutionally owned
Professional 85790.0 1720.0 1555.4 1.8
47 IDBI Bank Ltd. Banks and NBFCs
PSU Professional 13145.5 262.9 234.4 1.8
48 Idea Cellular Ltd. Power and telecom
Promoter Professional 15787.3 315.8 0.0 0.0
49 Indiabulls Housing Finance Ltd.
Banks and NBFCs
Institutionally owned
Professional 11599.7 232.0 232.0 2.0
50 Indian Oil Corporation Ltd.
Oil and gas PSU Professional 56475.0 1129.5 1137.9 2.0
51 IndusInd Bank Ltd.
Banks and NBFCs
Promoter Professional 16324.5 326.4 175.3 1.1
52 Infosys Ltd. Information technology (IT)
Promoter Promoter 121330.0 2430.0 2395.4 2.0
53 ITC Ltd. Retail and FMCG Institutionally owned
Professional 106461.1 2129.2 2140.6 2.0
54 Jaiprakash Associates Ltd.
Capital goods Promoter Promoter 5367.3 107.3 134.7 2.5
55 Jindal Steel & Power Ltd.
Metals and mining
Promoter Professional 23986.0 479.7 497.8 2.1
56 JSW Steel Ltd. Metals and mining
Promoter Promoter 21430.9 428.6 433.9 2.0
57 Kotak Mahindra Bank Ltd.
Banks and NBFCs
Promoter Promoter 19597.9 392.0 119.7 0.6
58 Larsen & Toubro Ltd.
Infrastructure and real estate
Institutionally owned
Professional 53102.9 1062.1 765.4 1.4
59 LIC Housing Finance Ltd.
Banks and NBFCs
Institutionally owned
Professional 14810.0 296.2 40.0 0.3
60 Lupin Ltd. Pharmaceuticals Promoter Professional 19817.0 396.3 125.8 0.6
61
Mahindra & Mahindra Financial Services Ltd.
Banks and NBFCs
Promoter Professional 12430.9 248.6 248.8 2.0
62 Mahindra & Mahindra Ltd.
Automobile Promoter Promoter 41517.4 830.3 832.4 2.0
63 Maruti Suzuki India Ltd.
Automobile MNC Professional 25053.0 501.1 372.5 1.5
64 Nestle India Ltd. Retail and FMCG MNC Professional 15366.0 307.0 85.1 0.6
65 NHPC Ltd. Power and telecom
PSU Professional 23818.8 476.4 522.4 2.2
66 NMDC Ltd. Metals and mining
PSU Professional 99791.4 1995.8 1886.5 1.9
Corporate Social Responsibility: Taking root
10 iias.in January 2016
Institutional
EYE
Sr. No.
Company name Sector Ownership
type Management
type
3-year average
profit Rs. mn
Prescribed spend Rs. mn
Actual CSR
spend Rs. mn
Actual spend as a %
of profit
67 NTPC Ltd. Power and telecom
PSU Professional 141737.8 2834.8 2051.8 1.4
68 Oil & Natural Gas Corporation Ltd.
Oil and gas PSU Professional 330300.0 6606.1 4952.3 1.5
69 Power Finance Corporation Ltd.
Banks and NBFCs
PSU Professional 58744.7 1174.9 516.8 0.9
70 Power Grid Corporation of India Ltd.
Power and telecom
PSU Professional 55255.3 1105.1 474.2 0.9
71 Punjab National Bank
Banks and NBFCs
PSU Professional 43248.2* 865.0 37.6 0.1
72 Reliance Capital Ltd.
Banks and NBFCs
Promoter Professional 5891.1 117.8 117.8 2.0
73 Reliance Communications Ltd.
Power and telecom
Promoter Professional Loss NA 0.0 0.0
74 Reliance Industries Ltd.
Oil and gas Promoter Promoter 266480.0 5329.6 7605.8 2.9
75 Reliance Infrastructure Ltd.
Power and telecom
Promoter Professional 16595.7 356.8 253.5 1.5
76 Reliance Power Ltd.
Power and telecom
Promoter Professional 2937.6 58.7 58.7 2.0
77 Rural Electrification Corporation Ltd.
Banks and NBFCs
PSU Professional 51622.4 1032.5 460.4 0.9
78 Shriram Transport Finance Co. Ltd.
Banks and NBFCs
Promoter Professional 19076.3 381.5 69.2 0.4
79 Siemens Ltd. Capital goods MNC Professional 5277.0 105.5^ 0.0 0.0
80 State Bank of India
Banks and NBFCs
PSU Professional 122344.8* 2446.9 1158.0 0.9
81 Steel Authority of India Ltd.
Metals and mining
PSU Professional 39000.0 780.0 350.4 0.9
82 Sun Pharmaceutical Industries Ltd.
Pharmaceuticals Promoter Promoter Loss NA 46.7 -
83 Tata Chemicals Ltd
Agrochemicals Promoter Professional 5830.1 116.6 102.0 1.7
84 Tata Consultancy Services Ltd.
Information technology (IT)
Promoter Professional 142500.0 2850.0 2190.0 1.5
85 Tata Global Beverages Ltd.
Retail and FMCG Promoter Professional 1857.9 37.2 39.1 2.1
86 Tata Motors Ltd. Automobile Promoter Professional Loss NA 186.2 -
87 Tata Power Co. Ltd.
Power and telecom
Promoter Professional 14917.0 298.0 311.0 2.1
88 Tata Steel Ltd. Metals and mining
Promoter Professional 84128.2 1682.6 1714.6 2.0

Corporate Social Responsibility: Taking root
11 iias.in January 2016
Institutional
EYE
Sr. No.
Company name Sector Ownership
type Management
type
3-year average
profit Rs. mn
Prescribed spend Rs. mn
Actual CSR
spend Rs. mn
Actual spend as a %
of profit
89 Tech Mahindra Ltd.
Information technology (IT)
Promoter Professional 15440.0 308.8 505.0 3.3
90 Titan Co. Ltd. Retail and FMCG Promoter Promoter 9681.0 193.6 123.2 1.3
91 UltraTech Cement Ltd.
Cement Promoter Professional 30760.0 615.1 444.6 1.4
92 Union Bank of India
Banks and NBFCs
PSU Professional 18804.2* 376.1 132.5 0.7
93 Unitech Ltd. Infrastructure and real estate
Promoter Promoter 272.3 54.5 1.5 0.6
94 United Breweries Ltd.
Retail and FMCG Promoter Professional 2726.0 54.5 22.4 0.8
95 United Spirits Ltd.
Retail and FMCG Promoter Professional Loss NA 0.8 -
96 UPL Ltd. Agrochemicals Promoter Promoter 3463.0 69.3 106.2 3.1
97 Vedanta Ltd. Metals and mining
Promoter Professional Loss NA 255.0 -
98 Wipro Ltd. Information technology (IT)
Promoter Professional 64154.0 1283.0 1327.0 2.1
99 Yes Bank Ltd. Banks and NBFCs
Promoter Promoter 19013.5 380.2 157.1 0.8
100 Zee Entertainment Enterprises Ltd.
Others Promoter Promoter 9658.0 193.0 168.4 1.7
* These companies have not specified the 3-year average net profit figure in their CSR disclosures. IiAS has calculated the figure based on the preceding three years profit before tax data from CMIE prowess. ^ Eicher Motors maintains its accounting year from January to December and Siemens maintains its accounting year from October to September. The mandatory CSR requirement is applicable for the financial year starting after 1 April 2014. However, for its analysis IiAS has calculated their 3-year average profit and prescribed CSR spend.

Institutional
EYE
Disclaimer This document has been prepared by Institutional Investor Advisory Services India Limited (IiAS). The information contained herein is solely from publicly available data, but we do not represent that it is accurate or complete and it should not be relied on as such. IiAS shall not be in any way responsible for any loss or damage that may arise to any person from any inadvertent error in the information contained in this report. This document is provided for assistance only and is not intended to be and must not be taken as the basis for any voting or investment decision. The user assumes the entire risk of any use made of this information. Each recipient of this document should make such investigation as it deems necessary to arrive at an independent evaluation of the individual resolutions referred to in this document (including the merits and risks involved). The discussions or views expressed may not be suitable for all investors. The information given in this document is as of the date of this report and there can be no assurance that future results or events will be consistent with this information. This information is subject to change without any prior notice. IiAS reserves the right to make modifications and alterations to this statement as may be required from time to time. However, IiAS is under no obligation to update or keep the information current. Nevertheless, IiAS is committed to providing independent and transparent recommendation to its client and would be happy to provide any information in response to specific client queries. Neither IiAS nor any of its affiliates, group companies, directors, employees, agents or representatives shall be liable for any damages whether direct, indirect, special or consequential including lost revenue or lost profits that may arise from or in connection with the use of the information. The disclosures of interest statements incorporated in this document are provided solely to enhance the transparency and should not be treated as endorsement of the views expressed in the report.
Confidentiality This information is strictly confidential and is being furnished to you solely for your information. This information should not be reproduced or redistributed or passed on directly or indirectly in any form to any other person or published, copied, in whole or in part, for any purpose. This report is not directed or intended for distribution to, or use by, any person or entity who is a citizen or resident of or located in any locality, state, country or other jurisdiction, where such distribution, publication, availability or use would be contrary to law, regulation or which would subject IiAS to any registration or licensing requirements within such jurisdiction. The distribution of this document in certain jurisdictions may be restricted by law, and persons in whose possession this document comes, should inform themselves about and observe, any such restrictions. The information provided in these reports remains, unless otherwise stated, the copyright of IiAS. All layout, design, original artwork, concepts and other Intellectual Properties, remains the property and copyright of IiAS and may not be used in any form or for any purpose whatsoever by any party without the express written permission of the copyright holders.
IiAS Voting Policy IiAS' voting recommendations are based on a set of guiding principles, which incorporate the basic tenets of the legal framework along with the best practices followed by some of the better governed companies. These policies clearly list out the rationale and evaluation parameters which are taken into consideration while finalizing the recommendations. The detailed IiAS Voting Guidelines are available at www.iias.in/IiAS-voting-guidelines.aspx. The draft report prepared by the analyst is referred to an internal Review and Oversight Committee (ROC), which is responsible for ensuring consistency in voting recommendations, alignment of recommendations to the IiAS’ voting criteria and setting and maintaining quality standards of IiAS’ proxy reports. Details regarding the functioning and composition of the ROC committee are available at www.iias.in. In undertaking its activities, IiAS relies on information available in the public domain i.e. information that is available to public shareholders. However, in order to provide a more meaningful analysis, IiAS, generally seeks clarifications from the subject company. IiAS reserves the right to share the information provided by the subject company in its reports. Further details on IiAS policy on communication with subject companies are available at www.iias.in.
Analyst Certification The research analyst(s) for this report certify/ies that no part of his/her/their compensation was, is or will be, directly or indirectly related to specific recommendations or views expressed in this report. IiAS’ internal policies and control procedures governing the dealing and trading in securities by employees are available at www.iias.in.
Conflict Management IiAS and its research analysts may hold a nominal number of shares in companies IiAS covers (including the subject company), as on the date of this report. A list of IiAS’ shareholding in companies is available at www.iias.in. However, IiAS, the research analyst(s) responsible for this report, and their associates or relatives, do not have actual/beneficial ownership of one per cent or more securities of the subject company, at the end of the month immediately preceding the date of publication of this report. A list of shareholders of IiAS as of the date of this report is available at www.iias.in. However, the preparation of this report is monitored by an internal Review and Oversight Committee (ROC) of IiAS and is not subject to the control of any company to which such report may relate and which may be a shareholder of IiAS.

Institutional
EYE
Other Disclosures IiAS further confirms that, save as otherwise set out above or disclosed on IiAS’ website (www.iias.in): IiAS, the research analyst(s) responsible for this report, and their associates or relatives, do not have any financial interest in the
subject company. IiAS, the research analyst(s) responsible for this report, and their associates or relatives, do not have any other material conflict of
interest at the time of publication of this report. As a proxy advisory firm, IiAS provides subscription, databased and other related services to various Indian and international
customers (which could include the subject company). IiAS generally receives between INR 10,000 and INR 25,00,000 for such services from its customers. Other than compensation that it may have received for providing such services to the subject company in the ordinary course, none of IiAS, the research analyst(s) responsible for this report, and their associates or relatives, has received any compensation from the subject company or any third party for this report.
None of IiAS, the research analyst(s) responsible for this report, and their associates or relatives, has received any compensation from the subject company or any third party in the past 12 months in connection with the provision of services of products (including investment banking or merchant banking or brokerage services or any other products and services), or managed or co-managed public offering of securities of the subject company.
The research analyst(s) responsible for this report has not served as an officer, director or employee of the subject company. None of IiAS or the research analyst(s) responsible for this report has been engaged in market making activity for the subject company.

About IiAS Institutional Investor Advisory Services India Limited (IIAS) is a proxy advisory firm, dedicated to providing participants in the Indian market with independent opinion, research and data on corporate governance issues as well as voting recommendations on shareholder resolutions for over 600 companies. To know more about IIAS visit www.iias.in
Office Institutional Investor Advisory Services 15th Floor, West Wing, P J Tower, Dalal Street, Fort, Mumbai - 400 001 India Contact [email protected] T: +91 22 2272 1570-3 F: +91 22 22721574