orsero group management · pdf fileorsero group management presentation four seasons hotel,...
TRANSCRIPT

November 15, 2016
ORSERO GROUP Management Presentation Four Seasons Hotel, Milan

2
Disclaimer
This document (the Document) was prepared by Glenalta Food S.p.A. (Company) and GF Group S.p.A. only for the purposes of presenting the business combination proposal between the Company and the GF Group S.p.A. target company (the Transaction). The information contained herein may not be complete and exhaustive and no guarantee can be given as to its accuracy. This Document was drafted on the basis of data and information of the Company and/or GF Group and/or in the public domain, and on parameters and assumptions determined in good faith by the Company. However, these parameters and assumptions are not the only ones that could have been selected for the purpose of preparing this document, therefore the application of additional parameters and assumptions, or the existence of different market conditions, could lead, in good faith, to analyses and assessments that may differ, in whole or in part, from those contained herein. The information and/or the assessments contained herein have not been subjected to verification by independent experts, and are subject to changes and/or updates. The Company and GF Group S.p.A. undertake no duty to give prior or subsequent communication in the event that any such changes and additions may become necessary or appropriate. No information contained in this Document can or shall be considered a guarantee or an indication of future operating, financial and equity results of the Company, of GF Group S.p.A. and/or of the company resulting from the Transaction. Within the law, the Company, GF Group S.p.A. and their corporate officers, managers, employees, and consultants do not make any declaration or guarantee and do not take any obligation, either express or implied, or responsibility as to the accuracy, sufficiency, completeness and update of any information contained in the Document nor in respect of any errors, omissions, inaccuracies or negligence herein. This Document is provided merely for information and indicative purposes and does not constitute in any way a proposal to enter into any contract nor a public offering of financial products, nor advice or a recommendation to buy or sell any financial products. You are the exclusive addressee of this Document which as such cannot be delivered nor disclosed to any third parties nor reproduced, in whole or in part, without the prior authorization of the Company.

3
Agenda
• Why Orsero?
• Presentation of the Orsero Group
• Key success factors
• Key Financials
Transaction structure and timetable
View of the European market

4
Why Orsero?
• FOOD segment has seen steady growth
• Strong competitive advantage
• Significant consolidated position in 5 Mediterranean countries/second largest group in the AIM
• New, enthusiastic, competent and motivated management team
• Solid cash flow, no CAPEX, no technological innovation
• The Group has shown its strength and ability in getting out of a challenging situation
• Group’s attractive entry price
• Glenalta Food’s significant contribution of new capital, specific expertise in the food and financial fields combined with listing on the stock exchange make up the necessary ingredients to start on an already well-defined growth path

5
• Why Orsero?
• Presentation of the Orsero Group
• Key Strengths
• Key Financials
Transaction structure and timetable
View of the European Market
Agenda

6
SHORT OVERVIEW OF THE ORSERO GROUP
Overview of the Orsero Group – Who We Are
• Mediterranean Europe leader in the import and distribution of fruit and vegetables
• Great attention to product quality: in 2012 the brand F.lli Orsero® for bananas and pineapples was launched, it is synonymous with tradition and passion for high-end products
• Over half a million tons of fruit and vegetable product distributed, with a pro forma consolidated sales* of approximately € 617 million (total turnover of about 850 M€**) in 2015
• International presence, mainly in Italy, France, Spain, Portugal, Greece, Costa Rica, Colombia and Mexico
• More than 2,000 employees worldwide (including more than 1,000 people in Europe)
GROUP STRUCTURE, ACTIVITIES AND SEGMENTS IN WHICH THE GROUP OPERATES
• 3 integrated business divisions coordinated by the Holding parent company, 10 main società subsidiaries and 6 relevant 50%-owned Joint Ventures
Group Structure
Main activities
Clients and segments
• Fruit and Vegetable Products distributed to large-scale retail chains and traditional wholesalers
• Shipping services for third parties (other product importers and distributors) and forwarding agent
• Import and Distribution of fruit and vegetables
• Bananas and Pineapples Tropical division and own ships for transport
• Tropical Fruit Production (bananas and avocados)
* Pro forma financials include the effects of transactions preliminary to the Business Combination ** Proportionally consolidated revenues of the Group amounted to approx. €730 million, including the JVs portion attributable to the GF Group.

7
Main Areas of Activity
Production
The Group is active in three macro-areas
3 Import and Distribution
Bananas and Pineapples
Tropical division
2
5 countries
2 different SKUs
5 countries
~ 300 different SKUs
~ 500,000 tons Distributed every year
1
2 countries
2 different SKUs
~ 14 million boxes imported every year
~ 4,500 hectares of land of which 2,500 hectares currently in production
GR
IT FR PL ES
CR
PA
CO EC
DOM
MEX
CR

8
• Careful checks on product quality throughout the supply chain
Our Business
Sourcing
Import
Quality Control
Storage Ripening
Distribution
• 25 warehouses throughout Southern Europe for storage and control of fresh produce
5
20 centres across Southern Europe dedicated to the ripening of bananas
4
Personal long-term relationships and partnership with industry-
leading suppliers
Sales
6 3
2 7
1
Selection of the world’s best production areas to offer the best
produce
Wide spread daily distribution and
bespoke solutions for customers
Logistics efficiency also thanks to the our owned "Cala Rosse"
reefer fleet
Daily sales through distribution to large-scale
retail chains and traditional channels in different key
markets
Import and
distribution of perishable
fresh produce

9
Main Milestones from 1940 to Date
1940s
1970s
1990s
Beginning of our fruit distribution business in
Italy
Development of distribution and import of exotic fruits and counter season fruits
thanks to the launch of a new commercial partnership with
Del Monte
1980s
Beginning of our investment in banana production through the purchase of plantations in
Costa Rica and in the banana ripening and
distribution business in France
2000
2006
Investments in the distribution sector in Italy, Portugal and Greece and beginning of the shipping
business with the construction of the first "Cala Bianche" reefer
fleet
Expansion in Spain and Italy through the acquisition of stakes in
certain retail sector businesses.
2007
2013
2014
2015
Diversification into adjacent/third
businesses
Interruption of business relationship with Del Monte and launch of the “fratelli
Orsero” brand
The crisis
Refocusing on the Group’s core business and beginning of the
disinvestment policy.
In 2015, organisational review and management
reinforcement.

10
• Why Orsero?
• Presentation of the Orsero Group
• Key success factors
• Key Financials
Transaction structure and timetable
View of the European Market
Agenda

11
Factors behind our Success
LEADERSHIP POSITION FOR OVER 50 YEARS
• in the import and distribution of fruit and vegetables in Mediterranean Europe
WIDESPREAD PRESENCE IN THE INTERNATIONAL ARENA
LOGISTICS AND DISTRIBUTION EFFICIENCY BRAND REPUTATION
STRATEGIC VISION
• Global product sourcing
• Extensive domestic presence
• since 2012 the brand «Fratelli Orsero" has been synonymous with market excellence
• direct control over daily/weekly transportation of main products
• Wide product range and bespoke distribution capabilities
• traceability along the entire chain
FRESH PRODUCE KNOW HOW
• both commercially and organisationally

12
Turnover and Product Mix – Distribution BU
2015 TURNOVER
In 2015, the Group reported a total turnover of some €850 million, of which some €720 million from its distribution
core business in Southern Europe*
DISTRIBUTED PRODUCT FAMILIES
# 1
Each year, the Group markets 50 million product boxes containing over 300
different SKUs
Data in %
# 3 # 2 # 1
Bananas
Pineapples
Citrus fruits
Pears & Apples
Kiwis
Exotic fruits
Melons
Grapes
Vegetables
Other
* Total turnover, including 100% of the Orsero Group’s JVs, and excluding the companies belonging to the BU Production (Acapulco), BU Tropical division (Cosiarma, Simba) and BU other activities (Fresh produce, holding and subholding) Source: Orsero financial statements, management
Dati in M€ 720 337
148170
3520
Spain France Italy Total Greece Portugal
35
85 120
Share owned by the Orsero Group
312
85
600
347

13
Main Customers and Distributed Brands
BRANDS AND PRIVATE LABELS MAIN CUSTOMERS
The Group supplies all leading large-scale retail chains in Southern Europe
and is present in the main fruit and vegetable market stands of major
international players
In addition to its own brands, the Group is a leading distributor of main fruit and vegetable brands (and private labels)
in Europe
Distributed brands

14
Industrial Footprint and Distribution Channels
EUROPEAN DISTRIBUTION MAP MAIN PRODUCT ORIGINS
27 Fruit and vegetable market stands
35,000 Capacity of fruit and banana storage (pallets)
160,000 sqm of total working area
EUROPEAN DISTRIBUTION MIX
Data in %
49%
20%
55%39% 46%
51%
80%
45%61% 54%
Spain
100%
France
100%
Greece Italy
100% 100%
Portugal
100%
Supermarkets Wholesalers Data in %
25 Warehouses for product handling
20 Ripening centres in Europe
500,000+ Tons of products distributed each year
Overseas products
14%
Bananas and Pineapples
49%
Total
100%
25%
EU products
12%
Domestic products

15
Global Logistics Management
01
02
03
04
05
06
Distribution efficiency guaranteed by an extensive
network of Group subsidiaries and affiliates in Europe
Efficiency of distribution by sea guaranteed by 4 owned reefer
vessels engaged in weekly transportation services
Top-notch product quality guaranteed by ability to control
product temperature at all times including during shipment (by sea or
by land)
High quality and reliability of distribution to wholesalers and
large-scale retail chains guaranteed by widespread domestic presence, with
platforms specialized in fresh produce storage and handling
Bespoke customer service guaranteed by 360° product handling capabilities (i.e.
picking)
Strong orientation towards ever greater efficiency and
optimization of logistics/distribution
performance

16
"Cala Rossa" Service for the Import of Bananas and Pineapples
THE "CALA ROSSA" ROUTE
"CALA ROSSA" MAIN FEATURES
Rio Haina
Moin
Turbo
Central America
Europe
Tarragona
Vado Ligure
Lisbon
4 owned reefer vessels carrying produce of the Orsero Group (40-50% of the total) and of major international importers (50-60% of the total)
Storage (50% in the hold and 50% in reefer containers)
10,500 pallets
Average cruise speed of each cargo ship
22 knots
Total round trip (1 week ahead of the competition)
28 days Average time of unloading
(50% less than competitors)
<18 hours

17
Quality Control throughout the Supply Chain
SUPPLY CHAIN OF OVERSEAS PRODUCE
PLANTATION PORT OF
SHIPMENT REEFER CARGO
SHIP
PORT OF DISCHARGE
WAREHOUSE / MARKET
CUSTOMER
• Quality control in the boarding phase carried out by the owner as per the importer's details.
• Check of temperature adequacy during the boarding phase
• Daily quality controls of produce temperature, inside the hold or inside the containers
• Management of different temperatures according to:
- Organoleptic characteristics of produce (i.e. Banana 13.3° - 14.5°, pineapple 7/8°)
- "Behaviour" of produce during shipment
• Quality control during the unloading phase, carried out directly by the importer
• Measurement of:
- Temperature
- Pressure (which determines the product preservation)
- Brix (sugar content)
• Incoming Quality Control (temperature/pressure) to optimise produce rotation
• Outgoing Quality Control (compliance with customers’ requirements)
Quality control throughout the supply chain, utmost control of the cold chain and guaranteed traceability of the products for end customers

18
Reputation through Distribution of "Fratelli Orsero"-branded Products
“FRATELLI ORSERO” BRAND POTENTIAL AND DEVELOPMENT
• In 2012, after the termination of the business relationship with Del Monte (that had been in place since the early 1970s), the Group launched its own “Fratelli Orsero” brand
• The brand awareness has grown rapidly, from 27% in 2012 to 61% in 2014
• The brand has become an established name and showed excellent growth:
‣ in Europe, Orsero branded pineapples and bananas recorded average annual growth rates of over 20-25% between 2012 and 2015
• These results are even more evident at the Italian distribution level, including other categories of fruit (exotic, citrus fruits, etc.)
‣ The average annual growth rate between 2012 and 2015 of Orsero branded products has been 40% (~ 20% of total products sold - 45,000 tons)
• The excellent trend is being confirmed in 2016, in spite of the product availability issues at the product origin experienced in 2015

19
Strategic Vision
Internal Growth Operational efficiency Growth through acquisitions
• Consolidating Group's positioning in key markets
• Leveraging market leadership position in Italy
• Developing partnerships with local producers (at EU level)
• Assessing investment opportunities in other markets/ products
• Evolution of the logistics approach at European level
• Re-definition of business processes/procedures for harmonisation across the Group
• Targeted monitoring of performance of the distribution platforms
• Implementing a new integrated ERP system across the Group
• Market shares recovery
• Expansion in geographical areas throughout the country
• Further growth of the F.lli Orsero brand (fresh cut, exotic fruits, berries)
• Development of new business lines ('fresh cut' fruits, dried fruits)
• Identification and development of new sales channels (vending machines for Bananas, HORECA sector, etc.)
ACTION PLAN BASED ON CORE BUSINESS TO ACHIEVE

20
• Why Orsero?
• Presentation of the Orsero Group
• Key success factors
• Key Financials
• Transaction structure and timetable
• View of the European Market
Agenda

21
Key Financials – Evolution of Economic Indicators
Turnover
adjusted-EBITDA*
• Data shown in the charts are based on the Orsero Group’s pro forma consolidated financial statements reflecting the listing perimeter that reflect the effects of the transactions preliminary to the Business Combination
• The Orsero Group is recording significant growth of turnover and profitability (EBITDA and EBIT) at consolidated level
• The final pro forma data at June 30, 2016 consistently confirm this trend
Adjusted-EBIT*
* Note: adjusted-EBITDA and EBIT not include extraordinary items (i.e. extraordinary charges and income)

22
FY H1
P&L (M€) 2015 2016
Total sales 617,2 337,6
Other revenues 10,6 4,0
TOTAL REVENUES 627,8 341,6
Raw materials (428,2) (228,3)
Services (111,1) (58,8)
Use of thir party assets (14,9) (7,1)
Personnel (43,9) (22,4)
Change in raw materials 1,6 3,4
Other costs (3,8) (2,1)
Costs of goods sold (600) (315)
EBITDA adjusted 27,5 26,2
EBITDA % 4,4% 7,7%
Amortizations (17,6) (8,9)
Depreciations (3,4) (1,5)
EBIT adjusted 6,5 15,8
Financial items (4,8) (1,1)
Adjustments to financial operations 0,9 1,8
Extraordinary items 6,3 (3,0)
Net profit before tax 8,9 13,5
Taxes 7,1 (2,1)
Net profit 16,0 11,4
Key Financials – Pro forma Consolidated P&L
• Consolidated revenues for H1 2016 confirm the growth trend. These revenues do not include the portion of revenues relating to the 50% Italy-Spain JVs that are accounted by using the equity method
• Adjusted EBITDA does not include extraordinary items; in 2015 EBITDA was already aligned with industry 'best in class' globally. H1 2016 EBITDA is particularly positive due to the excellent performance of the 'Bananas and Pineapple Tropical Division BU’ and constant growth of the ‘Distribution BU’ in Italy, France and Portugal
• At adjusted-EBIT level, depreciation (mainly related to owned Ships, warehouse equipment and F.lli Orsero brand) shows consistency in H2 vs. H1, with the good performance of EBITDA in H1 (physiologically higher than in H2) creating an extremely positive effect on adjusted EBIT for the first six months of the year
• Net income had an excellent performance reflecting inter alia:
- reduced financial expenses in 2016 compared to 2015
- positive 2015 taxes due to the recognition of a “one-off tax assets/deferred tax assets”
Note: adjusted EBITDA and EBIT do not include extraordinary items (extraordinary charges and income) Note 2: Data shown in the table refer to the Group’s pro forma consolidated financial statements illustrative of the listing perimeter
23
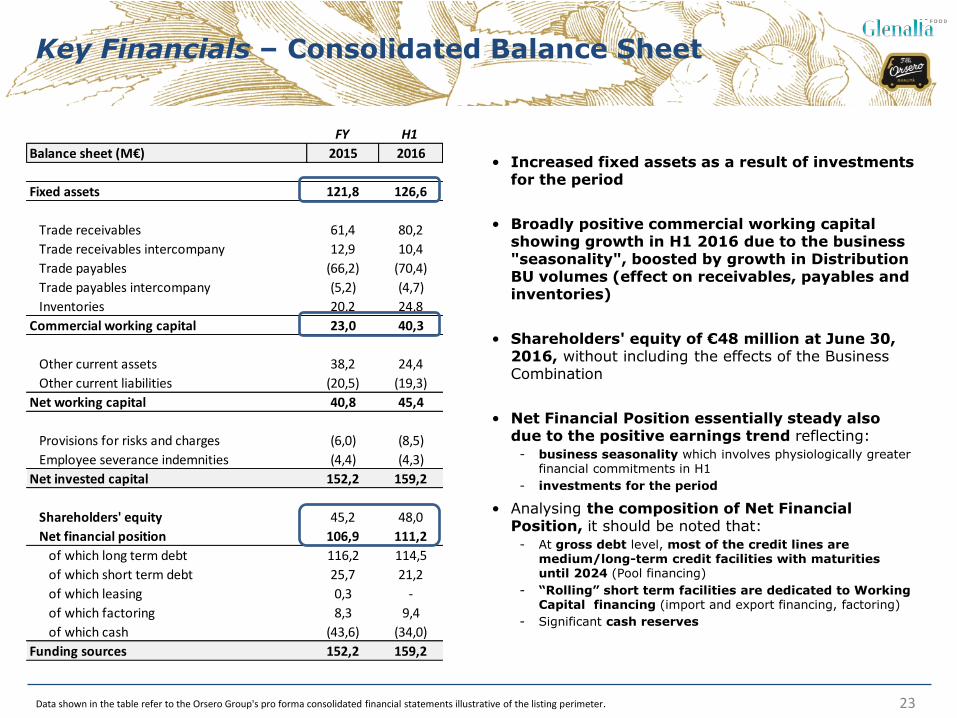
FY H1
Balance sheet (M€) 2015 2016
Fixed assets 121,8 126,6
Trade receivables 61,4 80,2
Trade receivables intercompany 12,9 10,4
Trade payables (66,2) (70,4)
Trade payables intercompany (5,2) (4,7)
Inventories 20,2 24,8
Commercial working capital 23,0 40,3
Other current assets 38,2 24,4
Other current liabilities (20,5) (19,3)
Net working capital 40,8 45,4
Provisions for risks and charges (6,0) (8,5)
Employee severance indemnities (4,4) (4,3)
Net invested capital 152,2 159,2
Shareholders' equity 45,2 48,0
Net financial position 106,9 111,2
of which long term debt 116,2 114,5
of which short term debt 25,7 21,2
of which leasing 0,3 -
of which factoring 8,3 9,4
of which cash (43,6) (34,0)
Funding sources 152,2 159,2
Key Financials – Consolidated Balance Sheet
• Increased fixed assets as a result of investments for the period
• Broadly positive commercial working capital showing growth in H1 2016 due to the business "seasonality", boosted by growth in Distribution BU volumes (effect on receivables, payables and inventories)
• Shareholders' equity of €48 million at June 30, 2016, without including the effects of the Business Combination
• Net Financial Position essentially steady also due to the positive earnings trend reflecting:
- business seasonality which involves physiologically greater financial commitments in H1
- investments for the period
• Analysing the composition of Net Financial Position, it should be noted that:
- At gross debt level, most of the credit lines are medium/long-term credit facilities with maturities until 2024 (Pool financing)
- “Rolling” short term facilities are dedicated to Working Capital financing (import and export financing, factoring)
- Significant cash reserves
Data shown in the table refer to the Orsero Group's pro forma consolidated financial statements illustrative of the listing perimeter.

24
• Why Orsero?
• Presentation of the Orsero Group
• Key success factors
• Key Financials
Transaction structure and timetable
View of the European Market
Agenda

25
Valuation at a glance
Valuation method:
Market multiples
EBITDA margin linear regression as "sanity check"
Equity Value: €80 m
Valuation method:
Net Asset Value
NAV of Glenalta(1): €80 m
(1) Assuming minimum withdrawal of shareholders

26
Benchmark with Market Peers
Source: Capital IQ – S&P, data updated at November 10, 2016
The table above shows a selected sample of listed companies operating in the same sector as the Target Company.
The average reported in the table shows an EV/EBITDA multiple equal to 10.32x for LTM data.
Fruits - Public Comps Set - Sorted by Market Cap
EUR millions except per share data, as of
November 10, 2016 Current % of 52 P/E EV/FCF
Company Price Week High Equity Enterprise LTM 2016E LTM 2016E LTM 2016E LTM 2016E LTM LTM
Fresh Del Monte Produce Inc. - NYSE € 56,33 92% € 2.918 € 3.047 € 3.590 € 3.691 € 299 € 321 0,85x 0,83x 10,21x 9,50x 22,77x 22,43x
Total Produce plc - ISE 1,69 94% 541 € 712 3.033 3.141 69 73 0,23x 0,23x 10,33x 9,73x 18,74x 14,25x
Fyffes plc - ISE 1,43 86% 469 € 569 1.075 1.176 55 64 0,53x 0,48x 10,42x 8,89x 14,10x 18,34x
MAX 0,85x 0,83x 10,42x 9,73x 22,77x 22,43x
AVERAGE 0,54x 0,51x 10,32x 9,37x 18,54x 18,34x
MEDIAN 0,53x 0,48x 10,33x 9,50x 18,74x 18,34x
MIN 0,23x 0,23x 10,21x 8,89x 14,10x 14,25x
EV/EBITDA
Valuation MultiplesStock Performance
Market Value Revenues EBITDA EV/REV

27
Comparison between Food Categories
Source: Capital IQ – S&P, data updated at November 10, 2016
• The aggregate share performance of the three main comparables operating in the Group reference sector compared to the last 24 months confirms the positive trend of the Fruits sector, recording +93,8%
• This is confirmed both compared to the market standard benchmark indexes (S&P + 2.2% and FTSE 100 + 0.6%) and compared to indexes constructed with reference to the main listed companies in the Meat & Food Package sector (-9.6%) and to those in the Confectionery sector (+13.2%)
Comparables
Fruits:
+93,8%
FTSE 100
Index: +0,6%
Confectionery:
+13,2%
S&P 500:
+2,2%
Meat & Pack.
Food: -9,6% -40%
-20%
0%
20%
40%
60%
80%
100%
120%
10 n
ov 1
4
10 d
ic 1
4
10 g
en 1
5
10 feb 1
5
10 m
ar
15
10 a
pr
15
10 m
ag 1
5
10 g
iu 1
5
10 lug 1
5
10 a
go 1
5
10 s
et 15
10 o
tt 1
5
10 n
ov 1
5
10 d
ic 1
5
10 g
en 1
6
10 feb 1
6
10 m
ar
16
10 a
pr
16
10 m
ag 1
6
10 g
iu 1
6
10 lug 1
6
10 a
go 1
6
10 s
et 16
10 o
tt 1
6
10 n
ov 1
6
Fruits 93.8% Meat & Package Food -9.6% Confectionery 13.2% S&P 500 2.2% FTSE 100 Index 0.6%

28
Structure of the Transaction
Transaction structure
• The share exchange ratio was set at 43 newly issued ordinary shares of Glenalta for each 50 ordinary shares held by GF Group
• The Transaction will be implemented through the merger of GF Group into Glenalta
Equity Value of the GF Group: €80 million
Use of Glenalta resources
Lock-up Agreement
• The shareholders of GF Group will commit to locking up ordinary shares held by them for 36 months from the effective date of the Merger
• The Glenalta Promoters have committed to locking up ordinary shares for 18 months from the effective date of the Merger
Governance
• Up to €80.0 million which will be used as follows:
- €25 million for purchases of equity linked instruments
- up to €55 million cash contribution resulting from the merger for acquisitions and investments
• The Board of Directors of the Combined Entity will be composed by 7 members, of which: - 5 members appointed by the GF Group shareholders, of wich 2 independent
members
- 2 members, namely Mr Luca Giacometti and Mr Gino Lugli, appointed by Glenalta

29
Shareholdings upon the Business Combination M
inim
um
wit
hd
raw
als
%
% of the voting rights (1)
Max w
ith
draw
als
%
(1) The given percentages (i) take into account of the conversion of the first tranche of Glenalta special shares (equal to 50,000 special shares) into ordinary shares (equal to 300,000 ordinary shares) that in accordance with the Articles of Association of Glenalta will take place on the seventh trading day following the effective date of the Transaction and (ii) exclude the possible dilution resulting from the exercise of outstanding Glenalta warrants. (2) Figures were calculated using the same assumptions under (i), (ii) referred to in footnote (1), also assuming a first market price of the Combined Entity shares of €10.00 per share.
Market Cap(2): € 138,5 m Market Cap(2): € 114,5 m
FIF Holding
40,4%
Mercato
57,4%
Spac Promoters
2,2%
FIF Holding
48,7%
Mercato
48,7%
Spac Promoters
2,6%
Market
Market

30
• Why Orsero?
• Presentation of the Orsero Group
• Key success factors
• Key Financials
Transaction structure and timetable
View of the European Market
Agenda

31
In Europe, in the Coming Years
PEOPLE WILL CONSUME LESS
PEOPLE WILL CONSUME DIFFERENTLY

32
Five Interconnected Macro Social Phenomena
• IMPOVERISHMENT (consuming less and more selectively)
• AGEING (increase in average life expectancy)
• ATTENTION TO HEALTH (shift from the cure of diseases to health and wellbeing)
• ENVIRONMENTAL AWARENESS (perception of a world collapsing)
• TIMES AND WAYS OF EATING (eating at different times and in different ways)

33
Fruit: from occasionally eaten at the end of a meal to a daily food basis
• INCREASE IN CONSUMPTION FREQUENCY (fruit is healthy)
• INCREASE IN CONSUMPTION TIMES (breakfast, between meals)
• INCREASE IN CONSUMPTION OCCASIONS (snacks, ready meals)
• INCREASE IN CONSUMPTION PLACES (out of home, appetizers)

34
Who will take advantage of this great opportunity?
• BUSINESS SIZE AND GLOBAL MARKET COVERAGE
• EXPERTISE IN FRESH PRODUCE, WITH SHORT SHELF LIFE
• CONSOLIDATED INTERNATIONAL RELATIONSHIP NETWORK
• SUPPLIER CONFIDENCE
• CUSTOMER CONFIDENCE
• ABILITY TO EXPRESS LEADERSHIP THROUGH A GLOBAL BRAND
• CONSUMER CONFIDENCE IN THE BRAND

35
Special thanks
• Banca Aletti - NOMAD (Francesco Pili, Gianlorenzo Gatti, Matteo Sacco)
• Business Support (Andrea Silvello, Roberto Di Lauro, Mattia Vene, Andrea Stretti)
• AON (Massimo Germani, Emma Zolezi)
• CFO SIM (Filippo Maria Palmarini, Luca Di Liddo)
• CloseToMedia (Elisabetta Neuhoff, Luca Manzato)
• Deloitte (Santo Rizzo, Giovanna Rebolino, Angela Canepa)
• Kaleidos Finance (Lorenzo Bachschmid, Dario Di Iorio)
• KPMG (Paola Maiorana, Massimiliano Battaglia, Luca De Caprio)
• Long Term Partners (Marco Costaguta, Vincenzo Santelia, Lorenzo Colombo)
• PriceWaterHouse Coopers (Elena Cogliati, Fabrizio Cigliese, Giovanni Poggio, Aida Di Spiezio, Gabriele Ravanelli)
• Studio BonelliErede (Vittorio Lupoli, Fabio Macri)
• Studio Gatti Pavesi Bianchi (Stefano Valerio, Franco Barucci, Vanessa Sobrero, Jacopo Zingoni, Dario
Prestamburgo)
• Studio STS Deloitte (Fabrizio Cavalli, Roberto Famà)
• Studio Giliberti Triscornia (Federico Fisher)
• Studio Lombardi Molinari Segni (Federico Vermicelli, Alberto Recchia)
• Studio Ludovici (Paolo Ludovici, Michele Aprile)
• Studio Munari Giudici Maniglio (Francesco Munari, Paolo Giudici, Paolo Terrile, Matteo Bet)


37
Annexes
• Company Structure and Scope of Transaction
• Management Team

38
JV income
Company Structure and Listing perimeter
ORSERO SPA
BU - Production BU - Distribution BU – Bananas and Pineapple Tropical
Division
GF Group Glenalta Food
Other Activities
COSIARMA
Fruttital
AZ France
SIMBA
SIMBA Costa Rica
SIMBA Colombia
COSIARMA Costa Rica
ACORSA (Costa Rica)
Acapulco / PAJ (Mexico)
MONO AZUL (Argentina)
Eurofrutas
Nuova Banfrutta
Bella Frutta
Hermanos Fernandes (50%)
Fruttital Firenze (50%)
Fresco Agency
Fruport (50%)
GF Servizi
K Air / K Fleet
Galandi (50%)
Company not included in the
perimeter /under spin off
Note: This slide is illustrative as the simplified company structure shows only the main operating subsidiaries/associates of the GF Group.
~50M€
~20M€
~170M€

39
Management Team - GF Group
Manager Function/ Company
Professional Background
Raffaella Orsero
Paolo Prudenziati
Matteo Colombini
Tommaso Cotto
Daniele Gazzano
President of GF Group Spa since 2013. Born in Savona (Italy) on 1966, after graduating in law, in 1993 she began her career in Simba SpA, a GF Group subsidiary and appointed CEO thereof in 2002. From 2003 to 2007 she also served as CEO of Reefer Terminal S.p.A. In September 2013 she was appointed Group CEO, a position she held until July 2015.
Born in Milan (Italy) on 1956. After graduating in Agricultural Sciences, in 1981 he began his career at Cargill. In 1989, he joined Chiquita Brands International with various management responsibilities at international level, to then become Senior Vice President Trading and Emerging Markets and CEO of Chiquita Italia. He joined the Group in 2016 and was appointed CEO.
Born in Bologna (Italy) on 1983. After graduating in Law and Business Administration and obtaining a Master’s Degree in General Management from Milan Bocconi University, he started out his career at Bank of Ireland, then in 2008 he joined Bain & Company Italy Inc. where he remained until 2015 when he joined GF Group SpA as Group Chief Financial Officer.
Born in Biella (Italy) in 1986. He holds a degree in Industrial Engineering from Italy’s Turin Polytechnic and a degree in Business Administration from ESCP-Europe. He began his career at Bain & Company Italy Inc. in 2010 as a consultant. He joined GF Group Spa in November 2015 as Chief Operating Officer.
Born in Alassio (SV, Italy) on 1958. He holds a degree in Economics, is a chartered accountant and is registered with the Register of Auditors. Mr Gazzano began his professional career in 1984 at the company Olivetti. He joined GF Group in 1991 as Managing Director of Fruttital Srl and in 1998 he was appointed Managing Director of the parent company. He sits on several Boards of Directors of subsidiaries of the Group.
Alessandro Piccardo
Born in Albenga (SV, Italy) on 1964. He holds a degree in History, and joined GF Group Spa in 1998 as assistant to the Sales Director of the Reefer Terminal Spa. From 2007 to 2015 he served as Chairman and CEO. He sits on the Boards of Directors of several companies of GF Group, and since 2014 he has been Group HR & External Relations Manager.
Vice president, MD
and CEO
President, MD and
CCO
MD and CFO
COO
General Counsel
HR and external
relationships

40
The Management Team – Main subsidiaries
Manager Function/ Company
Professional Background
Philippe Pons
João Mendes
AZ France
Eurofrutas
Chairman of AZ France SA, born in Algiers (Algeria) on 1958, he holds a degree in Agricultural Sciences. Mr Pons began his career in 1983 in Pomona SA, a company that is the market leader in France in fruit and vegetable trade. He joined the AZ Group in 1989, in 1997 he became sales director and in 2000 he was appointed General Manager.
Born in Setubal (Portugal) on 1961. Bachelor of Administration at the Stonehill College, Massachusetts, in 1984. After several experiences in some companies of the sector, in 2006 became MD of Chiquita Portugal, in 2012 was appointed Deputy Managing Director of Bargosa Fruit Company. In 2015 joined the Group as CEO of the company Eurofrutas Lda.
Manlio Ginocchio
Luca Tarabella
Cosiarma
Bella Frutta
Born in Camogli (GE, Italy) on 1967. After finishing high-school (Scientific Lycee), at a young age he started his career in the Reefer Container Maintenance & Repair sector. He joined the Group in 1997 as Container Division Manager at Costa Container Lines SpA. In 2014 he was appointed CEO of Cosiarma Spa.
Born in Mesagne (BR, Italy) on 1971. He holds a degree in Economics. After various experiences as Export Sales Manager in food companies, he joined the Group as sales director of Bella Frutta SA and appointed CEO thereof in 2012.
Calogero Canalella
Fruttital/ Simba
Born in Alassio (SV, Italy) on 1971. Soon after graduating in Economics, he joined the Group in the administration and finance department of the company Simba S.p.A., then he moved to the sales department where he held positions of increasing responsibility up to becoming CEO in 2012. Since 2013 he has also been a member of the Board of Directors of the company Fruttital Srl where he serves as sales director.
41
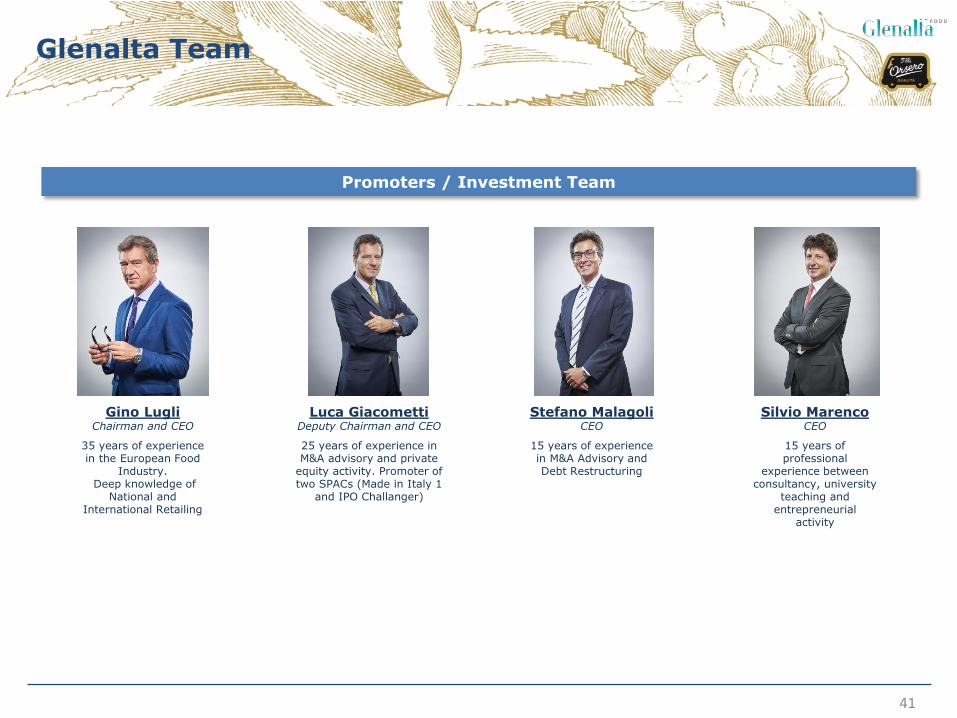
Glenalta Team
Gino Lugli Chairman and CEO
35 years of experience in the European Food
Industry. Deep knowledge of
National and International Retailing
Promoters / Investment Team
Luca Giacometti Deputy Chairman and CEO
25 years of experience in M&A advisory and private
equity activity. Promoter of two SPACs (Made in Italy 1
and IPO Challanger)
Stefano Malagoli CEO
15 years of experience in M&A Advisory and Debt Restructuring
Silvio Marenco CEO
15 years of professional
experience between consultancy, university
teaching and entrepreneurial
activity
