os artigos de investigação do centro de estudos de gestão
TRANSCRIPT

1
Os artigos de investigação do Centro de Estudos de Gestão do Instituto Superior Técnico (CEG-IST) destinam-se a divulgar os resultados da investigação realizada pelos seus membros. The working papers of the Centre of Management Studies of IST (CEG-IST) are aimed at making known the results of research undertaken by its members. Pedidos de informação sobre estes artigos, ou relativos a investigação feita pelo Centro devem ser enviados para: Enquiries about this series, or concerning research undertaken within the Centre should be sent to: Coordenador do CEG-IST Instituto Superior Técnico Av. Rovisco Pais, 1049-001 Lisboa Portugal e-mail: [email protected]
Artigo de Investigação / Working Paper
ISSN 1646-2955
Nº 7/2007
Organizing hospitals into networks: An hierarchical and multiproduct model with
application to the Portuguese health system
A. Mestre, M. D. Oliveira, A. Barbosa-Póvoa

2
Organizing hospitals into networks: An hierarchical and multiproduct model with application to the Portuguese health system
Ana Mestre*1, Mónica D. Oliveira*†, Ana Barbosa-Póvoa*
* Centre of Management Studies of Instituto Superior Técnico, Technical University of
Lisbon, Av. Rovisco Pais, 1049-001 Lisbon, Portugal † Operational Research Group, London School of Economics and Political Science,
Houghton Street, WC2A 2AE London, United Kingdom 1 Corresponding author: [email protected].
ABSTRACT Health care planners in countries with a system based on a National Health Service have
to make decisions upon where to locate and how to organize hospital services, so as to
pursue geographic equity and efficiency in the delivery of health care. Previous methods
for analysing hospital networks have not always adequately taken into account the
hierarchical and multiproduct nature of hospital networks. This study develops a
hierarchical multiproduct mathematical programming model to define location and
supply of hospital services that maximizes patients’ accessibility to hospitals. The
model: a) considers inpatient care, external consultations and emergency care as
hospital products; b) departs from a two-tiered hospital hierarchical system; c) and
allows for two way referrals of patients between hospitals at different levels of the
network. A mixed integer and linear program (MILP) formulation is developed, which
is implemented in the generic algebraic modelling system, GAMS and solved through
the use of a commercial Branch and Bound solver (CPLEX). As main results, it is
obtained crucial information for planning, such as referral networks, hospital
catchment’s areas, and the structure of hospital supply. The model is applied to a case
study of the Portuguese NHS that includes the Lisbon and Tagus Valley, Alentejo and
Algarve Administrative Health Regions. Due to the complexity of the problem, a
solution strategy involving a multi-stage solution decision is used. The model appears as
highly demanding in terms of data available and calibration of parameters, but the

3
results are robust and indicate which changes could potentially improve the current
hospital network.
Subject areas: decision analysis, health care, hospital networks, planning systems,
supply chain.
INTRODUCTION Health care systems in most countries attempt to maximize populations’ health, equity,
efficiency and quality, while minimizing health care spending. In order to pursue these
objectives, and to plan resources, health care systems based on a National Health
Service (NHS) require information to support the following decisions: where to locate
hospitals so as to pursue equity in access to patients? Which is the optimal structure of
hospital production that minimizes costs of delivering health care? How to define
referral networks between hospitals? How to define hospital catchment’s populations?
How to organize a rational network of services?
In the decision of locating hospitals and organizing hospital networks, there are well-
known trade-offs in literature with respect to pursuing some of the above objectives,
such as between equity, and efficiency and costs. For example, increasing geographic
equity in access might imply building small hospitals close to populations, which
translates into inefficiencies in scale and into higher costs. On the other hand, the high
cost of some medical equipment and low availability of high skilled human resources
(such as specialized doctors) might imply that supply of services is delivered to large
populations, which might have a negative impact in geographic equity of access.
Available published studies on hospital location have addressed these issues and have
shown different approaches. The main methods used are spatial interaction models,
entropy models, simulation and mathematical programming models (Ballou, 2004;
Oliveira and Bevan, 2006), being the last one the most common. Mathematical
programming involves the optimization of an objective function that represents the
purpose of the model, subject to a set of constraints that reflect the characteristics of the
system. The advantages of this approach are the flexibility of the objective function that
can portray diverse objectives; the possibility of defining multiple objectives; the
modelling of different problem characteristics and the recover of additionally
information making use of extra constraints; and the possibility of providing a global
4
solution (Oliveira and Bevan, 2006). These advantages overlap the computational
difficulties observed when these models are applied to real problems.
The health system, like many others, for instance the education system, the postal
services and the bank services, etc are organized in an hierarchical structure with
various levels of supply that provide different services. In these cases the planner has to
decide upon where to locate the facilities of each level while taking into account
potential interactions between them. The facilities can be classified as successively
inclusive, where the higher levels offer all the lower levels services additionally to
theirs, and successively exclusive, when the facility only ensure their level services
(Narula, 1986).
The hierarchical models can be classified in two large sets: the p-median models and the
covering models. For the first, the objective is to minimize the total travel distance to
reach the facilities, aiming at maximizing the patients’ accessibility to services. In the
covering models, it is established a standard distance that can’t be exceeded. In this
way, equal opportunity of access is promoted among the population; these models
impose a more rigid structure, and can be infeasible for areas with small populations
and low accessibilities. In the health sector these models are more adequate for
analysing emergency care. In the present study we choose the mini-sum type (being a p-
median type of model) because it allows for modelling equity of access and efficiency
issues.
Within our knowledge, the first location model applied to the health system belongs to
Gould and Lienbach (Rahman and Smith, 2000) who, in 1966, developed a p-median
model and applied it to the health system of Guatemala. Since then, many other authors
had been involved with this area. Rahman and Smith (Rahman and Smith, 2000) present
a complete survey where they alert for the computational difficulties associated with
this type of models and emphasise the frequent use of heuristic methods to surpass
them.
The first hierarchical model analysed in the scope of this work belongs to Calvo and
Marks and was developed in 1973 (Narula, 1986). The authors considered that patients
could be separated in three groups according to their needs for different services. The
model was formulated in linear programming and solved by Weaver and Church
(Narula, 1986) using a heuristic procedure. Narula and Ogbu (Narula, 1986) tried to
improve this model by adding questions related to the patients’ rules for using different
services. They have assumed that patients did not know the type of care they needed, so

5
there would be a proportion of patients transferred to higher levels in order to receive
specialised care. Up to our knowledge, this was a first attempt to capture the rules of a
gatekeeping system.
Morre and ReVelle (Morre and ReVelle, 1982) considered the health care system
characteristics by using a covering model applied to the Honduras’ health system. The
authors included different covering distances for patients attending the various types of
health care units assuming that populations are attended in a higher level unit even if
this implies a longer journey.
Recently, Galvão et al. (2002) have applied a three-level hierarchical model for the
delivery of perinatal care in the municipality of Rio de Janeiro. They classified general
patients, mothers and babies into three categories of risk and considered three main
types of facilities that cooperate in a successively inclusive hierarchy. The model was
formulated as a mixed integer linear programming where the continuous variables
established the flows and the dummy ones indicate the most favourable location for the
different type of facilities. In order to solve the model, four types of relaxations and
heuristics were developed and compared. We dedicate special attention to the second
type, due to its importance to this study. It was named as the “3 p-median” heuristic that
consists in the sequentially location of the level 1 facilities, then the level 2 and finally
the level 3. This procedure is only possible because the number of facilities is
predefined as an input to the location of level 2 and level 3 facilities. After the location,
a vertex substitution is done (that is, one location is substituted by another) in an
iterative procedure that allows the exploitation of other locations and different
configurations of the network.
In Portugal, there have been few location studies. We mention the work of Oliveira and
Bevan (2006) that analysed the redistribution of the current hospital supply through the
definition and comparison of three alternative models. The three models have used
different objective functions representing alternative definitions of equity of access and
utilization, and different constraints representing different institutional characteristics of
the system and alternative assumptions on the behaviour of patients when using hospital
services. These models captured the different roles of higher and lower level hospitals
indirectly through the use of constraints on a proportion of patients accessing central
hospitals or through a higher capacity of central hospitals to attract patients.
Nonetheless, none of these models accounts explicitly for the administrative hierarchy
of hospitals or for the flows of patients between hospitals.

6
Within our knowledge, and until now, hospitals have always been taken as single
product facilities, with inpatient care being the main service, and hospital flows having
only considered ascendant ways in the hierarchy. For many countries (including
Portugal) it is crucial to develop models to inform the creation of hospital networks that
consider the multiproduct nature of hospital facilities, as well as ascendant and
descendent flows. In the Portuguese reality, the importance of these unconsidered
aspects is raising. In Portugal, the emergency care is currently being reorganized so as
to adequately consider population density and accessibility criteria, and there is an
increasing recognition of the importance of the network of emergency services in
improving efficiency in the system (Health Ministry, 2007). A new network of long-
term care for patients that have already been treated, and require care from tertiary
hospitals or from hospitals at a lower level of the network is also being developed
(Health Ministry, 2003a). Finally, there have been several redesigns of the referral
networks between district and central hospitals for emergency services and other
medical specialties.
The aim of this study is to develop a decision support tool that addresses these
modelling issues: the multiproduct structure of hospital production, the articulation
between different services and units, and ascendant and descendent flows of patients in
the hierarchy.
We propose a multiproduct and hierarchical optimization model that particularly
informs the question: where to locate and how to organize hospital networks, so as to
maximize equity in access while accounting for some efficiency issues. The model
considers the institutional context of a health system based on a NHS that plans public
hospital supply.
The model is generic and might be adapted to health systems with different
characteristics. Its application to the Portuguese health care system is studied along this
paper. Due to the problem complexity a solution strategy is developed. This is
characterized by a two stage approach. In a first stage the multiproduct model is solved
for a single product. The results of this stage define the network structure that is taken
as fixed at the second stage of the solution where the multiproduct model is then solved.
The results of the real case-study are analysed and a discussion on the usefulness of the
model for health care decision makers is made.
In this paper, we start by briefly describing background information of the Portuguese
health care system (common to the health system of many other countries) which is

7
required to develop the optimization model. Secondly, we present and characterize the
multiproduct hierarchical model that we have developed. Thirdly, we apply the model to
the Portuguese health care system and discuss results. Within this section the adopted
solution strategy is characterized. Finally we present concluding remarks.
HEALTH SYSTEM BACKGROUND INFORMATION The Portuguese health care system is based on a NHS structure, funded by public
taxation and with nearly free access in the point of use and universal coverage. A key
objective of the political system is to achieve equality among the citizens on the access
to health care, despite their economic condition or geographic distribution, and also to
guarantee the equity in the distribution of health care resources (Health Ministry, 1990).
The supply of health care services is dominated by a set of public providers that should
cooperate in an integrated network in order to take advantage of existing synergies and
benefit from economies of scale. Key health care providers include primary care centers
and hospitals that are the subject of the developed models.
The public hospital system operates in practice as a centralised system with a
hierarchical nature. Hospitals activity includes the diagnosis, treatment and
rehabilitation, and the hospital system is organized in four administrative types of
hospitals (from lower to higher technological complexity, from small to large catchment
populations, and from basic to specialized care): level one, district, specialized and
central hospitals. Level one hospitals are small units mainly located in smaller cities and
offer basic services. District hospitals include small and medium hospitals located in
larger cities and that offer more specialties. Specialized hospitals offer specific
specialties, are located in three urban centres (Lisbon, Coimbra and Porto) and have
large catchment populations. Central hospitals are located also in those urban centres
and provide both basic services to local populations and specialized care to large
catchment areas. Consequently level one and district hospitals refer patients to central
and specialized hospitals.
Hospitals provide three main types of services: external consultations, emergency care
and inpatient care. Access to hospital services depends upon referral from primary care
centres or emergency care, as a gatekeeping system applies. Access to external
consultations also requires a register and making an appointment. Emergency care is
intended for situations of a sudden risk of collapse of one or more of the body vital
8
functions (Health Ministry, 2006). As mentioned earlier, this service is a key entry in
the system, and available evidence points for excessive and inadequate use in Portugal
(Health Ministry, 2001). This is partly explained by a quicker access to medical exams
and to consultations through emergency care and by inadequacies in the delivery of
primary care. Inpatient care is essentially a hospital service (yet there are primary care
centres with a small number of beds) and occurs when the patient needs to stay in the
hospital for more them 24 hours. Hospital admission occurs after a patient has accessed
primary care, emergency care or external consultations. Portuguese hospitals thus
integrate a hierarchical network that cooperates in a gatekeeping system where the use
of a higher level only is possible when there is a need for more specialised care. The
inadequate use of emergency care creates organizational problems and inefficiencies in
the system.
For most countries based on a NHS structure, there are two main levels in the hospital
hierarchy: central hospitals and smaller scale hospitals (we name them district
hospitals). Assuming this simplification, the hierarchical relationships and flows in
hospital systems may be generally represented as in Figure 1. This representation is the
underlying basis for the hierarchical and multiproduct model presented in the next
section.
Insert Figure 1 here
One should note that this representation of the hospital system makes use of a key
assumption: patients are represented as entering the hospital system directly, when they
are referred in fact from primary care centres. This assumption is consistent also with
the model application below in which population need is converted into expected
utilization for hospital services. Figure 1 does not include all the possible flows between
hospitals and services, but the most relevant ones, for which it is expected to exist
available data in the Portuguese application (these flows could be slightly different for
using the model in other countries).
When interpreting Figure 1, population from a certain population area needs to use three
types of hospital services, provided in two levels of hospitals. The relation between
levels of hospitals and types of services is as follows:
• D services: these are basic hospital services provided in District Hospitals (DH),
and also provided in Central Hospitals (CH);

9
• C services: these are higher technology and specialized (including some high
cost) services that are only provided in CH.
When a patient enters the hospital system, he has a predefined probability to be referred
to another service within the hospital and/or to another hospital service (the other cases
in which patients leave the system are not explicitly drawn in Figure 1). One should
note that this representation considers: two way flows for inpatient care (ascendant and
descendent flows between DH and CH) and multiple flows (for example, after
emergency care in a DH, a patient might be admitted to inpatient care in the DH or to be
referred to inpatient care in a CH).
DEVELOPMENT OF HIERARCHICAL MODELS In this section we develop a multiproduct hierarchical mathematical programming
model, which defines the optimal hospital network for a decision maker who wants to
maximize patients’ access to hospital services, while taking into account the population
needs, the characteristics of the hospital system, and efficiency issues. The model is
formulated as a mixed integer linear programming (MILP) model, where the decision
variables are associated to the locations of the hospitals and the continuous variables are
related to the flows of patients within the network.
We use a p-median type of model with an objective function that minimizes the total
travel time for patients to use hospital services, and considers two hierarchical levels –
central and district hospitals. The model defines as outputs the location and the structure
of hospital production, with hospital production being disaggregated by service and by
the population point that makes use of these services. The mathematical programming
model structure and constraints capture the institutional characteristics of the system,
such as the hierarchical levels of hospitals, the referral system between hospitals, and
the flows between different hospital products; and the indirect but critical role of
efficiency and cost issues, through the introduction of capacity constraints for different
types of hospitals. The use of capacity constraints takes into account normative
information from health care planners that provide indicative values of hospitals’
minimum and maximum capacities; and evidence from literature that very large and
very small hospitals are under diseconomies of scale, which translate into higher
hospital costs (McGuire and Hugues, 2002).

10
The characteristics of the multiproduct hierarchical model can be summarised as
follows –the model:
• Considers two levels in the hospital hierarchy: larger central hospitals and
smaller district hospitals;
• Has a multiproduct flow structure where at least three products can be identified
by the indexes: (1) inpatient care, (2) emergency care, and (3) external
consultations;
• Considers two types of services: C type services and D type services in a
successively inclusive hierarchy where C level services can only be provided in
a central hospital while D level services can be provided in a district or in a
central hospital;
• Considers as objective function the minimization of the total time for patients to
access all hospital services. This objective function embodies a narrow
definition of equity, as it tends to penalize patients from rural areas with low
population density;
• Produces as outputs: the location of hospitals; the level and structure of hospital
production; the ‘optimal’ referral between population points and hospital points,
and between hospitals at different levels of the network; and hospital
catchment’s population areas for each service provided by each hospital;
• Makes use of information on patients’ need for hospital services by converting
population numbers into expected utilisation measures (in accordance to need
indicators such as age and sex and geographic location), and utilisation measures
into hospital capacity measures such as beds (in the case of inpatient care,
through the use of the length of stay);
• Should be used with information on population points and potential hospital
location points at the small area level.
We consider the following types of products and hospitals: central hospitals that provide
level C and D services, and district hospitals that provide only level D services.
Depending upon the size and range of products supplied, a hospital might be classified
as district or central. In terms of demand there is a proportion (θ) of patients arriving at
district hospitals that require level C services, and consequently will be referred to a
central hospital. The model captures the relationship between services by decomposing
the type of service flows, and by explicitly modeling both ascendant and descendent

11
flows of services between different levels of the hierarchy. Depending on the structure
of the health system, some of these ascendant and descendent flows might assume the
zero value. In general terms, there might be flows within and between hospitals, and
between products.
The model uses as basic notation: i stands for population demand point ( i I∈ ); j and k
stand for potential hospital locations ( ,j k J∈ ); w, v and a stand for hospital services.
The following set of parameters and variables were defined:
• 1ijd : travel time from population point i to hospital j (e.g. minutes);
• 2 jkd : travel time from district hospital j to central hospital k;
• wiutl : population need from population point i for hospital service w;
• wvperDC : share of demand transferred from service w in a district hospital to
service v in a central hospital;
• wperCD : share of demand for service w transferred from central to district
hospital;
• wvpertrans : share of demand transferred from service w to v in the same hospital
(defined as a percentage);
• α: factor that differentiates travel times for patients that have already attended an
hospital service;
• wavt : average time spent in service w (relevant only for inpatient care);
• max wcap DH , min wcap DH , max wcap CH and min wcap CH : Maximum and
minimum capacities allowed for district and central hospitals respectively for
service w.
In terms of location and flow variables, the model computes:
• the number of district hospitals that are located in j and provide service w ( wjX )
and similarly the number of central hospitals located in j ( wjY );
• the flows of patients between population points and hospitals, with wijfd as the
flow for service w between demand point i and district hospitals in j, and wijfc as
the flow of patients for service w from demand point i and central hospitals in j;
• the flows of patients of service w between district and central hospitals, with wvjkzdc as the flow of service w that is transferred (or referred) from a district
12
hospital j to central hospital k, and wkjzcd as the flow of patients for service w
that is transferred (or referred) from central hospital k to district hospital j;
• the flows within hospitals, with wvjtd as the flow from service w to service v
within district hospital j, and wvktc as the flow from service w to service v within
central hospital j;
• and the hospitals capacity though the variables _ wjcap X and _ w
kcap Y that
stand for district and central hospitals capacity, respectively.
The location variables and the flow variables are defined in a range for ensuring
integrality and nonnegativity (i.e., _ wjcap X , and _ w
kcap Y ). Integer variables are
chosen for the location, instead of the dummy ones, because they allow for locating
more them one hospital in a single population point, a feature that is crucial for locating
hospitals in high density areas.
Most of the variables are schematically represented in Figure 2. The Mixed Integer
Linear Programming model that we developed is based on this Figure.
Insert Figure 2 here.
The model minimizes the total travel time for patients to access hospital inpatient
services, with the objective function being presented in Eq. [1]. The objective function
includes four terms, each one representing: the demand-weighted travel time to reach
district hospitals; the travel time to reach central hospitals; the travel time from patients
transferred from district to central hospitals (ascendant flow); and the travel time for
descendent flows in the hierarchy, i.e. for patients transferred from central to district
hospitals. A factor α allows us to weight differently the patients that have already had a
hospital admission; and the choice of weights for the terms of Eq. [1] entails value
judgements on the importance of travel time for patients accessing different services
( 0 1α≤ ≤ , these parameter might vary for different decision makers).
1 1
2 2
w wij ij ik ik
i I j J w W i I k J w W
wv wjk jk jk kj
j J k J w W v W j J k J w W
Min z d fd d fc
d zdc d zcdα α
∈ ∈ ∈ ∈ ∈ ∈
∈ ∈ ∈ ∈ ∈ ∈ ∈
= × + × +
+ × × + × ×
∑ ∑ ∑ ∑ ∑ ∑
∑ ∑ ∑ ∑ ∑ ∑ ∑ [1]

13
The characteristics of the hospital system are captured by the following set of
constrains.
Eq. [2] ensures that all the demand for hospital services is satisfied for each service.
Demand is captured by the parameter wiutl which, as defined above, represents the need
for the hospital service w, and should be the result of converting population numbers
into hospitals admissions through indicators that capture populations’ needs for hospital
services (like age, gender and geographic location).
,w w wij ik i
j J k Jfd fc utl i I w W
∈ ∈
+ = ∀ ∈ ∈∑ ∑ [2]
Eqs. [3] and [4] define the ascendant and descendent flows between hospitals in the
network through the equality between the proportion of patients that will be transferred
(exits) due to the need of services from the level above and the two possible ways to get
in (entries): from population points and from other services at the same hospital. These
constraints balance the flows from the different levels. Eq. [3] converts population
demand for district hospitals into demand to be transferred (or referred) from district to
central hospitals. Eq. [4] defines the descendent flows from central hospitals to district
hospitals.
,∈ ∈ ∈
+ × = ∀ ∈ ∈ ∑ ∑ ∑w aw wv wv
ij j jki I a W k J
fd td perDC zdc j J w v W [3]
,w aw w wij k kj
i I a W k Jfc tc perCD zcd k J w W
∈ ∈ ∈
+ × = ∀ ∈ ∈ ∑ ∑ ∑ [4]
Eqs. [5] and [6] define the flows within district and central hospitals. For example, the
percentage of patients that have used emergency services will require inpatient care.
,w wv wvij j
i Ifd pertrans td j J w v W
∈
× = ∀ ∈ ∈∑ [5]
,w wv wvik k
i Ifc pertrans tc k J w v W
∈
× = ∀ ∈ ∈∑ [6]

14
Eqs. [7] and [8] determine respectively the district and central hospitals capacity. For
inpatient care, the capacity is measured in inpatient days which afterwards are converted
in hospitals beds. For the other services (emergency care and external consultations),
capacity is measured by the number of attendances.
_ ,w w vw w wj ij j kj
i I v W k Jcap X fd td zcd avt j J w W
∈ ∈ ∈
= + + × ∀ ∈ ∈ ∑ ∑ ∑ [7]
_ ,w w vw vw wk ik k jk
i I v W j J v Wcap Y fc tc zdc avt k J w W
∈ ∈ ∈ ∈
= + + × ∀ ∈ ∈ ∑ ∑ ∑ ∑ [8]
Eqs. [9] and [10] ensure that, for all services, the minimum capacity is reached and the
maximum capacity is not exceeded, and also state that a service can only be obtained at
population points where hospitals are located.
min _ maxw w w w wj j jcap DH X cap X cap DH X j J w W× ≤ ≤ × ∀ ∈ ∈ [9]
min _ maxw w w w wk k kcap CH Y cap Y cap CH Y k J w W× ≤ ≤ × ∀ ∈ ∈ [10]
Depending on the health care system, additional constraints might be used to model
other decision maker preferences. For example, constraints might be built to impose that
there is a maximum distance allowed for a patient to access a certain hospital or service.
Eq. [11] illustrates this question for the district hospitals in service w. wijcob is a binary
matrix that defines if the population ( i I∈ ) can be supplied by a certain hospital ( j J∈ )
with respect to the following criterion: if an hospital is less then a predefined standard
travel time from a population, it can deliver hospital services to that population, being wijcob a parameter with the unit value; otherwise, it assumes the zero value. Eq. [11]
states that patients’ demand for hospital care from a population point can only be met by
hospitals within a maximum travelling time.
,w wij ijfd cob i I j J≤ ∀ ∈ ∈ [11]

15
We also consider the possibility in that some services can only be provided if that
hospital location also delivers another service. Eq. [12] exemplifies the case in which
emergency services (w=2) and external consultations (w=3) can only be served in
hospitals where inpatient (w=1) is provided.
1 2 1 3j j j jj J X X and X X∀ ∈ ≥ ≥ [12]
As a limiting case, we eventually impose that wherever a hospital is opened, the three
types of services need to be provided –this case is captured by Eq.[13].
1 2 3j j jj J X X X∀ ∈ = = [13]
CASE-STUDY We have applied the multiproduct hierarchical model to the Portuguese NHS. Portugal
has an administrative division that allows for delimiting three independent and self-
sufficient geographic areas in the health care system: North, Centre and South. The
present study focus on the South region, which includes three Administrative Health
Regions: Lisbon and Tagus Valley, Alentejo and Algarve and these regions are divided
in seven health sub-regions (Faro, Beja, Portalegre, Évora, Setúbal, Santarém and
Lisbon). The South region is divided in 109 small area units (the chosen geographic unit
-Concelhos- that are equivalent to the English wards) which include both urban and
rural areas. The urban areas benefit from improved physical accessibilities and higher
geographic proximity to health services. In the last decades the rural areas have suffered
a population decrease, their populations have been ageing at a higher rhythm in
comparison to urban populations, and the Alentejo region has populations living in
remote areas.
The current hospital network under study is composed by 12 general central hospitals
and 6 specialized central hospitals, all of them located in Lisbon sub-region (and 17
located in the Lisbon small area unit); and by 14 district hospitals and 5 level one
hospitals that are more evenly spread around the South region, like we show in Figure 3.
Insert Figure 3 here.

16
Data Analysis
The application of the model involved collecting two main types of data: data related to
expected need (or demand) for hospital care services, including related estimates on the
transfer of patients between services; and other parameters of the mathematical
programming model.
To compute estimates of population need for inpatient care ( iutl ) we used data from the
Diagnostic Related Group (DRG) database system from 2003 that allowed us to
compute the expected level of inpatient care utilization in accordance to age and gender
–this data was used to estimate expected utilisation from a population living in each
small area. Those estimates show that on average for each 1000 inhabitants, one expects
100 hospital admissions per year (for populations living in the South region). We have
weighted population numbers from each small area by expected utilization in
accordance to the age and gender structure of that population (e.g., this adjustment
implies higher expected utilization in areas with older populations) like we illustrate in
Figure 4.
Insert Figure 4 here.
DRG data was also used to estimate the two following parameters: 13% of patients
admitted to inpatient care in a district hospital will be transferred/referred to a central
hospital, and 1.24% of the patients admitted to inpatient care in central hospitals are
referred back for inpatient care in district hospitals – this is the parameter capturing the
reverse flow.
To predict the need for external consultations from a population area, we have used data
from the General Directorate of Health, in particular, the figure on the total number of
external consultations in 2003 (Health Ministry, 2003b). Making use of this data, we
have quantified that: 57,9% of the population of each area needed D level external
consultations (this figure might be interpreted as: for each 1000 inhabitants, one expects
579 for external consultations appointments per year); and that figure is 19,6% for level
C care provided in CH; and 25,3% of patients accessing external consultations in DH

17
need to be transferred to CH (this proportion was obtained by computing the ratio
19,6/(19,6+57,9)) for a further external consultation.
Need for emergency care has also made use of information from the General Directorate
of Health (Health Ministry, 2003b). Due to the absence of more detailed information,
we have assumed that this service is not differentiated in district and central hospitals,
and there is an utilization of 58,4% for each population point (i.e., from each 1000
inhabitants, one expects 584 entries an emergency care unit).
The remaining flows between hospitals and within services were not considered in the
Portuguese case study, given the lack of information to estimate those parameters and
also because of the expected low magnitude of those flows (in comparison to other
flows).
Resident population estimates at the small area level were taken from the last
Portuguese National Institute of Statistics census (with 2001 reference) (Portuguese
National Institute of Statistics, 2006).
We have estimated other parameters of the mathematical programming model as
follows. For the α parameter, we used the value of 0,5 which means that the travelling
time of one transferred/referred patient is worth half the value of the travelling time of
the journey for a patient to directly enter an hospital. As underlined above, the α
parameter is a value judgement for the decision maker.
We have computed the travelling distances between the centroids of the population
points (e.g., centroids of the small area units) using an internet website that computes
travelling time while taking into account roads accessibility and roads condition
(ViaMichelin, 2006).
For inpatient care, we have assumed an average length of stay within hospital of 7.7
days for each hospital inpatient admission (Health Ministry, 2003b).
At last, we have had to estimate hospital capacities for different services. We have
initially used the standard limits defined by the Portuguese Health Ministry (Comissão
Técnica Interdepartamental, 2006) which allows for relatively small capacities for some
hospitals in areas with low geographic accessibility. In our applications of the model,
we have found out (as expected) that the total number of hospitals is related with the
minimum and maximum capacities allowed, and lower minimum capacities allow for
the opening of too many units. This fact associated with evidence on the existence of
economies of scale have lead us to use minimum capacities of 200 and 500 beds for
18
district and central hospitals, respectively, and maximum capacities of 500 and 1000
beds.
The parameters of our model application (including estimated values) are synthesised in
Table 1. This table allows for a quick reading about each parameter.
Insert Table 1 here.
The impact of using these parameters (and related assumptions) in the model is crucial
and should take into account the decision maker’s knowledge of the system; and the use
of key parameters should be subject to sensitivity analysis to observe the impact of
parameters variations in the model results. We should be aware of the low quality of
data for some of the estimated parameters, in particular on the information on transfers
between district and central hospitals. We expect that there was an underreporting on
the number of these transfers; and we have used utilisation data to estimate some
parameters, which has meant that our estimates of demand/need for emergency care and
external consultations are influenced by variables that we could not control for (such as
on the influence of supply on demand for hospital services, and we also lacked
information on waiting lists that capture unmet need for hospital services).
Consequently, analysis of results of the model application should consider the use of
these crude parameters.
Model Solution Strategy
The described model was implemented in the general algebraic modelling system
GAMS (version 22.0) (McCarl, 2004), and solved though the branch and bound method
making use of CPLEX (version 9.0).
The application of the model to the global problem described above has lead to a
complex problem which was impossible to solve with our computer resources, due to
the raised number of integer variables that impose harder search methods like branch
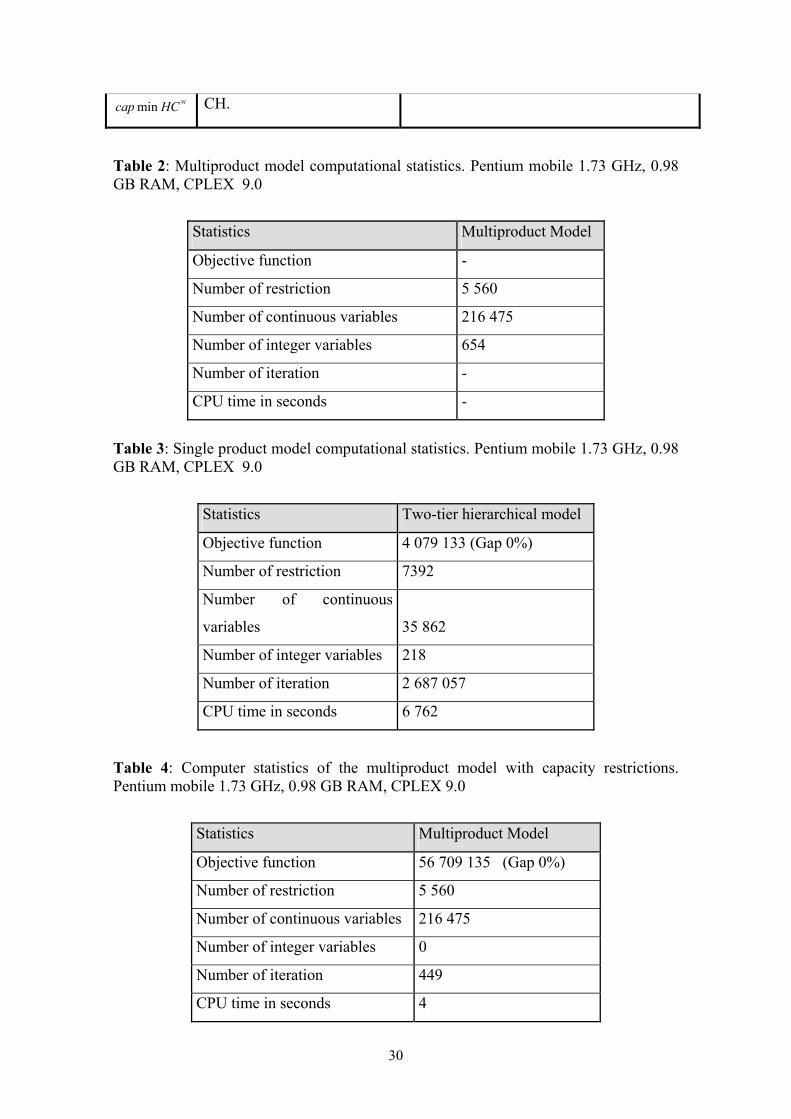
and bound. Table 2 presents the results from running the model.
Insert Table 2 here.

19
Based on these results, we have defined a solution strategy that involved a multi-stage
solution algorithm. This solution strategy is described as follows:
Stage 1 – The multiproduct model is solved for a single product. We chose inpatient
care as that product because it is a key component for current spending and for
investment on infrastructure and equipment. The results of this single product
hierarchical model have provided a set of hospital locations which were used as input in
the model run in Stage 2.
Stage 2 – The multiproduct hierarchical model was run using the set of locations
provided in Stage 1. As results we obtained the network flows for the three products for
the complete network.
We now describe in detail these stages and present the results from their application.
Stage 1 – Single Product Model Results
The first stage involved the adaptation of the multiproduct hierarquical model to a
single service –inpatient care (w=1). To accomplish this purpose, some adaptations
were needed to eliminate some flows of the mathematical formulation presented above.
Namely, we have eliminated the variables that stand for flows between services ( wvktd
and wvktc ) and some constrains (Eqs. [5] and [6]); other constraints were simplified -that
was the case for Eqs. [3], [7] and [8]; the descendent flows for inpatient care were also
ignored, therefore, Eq. [4] was also eliminated.
In order to obtain a more efficient model, a coverage constraint like Eq. [11] was used.
One should note that standard travelling distance should be carefully chosen. Low
values turn the resolution faster because limit the number of hospitals that can serve the
population, although they have a side effect in that if an excessive boundary is used, it
might imply further hospitals location, and thus shape different results. When rural and
urban areas co-exist, different cover distances should be tried in order to find a balance.
In this study we have tested the effect of several covers and observed that with this
restriction we can achieve, in a faster way, a lower gap.
We have also tested different branch and bound search methods available in CPLEX,
being the depth first the one that produced faster results.
The single product hierarchical model computer statistics are presented in Table 3 and
the results are illustrated in Figure 5.

20
Insert Table 3 here.
Insert Figure 5 here.
In Stage 1, the optimal network is composed by 23 district hospitals and 7 central
hospitals. Hospitals location in the South region area is shown in Figure 5. Comparing
these results with the current network, the model indicates that central hospitals that are
currently located in Lisbon should be transferred to other population points, many of
those to other small area units in the Lisbon Metropolitan area; and in accordance to
geographic accessibility and need for inpatient care, a central hospitals should be
located in the Algarve region, and in a location in the South of the Tagus river, nearby
Alentejo (that is, in Palmela). We do not focus on a central hospital in the northern part
of the South region because this area has access to some hospital supply in the Centre
region that is outside the area included in this case study. These results suggest that
higher geographic equity of access can be obtained with reductions in hospital supply in
Lisbon and with reinforcements in hospital supply in the metropolitan areas and in other
less urban areas. A surprising result is the Palmela location, given that this is a small
area with low population numbers and density (in comparison to other geographic
contiguous areas). Nonetheless, this location benefits from good accessibility from
populations from Alentejo, and is surrounded by small areas with high population
numbers, which seems to justify a central hospital. Results also show that if one wants
to maximize geographic accessibility, many hospitals will have the minimum capacity.
This might be interpreted as an equity-efficiency trade-off: given that there are sparce
populations in the South region, in order to maximize equity in access, we should have
small hospitals, which in fact might not respect optimal hospital size as defined by
efficiency or costs criteria.

21
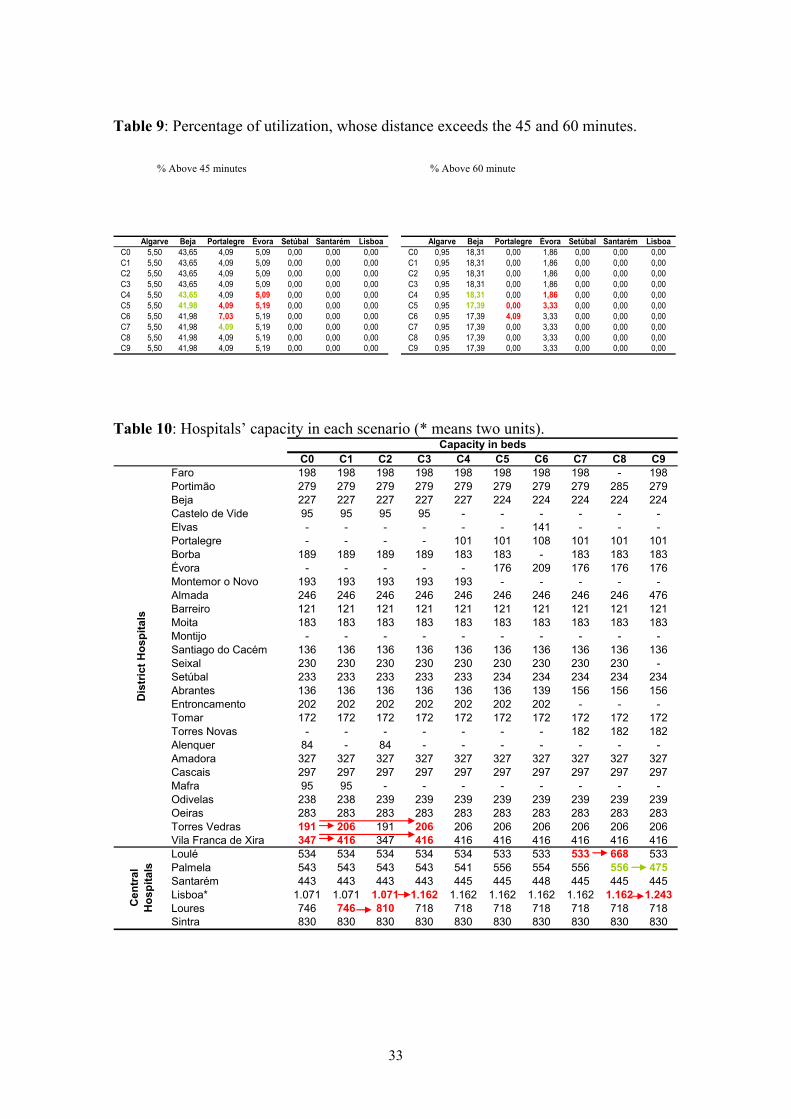
Figure 6 and Figure 7 present a set of indicators that help to analyse the results of the
model: average travel time weighted by utilization; maximum travel time to reach a
unit; and share of population whose travel time to reach a hospital exceeds 45 and 60
minutes. We present these indicators by health sub-region or region, in order to have an
idea about variations across areas.
Insert Figure 5 here.
Insert Figure 6 here.
Insert Figure 7 here.
Despite the reduced average travel time (less than 45 minutes), a substantial proportion
of the populations living in the Algarve and Alentejo regions needs to travel more than
sixty minutes to access hospital services. Nevertheless, higher availability of primary
care resources in these rural areas is expected partly to compensate these inequalities in
access to hospital care.
Stage 2 - The Multiproduct Model Results
Using the hospital locations suggested by the single product model, in this second stage
the multiproduct model is run using those locations as the possible ones, and produces
information on the flows of patients for different hospital services and types of
hospitals. The computational statistics are presented in Tables 4 and the associated
results in Table 5.
Insert Table 4 here.
Insert Table 5 here.
Analysis of results shows again that the capacity (as measured by the number of beds)
for many hospitals equals the minimum capacity allowed for inpatient care, and this is a
consequence of the procedure used to achieve the solution. We also observe that some
patients need to travel further (than potentially required) in order to respect the
minimum capacity in the model. This is specially the case of some populations from one
22
small area that might be allocated to different hospitals. This can lead that population
from a small area might be using different hospitals for different services, which might
not be an acceptable rule in a planning/referral system. In order to test the extent to
which we can avoid this result, we have solved the model without the capacity
constraints. The computer statistics are presented in Table 6 and the results of this
model are presented in Table 7.
Insert Table 6 here.
Insert Table 7 here.
Without using the capacity constraints we observe an improvement in the value of the
objective function by 6% (decrease), but yet there are some hospitals with lower
capacities than the minimum capacity previously defined in areas with relatively good
geographical access to hospital services (for example, Alenquer and Mafra).
We have found differences between current locations and the ones proposed by the two
stage multiproduct hierarchical model. This result indicates that the current network
might be improved so as to achieve greater geographic access to hospital services, for
example by closing facilities and by moving current locations through moving new
replacement hospitals to other areas. Depending on the country context, the model can
be used both to analyse the creation of new facilities or the redistribution of current
hospital facilities. E.g., these questions can be answered by changing the locations
variables values and letting the model find out the optimal redistribution in an iterative
process similar to the vertex substitution of Galvão et al. (Galvão et al., 2002).
SENSITIVITY ANALYSIS TO THE LOCATIONS A two-step approach was used to achieve the solution previously presented for the
multiproduct model. Nevertheless, that approach does not guarantee results’ optimality.
The global solution obtained by splitting the problem in two sub-problems –the location
and the flow distribution (allocation), with separate optimizing models– leads to a
global solution that strongly depends on the procedure used in stage one. We chose only
a single product (inpatient care) to establish the locations, yet the introduction of other
possible locations might result in different network configurations and even the single
product model can produce alternative results when tested with different parameters. In

23
this case study, sensitivity analysis was selected to test: whether slight improvements in
the network can be achieved when considering other policy objectives and the current
hospital network; and to test the robustness of results to changes in parameters.
Sensitivity analysis was done through scenario analysis since the model includes a large
number of integer variables and parameters.
Thus the selection of scenarios intended to capture the extent to which ‘fixed’ locations
(in the first stage) were susceptible of being changed, and we have explored the impact
of closing facilities and permuting locations on results. The starting point for scenario
analysis is the result of the multiproduct model without capacity constraints described in
the previous section (we name this scenario as C0). We have added some additional
potential locations to C0, which we define below. The following set of scenarios were
defined: closing of hospitals whose capacity is under 200 beds and which are located in
areas with good accessibilities (scenarios C1-C3); adding potential locations
corresponding to areas where there is currently hospital supply (scenarios C4-C7 and
C10); and additional locations corresponding to political decisions (C8-C9). Each
scenario corresponded to the following case: C1 as closing Alenquer; C2 as closing
Mafra; C3 as closing, simultaneously, Alenquer and Mafra; C4 as swaping Castelo de
Vide by Portalegre; C5 as swaping Montemor-o-Novo by Évora; C6 as swaping Borba
by Elvas; C7 as swaping Entroncamento by Torres Novas; C8 as closing Faro; C9 as
closing Seixal.
We agreed that a scenario is better than the previous one through analysing the results
of the multiproduct model: when there were no significant losses for patients (as
measured by the set of indicators earlier explained: average travel time weighted by
utilization, maximum travel time to reach a unit and share of population whose travel
time to reach a hospital exceeds 45 and 60 minutes) and there were other benefits for the
health system (such as a decrease in the number of hospitals, and locations matching to
areas with existing hospital supply), we considered that a scenario is better than the
previous one. Thus, the analysis of those scenarios shows how alternative
configurations of the network can be evaluated using the multi-product model, and
considering a wider set of criteria that are important for planners and which complement
the information of the objective function.
We have tested the described scenarios sequentially and, when a scenario is considered
better than the previous, we introduce those changes incrementally and depart from that

24
case. The results from the comparison of the various scenarios are presented in Tables 8
and 9 and in Figures 7 and 8.
Insert Table 8 here.
Insert Table 9 here.
Insert Figure 7 here.
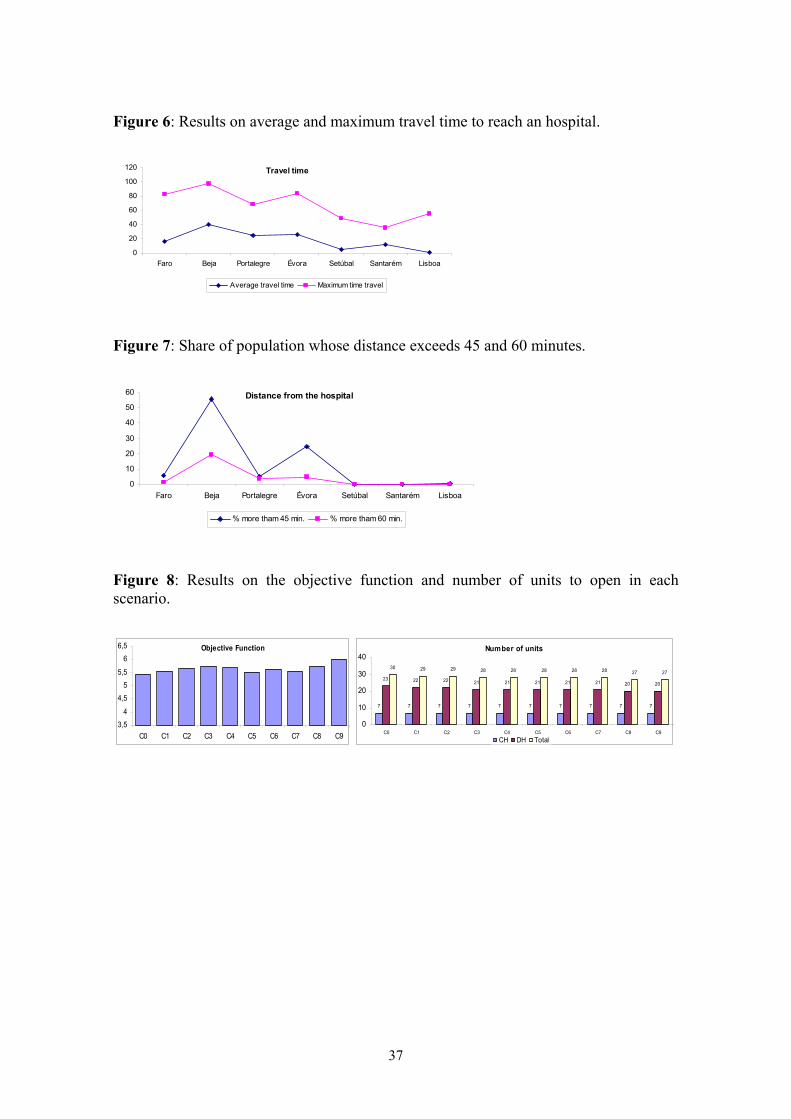
Insert Figure 8 here.
We now briefly present the result from the scenario analysis. We should note that in the
described scenarios, the value of the objective function slightly decreases, which
constitutes evidence in that the solutions generated by the two stage approach are
robust. However we consider that many of the scenarios improve the solution of the C0
scenario, being the other information on additional indicators and on current supply
relevant for considering the optimal network. The information on those indicators is
analysed together with information variations in the value of the objective function.
In the examined scenarios, the maximum value of the objective function is achieved in
C0. We observed that in most cases the decreases in total accessibility (as measured by
the objective function) were very small and acceptable, when we have tested
permutation of hospital to nearby locations where there is already a hospital or when
closing a small hospital one unit. Comparing the results from the sequential scenarios
and using C0 as the basis for comparison: with C1 and C2 we notice that there are small
and acceptable decreases in accessibility and acceptable raises in the capacity of the
closer hospitals. In this way, the case of C3 which combines C1 and C2 is the most
preferred case because it allows for a smaller number of hospitals. When we add C4 to
C3, we found that this is a preferred scenario because it is an approximation to the
current network that does not substantially improve the accessibilities and is therefore
accepted. C5 is similar to C4 although there is a small increase in the proportion of
population whose distance exceeds 45 and 60 minutes. This scenario is considered
better due to the existence of a unit in this location. In C6 we observe significant
increases in the travel time so that this location (Borba) is not accepted. We have
accepted C7 because there is currently a hospital in that location. In C8 we once again
test the closure of a hospital, but in this case we found out a raise of 200 beds in the
capacity of the closest unit, because there is a lack of alternative hospitals nearby. As
the service level can be compromised, we consider that this decision should be

25
supported by a more specific study. Scenario C9 is not harmful for patients and so we
accept the scenario of closing the hospital. We remark that the solution obtained by the
defined procedures does not nullify the optimal one because the conditions used to
obtain and to evaluate them are different.
In the next section we show how the multiproduct model solution can be used as a
departing point to consider other objectives for establishing a hospital emergency
network.
ANALYSIS FOR EMERGENCY CARE In Portugal, reorganization of the emergency care system has recently been at the top of
the political agenda. The government has commissioned a technical study which has
defined some accessibility criteria and goals to achieve in planning this service and has
already introduced some changes. For example, the study indicated that the time
distance between a patient and an emergency service should not exceed 60 minutes
(Health Ministry, 2006a). Examining Figure 7, we found out that for some health sub-
regions this principle is not respected (e.g., populations living in Faro, Beja, Évora and
Portalegre). We do not aim at creating a model to optimize the emergency care network,
but we have analysed how the multiproduct model solution might be changed to have
into account the principle in that citizen should not be located at a time distance higher
than 60 minutes to emergency care.
We depart from the last scenario accepted in the previous section (scenario C9) and
have adopted a bottom up strategy and analysed which would be the additional locations
so that all patients are within 60 minutes from the emergency service. This objective is
achieved with the opening of three additional facilities that only supply emergency care,
like we show in Figure 9.
Insert Figure 9 here.
CONCLUSION We have proposed a decision analysis tool to help health care planners to decide upon
the location and redistribution of hospital supply. The model developed holds the
general hierarchical structure of a health system, respects the multiproduct nature of

26
hospitals activity, and aims at promoting equity in access among citizens through the
maximization of the geographic access for patients to reach hospital care services. The
model detaches from previous published models because it considers the multiproduct
nature of the hospital, the interactions between the various services and levels, as well
as it allows for two-way flows in the hospital hierarchy.
The application of the model to a real network has resulted in a quite complex problem
that we found difficult to optimize. The model was solved using a solution strategy
defined within two stages: in the first, the locations were established trough the
optimization of a simpler network that considered only a single product (inpatient care);
in the second stage the allowed hospital location points were fixed and the model has
produced the redistribution of the flows accounting for the multiple hospital services
and articulation between services between and within hospitals.
We found out that the multiproduct model was highly demanding with respect to the
required data to calibrate parameters, and that the model results were strongly
dependent on the parameter values. In this mater, the planner knowledge of the system
can be crucial to obtain suitable results.
Given that we did not reach an optimal solution, we have shown the usefulness of
sensitivity analysis to analyse alternative solutions to the model that also took into
account other policy objectives to health care planned and the current location of
hospitals. The final analysis has shown that if some accessibility criteria are to be
reached for emergency care, further emergency services should be provided for
population points that did not have an emergency service within 60 minutes distance,
and the model can be analysed so as to account for this objective.
This study might be developed so that other approaches are developed to solve the
multiproduct model; and the model might be generalized so as to include further levels
of health care services within the network, as well as other constraints that capture
institutional characteristics of the system.

27
REFERENCES Barros, A. I.; Dekker, R. and Scholten, V. (1998). A two-level network for recycling
sand: a case study. European Journal of Operational Research, 110: 199- 214.
Ballou, R. (2004). Business Logistics / Supply Chain Management. Prentice Hall: Fifth
edition.
Comissão Técnica Interdepartamental (2006). Reordenamento das Capacidades
Hospitalares da Cidade de Lisboa: Plano de Acções Prioritárias. Lisbon.
Daskin, M. (1995) Network and Discrete Location: Models, Algorithms and
Applications. Wiley-Interscience Series in Discrete Mathematics and Optimization,
USA.
Escola de Gestão do Porto (2006) Estudo de Avaliação de Prioridades de Investimento
com o Objectivo de Apoiar o Processo de Decisão, ao Nível Político, quanto à
Sequência Estratégica de Implementação dos Hospitais inseridos na Segunda Vaga do
Programa de Parcerias para o Sector Hospitalar. Escola de Gestão do Porto, Porto.
Galvão, R.; Espejo, L. and Boffrey, B. (2002). A hierarchical model for the location of
perinatal facilities in the municipality of Rio de Janeiro. European Journal of
Operational Research, 138: 495-517.
Galvão, R.; Espejo, L. and Boffrey, B. (2003). Dual-based heuristics for a hierarchical
covering location problem. Computers and Operational Research, 30:165-180.
Galvão, R.; et al. (2006) Load balancing and capacity constraints in a hierarchical
location model. European Journal of Operational Research, 172: 631-646.
Instituto Geográfico Português (2006) Available in the Internet via URL: www.igeo.pt.
Archive obtained in May.
Portuguese National Institute of Statistics (2006). XIV Census. Info service in URL:
http://www.ine.pt/censos2001/. Consulted between March and June.
McCarl, B. (2004). GAMS User Guide Version 21.3. Available in URL:
www.gams.com. Archive obtained in March.
McGuire, A. and Hughes, D. (2002). The Economics of the Hospital: Issues of
asymmetry and uncertainty as they affect hospital reimbursement. In Advances in
Health Economics. Eds: R. Elliot and A. Scott, Wiley.
Health Ministry (2001). Rede de Referenciação Hospitalar de Urgência/Emergência.
Lisbon.
28
Health Ministry (2003a). Decreto-lei nº281/03: Rede de cuidados continuados de saúde.
Diário da República: I série - A, nº 259: 8 of November. Lisbon.
Health Ministry (2003b). Centros de Saúde e Hospitais, Recursos e Produção do SNS,
Health Ministry, Lisbon.
Health Ministry (2006). Despacho normativo nº18459/06: aprovação da rede hospitalar
de urgência/emergência. Diário da República: II série, nº176: 12 of September. Lisbon.
Health Ministry (2007). Proposta de Rede de Serviços de Urgência, Health Ministry,
Lisbon.
Mitropoulos, I., et al. (2006). A biobjective model for locational planning of hospital
and health centers. Health Care and Management Science, 9:171-179.
Moore, G.; ReVelle, C. (1982). The hierarchical service location problem. Management
Science, 28 (7): 775-780.
Narula, S. C. (1986). Minisum hierarchical location-allocation problems in a network: a
survey. Annals of Operations Research, 6:257-272.
Oliveira, MDCD (2003) Achieving Geographic Equity in the Portuguese Hospital
Financing System, PhD thesis, Operational Research Department, London School of
Economics and Political Science, University of London.
Oliveira, M. D. and Bevan, G. (2003). Measuring geographic inequities in the
Portuguese Heath care system: an estimation of hospital care needs. Health Policy, 66:
277-293.
Oliveira, M. D. and Bevan, G.(2006). Modelling the redistribution of hospital supply to
achieve equity taking account the patient’s behaviour. Health Care Management
Science, 9(1): 19-30.
Oliveira, M. D. and Pinto, C. (2005). Health care reform in Portugal: An evaluation of
the NHS experience. Health Economics, 14: 203-220.
Rahman, S. and Smith, D. (2000). Use of Location-allocation models in health service
development planning in developing nations. European Journal of Operational
Research, 123: 437-452.
ReVelle, C.S. and Eiselt, H.A. (2004). Location analysis: a synthesis and survey.
European Journal of Operational Research, 165: 1-19.
ViaMichelin (2006). Determination of traveling times between small unitis. Service
avaliable in www. URL: www.viamichelin.co.uk. Values obtained between in January
and March .

29
TABLES Table 1: Synthesis, definition and value of the parameters in use.
Parameter Description Estimated value
dij 2d jk Travel time between small
areas Travel time matrix
w=1 inpatient care
Taking into account
age, gender and
location.
w=2 emergency care 58,4% wiutl Expected need for service w
w=3 external
consultation
D Level: 57,9%
C Level: 19,6%
wvperDC
Proportion of patients
transferred/referred from
service w in DH to service v
in CH
v = 1 v = 2 v = 3w = 1 13,0% 0,0% 0,0%w = 2 2,5% 0,0% 0,0%w = 3 0,0% 0,0% 25,3%
DH
CH
w=1 inpatient care 1,24%
w=2 emergency care 0% wperCD
Proportion of transferences
between DH and CH for
service w. w=3 external
consultation
0%
wvpertrans
Transferences between
services w and v within the
same unit.
v = 1 v = 2 v = 3w = 1 0,0% 0,0% 0,0%w = 2 9,2% 0,0% 0,0%w = 3 0,0% 0,0% 0,0%
w=1 inpatient care 7,7 days (length of
stay)
w=2 emergency care 1 occurrence wavt Average time spent in
service w w=3 external
consultation
1 attendance
max wcap HD
min wcap HD
max wcap HC
Minimum and maximum
capacities allowed in DH and DH CH DH CH DH CH
Mínimum 200 500 54750 54750 4000 60000Máximum 500 1000 182500 - 300000 500000
w = 1 w = 2 w = 3
30
min wcap HC CH.
Table 2: Multiproduct model computational statistics. Pentium mobile 1.73 GHz, 0.98 GB RAM, CPLEX 9.0
Statistics Multiproduct Model
Objective function -
Number of restriction 5 560
Number of continuous variables 216 475
Number of integer variables 654
Number of iteration -
CPU time in seconds -
Table 3: Single product model computational statistics. Pentium mobile 1.73 GHz, 0.98 GB RAM, CPLEX 9.0
Statistics Two-tier hierarchical model
Objective function 4 079 133 (Gap 0%)
Number of restriction 7392
Number of continuous
variables 35 862
Number of integer variables 218
Number of iteration 2 687 057
CPU time in seconds 6 762
Table 4: Computer statistics of the multiproduct model with capacity restrictions. Pentium mobile 1.73 GHz, 0.98 GB RAM, CPLEX 9.0
Statistics Multiproduct Model
Objective function 56 709 135 (Gap 0%)
Number of restriction 5 560
Number of continuous variables 216 475
Number of integer variables 0
Number of iteration 449
CPU time in seconds 4

31
Table 5: Results of the multiproduct model with capacity restrictions
Impatient care Emergency care
External consultation
Faro 200 63.665 76.616Portimão 255 91.646 110.288Beja 200 84.951 97.015Castelo de Vide 200 54.750 41.959Borba 200 54.750 83.259Montemor o Novo 200 71.562 86.531Almada 201 103.571 124.639Barreiro 200 54.750 61.234Moita 200 77.039 92.711Santiago do Cacém 200 55.184 66.408Seixal 200 96.775 116.460Setúbal 200 82.510 117.413Abrantes 200 54.750 60.302Entroncamento 200 64.502 89.765Tomar 200 63.527 76.449Alenquer 200 54.750 40.000Amadora 306 113.262 136.301Cascais 297 109.920 132.279Mafra 200 54.750 42.127Odivelas 208 86.197 103.731Oeiras 283 104.410 125.649Torres Vedras 200 70.491 84.830Vila Franca de Xira 200 91.016 142.335Total 4951 1.758.728 2.108.301Loulé 500 104.455 202.339Palmela 546 54.750 210.297Santarém 500 91.357 177.864Lisboa 1065 363.639 500.932Loures 551 120.865 266.787Sintra 783 234.254 349.856Total 3945 969.320 1.708.074
Hos
pita
is D
istr
itais
Hos
pita
is
Cen
trai
sD
istr
icH
ospi
tals
Cen
tral
Hos
pita
ls
Table 6: Computer statistics for the multiproduct model without capacity restrictions. Pentium mobile 1.73 GHz, 0.98 GB RAM, CPLEX 9.0
Statistics Multiproduct Model
Objective function 54 403 107 (Gap 0%)
Number of restriction 4 252
Number of continuous variables 21 6475
Number of integer variables 0
Number of iteration 320
CPU time in seconds 4

32
Table 7: Results of the multiproduct model without capacity restrictions
Impatient care Emergency care
External consultation
Faro 198 63.665 76.616Portimão 279 91.646 110.288Beja 227 86.340 97.015Castelo de Vide 95 34.868 41.959Borba 189 69.184 83.259Montemor o Novo 193 70.173 86.531Almada 246 103.571 124.639Barreiro 121 50.884 61.234Moita 183 77.039 92.711Santiago do Cacém 136 55.184 66.408Seixal 230 96.775 116.460Setúbal 233 97.566 117.413Abrantes 136 50.108 60.302Entroncamento 202 74.592 89.765Tomar 172 63.527 76.449Alenquer 84 30.981 37.283Amadora 327 113.262 136.301Cascais 297 109.920 132.279Mafra 95 35.007 42.127Odivelas 238 86.197 103.731Oeiras 283 104.410 125.649Torres Vedras 191 70.491 84.830Vila Franca de Xira 347 127.199 145.052Total 4700 1.762.589 2.108.301Loulé 534 104.455 202.339Palmela 543 43.560 210.297Santarém 443 91.357 177.864Lisboa 1071 363.639 469.143Loures 746 128.194 298.576Sintra 830 234.254 349.856Total 4168 965.459 1.708.074
Dis
tric
t hos
pita
lsC
entr
al
hosp
ital
Table 8: Comparison of the average and maximum travel time in each scenario Average travel time Maximum travel time
Algarve Beja Portalegre Évora Setúbal Santarém LisboaC0 15,16 37,16 28,97 23,41 4,38 11,32 0,00C1 15,16 37,16 28,97 23,41 4,38 11,32 1,17C2 15,16 37,16 28,97 23,41 4,38 11,32 1,56C3 15,16 37,16 28,97 23,41 4,38 11,32 1,89C4 15,16 37,16 25,33 23,41 4,38 11,32 1,89C5 15,16 36,88 25,33 16,81 4,38 11,32 1,89C6 15,16 36,88 21,53 23,51 4,38 11,32 1,89C7 15,16 36,88 25,33 16,81 4,38 11,60 1,89C8 18,93 36,88 25,33 16,81 4,38 11,60 1,89C9 15,16 36,88 25,33 16,81 8,57 11,60 1,89
Algarve Beja Portalegre Évora Setúbal Santarém LisboaC0 83 97 51 84 39 35 29C1 83 97 51 84 39 35 29C2 83 97 51 84 39 35 29C3 83 97 51 84 39 35 29C4 83 97 51 84 39 35 29C5 83 100 51 61 39 35 29C6 83 100 69 61 39 35 29C7 83 100 51 61 39 35 29C8 83 100 51 61 39 35 29C9 83 100 51 61 39 35 29
33
Table 9: Percentage of utilization, whose distance exceeds the 45 and 60 minutes. % Above 45 minutes % Above 60 minute
Algarve Beja Portalegre Évora Setúbal Santarém Lisboa
C0 5,50 43,65 4,09 5,09 0,00 0,00 0,00C1 5,50 43,65 4,09 5,09 0,00 0,00 0,00C2 5,50 43,65 4,09 5,09 0,00 0,00 0,00C3 5,50 43,65 4,09 5,09 0,00 0,00 0,00C4 5,50 43,65 4,09 5,09 0,00 0,00 0,00C5 5,50 41,98 4,09 5,19 0,00 0,00 0,00C6 5,50 41,98 7,03 5,19 0,00 0,00 0,00C7 5,50 41,98 4,09 5,19 0,00 0,00 0,00C8 5,50 41,98 4,09 5,19 0,00 0,00 0,00C9 5,50 41,98 4,09 5,19 0,00 0,00 0,00
Algarve Beja Portalegre Évora Setúbal Santarém LisboaC0 0,95 18,31 0,00 1,86 0,00 0,00 0,00C1 0,95 18,31 0,00 1,86 0,00 0,00 0,00C2 0,95 18,31 0,00 1,86 0,00 0,00 0,00C3 0,95 18,31 0,00 1,86 0,00 0,00 0,00C4 0,95 18,31 0,00 1,86 0,00 0,00 0,00C5 0,95 17,39 0,00 3,33 0,00 0,00 0,00C6 0,95 17,39 4,09 3,33 0,00 0,00 0,00C7 0,95 17,39 0,00 3,33 0,00 0,00 0,00C8 0,95 17,39 0,00 3,33 0,00 0,00 0,00C9 0,95 17,39 0,00 3,33 0,00 0,00 0,00
Table 10: Hospitals’ capacity in each scenario (* means two units).
C0 C1 C2 C3 C4 C5 C6 C7 C8 C9Faro 198 198 198 198 198 198 198 198 - 198Portimão 279 279 279 279 279 279 279 279 285 279Beja 227 227 227 227 227 224 224 224 224 224Castelo de Vide 95 95 95 95 - - - - - -Elvas - - - - - - 141 - - -Portalegre - - - - 101 101 108 101 101 101Borba 189 189 189 189 183 183 - 183 183 183Évora - - - - - 176 209 176 176 176Montemor o Novo 193 193 193 193 193 - - - - -Almada 246 246 246 246 246 246 246 246 246 476Barreiro 121 121 121 121 121 121 121 121 121 121Moita 183 183 183 183 183 183 183 183 183 183Montijo - - - - - - - - - -Santiago do Cacém 136 136 136 136 136 136 136 136 136 136Seixal 230 230 230 230 230 230 230 230 230 -Setúbal 233 233 233 233 233 234 234 234 234 234Abrantes 136 136 136 136 136 136 139 156 156 156Entroncamento 202 202 202 202 202 202 202 - - -Tomar 172 172 172 172 172 172 172 172 172 172Torres Novas - - - - - - - 182 182 182Alenquer 84 - 84 - - - - - - -Amadora 327 327 327 327 327 327 327 327 327 327Cascais 297 297 297 297 297 297 297 297 297 297Mafra 95 95 - - - - - - - -Odivelas 238 238 239 239 239 239 239 239 239 239Oeiras 283 283 283 283 283 283 283 283 283 283Torres Vedras 191 206 191 206 206 206 206 206 206 206Vila Franca de Xira 347 416 347 416 416 416 416 416 416 416Loulé 534 534 534 534 534 533 533 533 668 533Palmela 543 543 543 543 541 556 554 556 556 475Santarém 443 443 443 443 445 445 448 445 445 445Lisboa* 1.071 1.071 1.071 1.162 1.162 1.162 1.162 1.162 1.162 1.243Loures 746 746 810 718 718 718 718 718 718 718Sintra 830 830 830 830 830 830 830 830 830 830
Capacity in beds
Dis
tric
t Hos
pita
lsC
entr
al
Hos
pita
ls

34
FIGURES Figure 1: Hospitals flow scheme.
Figure 2: Hospitals flow scheme considered in the Portuguese case.
District hospital Central hospital
Inpatient care
Emergency care
Out-patient care
Inpatient care
Emergency care
Out-patient care
Inpatient care
Emergency care
Out-patient care
District hospital j
Inpatient care
Emergency care
Out-patient care
Central hospital k
Demand
point i
1ikfc
1ijfd 2
ikfc
2ijfd
3ikfc
3ijfd
33jkzdc
1kjzcd
21jtd
21ktc
21jkzdc
11jkzdc
1_ jcap X
2_ jcap X3_ jcap X
3_ jcap Y
2_ jcap Y
1_ jcap Y

35
Figure 3: Current distribution of the hospitals in the South of Portugal.
Figure 4: Percentages used in the estimation of the needs for the inpatient care.
0
5
10
15
20
25
30
35
40
[0,4]
[5,9]
[10,14
]
[15,19
]
[20,24
]
[25,29
]
[30,34
]
[35,39
]
[40,44
]
[45,50
]
[50,54
]
[55,59
]
[60,64
]
[65,69
]
[70,74
]
[75,79
]
[80,84
]>=85
Perc
enta
ge
Male Female Averege of 10%

36
Figure 5: Synthesis of the results for the single product model
c) Spatial distribution of the hospitals and the population
allocation.
Faro 200Portimão 282Beja 225Castelo de Vide 241Borba 200Montemor o Novo 200Almada 318Barreiro 200Moita 206Santiago do Cacém 200Seixal 277Setúbal 222Abrantes 200Entroncamento 200Tomar 207Alenquer 200Amadora 333Cascais 333Mafra 200Odivelas 248Oeiras 315Torres Vedras 200Vila Franca de Xira 231
( 23 unidades) 5439
a) DH capacity
Loulé 500Palmela 500Santarém 500Lisboa 1291Loures 500Sintra 786
( 7 unidades) 4077
b) CH capacity
d) Amplifying Lisbon and the
closed wards
( 23 units )
( 7 units )
37
Figure 6: Results on average and maximum travel time to reach an hospital.
Travel time
0
20
40
60
80
100
120
Faro Beja Portalegre Évora Setúbal Santarém Lisboa
Average travel time Maximum time travel
Figure 7: Share of population whose distance exceeds 45 and 60 minutes.
Distance from the hospital
0
10
20
30
40
50
60
Faro Beja Portalegre Évora Setúbal Santarém Lisboa
% more tham 45 min. % more tham 60 min.
Figure 8: Results on the objective function and number of units to open in each scenario.
Objective Function
3,54
4,55
5,5
66,5
C0 C1 C2 C3 C4 C5 C6 C7 C8 C9
Number of units
7 7 7 7 7 7 7 7 7 7
23 22 22 21 21 21 21 21 20 20
30 29 29 28 28 28 28 28 27 27
0
10
20
30
40
C0 C1 C2 C3 C4 C5 C6 C7 C8 C9CH DH Total

38
Figure 9: Results for the emergency care.