osisko corporate presentation - mines & money london 2016
TRANSCRIPT

THE LEADING INTERMEDIATE ROYALTY COMPANYCorporate Presentation
2016 Mines and Money London – Nov. 28 - Dec.1, 2016

Certain statements contained in this presentation may be deemed "forward-looking statements". All statements in this release, other than statements of historical fact, that addressfuture events, developments or performance that Osisko (the “Corporation”) expect to occur including managements’ expectations regarding the Corporation’s growth, results ofoperations, estimated future revenues, requirements for additional capital, future demand for and prices of commodities, business prospects and opportunities are forward lookingstatements. Forward looking statements are statements that are not historical facts and are generally, but not always, identified by the words "expects", "plans", "anticipates", "believes","intends", "estimates", "projects", "potential", "scheduled" and similar expressions or variations (Including negative variations), or that events or conditions "will", "would", "may", "could"or "should" occur including, without limitation, that all conditions precedent to the transaction will be met and the realization of the anticipated benefits deriving therefrom forshareholders of the Corporation, the view on (i) the quality and the potential of the Corporation’s assets, production forecasts for properties in which the corporation holds a royalty.Although the Corporation believes the expectations expressed in such forward-looking statements are based on reasonable assumptions, such statements involve known and unknownrisks, uncertainties and other factors and are not guarantees of future performance and actual results may accordingly differ materially from those in forward looking statements. Factorsthat could cause the actual results to differ materially from those in forward-looking statements include, without limitation: fluctuations in the prices of the commodities that driveroyalties held by the Corporation; fluctuations in the value of the Canadian dollar relative to the U.S. dollar; risks related to the operators of the properties in which the Corporation holdsa royalty; development, permitting, infrastructure, operating or technical difficulties on any of the properties in which the Corporation hold a royalty or other interest; rate and timing ofproduction differences from resource estimates or production forecasts by operators of properties in which the Corporation hold a royalty or other interest; risks and hazards associatedwith the business of exploring, development and mining on any of the properties in which the Corporation hold a royalty or other interest, including, but not limited to unusual orunexpected geological and metallurgical conditions, slope failures or cave-ins, flooding and other natural disasters or civil unrest; regulatory changes by national and local government,including corporate law, permitting and licensing regimes and taxation policies; regulations and political or economic developments in any of the countries where properties in which theCorporation hold a royalty or other interest are located or through which they are held); continued availability of capital and financing and general economic, market or businessconditions; business opportunities that become available to, or are pursued by the Corporation; the impossibility to acquire royalties and to fund precious metal streams; other uninsuredrisks. The forward looking statements contained in this presentation are based upon assumptions management believes to be reasonable, including, without limitation: the ongoingoperation of the properties in which the Corporation holds a royalty or other interest by the owners or operators of such properties in a manner consistent with past practice; theaccuracy of public statements and disclosures made by the owners or operators of such underlying properties; no material adverse change in the market price of the commodities thatunderlie the asset portfolio; no adverse development in respect of any significant property in which the Corporation holds a royalty, stream or other interest; the accuracy of publiclydisclosed expectations for the development of underlying properties that are not yet in production; and the absence of any other factors that could cause actions, events or results todiffer from those anticipated, estimated or intended. For additional information on risks, uncertainties and assumptions, please refer to the Corporation’s most recent Annual InformationForm filed on SEDAR at www.sedar.com. The Corporation cautions that the foregoing list of risk and uncertainties is not exhaustive. Investors and others who base themselves on theforward looking statements contained herein should carefully consider the above factors as well as the uncertainties they represent and the risk they entail. The Corporation believes thatthe expectations reflected in those forward-looking statements are reasonable, but no assurance can be given that these expectations will prove to be correct and such forward-lookingstatements included in this presentation should not be unduly relied upon. These statements speak only as of the date of this presentation. The Corporation undertakes no obligation topublicly update or revise any forward-looking statements, whether as a result of new information, future events or otherwise, other than as required by applicable law.
Safe Harbour Statement:This PowerPoint presentation has been prepared for informational purposes only in order to assist prospective investors in evaluating an investment in Osisko Gold Royalties Ltd. Byaccepting delivery of this confidential information or any other material in connection with an investment in the Company, the investor agrees: (1) to keep strictly confidential thecontents of this confidential information presentation and such other material and not to disclose such contents to any third party or otherwise use the contents for any purpose otherthan evaluation by such offered of an investment in the securities; (2) not to copy all or any portion of this confidential PowerPoint presentation, other confidential information or anysuch other material.
Inquiries regarding this confidential PowerPoint presentation can be made to the senior management of the Company.
Forward Looking Statements
2

Osisko is subject to the reporting requirements of the applicable Canadian securities laws, and as a result reports its mineral reserves according to Canadian standards. Canadianreporting requirements for disclosure of mineral properties are governed by NI 43-101. The definitions of NI 43-101 are adopted from those given by the Canadian Institute of Mining,Metallurgy and Petroleum (“CIM”). U.S. reporting requirements are governed by the Commission’s Industry Guide 7 (“Guide 7”). This presentation includes estimates of mineralreserves and mineral resources reported in accordance with NI 43-101. These reporting standards have similar goals in terms of conveying an appropriate level of confidence in thedisclosures being reported, but embody different approaches and definitions. For example, under Guide 7, mineralization may not be classified as a “reserve” unless thedetermination has been made that the mineralization could be economically and legally produced or extracted at the time the reserve determination is made. Consequently, thedefinitions of “Proven Mineral Reserves” and “Probable Mineral Reserves” under CIM standards differ in certain respects from the standards of the Commission. Osisko also reportsestimates of “mineral resources” in accordance with NI 43-101. While the terms “Mineral Resource,” “Measured Mineral Resource,” “Indicated Mineral Resource” and “InferredMineral Resource” are recognized by NI 43-101, they are not defined terms under standards of the Commission and, generally, U.S. companies are not permitted to report estimatesof mineral resources of any category in documents filed with the Commission. As such, certain information contained in this presentation concerning descriptions of mineralizationand estimates of mineral reserves and mineral resources under Canadian standards is not comparable to similar information made public by United States companies subject to thereporting and disclosure requirements of the Commission. Readers are cautioned not to assume that all or any part of Measured Mineral Resources or Indicated Mineral Resourceswill ever be converted into Mineral Reserves. Readers are also cautioned not to assume that all or any part of an Inferred Mineral Resource exists, or is economically or legallymineable. Further, an “Inferred Mineral Resource” has a great amount of uncertainty as to its existence and as to its economic and legal feasibility, and a reader cannot assume thatall or any part of an Inferred Mineral Resource will ever be upgraded to a higher category. Under Canadian rules, estimates of Inferred Mineral Resources may not form the basis offeasibility or other economic studies.
Cautionary Note to U.S. Investors Regarding theUse of Mineral Reserve and Mineral Resource Estimates
3

As at November 28, 2016
TSX & NYSE:OR
$1.4BMARKET CAP
$40.7MOPERATING CASH FLOWYTD 2016
$393M CASH & CASH EQUIVALENTS(at September 30, 2016)
$150-$200MAVAILABLE CREDIT
34,500-37,200 ozATTRIBUTABLE GOLDOUNCES EXPECTED FOR 2016
TWO OF THE PREMIER ROYALTY
ASSETS IN THE GOLD SECTOR
STRONG CASH POSITION
QUARTERLY DIVIDEND
OVER 50 ROYALTIES
TRACK RECORD OF SUCCESS
GOLD FOCUSED
THE LEADING INTERMEDIATE GOLD ROYALTY COMPANY
28,793 ozAuEq YTD 2016
$40.7M IN OPERATING CASH FLOW
YTD 2016
ON TRACK TO ACHIEVE
GUIDANCE
4

$1,379 $1,369
$1,498$1,467
$1,485 $1,491
$1,636 $1,631
$1,743
$1,200
$1,300
$1,400
$1,500
$1,600
$1,700
$1,800
Q3 2014 Q4 2014 Q1 2015 Q2 2015 Q3 2015 Q4 2015 Q1 2016 Q2 2016 Q3 2016
A Great Time to Own Canadian Gold
Osisko Quarterly Realized Gold Price (C$/oz)
Strong upward momentum in Canadian gold price Increased industry activity in Québec/Canadian exploration
Peak London PM Fixing in CAD:$1,877/oz on Sep. 6, 2011
5

$342
$234 $231
$192$164
$143 $138$118
$0
$50
$100
$150
$200
$250
$300
$350
$400
Penasquito Stillwater CanadianMalartic
Detour Lake Cortez Éléonore Gold Quarry Goldstrike
Worldwide Ranking of Gold Royalties - 5% NPV (US$ M)
Osisko holds two of the highest quality gold royalties in the sector
Source: BMO Capital Markets Equity Research. NPV shown using a 5% discount rate and BMO commodity pricing for gold of US$1,292/oz for 2016, US$1,350/oz for 2017,US$1,250/oz for 2018 and US$1,200/oz for 2019 and LT.
High Quality Gold Royalties
6

ZERO-COST GOLD IN CANADA
GOLD EQUIVALENT OUNCES EARNED (oz AuEq)
21% increase in gold equivalent ounces year over year.On track to achieve guidance.
GUIDANCE (oz Au)
34,500 - 37,200 oz Au
2016E
YTD: 28,793
1. Gold equivalent ounces earned is a non-IFRS measure and includes NSR royalties in gold, silver, other cash royalties. Silver was converted to gold equivalent ounces by multiplying the silver ounces by the average silver price for the period and dividing by the average gold price for the period. Cash royalties were converted into gold equivalent ounces by dividing the associated revenue by the average gold price for the period. For Q3 2016, the average per ounce commodity prices were as follows: $1,742 gold (Q3 2015: $1,472), $25.60 silver (Q3 2015: $19.52).
8,264 oz Au
9,902 oz Au
103 oz AuEq (Ag and cash royalties)
201 oz AuEq (Ag and cash royalties)
Q3 2015 Q3 2016
21% Increase
8,367 oz AuEq
10,103 oz AuEq
7

$1.5
$6.5
$12.6
$8.4
$9.8
$15.9$15.0
$0.0
$2.0
$4.0
$6.0
$8.0
$10.0
$12.0
$14.0
$16.0
$18.0
Q1 2015 Q2 2015 Q3 2015 Q4 2015 Q1 2016 Q2 2016 Q3 2016
Increasing Cash Flows
Net Cash Flows from Operating Activities ($C M)
8
Focusing on the Royalty & Streaming Business
Earn-in agreement with Osisko Mining Inc. on Québec exploration properties sets stage for a leaner royalty business
Osisko retains 1.5% - 3.5% NSR royalty
Optionality on northern Québec exploration
Simplifies Osisko’s business model
No longer directly participates in exploration activities (with the exception of the Coulonproject)
Reduces G&A by ~ $5 million per year
28 employees from receptionist to CEO
Further streamlining to take place
9
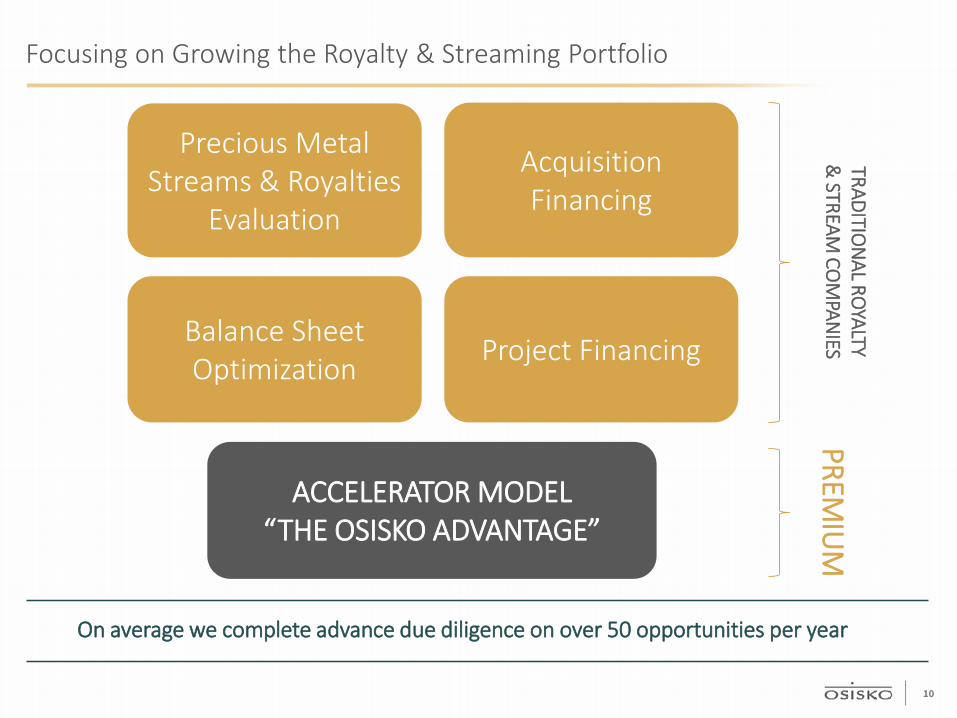
Focusing on Growing the Royalty & Streaming Portfolio
Precious Metal Streams & Royalties
Evaluation
Project Financing
ACCELERATOR MODEL“THE OSISKO ADVANTAGE”
TRADITION
AL ROYALTY
& STREAM
COM
PANIES
PREMIU
M
Balance Sheet Optimization
Acquisition Financing
On average we complete advance due diligence on over 50 opportunities per year
10

(C$ millions) Sept 30, 2016
CASH & CASH EQUIVALENTS $392.7
CONVERTIBLE DEBT $45.6
TOTAL ASSETS $1,399.0
EQUITY $1,200.7
Financial Position
~$600MIN CASH & AVAILABLE CREDIT
STRONG CASH POSITION
Well positioned to compete and add quality assets
STRONG FINANCIAL PARTNERS
11

NEW NYSE LISTING
July 6, 2016
12

Producing Royalties
ÉLÉONORE2.0-3.5% NSR
ISLAND GOLD1.7%-2.55% NSR
VEZZA5% NSR – 40% NPI
CANADIAN MALARTIC5% NSR
IRON ORE COMPANY OF CANADA (LIF)0.7% PASS-THROUGH SALES ROYALTY
13

OPERATORS: Agnico Eagle (50%) / Yamana Gold (50%)
LOCATION: Malartic, Québec
RESERVES: Current reserves of 7.72 M oz Au1
ROYALTY:
5% NSR royalty $0.40/tonne on milled ore from
outside the current property area for life of mill starting in June 2021
2015 PRODUCTION: 572.0 k oz
YTD 2016 PRODUCTION: 445.1 K oz2 (152.9 K oz for Q3)
GUIDANCE: 2016: 560 to 580 k oz 2017: 590 to 600 k oz 2018: 610 k oz
OSISKO ATTRIBUTABLE GOLD OUNCES:
2016: 28.0 to 29.0 k oz 2017: 29.5 to 30.0 k oz 2018: 30.5 k oz
1. See Appendix A for full disclosure on Reserves & Resources.2. Based on Agnico Eagle’s press release dated October 26th, 2016, titled: “Agnico Eagle Reports Third Quarter 2016 Results:…”.
CANADIAN MALARTIC – 5% NSR
THE LARGEST GOLD MINE IN
CANADA
Canadian MalarticProduction (k oz Au)
560-580 k oz outlook
2016
Osisko Gold Royalties Attributable Royalty
Ounces (k oz Au)
28.0-29.0 k oz outlook
2016
YTD: 445.1 K oz09/30/2016
YTD: 22.0 K oz09/30/2016
14

CANADIAN MALARTIC EXPLORATION | ODYSSEY NORTH & SOUTH
113 holes (89,774 metres) completed Showing similarities to the Goldex mine deposit in terms of grade and potential
amenability to underground bulk mining Odyssey North has been traced from a depth of 600 to 1,300 metres below surface
along a strike length of approximately 1.5 kilometres Odyssey South currently has a strike length of 0.5 kilometres, and has been located
between approximately 200 and 550 metres below surface Additional drilling totalling $5.5 million (35,000 metres) has been added to the original
budget of $8.0 million (60,000 metres) for a total of $13.5 million for 2016
OSISKO HOLDS A 5% NSR ROYALTY ON THE ODYSSEY SOUTH ZONE AND A 3% NSR ROYALTY ON THE ODYSSEY NORTH ZONE
Initial inferred mineral resource estimate for the Odyssey zones expected in Q1 2017
15

CANADIAN MALARTIC EXPLORATION | ODYSSEY NORTH & SOUTH
Source: Agnico Eagle 16
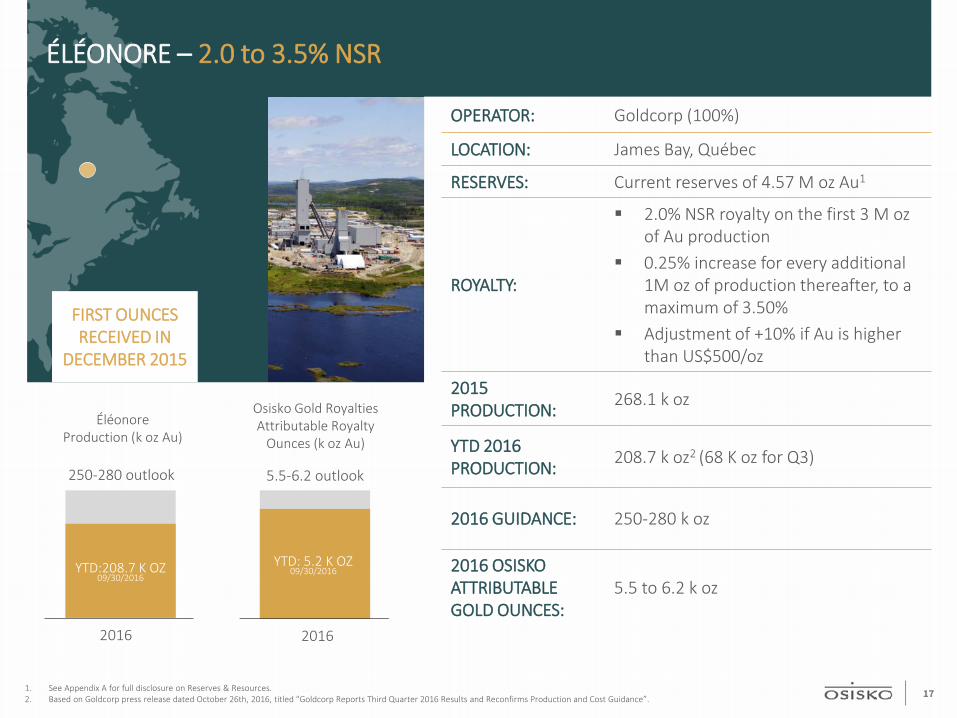
1. See Appendix A for full disclosure on Reserves & Resources.2. Based on Goldcorp press release dated October 26th, 2016, titled “Goldcorp Reports Third Quarter 2016 Results and Reconfirms Production and Cost Guidance”.
OPERATOR: Goldcorp (100%)
LOCATION: James Bay, Québec
RESERVES: Current reserves of 4.57 M oz Au1
ROYALTY:
2.0% NSR royalty on the first 3 M ozof Au production
0.25% increase for every additional 1M oz of production thereafter, to a maximum of 3.50%
Adjustment of +10% if Au is higher than US$500/oz
2015 PRODUCTION: 268.1 k oz
YTD 2016 PRODUCTION: 208.7 k oz2 (68 K oz for Q3)
2016 GUIDANCE: 250-280 k oz
2016 OSISKO ATTRIBUTABLE GOLD OUNCES:
5.5 to 6.2 k oz
ÉLÉONORE – 2.0 to 3.5% NSR
FIRST OUNCES RECEIVED IN
DECEMBER 2015
ÉléonoreProduction (k oz Au)
250-280 outlook
2016
Osisko Gold Royalties Attributable Royalty
Ounces (k oz Au)
5.5-6.2 outlook
2016
YTD:208.7 K OZ09/30/2016
YTD: 5.2 K OZ09/30/2016
17
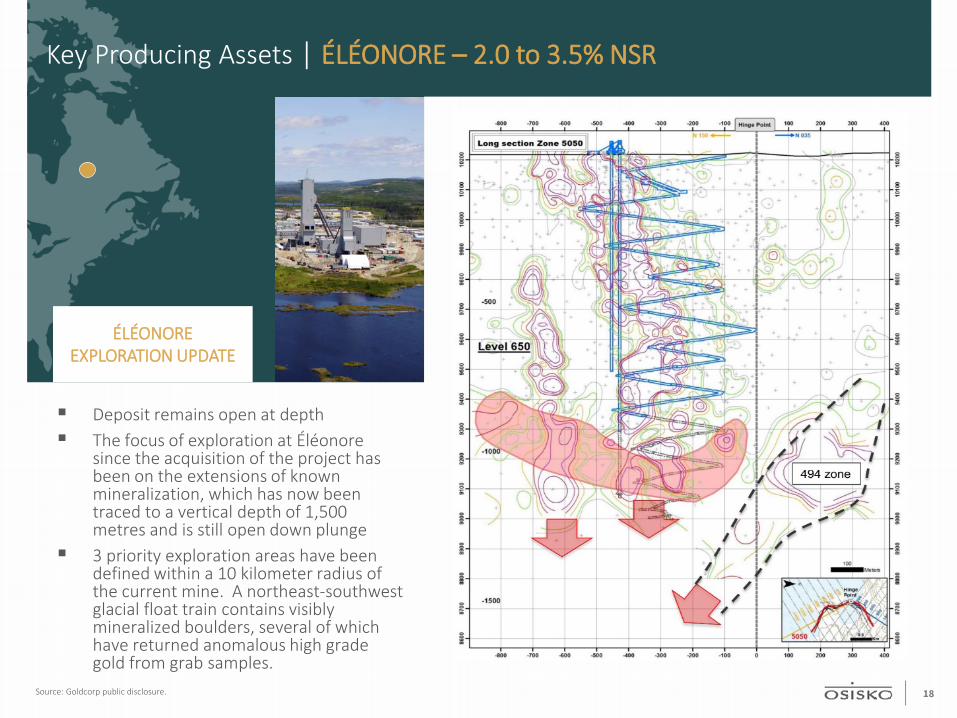
Source: Goldcorp public disclosure.
Deposit remains open at depth The focus of exploration at Éléonore
since the acquisition of the project has been on the extensions of known mineralization, which has now been traced to a vertical depth of 1,500 metres and is still open down plunge
3 priority exploration areas have been defined within a 10 kilometer radius of the current mine. A northeast-southwest glacial float train contains visibly mineralized boulders, several of which have returned anomalous high grade gold from grab samples.
ÉLÉONOREEXPLORATION UPDATE
Key Producing Assets | ÉLÉONORE – 2.0 to 3.5% NSR
18

Operating since 2007 Recently announced an updated PEA
on Deep resources at the Island Gold Mine
2015 production: 55,040 oz Au 142,000m Phase 2 drilling campaign
underway 1,081 oz of gold earned for the first
nine months of 2016
9.8% equity position in Labrador Iron Ore Royalty Corporation (“LIF”)
Investment in LIF provides exposure to Iron Ore Canada (“IOC”)
– 7.0% top-line royalty
– 15% equity interest in IOC
– $0.10/t commission on all iron ore sales by IOC
Equivalent to 0.7% pass-through sales royalty
Operating since 1954
$4.7 million in dividends received for the first nine months of 2016
IRON ORE COMPANY OF CANADA (IOC)
0.7% PASS-THROUGH SALES ROYALTY
ISLAND GOLD 1.7%-2.55%
NSR
Producing Royalties
Operated by Ressources Nottaway inc. (private company)
The property is located 25km from Matagami, Québec
Custom milling at IAMGOLD’s Westwood (Doyon) facility
VEZZA5% NSR40% NPI
19

KEY GROWTH ROYALTIES
ODYSSEY NORTH3% NSRUPPER BEAVER
KIRKLAND LAKE CAMP2% NSR
CARIBOO1.5% NSR
MARBAN0.425% NSR
LAMAQUE1.7% NSR
PANDORA2% NSR
WINDFALL1.5% NSR
HERMOSA1% NSR
HORNE 51% NSR
GUERRERO9,600 KM2 AREA IN
GUERRERO, MEXICO
EXPLORATION PROPERTIES
OVER 50 ROYALTIES IN THE
PORTFOLIO TO PROVIDE UPSIDE
TO “OR” SHAREHOLDERS
FOCUSED ON NORTH AMERICA
JAMES BAY – LABRADOR TROUGH PROPERTIES
(OSK)1.5% - 3.5%
COULON POLYMETALLIC
PROJECT
20

Positive Royalty Portfolio Developments
HORNE 5ROYALTY: 1% NSR Significant increase in resource: 7.1 M oz AuEq M&I / 1.7 M oz AuEq Inferred $36.5 M bought deal financing completed in November 2016 35,000 m of drilling in 2016 will expand project footprint.
ODYSSEYROYALTY: 3-5% NSR 89,774 m drilled in 2016 Maiden resource expected in Q1 2017
HERMOSA
ROYALTY: 1% NSR Maiden resource announced on Taylor deposit:
31.1 M tons at 10.9% ZnEq Indicated / 82.7 M tons at 11.1% ZnEq Inferred Deposit still open in all directions Aggressive drilling to continue on the property
WINDFALLROYALTY: 1.5% NSR 150,000 m drilling program ongoing Advanced exploration programs ongoing to define deposit
MARBANROYALTY: 0.425% NSR New resource announced in 2016: 1.48 M oz M&I / 0.13 M oz Inferred 20,000 m drilling in 2016
Significant progress on Osisko’s royalty properties; Over 50 royalties in Osisko’s portfolio
ISLAND GOLDROYALTY: 1.7-2.55% NSR 172,000 m drilling campaign PEA underway for expansion to 1,100 tpd Increased 2016 gold production guidance to 75-80 k oz
21
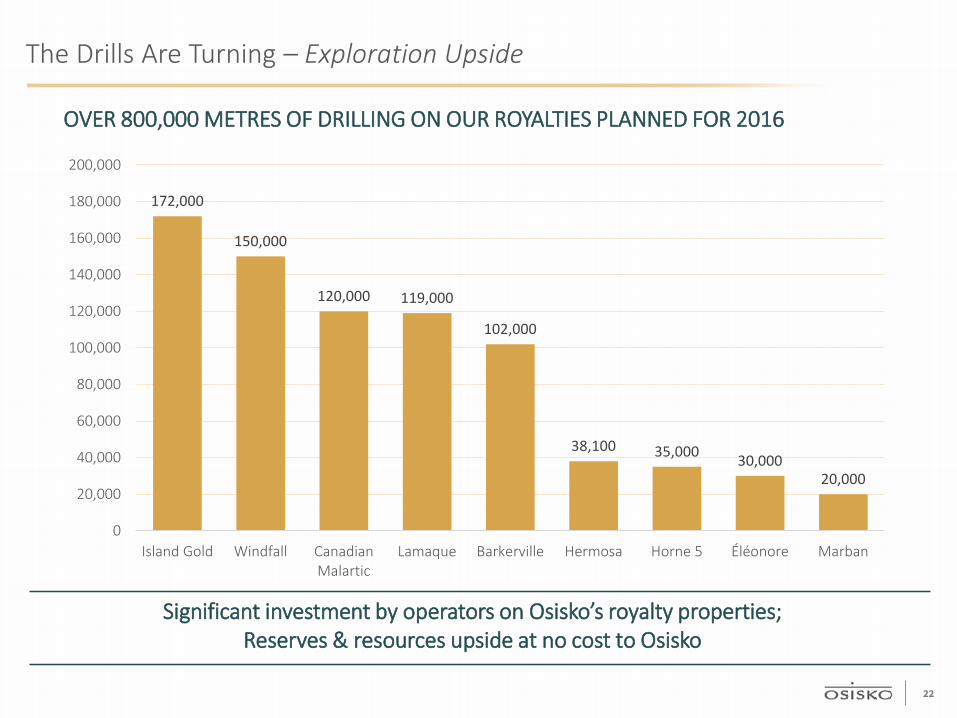
Significant investment by operators on Osisko’s royalty properties; Reserves & resources upside at no cost to Osisko
The Drills Are Turning – Exploration Upside
OVER 800,000 METRES OF DRILLING ON OUR ROYALTIES PLANNED FOR 2016
172,000
150,000
120,000 119,000
102,000
38,100 35,000 30,00020,000
0
20,000
40,000
60,000
80,000
100,000
120,000
140,000
160,000
180,000
200,000
Island Gold Windfall CanadianMalartic
Lamaque Barkerville Hermosa Horne 5 Éléonore Marban
22

Accelerator Model
FUNDAMENTAL CONCEPT
Use Osisko’s solid experience in exploration, engineering, construction & financing to advance projects on which Osisko owns royalties
Support accelerator companies at board level and key management roles Maintain key shareholder position to drive further benefits to OR
Tax efficient way of deploying capital as investments in flow-through shares shelter royalty income
KEY ACCELERATOR COMPANIES
OR Representation:
CEO: Luc LessardCFO: Vincent MetcalfeChairman: Sean RoosenEquity Investment: $3.7 millionRoyalty Investment: $10.0 millionRoyalty: 1% NSRStream: Ability to apply royalty as
prepayment against a gold/silver stream
OR Representation:
CEO: John BurzynskiChairman: Sean RoosenEquity Investment: $28.2 millionRoyalty Investment: $9.8 millionRoyalties: 1.5% NSR Windfall
0.425% Marban
23

Accelerator Model – Acquiring Royalties at Discounted Valuations
Net Cost of Royalty Purchase at Sept 30, 2016 (C$ M)
Purchased a 1.5% NSR in February 2016 Purchased a 1% NSR in April 2016
1. Non-IFRS measure representing the difference between the fair value of marketable securities less acquisition cost
$25.0
$18.1 1
$6.9
Cost to purchaseroyalty
Unrealized gain onequity investment
Net cost of royalty
$10.0
$17.9 1
($7.9)Cost to purchase
royaltyUnrealized gain onequity investment
Net cost of royalty
24

Significant Value in Investment Portfolio
Value of Investment Portfolio1 (C$ M)
Unrealized gain2 of approximately $114 million at quarter end
1. Fair value of marketable securities in associates and other as at September 30, 2016, excluding Labrador Iron Ore Royalty Corporation2. Non-IFRS measure representing the difference between the fair value of marketable securities less acquisition cost
$148.6
$262.5
Cost Base Market Value at Sep. 30, 2016
25

Key Objectives – Next 12 Months
Add Long Life Cornerstone Cash Flow Asset
Continue to develop accelerator model through Supporting Project Financing Opportunities
26
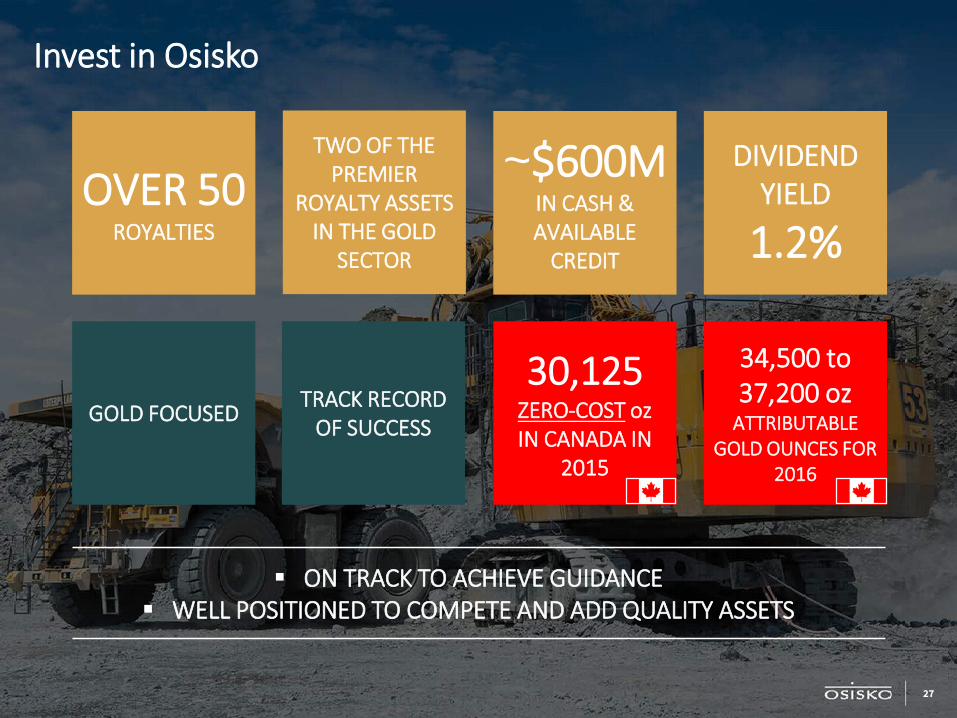
Invest in Osisko
OVER 50ROYALTIES
~$600MIN CASH & AVAILABLE
CREDIT
DIVIDEND YIELD
1.2%
TWO OF THE PREMIER
ROYALTY ASSETS IN THE GOLD
SECTOR
GOLD FOCUSED TRACK RECORD OF SUCCESS
30,125ZERO-COST ozIN CANADA IN
2015
34,500 to 37,200 oz
ATTRIBUTABLE GOLD OUNCES FOR
2016
ON TRACK TO ACHIEVE GUIDANCE WELL POSITIONED TO COMPETE AND ADD QUALITY ASSETS
27

Appendix A – Reserves & Resources

Appendix A – Reserves and Resources
1. Agnico Eagle and Yamana public disclosure – as at December 31, 20152. See Goldcorp press release dated October 26, 2016, titled “Goldcorp Reports Third Quarter 2016 Results and Reconfirms Production and Cost Guidance”.3. See Richmont press release dated February 9, 2016, titled “Richmont Increases Mineral Reserves by 187% and Island Gold Mine Increases Mineral Reserves by 206%, With a 29% Increase in Reserve Grade”
CANADIAN MALARTIC1
RESERVES*
CATEGORY AU GRADE (G/T) AU (M OZ) TONNES (MT)
Proven 0.97 1.72 54.9
Probable 1.12 6.00 166.6
Total Proven & Probable 1.08 7.73 221.5
*Cut-off grade: 0.345-0.351 g/t | Gold Price: $1,150/oz Au
GLOBAL RESOURCES (EXCLUDING RESERVES)*
CATEGORY AU GRADE (G/T) AU (M OZ) TONNES (MT)
Measured 1.32 0.15 3.5
Indicated 1.55 1.10 22.2
Total Meas. & Ind. 1.51 1.25 25.7
Inferred 1.47 0.43 9.0*Cut-off grade: 0.34-0.40 g/t and 1.0 g/t below open pit | Gold Price: $1,150/oz Au | exchange rate of CAN$1.24 = US$1.00
ÉLÉONORE2
RESERVES*
CATEGORY AU GRADE (G/T) AU (M OZ) TONNES (MT)
Total Proven & Probable 6.07 4.57 23.44
GLOBAL RESOURCES (EXCLUDING RESERVES)
CATEGORY AU GRADE (G/T) AU (M OZ) TONNES (MT)
Total Meas. & Ind. 5.66 0.93 5.14
Inferred 7.52 2.35 9.73
ISLAND GOLD3
RESERVES - ABOVE 400M*
CATEGORY AU GRADE (G/T) AU (K OZ) TONNES (KT)
Proven 7.00 21.80 97.0
Probable 6.88 54.90 248.0
Total Proven & Probable 6.91 76.70 345.0
GLOBAL RESOURCES (EXCLUDING RESERVES) – ABOVE 400M*
CATEGORY AU GRADE (G/T) AU (K OZ) TONNES (KT)
Measured 5.80 1.35 7.5
Indicated 6.96 52.7 235.5
Total Meas. & Ind. 6.92 54.1 243.0
Inferred 7.44 98.7 412.5
*Based on a gold price of US$1,300/oz and an exchange rate of CAN$1.2037 = US$1.00.
RESERVES – BELOW 400M*
CATEGORY AU GRADE (G/T) AU (K OZ) TONNES (KT)
Proven 7.72 66.1 266.5
Probable 8.66 418.9 1,504.0
Total Proven & Probable 8.52 485.0 1,770.5
GLOBAL RESOURCES (EXCLUDING RESERVES) – BELOW 400M*
CATEGORY AU GRADE (G/T) AU (K OZ) TONNES (KT)
Indicated 5.20 17.65 105.5
Inferred 8.67 669.35 2,402.5
*Based on a gold price of US$1,300/oz and an exchange rate of CAN$1.2037 = US$1.00.
29
Appendix B – Q3 Results

2016 Q3 Results
3 MONTHS ENDED
(C$ 000) Sept 30, 2016 Sept 30, 2015
GOLD PRODUCTION (oz) 9,902 8,264
SILVER PRODUCTION (oz) 9,234 7,780
REALIZED GOLD PRICE (C$ per oz) 1,743 1,485
REVENUES $17,570 $11,724
DIVIDEND INCOME $1,572 $1,560
NET CASH FLOW FROM OPERATIONS $14,978 $12,594
NET EARNINGS $17,675 $9,809
NET EARNINGS PER SHARE - BASIC $0.17 $0.10
Investments in flow-through shares (accelerator model) in 2016have contributed to offsetting taxes on royalty income
31