oslo “implications of paris” workshop 0 - scenarios for decarbonizing the european electricity...
TRANSCRIPT

- 0 -
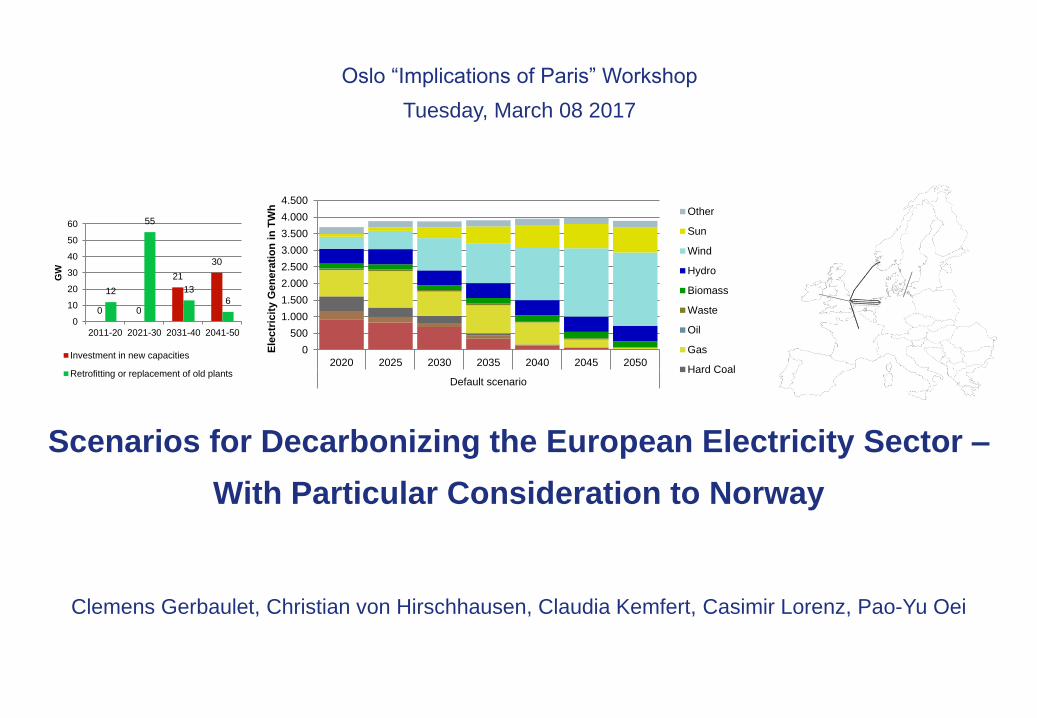
Scenarios for Decarbonizing the European Electricity Sector –
With Particular Consideration to Norway
Oslo “Implications of Paris” Workshop
Tuesday, March 08 2017
Clemens Gerbaulet, Christian von Hirschhausen, Claudia Kemfert, Casimir Lorenz, Pao-Yu Oei
0 0
21
30
12
55
13
6
0
10
20
30
40
50
60
2011-20 2021-30 2031-40 2041-50
GW
Investment in new capacities
Retrofitting or replacement of old plants
0
500
1.000
1.500
2.000
2.500
3.000
3.500
4.000
4.500
2020 2025 2030 2035 2040 2045 2050
Default scenario
Ele
ctr
icit
y G
en
era
tio
n i
n T
Wh
Other
Sun
Wind
Hydro
Biomass
Waste
Oil
Gas
Hard Coal

- 1 -
Agenda
1. Introduction
2. Decarbonization scenarios
3. Focus on Norway (1): generation
4. Focus on Norway (2): infrastructure
5. Conclusion

- 2 -
Conclusions
1/ The electricity sector is fairly easy to decarbonize based on a
combination of wind, solar & storage + biomass
2/ The generation mix in Norway is not significantly altered, some onshore
and offshore wind kicks in, + some storage; Norway remains a large
exporter
3/ Infrastructure has an important, but limited role to play: “regional
cooperation” dominates the European-wide cooper plate

- 3 -
Agenda
1. Introduction
2. Decarbonization scenarios
3. Focus on Norway (1): generation
4. Focus on Norway (2): infrastructure
5. Conclusion

- 4 -
Objective: large-scale decarbonization of the European
electricity sector
1274,7 1273,2
965,3
818,5
597,7
458,1
270,2
89,7
18,9
0
200
400
600
800
1000
1200
1400
2005 2010 2015 2020 2025 2030 2035 2040 2045 2050 2055
Ava
ila
be
CO
2 e
mis
sio
ns
in
Mt

- 5 -
Objective: large-scale decarbonization of the European
electricity sector Objective: System Cost minimization
• Capacity Cost and Generation Cost
• Investment cost (Cost data based on Schröder et al. (2013) and Pape et al. (2014), Zerrahn and Schill (2015) for storage and DSM, as well as other sources)
• Cross-border line expansion cost
Investment options:
• Conventional power plants
• Renewables (PV, Wind Onshore/Offshore, CSP)
• Seven storage and three DSM technologies (P/E Ratio endogenous)
• Grid expansion (increase of NTCs)
Resolution:
• 33 European Countries, one node per country
• Investment: five-year steps 2020 - 2050
• plant dispatch: hourly resolution over selection of hours (about 2 weeks) capturing:
Variation of time-of day
Variation of season
Scaled renewable feed-in, reservoir inflow, and demand time series
Boundary conditions: EC Roadmap scenario “Diversified supply technologies”
• Electricity demand development per country
• CO2-budget over time
Other Boundary Conditions
• Decommissioning of existing plants
• Market coupling method: NTC or Flow-Based
At the moment: very limited sector coupling between the electricity and heat sector, no interaction with electric vehicles
Implemented as a linear program, solved with GUROBI (Barrier with Crossover)
1274,7 1273,2
965,3
818,5
597,7
458,1
270,2
89,7 18,9
0
200
400
600
800
1000
1200
1400
2000 2010 2020 2030 2040 2050 2060
Availab
e C
O2 e
mis
sio
ns
in
Mt
AC line aggregation to PTDF:
𝑃𝑇𝐷𝐹𝑙,𝑛𝑛 = 𝐻𝑙,𝑛 ∗ 𝐵𝑛,𝑛𝑛−1
𝑛
𝑃𝑇𝐷𝐹𝑙,𝑧𝑙𝑖𝑛𝑒𝑧𝑜𝑛𝑎𝑙 =
𝑃𝑇𝐷𝐹𝑙,𝑛𝑐𝑜𝑢𝑛𝑡 𝑛 ∈ 𝑧
𝑛∈𝑧
∀𝑖𝑐
𝑃𝑇𝐷𝐹𝑧,𝑧𝑧,𝑧𝑧𝑧𝑧𝑜𝑛𝑎𝑙 = 𝑃𝑇𝐷𝐹𝑙𝑙,𝑧𝑧𝑧
𝑙𝑖𝑛𝑒𝑧𝑜𝑛𝑎𝑙
𝑘
− 𝑃𝑇𝐷𝐹𝑙𝑙𝑙,𝑧𝑧𝑧𝑙𝑖𝑛𝑒𝑧𝑜𝑛𝑎𝑙
𝑗

- 7 -
Scenarios: Default, “reduced foresight“, “budget approach“
• Default scenario
perfect foresight over entire horizon
(2015-2050)
Yearly CO2 constraint, in 2050 only 2%
of current level
• Reduced foresight scenario
decisions makers only aware of the CO2 target of the upcoming five-year period,
Used to identify stranded investments resulting from such a myopic vision;
• Budget approach
aggregate emission budget for the entire period from 2015 to 2050
Emission allocation over time endogenous, allows for a higher degree of decision
Assumption: abatement takes place earlier
Three main scenarios

- 8 -
European electricity generation in the default scenario 2020–2050
0
500
1.000
1.500
2.000
2.500
3.000
3.500
4.000
4.500
2020 2025 2030 2035 2040 2045 2050
Default scenario
Ele
ctr
icit
y G
en
era
tio
n in
TW
h
Other
Sun
Wind
Hydro
Biomass
Waste
Oil
Gas
Hard Coal
Lignite
Uranium

- 9 -
European electricity generation capacity the default scenario 2020–
2050
0
500
1000
1500
2000
2500
2020 2025 2030 2035 2040 2045 2050
Default scenario
Ele
ctr
icit
y G
en
era
tio
n C
ap
acit
y i
n G
W
Storage
Other
Sun
Wind
Hydro
Biomass
Waste
Oil
Gas
Hard Coal
Lignite
Uranium

- 10 -
CO2 price increases after 2040; is flat at 80% decarb pathway
0
20
40
60
80
100
120
140
160
180
200
2015 2020 2025 2030 2035 2040 2045 2050
CO
2 P
rice
in
201
5 €
/Mt
Default scenario 80% decarbonization pathway
• In the default scenario, CO2 prices remain at a similar level until 2040
• When the emission constraint tightens, the CO2 price increases to 175€/t
• In the 80% decarbonization scenario, the price remains stable
CO2 price development 2015 - 2050

- 13 -
Investment difference in Reduced Foresight scenario vs Default
11,0
4,2
3,0 2,5
2,1 1,9 1,7 1,4 1,3
1,0 0,8 0,7 0,6 0,5 0,5 0,4 0,3 0,2
-6
-4
-2
0
2
4
6
8
10
12
DE CH FI PL HR RS UK NL BE BA HU EE MK RO IE CZ LU SI
GW
Gas
Hard Coal
Sum

- 14 -
Comparing CO2-Emissions over time in the Default and Emissions
budget scenario
-100
-50
0
50
100
150
2020 2025 2030 2035 2040 2045 2050
Mil
lio
n t
CO
2 Biomass
Waste
Oil
Gas
Hard Coal
Lignite

- 19 -
How about nuclear and CCTS?
Investment Cost Assumptions (€/kW)
0
1000
2000
3000
4000
5000
6000
7000
2015 2020 2025 2030 2035 2040 2045 2050
Nuclear
Biomass
PV
CSP
Wind onshore
Wind offshore
Lignite CCS
Coal CCS
CCGT CCS
Li-Ion
DSM12
Biomass CCS
Source: DIW Data Documentation 68, own assumptions

- 20 -
Investment cost assumptions for selected technologies
0
500
1000
1500
2000
2500
3000
3500
4000
2015 2020 2025 2030 2035 2040 2045 2050
Ov
ern
igh
t co
st i
n €
/kW
Biomass Wind Onshore Wind Offshore Solar PV Battery 4 hours Battery 8 hours Power to Gas
Cost Assumptions
• DIW Berlin Data Documentations Schröder et
al. (2013) and XXX (2017)
• Nuclear power
• 6000 €/kW
• no economics from “nth-of-a-kind” plants
• Storage and DSM
• based on Pape et al. (2014) and
• Zerrahn and Schill (2015)
• CCTS technologies are implemented as
sensitivity
• Renewables
• Solar PV cost degression to continue.
• Offshore wind less steep learning curves,
higher uncertainty
• Biomass most expensive renewable
source.

- 21 -
Francois Lévêque (2012):
„The nuclear industry is the child of science and warfare“

- 22 -

- 23 -
Looking back …
…no-one ever pretended nuclear was „economic“ …
MIT (2003): The Future of Nuclear Power
“In deregulated markets, nuclear power is not now cost competitive with coal and natural gas.” (p. 3)
University of Chicago (2004):
“A case can be made that the nuclear industry will start near the bottom of its learning rate when new nuclear construction occurs. (p. 4-1) … “The nuclear LCOE for the most favorable case, $47 per MWh, is close but still above the highest coal cost of $41 per MWh and gas cost of $45 per MWh.” (p. 5-1)
Parsons/Joskow (EEEP 2012)
“may be one day …”
D’haeseleer (2013): Synthesis on the Economics of Nuclear Energy
“Nuclear new build is highly capital intensive and currently not cheap, … it is up to the nuclear sector itself to demonstrate on the ground that cost-effective construction is possible.” (p. 3)
Davis, L.W. (2012): Prospects for Nuclear Power. Journal of Economic Perspectives (26, 49–66))
“These external costs are in addition to substantial private costs. In 1942, with a shoestring budget in an abandoned squash court at the University of Chicago, Enrico Fermi demonstrated that electricity could be generated using a self-sustaining nuclear reaction. Seventy years later the industry is still trying to demonstrate how this can be scaled up cheaply enough to compete with coal and natural gas.“ (p. 63)

- 24 -
Davis (2012; JEP, p. 11): „70 years later …“
current update for Europe (own calc.)
Levelized costs in €cents/kWh
Nuclear Coal Natural Gas
Baseline (2016) 12,1 5,1 5,0
CO2-price: 25 €/t 12,1 6,3 5,7
CO2-price: 100 €/t 12,1 10,0 7,9

- 31 -
CCTS in Europe: no successful large-scale
demonstration project to date
Source: BOLESTA (2009)

- 32 -
Option: Carbon Capture, Transportation, and Storage (CCTS)?

- 36 -
Agenda
1. Introduction
2. Decarbonization scenarios
3. Focus on Norway (1): generation
4. Focus on Norway (2): infrastructure
5. Conclusion

- 37 -
Installed Capacity in Norway (2050):
Some onshore and offshore wind, storage only late (PtG)
0
10
20
30
40
50
60
70
2020 2025 2030 2035 2040 2045 2050
Default Scenario
Inst
all
ed C
ap
aci
ty i
n G
W
Storage
Solar PV
Wind Offshore
Wind Onshore
Hydro
Biomass
Other
Gas
- 38 -
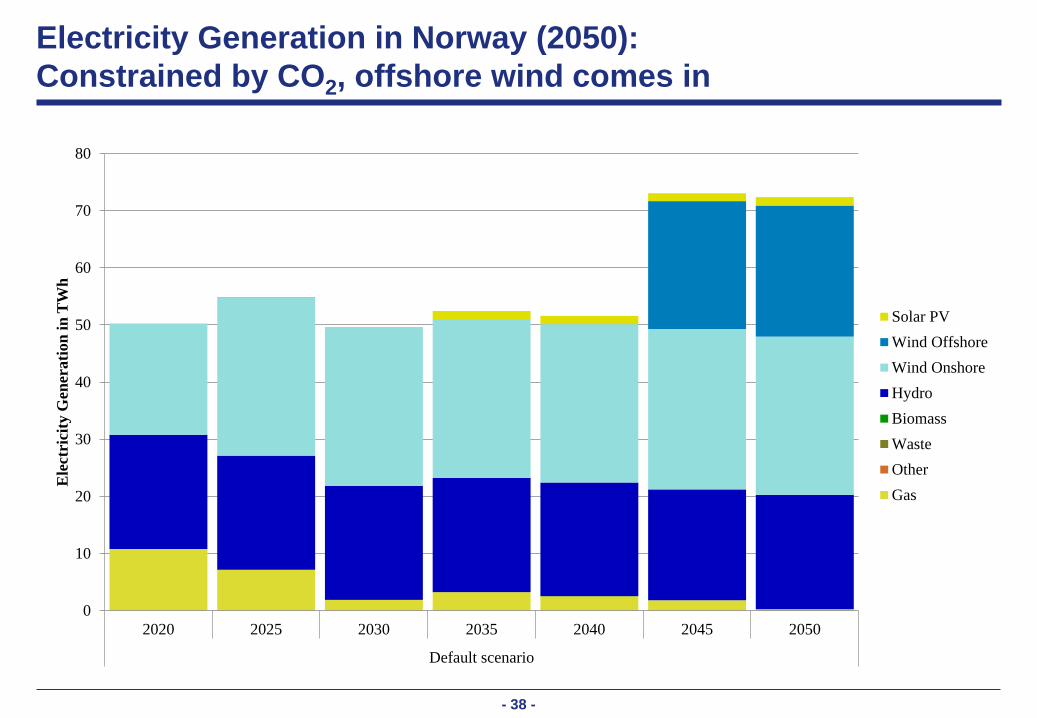
Electricity Generation in Norway (2050):
Constrained by CO2, offshore wind comes in
0
10
20
30
40
50
60
70
80
2020 2025 2030 2035 2040 2045 2050
Default scenario
Ele
ctri
city
Gen
erati
on
in
TW
h
Solar PV
Wind Offshore
Wind Onshore
Hydro
Biomass
Waste
Other
Gas

- 41 -
Norway February dispatch (2050):
Strong demand from France/Germany/Europe, some storage
-20
-15
-10
-5
0
5
10
15
20
25
30
35
821
828
835
842
849
856
863
870
877
884
891
898
905
912
919
926
933
940
947
954
961
968
975
982
989
996
1003
1010
1017
1024
1031
1038
1045
1052
1059
1066
1073
1080
1087
1094
1101
1108
1115
1122
1129
1136
1143
1150
Ele
ctri
city
gen
erati
on
in
GW
Gas Other Biomass Hydro Wind Onshore Wind Offshore Solar PV Storage Trade Demand

- 42 -
Dispatch 2050 Germany in February shows substantial imports
-100
-50
0
50
100
150
821
828
835
842
849
856
863
870
877
884
891
898
905
912
919
926
933
940
947
954
961
968
975
982
989
996
1003
1010
1017
1024
1031
1038
1045
1052
1059
1066
1073
1080
1087
1094
1101
1108
1115
1122
1129
1136
1143
1150
Hour
Ele
ctri
city
gen
erati
on
in
GW
Hard Coal Gas Other Biomass Hydro Wind Onshore
Wind Offshore Solar PV Storage Trade DSM Demand
Hour-to-hour operation of the German electricity system in 2050 (first two weeks of February)
• German electricity imports in February 2050 come in decreasing order from Denmark, Switzerland,
Netherland, France and Austria.
• The imports and exports with Sweden and Poland are even in total
• Germany exports 960MW on average to the Czech Republic.

- 44 -
Norway Summer dispatch (2050):
Solar in Europe dominates, exports remain strong
-20
-15
-10
-5
0
5
10
15
20
25
30
4348
4355
4362
4369
4376
4383
4390
4397
4404
4411
4418
4425
4432
4439
4446
4453
4460
4467
4474
4481
4488
4495
4502
4509
4516
4523
4530
4537
4544
4551
4558
4565
4572
4579
4586
4593
4600
4607
4614
4621
4628
4635
4642
4649
4656
4663
4670
4677
Ele
ctri
city
gen
erati
on
in
GW
Gas Other Biomass Hydro Wind Onshore Wind Offshore Solar PV Storage Trade Demand

- 45 -
Agenda
1. Introduction
2. Decarbonization scenarios
3. Focus on Norway (1): generation
4. Focus on Norway (2): infrastructure
5. Conclusion

- 48 -
The European Context: Infrastructure European-wide network development: less promising than in the last decade
Quellen: SRU (2010), ECF (2010, 2011), Czisch (2005)
Reasons for delay:
• Consideration of real economic difficulties in implementing theoretically „ideal“ network structures
• Geopolitical changes/modifications in partner regions (e.g. North Africa, Russia, etc.)
• Public debate about infrastructure
• „Experience“: first draft of the Single Electricity Market back in 1988
?

- 49 -
The right level of cooperation
Competing Levels for the Investment Challenge
European coordinating institutions …
… in place … not in place
Geographic
Scope …
… Europe-wide 1) “Europe centralized” ./.
… Regional 2) “Regional +” 3) “National”
Source: Beckers, Hoffrichter, and von Hirschhausen (2012)

- 53 -
ELMOD Application:
Expansion Pathways for the European Transmission Network
Pan-European Transmission Investment for the
EMF28 Scenarios
• Question: How do the different EMF 28 scenarios in
their choice of technology and national allocation
effect the demand on infrastructure investments?
• Bottom up DC Load Flow model based on ELMOD
(3,523 nodes and 5,145 lines plus DC overlay grid)
• Endogenous determination of grid investments
needs up to 2050 in 10-year steps. The optimization
minimizes the cost of the expansion as well as
system operation.
• Model runs for the EMF28-Scenarios
• 40%DEF (40% GHG reduction until 2050),
• 80%DEF (80% GHG reduction until 2050)
• 80%GREEN (green, 80% GHG reduction till 2050)
• Additional case for each scenario: doubling of
costs for cross border lines

- 54 -
Long-Term EMF Scenarios for Europe 2050:
Technology Specific Generation Capacity for Europe
Primes results in a European context; main aspects:
• Renewable generation capacities
• CCTS as an option?; nuclear/coal vs. gas share with increasing renewable capacities
Scenarios:
• 40%DEF ~ 40% GHG reduction target to 2050, default power plants
• 80%DEF ~ 80% GHG reduction target to 2050, default power plants
• 80%GREEN ~ 80% GHG reduction target to 2050, more Renewables
40%DEF 80%DEF 80%GREEN

- 57 -
DC Investments by 2050
40%DEF: “40% GHG reduction” 80%DEF: “80% GHG reduction” 80%GREEN: 80% reduction + “green”
DC Grid infrastructure investments mostly offshore connectors

- 59 -
Agenda
1. Introduction
2. Decarbonization scenarios
3. Focus on Norway (1): generation
4. Focus on Norway (2): infrastructure
5. Conclusion

- 60 -
Conclusions
1/ The electricity sector is fairly easy to decarbonize based on a
combination of wind, solar & storage + biomass
2/ The generation mix in Norway is not significantly altered, some onshore
and offshore wind kicks in, + some storage; Norway remains a large
exporter
3/ Infrastructure has an important, but limited role to play: “regional
cooperation” dominates the European-wide cooper plate
- 61 -
Scenarios for Decarbonizing the European Electricity Sector –
With Particular Consideration to Norway
Oslo “Implications of Paris” Workshop
Tuesday, March 08 2017
Clemens Gerbaulet, Christian von Hirschhausen, Claudia Kemfert, Casimir Lorenz, Pao-Yu Oei
0 0
21
30
12
55
13
6
0
10
20
30
40
50
60
2011-20 2021-30 2031-40 2041-50
GW
Investment in new capacities
Retrofitting or replacement of old plants
0
500
1.000
1.500
2.000
2.500
3.000
3.500
4.000
4.500
2020 2025 2030 2035 2040 2045 2050
Default scenario
Ele
ctr
icit
y G
en
era
tio
n i
n T
Wh
Other
Sun
Wind
Hydro
Biomass
Waste
Oil
Gas
Hard Coal