oss weekly · pdf fileoss weekly newsletter contents weekly review for the week beginning...
TRANSCRIPT

P a g e | 1
http://oss.cc
OSS WEEKLY NEWSLETTER
Contents WEEKLY REVIEW For the week beginning 06/27/2016 ................................................................................ 3
OSS Indicator Calendar Results ................................................................................................................. 3
Trading results .......................................................................................................................................... 4
Options & Binary Options ...................................................................................................................................... 4
OSS CYCLES ............................................................................................................................................................ 5
Cycle Forecast Results ............................................................................................................................... 6
Indicator reviews....................................................................................................................................... 7
NASDAQ 100 FORECAST .......................................................................................................................... 10
NEXT WEEK’S OUTLOOK .............................................................................................................................. 11
MMA Free Weekly Comments ................................................................................................................ 11
Trading-Daze ........................................................................................................................................... 14
S&P 500 ............................................................................................................................................................... 14
Gold ..................................................................................................................................................................... 14
OEX Trading Resources ........................................................................................................................... 15
SPX & COMPOSITE CHART .......................................................................................................................... 16
LINKS ........................................................................................................................................................... 16
P a g e | 2
http://oss.cc
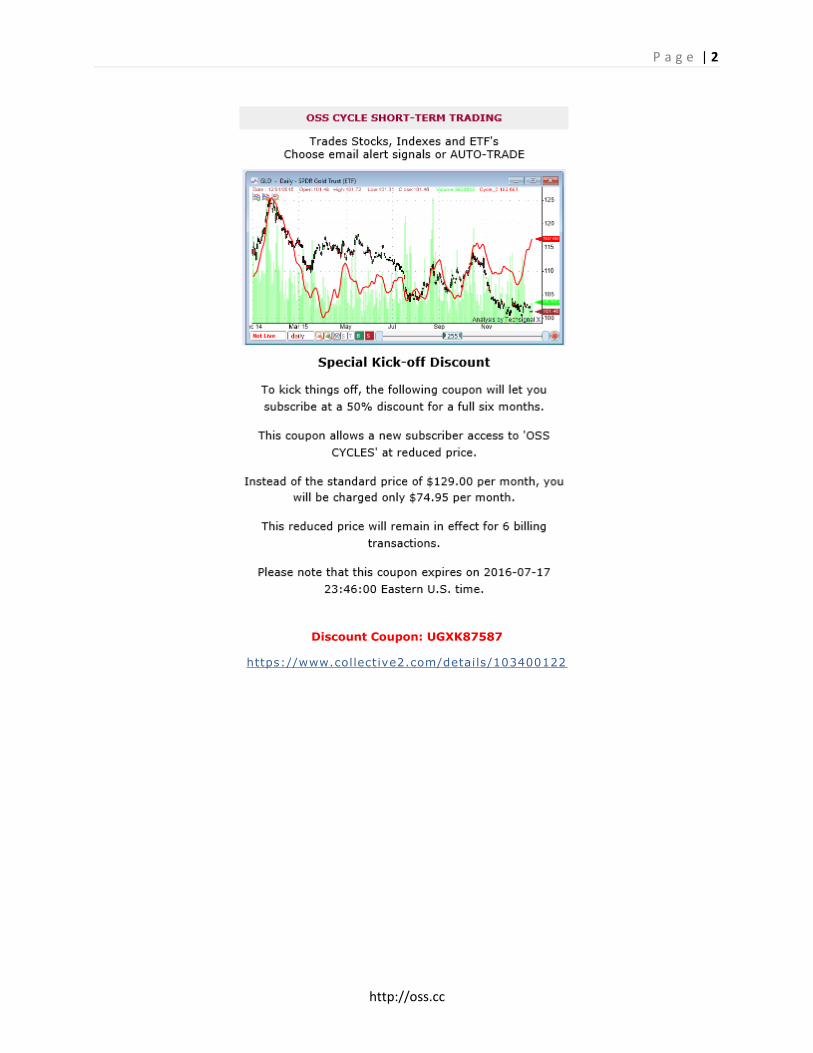
Discount Coupon: UGXK87587
https://www.collective2.com/details/103400122

P a g e | 3
http://oss.cc
WEEKLY REVIEW For the week beginning 06/27/2016
OSS Indicator Calendar Results
Volatility indicators were the most active I have seen them. And we saw the results with 4 days last week that saw the DJIA make 3-digit moves.

P a g e | 4
http://oss.cc
Trading results
Options & Binary Options
Trades Closed Last Week
SPY JULWK1 204.5 PUTS 06/29/16 $0.98 06/29/16 $1.96 100%
NADEX BINARY SILVER (SEP) > 19.11 07/01/16 $49.25 07/01/16 $100.00 100%
NADEX BINARY US 500 (SEP) > 2092.0 07/01/16 $43.50 07/01/16 $56.50 128%
P a g e | 5
http://oss.cc
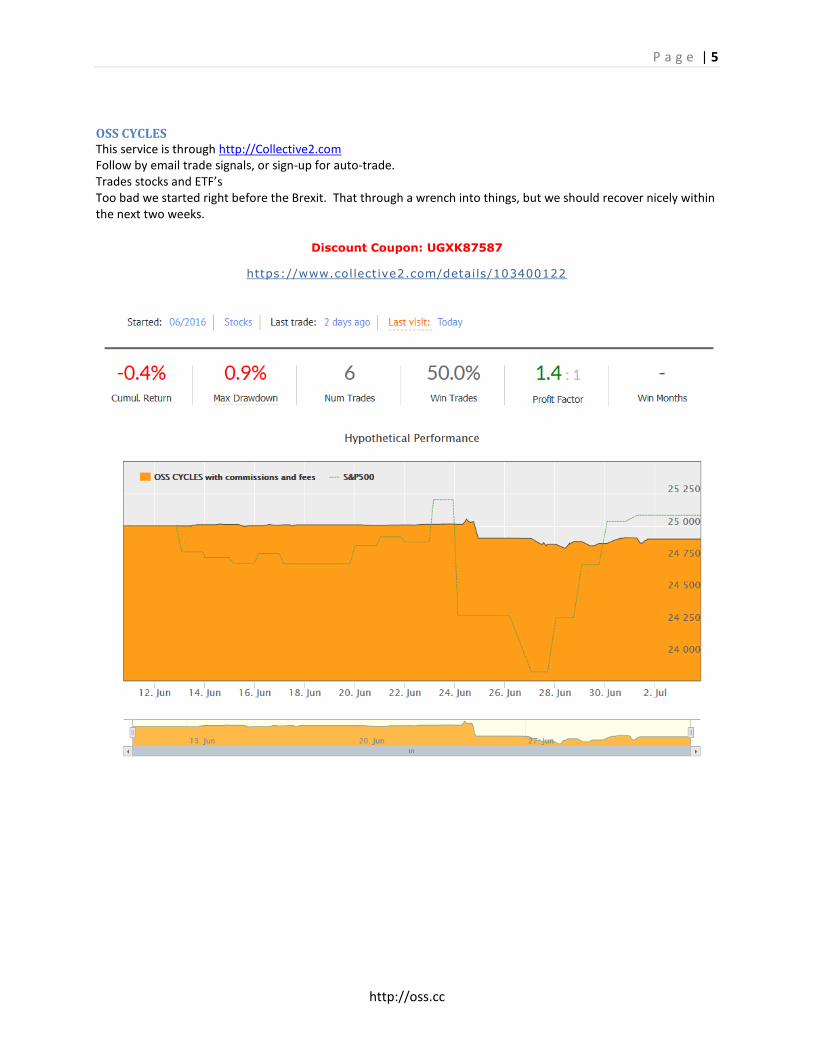
OSS CYCLES This service is through http://Collective2.com Follow by email trade signals, or sign-up for auto-trade. Trades stocks and ETF’s Too bad we started right before the Brexit. That through a wrench into things, but we should recover nicely within the next two weeks.
Discount Coupon: UGXK87587
https://www.collective2.com/details/103400122

P a g e | 6
http://oss.cc
Cycle Forecast Results

P a g e | 7
http://oss.cc
Indicator reviews

P a g e | 8
http://oss.cc

P a g e | 9
http://oss.cc

P a g e | 10
http://oss.cc
NASDAQ 100 FORECAST
That worked out quite well last week.

P a g e | 11
http://oss.cc
NEXT WEEK’S OUTLOOK
MMA Free Weekly Comments Source: http://new.mmacycles.com/index.php?route=common/home
REVIEW AND PREVIEW Markets will be closed in the USA on Monday, July 4, in observance of Independence Day. Mars ended its retrograde motion last week, June 29, and the global panic in equity markets, caused by the Brexit vote in the UK, also ended last week. Most of the world stock indices ended their sharp declines on either Friday, June 24, or Monday, June 27, as Mars was stationary at 23° Scorpio. This was clearly in the time band for a bottom, based on the history of Mars in this degree. As discussed in last week’s column, “The good news is that this geocosmic signature (Mars ending its retrograde motion) indicates that this decline – this crash, this particular flight of this particular Black Swan – is due to end shortly, to be followed by an impressive rally. In our studies, as discussed in prior columns, we noted that Mars in 23° Scorpio also makes a T-square to the Mercury/Pluto square in the New York Stock Exchange Chart (“The Buttonwood” chart of May 17, 1792). Mars is in 23° Scorpio, June 18-July 11. Sometime in this time band, the end of this sharp decline is due, per these studies.” June 24-27 was the bottom, and within the forecasted time band for the end of this decline. Not only did equity markets bottom early last week, but then they skyrocketed sharply higher by the end of the week. In the Far East and Pacific Rim, the Australian ASX fell to 5131 on June 28, its lowest mark since mid-April. By Friday, it was up to 5356. India’s Sensex market fell to a low of 25,911 on June 24. By Friday, July 1, it was up as high as 27,243. China’s Shanghai Index was down to a low of 2807 on June 24, and by July 1, it was back to 2945. A similar pattern was noted in Hong Kong’s Hang Seng index, which bottomed at 19,662 on June 24. It was not open on Friday, July 1, but even on Thursday, it was up as high as 20,828. Japan’s markets were even more dramatic. The Nikkei index fell to 14,864 on June 24, its lowest price since October 2014, and marking a double bottom to its 14,865 low of February 12. However, by Thursday, June 30, it traded as high as 15,781. European indices were the hardest hit, of course, due to the Brexit vote. But they also experienced the strongest rallies afterwards. Most of the European markets fell to their lowest levels since February. The Netherlands AEX bottomed at 409.23 on June 24 and soared to 440.30 one week later on July 1. The German DAX traded as low as 9214 on Monday, June 27, but recovered to an intraday high of 9806 on Friday. The Zurich SMI bottomed at 7475 on June 24, and was back as high as 8098 on Friday, July 1. But the most impressive rally was, of course, in the London FTSE, which found a floor at 5788 on June 24, and roared back to a high of 6587 on July 1, a one-week gain of nearly 14%. So far no harm, as most indices roared back into the black for the week. In the Americas, the Dow Jones Industrial Average underwent a nearly 1000-point reversal from a low of 17,063 on Monday to over 18,000 intraday on Friday. The NASDAQ Composite went from 4574 on June 27 to a high of 4880 on July 1. More impressive than both was the Argentina Merval Index, which soared to a new all-time high of 16,156 on Friday, July 1.

P a g e | 12
http://oss.cc
Global equity markets were not the only newsworthy event in the financial markets following the Brexit vote of June 23. The British Pound experienced a huge decline from a high of 150.18 on June 24 to a low of 131.18 on June 27. That was a decline of nearly 13%. Financier George Soros had predicted that a UK vote to leave the EU would cause the British Pound to immediately fall 15%. He was not far off. And as the Pound fell, the FTSE recovered, because now British goods are relatively inexpensive in other currencies. Contrary to the claims of the “Remain” group and those of US President Barack Obama, the Brexit decision by voters may actually help the world trading status of the UK. Great Britain will not fall to the back of the queue. Instead, they suddenly jump to the front of the line as demand for British goods appreciate at these very attractive prices. I think I will go out and buy some fish and chips and pudding this weekend. Maybe a Jaguar or Rolls Royce too. On second thought, fish and chips only. Gold and Silver performed well, but with an asterisk next to Silver. Gold peaked at 1362.60 on June 24, the prior week, and its highest level since March 2014. It stayed relatively high this week, well above 1300, but it could not take out the high of June 24. Silver, on the other hand, just exploded, soaring to $19.75/ounce, its highest mark since August 2014. When you consider that it was trading at $17.18 just one week ago, you realize that it gained nearly 15% that quickly. This all fits with the analysis given in our recent webinar on the “Mid-Year Financial Markets Outlook,” which is still very relevant, valuable, and available in MP3 format with 80 charts included. In retrospect, last week was an incredible end to “The Incredible Spring Lineup of Geocosmic Signatures,” which was the subject of our 4-part interview, now available on our YouTube station (Raymond Merriman). These interviews were conducted in March and April, and described very well the types of conditions just experienced in the world of politics, central banking, and financial markets, with one of the times of interest identified as June 13-29. You can view these interviews on the links identified in our “Announcements” section below.
SHORT-TERM GEOCOSMICS AND LONGER-TERM THOUGHTS “We have been tempted to believe that society has become too complex to be managed by self-rule, that government by an elite group is superior to government for, by, and of the people… No better symptom exists of the compact breaking apart than the European Central Bank, the U.S. Federal Reserve and the Bank of Japan. They epitomize the exhaustion of elite administrative intelligence. For seven years they failed at restoring even average economic strength, disappearing now into a black hole called negative interest rates.” – Daniel Henninger, “Government Hits the Wall,” Wall Street Journal, June 30, 2016. Mars will remain in 23° Scorpio through July 11, as it changes its direction from retrograde to direct. Thus, even though equity markets exhibited a very strong rally last week off their June 24-28 lows, we cannot rule out another sharp decline now that Mars is turning direct and will pass over the same degree and minutes of Scorpio these next two weeks. However, it will be very surprising if the decline gives back all of these gains, based on cyclical reasons discussed in our subscription reports. There is also a fundamental reason why equities may not come back to those lows again for a while: the Federal Reserve Board will not likely raise its short-term interest rates. It will do whatever it can to support a rising stock market into the election and thereby create a “wealth effect” for likely voters (see the YouTube interview, Part 2). In the process, it will detract from Donald Trump’s main campaign issue: that this is a lousy economy. As long as people see their net worth increasing, they won’t care about the number of people who have dropped off the labor market payrolls, or who cannot find full time work, or

P a g e | 13
http://oss.cc
who have not seen their wages appreciate much at all. As long as stocks increase, those other factors won’t matter much to these voters. Also, it really doesn’t concern too many voters that their savings accounts pay no interest, because the capital appreciation on their stock gains more than offset that. Additionally, they don’t care or even think about the rabid growth of the U.S. national debt. Actually, one reason for its bold increase is due to the lack of taxes made or paid on interest income from savings. That figure is probably a stunning $1-2 trillion in lost taxes per year that the government has lost out on since 2008. This is one of the legacies (unintended consequences) from the Cardinal Climax of 2008-2015 that coincided with massive and irresponsible government expansion and spending leading to such a huge debt that forced the central banks to embark upon ZIRP (Zero Interest Rate Policies). They really had no choice given that their duty is to provide (monetary) policies that support government (fiscal) policies. If the government spends more than it brings in, the central banks must bring rates down so the government leaders can afford to borrow in order carry out their “blind visions” (read; delusions of grandeur, or obsessions with legacies). Forget the needs of the common people and future generations, despite campaign promises to the contrary. But back to today’s markets… Venus is now entering into an opposition with Pluto, and square to Uranus, June 30-July 7. This is known as a “translation” of Venus, and it has a strong correlation to a sudden reversal of short-term trends. The short-term trend has been up in the past week, so there is a chance stocks could top out here and embark upon a healthy pullback. However, anytime you have Uranus involved, you also have to consider that it might lead to a breakout to a new cycle high or low, and not a reversal. Therefore, if the stock market doesn’t pull back this week, we might instead see a continuation of this explosive rally to a new all-time or cycle high in some stock indices, even in this next week, just as we are now witnessing with Silver, as we start this Venus translation time band.
P a g e | 14
http://oss.cc
Trading-Daze Source: http://trading-daze.blogspot.com/
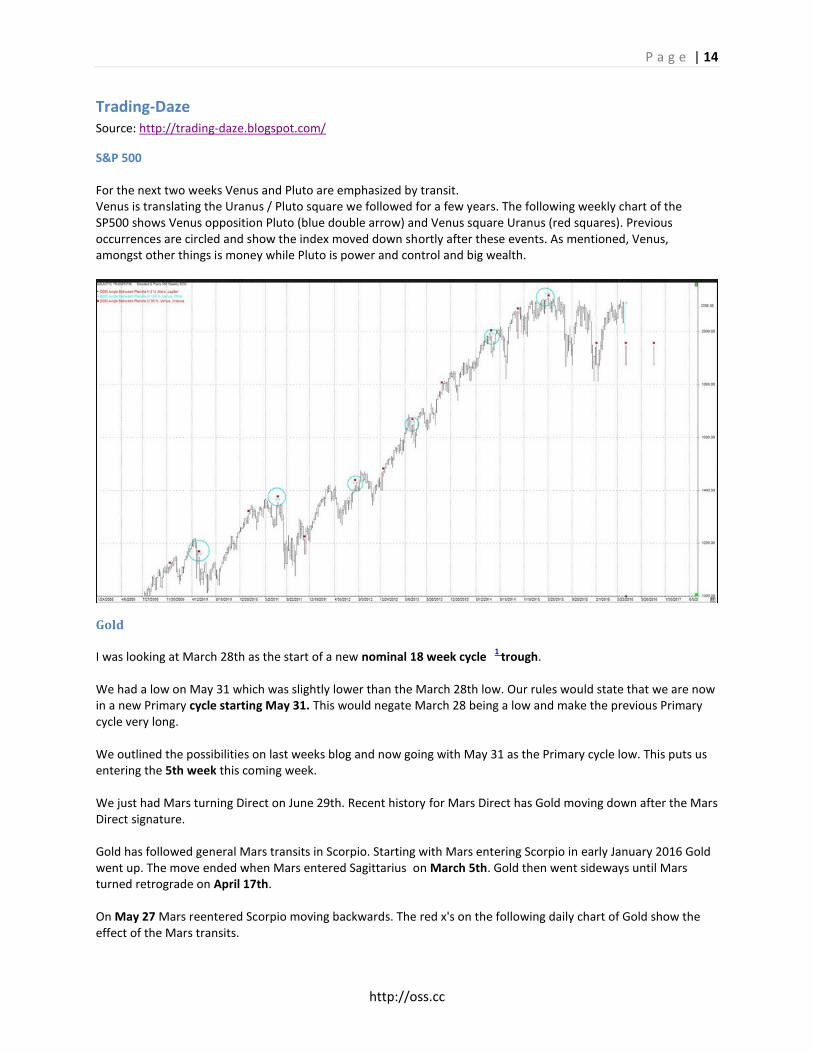
S&P 500 For the next two weeks Venus and Pluto are emphasized by transit. Venus is translating the Uranus / Pluto square we followed for a few years. The following weekly chart of the SP500 shows Venus opposition Pluto (blue double arrow) and Venus square Uranus (red squares). Previous occurrences are circled and show the index moved down shortly after these events. As mentioned, Venus, amongst other things is money while Pluto is power and control and big wealth.
Gold I was looking at March 28th as the start of a new nominal 18 week cycle
1 trough.
We had a low on May 31 which was slightly lower than the March 28th low. Our rules would state that we are now in a new Primary cycle starting May 31. This would negate March 28 being a low and make the previous Primary cycle very long. We outlined the possibilities on last weeks blog and now going with May 31 as the Primary cycle low. This puts us entering the 5th week this coming week. We just had Mars turning Direct on June 29th. Recent history for Mars Direct has Gold moving down after the Mars Direct signature. Gold has followed general Mars transits in Scorpio. Starting with Mars entering Scorpio in early January 2016 Gold went up. The move ended when Mars entered Sagittarius on March 5th. Gold then went sideways until Mars turned retrograde on April 17th. On May 27 Mars reentered Scorpio moving backwards. The red x's on the following daily chart of Gold show the effect of the Mars transits.

P a g e | 15
http://oss.cc
Mars will turn direct on June 29th and leave Scorpio for Sagittarius once again on August 2nd where Gold has a history of moving down or flat. We expect Gold to be flat to down once we get past August 2nd. It will be 10 weeks along in the Primary cycle at that point.
https://1.bp.blogspot.com/-tNDnxPBQ2eY/V3Wl9p3rKAI/AAAAAAAAECc/zmYEgXI3tmkcjaeIbi6hWeGpLAWQdrYGACLcB/s1600/GoldMars.jpg
OEX Trading Resources http://oextradingresources.com/ Updated indicators: NYSE A/D line - TRIN - Put/Call Ratio NYSE Summation Daily & Weekly trend - 21 EMA McClellan - Carlucci Because of the strong and deeply retracing advance from the June low, the weakness from the June 08 high was apparently an a-b-c correction and not an impulse pattern underway. This was confirmed when an overlap of the June 16 low occurred and with it, negating the wave 3 possibility. If the market is able to break above the April & June highs, this could in fact mean this a-b-c correction was a wave 2 as part of an ongoing five wave impulse pattern from the February low, which could lift the market to new all-time highs, sooner or later. But until the April & June highs are broken, the market remains in a vulnerable position. Friday's Hammer candlestick up against trendline resistance, along with an overbought RSI-2 indicates a pullback coming, near term. Likely support levels are drawn on the S&P 500 hourly chart. Strong Volatility - VIX daily support comes in at the 12.5 level and an even stronger floor is down around 11.7. S&P 100 BPI (Bullish Percent Index) daily Sentiment chart..

P a g e | 16
http://oss.cc
SPX & COMPOSITE CHART Predictions are working out fine.
LINKS Subscriptions ……………………………………………………………….. http://www.oss.cc/oss_Subscription.asp
Trading Results …………………………………………………………….. http://www.oss.cc/oss_Results.asp
Free Stuff ……………………………………………………………………… Stocks & ETF’s Trading Service ……………………………………..
http://www.oss.cc/oss_free_stuff.asp
Have a great week trading! --Rob