osses: observing systems simulation experiments expanding collaboration in international...
TRANSCRIPT
OSSEs: Observing Systems Simulation Experiments
Expanding Collaboration in International Collaborative Joint Osses
- Toward reliable and timely assessment of future observing systems -http://www.emc.ncep.noaa.gov/research/JointOSSEs
Anthony Hollingsworth SymposiumPhoenix, AZ 11-15 January 2009
Core members who have been involved from the early stageM. Masutani[1,10,#], L.-P. Riishojgaard[10,2,$], R. Errico[2,$],
E. Andersson[4], J. S. Woollen[1,+], A.Stoffelen[7], G.-J. Marseille[7], O. Reale[2,$],
B.Y. Xie[5] N. Prive[5,@], T. Zhu[3,@], F. Weng[3],C. G. D. Emmitt[6], T. W. Schlatter[5], S. J. Lord[1],
D.S. Greco[6], S. A. Wood[6], R. Yang[2,&], H. Son[3,##], T. J. Kleespies[3,10], Y. Song[1,%]

OSSEs: Observing Systems Simulation Experiments
[1]NOAA/NWS/National Centeres for Environmental Prediction (NCEP), Camp Springs, MD,[2]NASA/Goddard Space Flight Center (GSFC), Greenbelt, MD,
[3]NOAA/ NESDIS/STAR, Camp Springs, MD, [4]ECMWF, Reading, UK[5]NOAA/Earth System Research Laboratory(ESRL), Boulder, CO, [6]SWA, Charlottesville, VA
[7]Royal Dutch Meteorological Institute (KNMI), DeBilt, Netherlands, [8]Mississippi State University/GRI (MSU), MS, [9]JMA, Tokyo, Japan, [10]JCSDA, MD
[11]University of Utah, UT, [12]Environment of Canada, Ontario, Canada[13]University of Tokyo, Japan, [14]NGC, [15]JAMSTEC, Japan, [16]NCAR, Boulder CO,
[17]Norsk Institutt for Luftforskning (NILU), Norway[18]NOAA/OAR/AOML, Miami, FL, [#]Wyle Information Systems Inc., VA
[+]SAIC, MD, [$]GEST, University of Maryland, Baltimore, MD, [%]QSS, MD, [##I].IMSG, MD[&]SSAI. MD, [@]CIRA/CSU, CO
C. Hill[8], V. Anantharaj[8], P. Fitzpatrick[8], X. Fan[8], H. Pryor[2], E. Salmon[2], H.- C. Liu[2,+], M. Sienkiewicz[2,+], A. da Silva[2], M. Govett[5],Z. Pu[11], L.
Cucurull[10], D. Devenyi[5], D. L. Birkenheuer[5], T. Jung[4], A. Thompkins[4], D. Groff[1,+], D. Kleist[1,+], R. Treadon[1], K. Fielding[4], W. Lahoz[17], E. Brin[2], Z. Toth[1], Y. Sato[1,9], M. Hu[5], S. Weygandt[5], M. J. McGill[2], T. Miyosh[9], T. Enomoto[15], M. Watanabe[13],H. Koyama[13,] Y. Rochen[12] , M. Seablom[2],
B. I. Hauss[14], R. Burn[2,14], G. Higgins[14], R. Atlas[18], S. Koch[5], H. Wang[16], Y. Chen[16], X.-Y. Huang[16]
Expanding Collaboration and Support

If we cannot simulate observations, how could we assimilate observations?
● OSSEs help in understanding and formulating observational errors● DA (Data Assimilation) system will be prepared for the new data● Enable data formatting and handling in advance of “live” instrument● OSSE results also showed that theoretical explanations will not be satisfactory when designing future observing systems.
Need for OSSEs
♦Quantitatively–based decisions on the design and implementation of future observing systems
♦ Evaluate possible future instruments without the costs of developing, maintaining & using observing systems.
Benefit of OSSEs

Need one good new Nature Run which will be used by many OSSEs, including regional data assimilation.
Share the simulated data to compare the OSSE results from various DA systems to gain confidence in results.
OSSEs require many experts and require a wide range of resources.
Extensive international collaboration within the Meteorological community is essential for timely and reliable OSSEs to influence decisions.
Need for collaboration
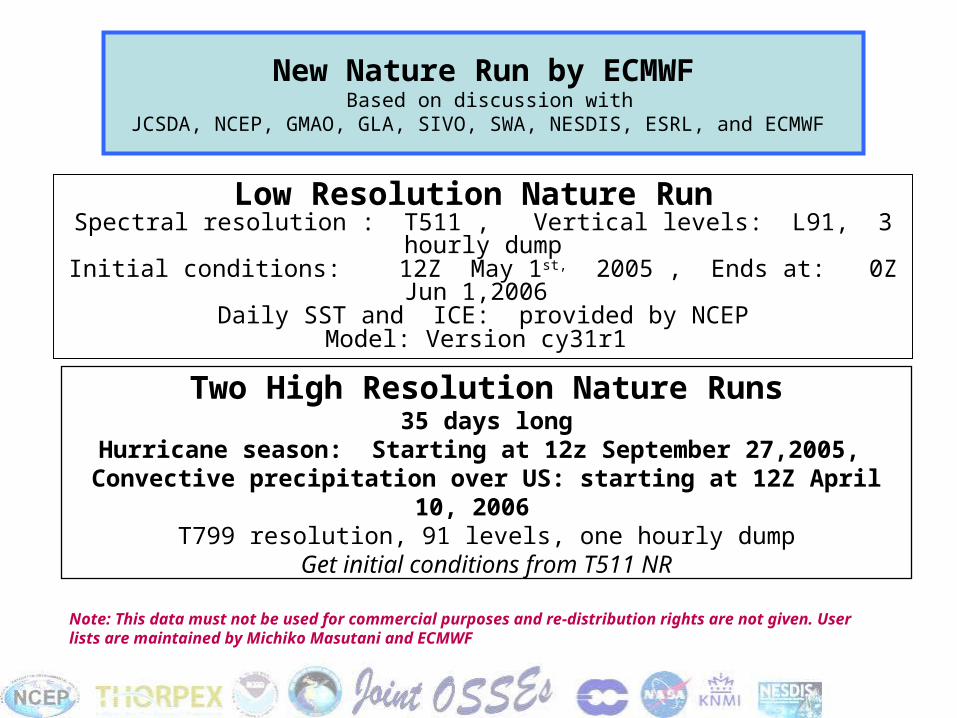
Note: This data must not be used for commercial purposes and re-distribution rights are not given. User lists are maintained by Michiko Masutani and ECMWF
New Nature Run by ECMWF Based on discussion with
JCSDA, NCEP, GMAO, GLA, SIVO, SWA, NESDIS, ESRL, and ECMWF
Low Resolution Nature Run Spectral resolution : T511 , Vertical levels: L91, 3 hourly dumpInitial conditions: 12Z May 1st, 2005 , Ends at: 0Z Jun 1,2006
Daily SST and ICE: provided by NCEPModel: Version cy31r1
Two High Resolution Nature Runs35 days long
Hurricane season: Starting at 12z September 27,2005, Convective precipitation over US: starting at 12Z April 10, 2006
T799 resolution, 91 levels, one hourly dumpGet initial conditions from T511 NR

To be archived in the MARS system at ECMWF Currently available internally as expver=etwu
Copies for US are available to designated users for research purpose& users known to ECMWF
Saved at NCEP, ESRL, and NASA/GSFCComplete data available from portal at NASA/GSFCConctact:Michiko Masutani ([email protected]),
Harper Pryor ([email protected] )Gradsdods access is available for T511 NR. The data can be down loaded in
grib1, NetCDF, binary. The data can be retrieved globally or selected region. Provide IP number to :Arlindo da Silva ([email protected])
Archive and Distribution
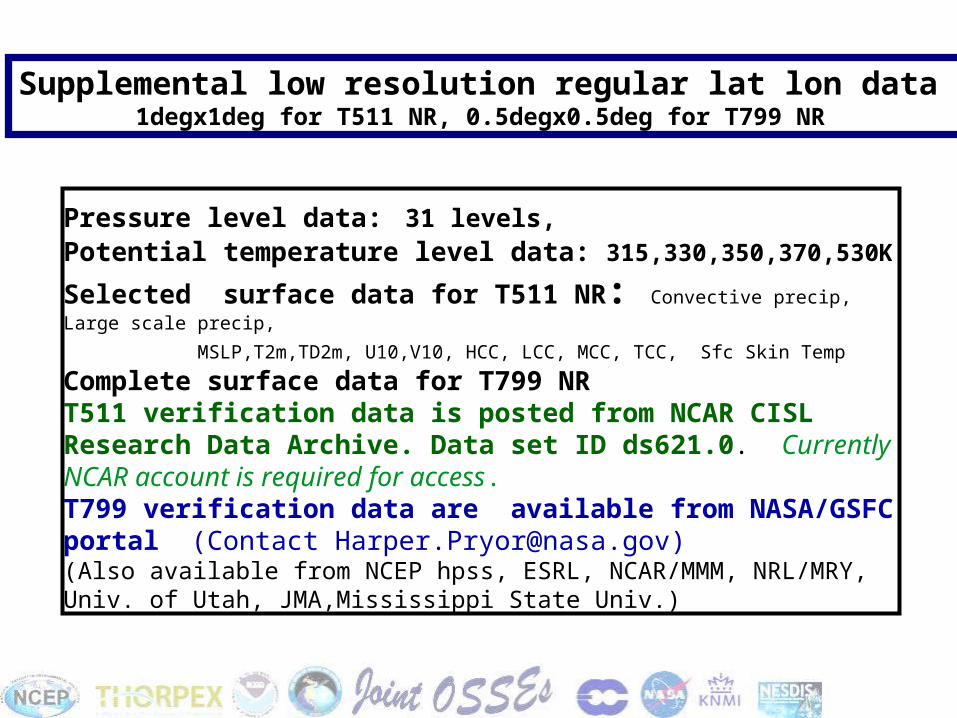
Pressure level data: 31 levels, Potential temperature level data: 315,330,350,370,530K
Selected surface data for T511 NR: Convective precip, Large scale precip,
MSLP,T2m,TD2m, U10,V10, HCC, LCC, MCC, TCC, Sfc Skin
Temp Complete surface data for T799 NRT511 verification data is posted from NCAR CISL Research Data Archive. Data set ID ds621.0. Currently NCAR account is required for access. T799 verification data are available from NASA/GSFC portal (Contact [email protected])(Also available from NCEP hpss, ESRL, NCAR/MMM, NRL/MRY, Univ. of Utah, JMA,Mississippi State Univ.)
Supplemental low resolution regular lat lon data 1degx1deg for T511 NR, 0.5degx0.5deg for T799 NR

Improved cloud20050601-20060531, exp=eskb,
cycle=31r1
Adrian Tompkins, ECMWF
NR
MODIS
NR-MODIS
Evaluation of the T511 Nature run Realistic TropicsOreste Reale
(NASA/GSFC/GLA)
Seasonal mean zonal mean zonal wind jet maximum strength and latitude of the jet maxima for the ECMWF reanalysis (1989-2001, blue circles) and the Nature Run (), northern hemisphere. (N. Prive.)
JJA SON
DJF MAM
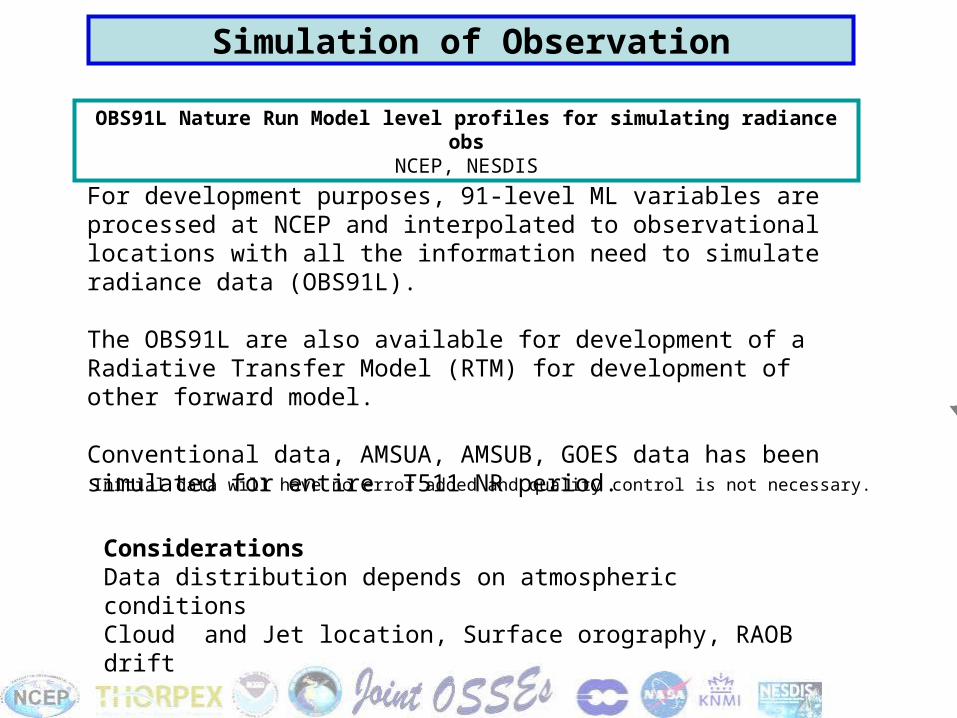
Simulation of Observation
ConsiderationsData distribution depends on atmospheric conditions Cloud and Jet location, Surface orography, RAOB drift
For development purposes, 91-level ML variables are processed at NCEP and interpolated to observational locations with all the information need to simulate radiance data (OBS91L).
The OBS91L are also available for development of a Radiative Transfer Model (RTM) for development of other forward model.
Conventional data, AMSUA, AMSUB, GOES data has been simulated for entire T511 NR period.
OBS91L Nature Run Model level profiles for simulating radiance obsNCEP, NESDIS
Initial data will have no error added and quality control is not necessary.
GMAO Observation Simulator for Joint OSSE
• Software for generating conventional obs (Observation type included in NCEP .prepbufr file)The codes are set up for raobs, aircraft, ships, vad winds, wind profilers, surface station data, SSMI and Quick scat surface winds, Cloud Motion Vector (CMV)
• Software for simulating radiances Code to simulate HIRS2/3, AMSUA/B, AIRS, MSU has been set up. Community Radiative Transfer Model (CRTM) is used for forward model.
• Software for generating random error.Observations are generated without errors but software to simulate error is provided.
The output of the data is saved in BUFR format which can be read by the Gridpoint Statistical Interpolation (GSI). GSI is a DAS used at NCEP, GMAO and ESRL. The codes are flexible and include many tunable parameters.
Contact: GMAO (Ronald Errico: [email protected]) Joint OSSE (Michiko Masutani: [email protected]).
Cloud Motion VectorsSWA, GMAO and NCEP
- Advised by Chris Velden -
Distribution
Initially CMV was simulated at locations of real observation.
SWA studied the strategies of simulation of CMV

Radiance Simulation System for Joint OSSERon Errico, Runhua Yang, Emily Liu, Meta Sienkiewicz, (NASA/GSFC/GMAO)
Tong Zhu, Tom Kleespies,Haibing Sun, Fuzhong Weng, (NOAA/NESDIS) Jack Woollen, Michiko Masutani(NOAA/NCEP)
Lars Peter Riishojgaard (JCSDA)
Other possible resources and/or advisors David Groff , Paul Van Delst (NCEP) Yong Han, Walter Wolf, Cris Bernet, Mark Liu, M.-J. Kim, (NESDIS), Erik Andersson (ECMWF); Roger Saunders (Met Office)
The GMAO simulation software was successfully installed at NCEP and initial simulation AIRS, HIRS2 and HIRS3
AMSU and GOES data has been simulated using OBS91L
Initially, CRTM is used for simulation and assimilation.
CRTM: Community Radiative Transfer Model
Algorithm for determining cloud-cleared observation locations used at GMAOFor each grid box where a satellite observation is given, use thecloud fraction to specify probability that it is a clear spot. Thenuse random number to specify whether pixel is clear. Use a functional relationship between probability and cloud fraction that we can tune to get a reasonable distribution.
Further development of CRTM to use cloudy radiance
Alternative software to simulate radiance data using the Stand-alone AIRS Radiative Transfer Algorithm (SARTA) as well as the CRTM is also being developed at NESDIS. NESDIS software includes results from various research. This will be important to evaluate CRTM in Joint OSSEs.
Calibration using the adjoint technique has been conducted at GMAO
Calibration using data denial experiments at ESRL, NCEP, and NESDIS (Nikki Prive: IOAS-AOLS 13.3)
Calibration for Joint OSSEs
Discussion forum for observational errors
Extensive discussion on simulation of observational error particularly representativeness error.
To be published in “Data assimilation: Making sense of observation” (Springer)

Try 1
Try 2
Latest try
REAL OSSE
REAL OSSE
Calibration for Joint OSSEs at NASA/GMAO
Try 1
Calibration using adjoint technique
Continue working on tuning parameter for cloud clearing
Investigate problem in surface emissivity
Improving simulation of Cloud motion vector. (Need to work with SWA)

ADM-Aeolus simulation for J-OSSE KNMI planG.J. Marseille and Ad Stoffelen
• Spring 2008: ADM Mission Advisory Group (ADMAG) advices ESA to participate in Joint OSSE
• KNMI writes TOGETHER proposal to ESA
TOGETHER
Towards a Global observing system throughcollaborative simulation experiments
• Tools for retrieving nature run fields from ECMWF archive
• Orbit simulator
• Instrument error: LIPAS (Lidar Performance Analysis Simulator)
• Representativeness error
• Verification against SWA ADM simulation. Simulation consistency
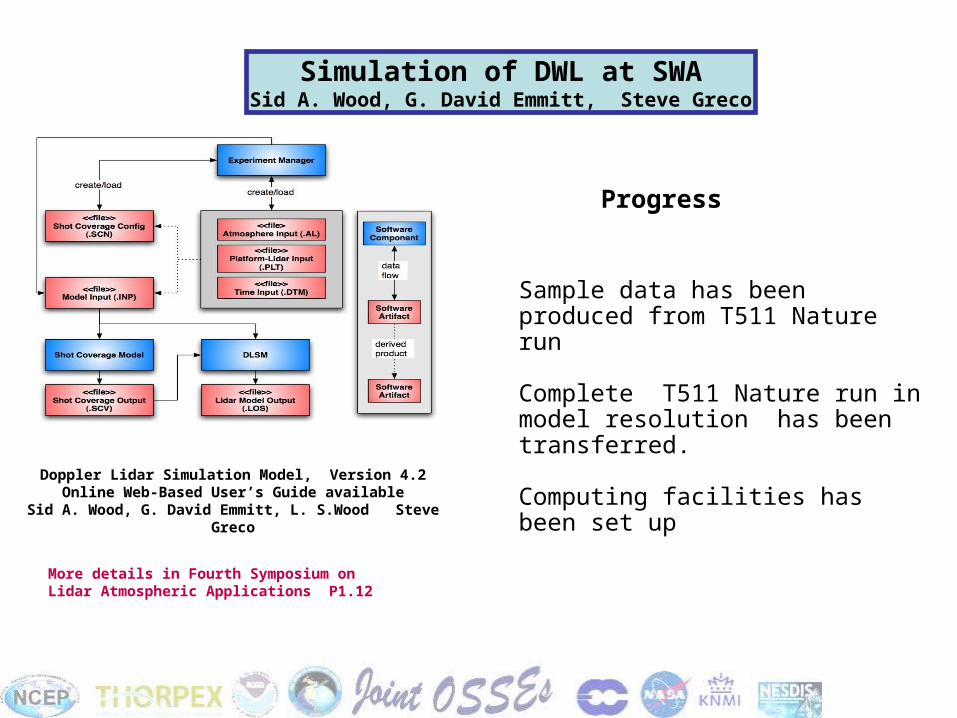
Sample data has been produced from T511 Nature run
Complete T511 Nature run in model resolution has been transferred.
Computing facilities has been set up
Progress
Simulation of DWL at SWASid A. Wood, G. David Emmitt, Steve Greco
Doppler Lidar Simulation Model, Version 4.2Online Web-Based User’s Guide available
Sid A. Wood, G. David Emmitt, L. S.Wood Steve Greco
More details in Fourth Symposium on Lidar Atmospheric Applications P1.12
Simulation of DWL at NASA/GSFCArlindo . Da Silva, Matthew. J. McGill, Michele Rienecker, Lars Peter Riishojgaard
Focused on DWL developed at NASA/GSFC
Simulation of aerosol for Joint OSSE Nature Run.The simulated aerosol will be available to Joint OSSEs
Assimilation of DWL and testing the impact
NCEP conducted DWL impact test using SSI.
GSI is getting ready for simulation of lidar and being tested and compare with SSI.
Evaluation of DWL simulated by SWA and KNMI at NCEP and NASA/GSFC
•Use WRF model and NCEP GSI for data assimilation
• Evaluate the global natural runs for regional OSSEs
•Assess the impact of future DWL data on high-impact weather forecasting; focused on the hurricane intensity forecast.
•Investigate the basic problems/challenges, such as boundary conditions and resolution issues in regional OSSEs
Regional DWL OSSEs at the University of UtahZhaoxia Pu, University of Utah ( [email protected])
Presented at IOAS-AOLS 13.5 Thursday 2:30

OSSE capability for GNSS Radio-Occultation (RO) observationsLidia Cucurull (JCSDA)
There are several options for a COSMIC follow-on mission (different orbit configuration, number of satellites, etc)
What is the optimal “choice”? CEOS action WE-07-03 on ‘evaluation of the requirements to conduct RO OSSEs’ The action has recently been completed
– International Joint OSSE project
– 2-yr full time post-doctoral scientist Hopefully, we will get funding soon
Build the interface between the chosen RO simulator and the Nature Run Choose the RO products to be simulated Simulate the observations and tune the error covariance matrix for the selected
constellations Conduct the assimilation experiments Evaluate the results Choose the ‘optimal’ constellation
Requirements for RO OSSE

Simulation of GOES-12 Sounder
In nature Run, there is hurricane generated on September 27. At 1200 UTC October 1, it is located at about 43 W, 20N. The high moisture air mass associated with the hurricane is shown clearly.
Observed GOES-12 18 bands on 0230 UTC October 01, 2005 for North Atlantic Ocean section.
OSSEs to prepare for GOES-RTong Zhu (CIRA/CSU), Fuzhong Weng (NOAA/NESDIS),
Jack Woollen (NOAA/EMC), Michiko Masutani (NOAA/EMC), Thomas J. Kleespies(NOAA/NESDIS), Yong Han(NOAA/NESDIS), Quanhua, Liu (QSS), Sid Boukabara (NOAA/NESDIS),Steve Load (NOAA/EMC),
Observed GOES-12 Sounder

Preliminary simulation of GOES from T511NR has completed for entire Nature Run period (13 month)
Other preliminary basic data, Conventional data, AIRS, HIRS,AMSUA/B are also simulated for 13 month.
Progress
Future Work
Simulate GOES-R ABI radiances from Nature Run data,
Perform NWP model simulations to investigate the impacts of GOES-12 and GOES-R measurements.
Conduct impact test using data assimilation system at NCEP-NESDIS

Regional OSSEs to Evaluate ATMS and CrIS ObservationsC.M. Hill, P. J. Fitzpatrick, X. Fan, V. Anantharaj,
D. M. Masutani, L. P. Riishojgaard, and Y. Li GRI/Mississippi State Univ (MSU), JCSDA

OSSE to evaluate data assimilation systemsIt is worthwhile to try identical twin experiments to
understand model error. ECMWF and GMAO
Assimilation with LETKF possibly by 4D-varT. Miyoshi(UMD) and Enomoto(JEMSTEC)
Sensor Web Uses same Nature RunNASA/GSFC/SIVO, SWA , NGC
Analysis with surface pressureGil Compo, P. D. Sardeshmukh (ESRL)
Visualization of the Nature run
O. Reale (NASA/GSFC/GLA), H. Mitchell(NASA/GSFC/SIVO)
Data assimilation for climate forecastsH. Koyama, M. Watanabe (University of Tokyo)
OSSEs for THORPEX T-PARCEMC, FSU, ESRL
OSSE to evaluate UASESRL and NCEP
Other OSSEs planned or consideredSeeking funding but start with volunteers
Data assimilation with RTTOVS Environment Canada
Presented at IOAS-AOLS 13.3 Thursday 2:00

There is great deal of interest toward regional OSSEs to study data impact on forecast of hurricanes and midlatitude storms. Even if using same global Nature run, regional OSSEs have to deal with handicaps.
• Lateral boundary conditions eventually dominate the forecast inside the regional domain, obscuring any effect of the observation mix on forecast accuracy. This must be considered when evaluating the OSSE:
• The size of the geographic region controls the length of forecasts that can be considered shorter for smaller regions.
• Ideally, the same observation mix should be used in the regional model as in the global model that supplies the boundary conditions.
• One is forced to execute two nature runs and coordinate two data assimilation and prediction systems.
If regional Nature Runs with higher resolution is produced nesting within the global nature run, uncertainty in regional OSSE will become much more serious. Several groups in Joint OSSEs are investigating strategies for credible regional
Challenges in Regional OSSE

Summary
● OSSEs are expensive, but can be a cost-effective way to optimize investment in future observing systems
● OSSE capability should be multi-agency, community owned to avoid conflict of interest
● Independent but related data assimilation systems allows us to test robustness of answers
● Joint OSSE collaboration remains only partially funded but appears to be headed in right direction
●GMAO Software to calibrated basic data of is ready for release.● Further development and more software are being developed in NCEP, NESDIS, and ESRL as well as at GMAO.● Data base and computing resources has been set up for DWL simulation and SWA, and KNMI received funding.● Preliminary version of basic data set has been simulated for entire T511NR period.

Dr. Anthony Hollingsworth was always an inspiration to OSSEs project and encouraging to the goals.
Preprints
13th (IOAS-AOLS)13.2Expanding collaboration in Joint OSSEs
Hollingsworth SymposiumP1.2International collaborative Joint OSSEsToward reliable and timely assessment of future observing systems -
http://www.emc.ncep.noaa.gov/research/JointOSSEsMeeting summaryDiscussion forumsReferencesFAQ for OSSE, GSI, and CRTM

End

Comparison between the
ECMWF T511 Nature Run against
climatology20050601-20060531, exp=eskb,
cycle=31r1
Adrian Tompkins, ECMWF
Cloud Cover
NR
MODIS
NR-MODIS
Utilize Goddard’s cyclone tracking software (Terry and Atlas, AMS conf, Aug 1996): • Identifies and tracks mostly extratropical cyclones (cutoff at 20 deg N/S latitude)
• Interfaces with GrADS contouring algorithm
• Uses SLP field at 4hPa contour interval
• Finds centroid of inner-most closed isobar
• Tracks the centers using extrapolation and 500hPa steering
Cyclone tracks generated:
• Nature run at one degree for Jun 2005 to May 2006 (each month and season)
• NCEP operational analysis at one degree for 2000 to 2006 (each month, 68 of 84 months were available)
Evaluation of the Nature run
Vertical structure of a HL vortex shows, even at the degraded resolution of 1 deg, a distinct eye-like feature and a very prominent warm core. Structure even more impressive than the system observed in August. Low-level wind speed exceeds 55 m/s
TropicsOreste Reale (NASA/GSFC/GLA)
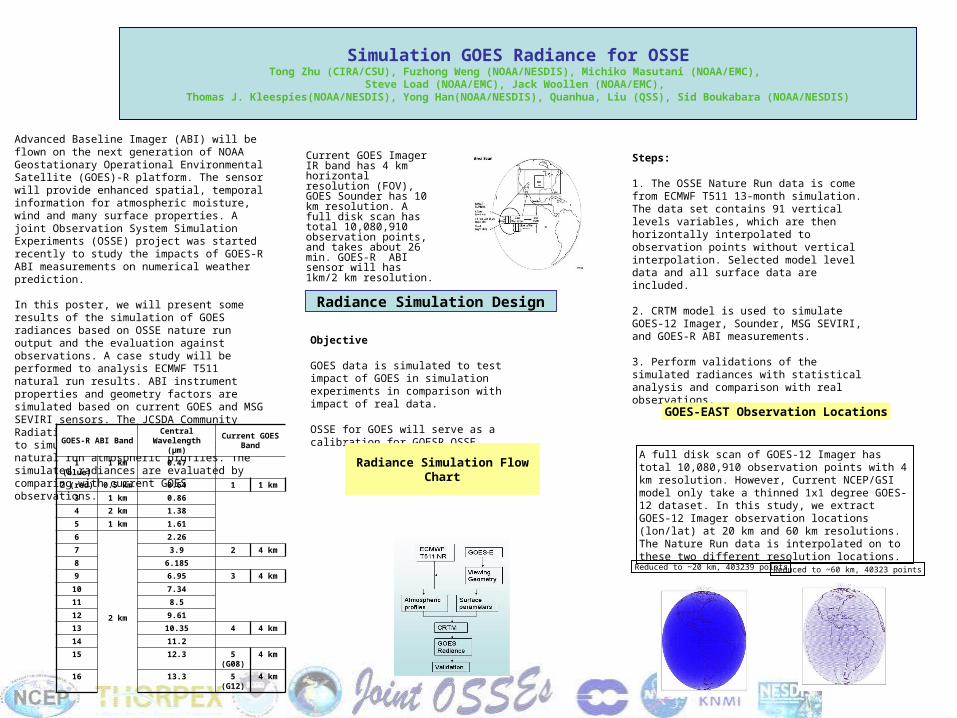
Simulation GOES Radiance for OSSETong Zhu (CIRA/CSU), Fuzhong Weng (NOAA/NESDIS), Michiko Masutani (NOAA/EMC),
Steve Load (NOAA/EMC), Jack Woollen (NOAA/EMC), Thomas J. Kleespies(NOAA/NESDIS), Yong Han(NOAA/NESDIS), Quanhua, Liu (QSS), Sid Boukabara (NOAA/NESDIS)
Advanced Baseline Imager (ABI) will be flown on the next generation of NOAA Geostationary Operational Environmental Satellite (GOES)-R platform. The sensor will provide enhanced spatial, temporal information for atmospheric moisture, wind and many surface properties. A joint Observation System Simulation Experiments (OSSE) project was started recently to study the impacts of GOES-R ABI measurements on numerical weather prediction.
In this poster, we will present some results of the simulation of GOES radiances based on OSSE nature run output and the evaluation against observations. A case study will be performed to analysis ECMWF T511 natural run results. ABI instrument properties and geometry factors are simulated based on current GOES and MSG SEVIRI sensors. The JCSDA Community Radiative Transfer Model (CRTM) is used to simulate ABI radiances with the natural run atmospheric profiles. The simulated radiances are evaluated by comparing with current GOES observations.
Current GOES Imager IR band has 4 km horizontal resolution (FOV), GOES Sounder has 10 km resolution. A full disk scan has total 10,080,910 observation points, and takes about 26 min. GOES-R ABI sensor will has 1km/2 km resolution.
Radiance Simulation Design
Objective
GOES data is simulated to test impact of GOES in simulation experiments in comparison with impact of real data.
OSSE for GOES will serve as a calibration for GOESR OSSE.
Radiance Simulation Flow Chart
Steps:
1. The OSSE Nature Run data is come from ECMWF T511 13-month simulation. The data set contains 91 vertical levels variables, which are then horizontally interpolated to observation points without vertical interpolation. Selected model level data and all surface data are included.
2. CRTM model is used to simulate GOES-12 Imager, Sounder, MSG SEVIRI, and GOES-R ABI measurements.
3. Perform validations of the simulated radiances with statistical analysis and comparison with real observations.
GOES-EAST Observation Locations
A full disk scan of GOES-12 Imager has total 10,080,910 observation points with 4 km resolution. However, Current NCEP/GSI model only take a thinned 1x1 degree GOES-12 dataset. In this study, we extract GOES-12 Imager observation locations (lon/lat) at 20 km and 60 km resolutions. The Nature Run data is interpolated on to these two different resolution locations.
Reduced to ~20 km, 403239 points Reduced to ~60 km, 40323 points
GOES-R ABI BandCentral Wavelength
(μm)Current GOES
Band
1 (blue) 1 km 0.47
2 (red) 0.5 km 0.64 1 1 km
3 1 km 0.86
4 2 km 1.38
5 1 km 1.61
6
2 km
2.26
7 3.9 2 4 km
8 6.185
9 6.95 3 4 km
10 7.34
11 8.5
12 9.61
13 10.35 4 4 km
14 11.2
15 12.3 5 (G08) 4 km
16 13.3 5 (G12) 4 km

Simulation of GOES-12 Imager
Simulated GOES-12 Imager 4 bands with ECMWF Nature Run output data at 0300 UTC October 1, 2005.
It is found that the water vapor band, 6.5 µm, is most accurate band simulated by CRTM model.
Time series of hourly, full disk mean brightness temperature of the simulated GOES-12 Imager 4 bands from September 28 to October 10, 2005.
Under clear sky conditions, the brightness temperatures are warmer than that of cloudy conditions. The daily change under clear conditions is apparent.
Black lines are total points mean Tb, red lines are the mean Tb over clear sky condition, and the blue lines are the mean Tb over cloudy condition. Clear sky condition is defined as where total cloud coverage (TCC)< 0.1, and cloudy condition is where TCC > 0.1
Simulation of GOES-12 Sounder
Simulated Radiances
The observed GOES-12 Sounder
In nature Run, there is hurricane generated on September 27. At 1200 UTC October 1, it is located at about 43 W, 20N. The high moisture air mass associated with the hurricane is shown clearly.
Observed GOES-12 18 bands on 0230 UTC October 01, 2005 for North Atlantic Ocean section.
Observed vs. simulated GOES-12 sounder for the mean Tb over North Atlantic Ocean region.
Black lines are mean Tb from NR simulated, and the red lines are the mean Tb from observation.
They should not be the same but similar statistical features are important.
Preliminary simulation of GOES from T511NR has completed for entire Nature Run period (13 month)
Other preliminary basic data, Conventional data, AIRS, HIRS,AMSUA/B are also simulated for 13 month.
Progress
Time Series of Mean Tb
Future Work
Simulate GOES-R ABI radiances from Nature Run data,
Perform NWP model simulations to investigate the impacts of GOES-12 and GOES-R measurements.
Conduct impact test using data assimilation system
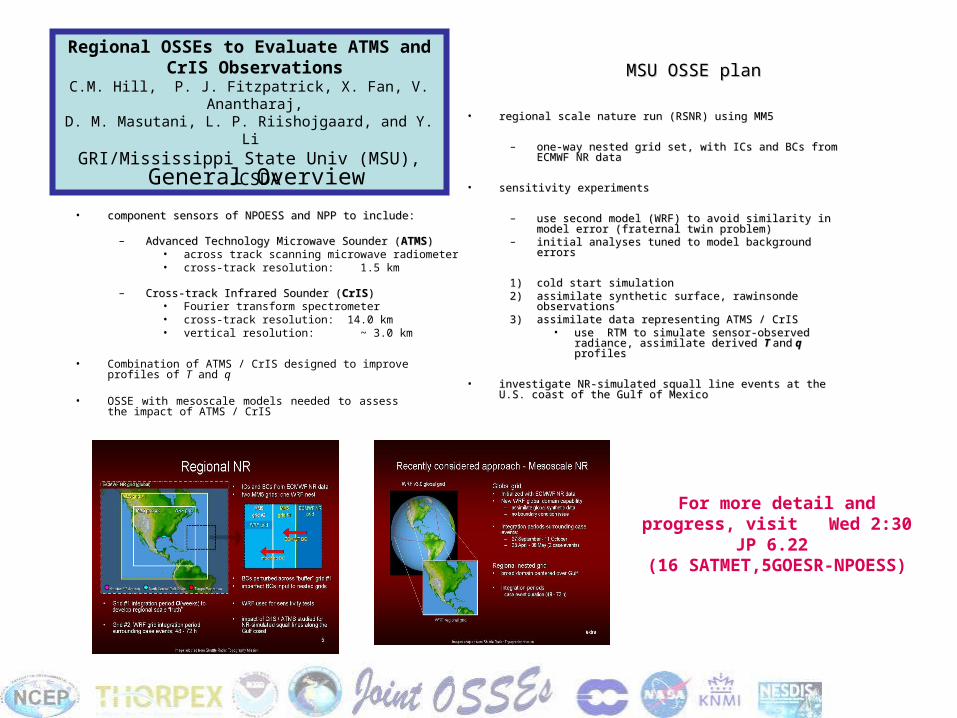
Regional OSSEs to Evaluate ATMS and CrIS Observations
C.M. Hill, P. J. Fitzpatrick, X. Fan, V. Anantharaj,D. M. Masutani, L. P. Riishojgaard, and Y. Li
GRI/Mississippi State Univ (MSU), JCSDA
General Overview
• component sensors of NPOESS and NPP to include:component sensors of NPOESS and NPP to include:
– Advanced Technology Microwave Sounder (Advanced Technology Microwave Sounder (ATMSATMS))• across track scanning microwave radiometer• cross-track resolution: 1.5 km
– Cross-track Infrared Sounder (Cross-track Infrared Sounder (CrISCrIS))• Fourier transform spectrometer • cross-track resolution: 14.0 km• vertical resolution: ~ 3.0 km
• Combination of ATMS / CrIS designed to improve profiles of T and q
• OSSE with mesoscale models needed to assess the impact of ATMS / CrIS
MSU OSSE planMSU OSSE plan
• regional scale nature run (RSNR) using MM5regional scale nature run (RSNR) using MM5
– one-way nested grid set, with ICs and BCs from one-way nested grid set, with ICs and BCs from ECMWF NR dataECMWF NR data
• sensitivity experimentssensitivity experiments
– use second model (WRF) to avoid similarity in model use second model (WRF) to avoid similarity in model error (fraternal twin problem)error (fraternal twin problem)
– initial analyses tuned to model background errorsinitial analyses tuned to model background errors
1)1) cold start simulationcold start simulation2)2) assimilate synthetic surface, rawinsonde observationsassimilate synthetic surface, rawinsonde observations3)3) assimilate data representing ATMS / CrISassimilate data representing ATMS / CrIS
• use RTM to simulate sensor-observed radiance, use RTM to simulate sensor-observed radiance, assimilate derived assimilate derived TT andand qq profilesprofiles
• investigate NR-simulated squall line events at theinvestigate NR-simulated squall line events at the U.S. coast of the Gulf of U.S. coast of the Gulf of
MexicoMexico
For more detail and progress, visit Wed 2:30 JP 6.22
(16 SATMET,5GOESR-NPOESS)

ADM-Aeolus simulation for J-OSSE KNMI planG.J. Marseille and Ad Stoffelen
• Spring 2008: ADM Mission Advisory Group (ADMAG) advices ESA to participate in Joint OSSE
• KNMI writes TOGETHER proposal to ESA
TOGETHER
Towards a Global observing system throughcollaborative simulation experiments
• ADM OSSE heritage, for details see Stoffelen et al., 2006
http://www.knmi.nl/~marseill/publications/fulltexts/osse.pdf• Tools for retrieving nature run fields from ECMWF archive• Orbit simulator• Interpolation of model fields to ADM location
“True” (HLOS) wind• Instrument error: LIPAS (Lidar Performance Analysis Simulator)
− For details see Marseille and Stoffelen, 2003
http://www.knmi.nl/~marseill/publications/fulltexts/dwlsimul.pdf
− LIPAS is updated and compatible with L2B processor performance
• Representativeness error Unresolved model scales in nature run and ADM
sampling determines representativeness error to be added to ADM HLOS wind observation
Verification against SWA ADM simulation. Simulation consistency needed on
• Clouds– Laser beam cloud hit from model grid box cloud cover.
Random?– Cloud backscatter and extinction from model clouds– Maximum overlap between clouds in adjacent (vertical)
levels• Aerosols
– Backscatter and extinction– Horizontal variability
• along track over 50 km accumulation length• between adjacent observations (separated by 150
km)– Vertical variability (stratification)
• Dynamics– Wind variability over 50 km accumulation length
• ADM continuous mode
– ESA decision December 2008
– If continuous mode is selected then more funding will probably become available for additional simulation studies
• Simulation of post-ADM scenarios
– EUMETSAT funding?
•

In Spring, 2008 Simpson Weather Associates, Inc. established the Doppler Lidar Simulation Model version 4.2 onto an Apple dual quad processor computer for the SensorWeb project. SSH, the network protocol that allows data to be exchanged over a secure channel between two computers, was installed and tested. SWA and SIVO were able to test the push/pull and communications functionality successfully. SIVO was able to push DLSM inputs to SWA and request model simulations. The DLSM was successfully executed and SIVO was able to retrieve DWL coverage and DWL line-of-sight wind products for a six hour simulation in less than 2 minutes.
• Line of Sight wind operator for the assimlation models
• Integrate Satellite Toolkit into the workflow tool to provide satellite location and attitude inputs
• Establish the T511 and T799 nature runs into DLSM database format including generating aerosol, molecular and cloud optical property databases
• Build the slewing capability into the scanner model
• Integrate into the Sensor Web the SWA cloud motion wind model
• Global OSSEs (maybe mesoscale OSSEs - hurricanes)
NEAR FUTURE PLANS
LATEST RESULTS
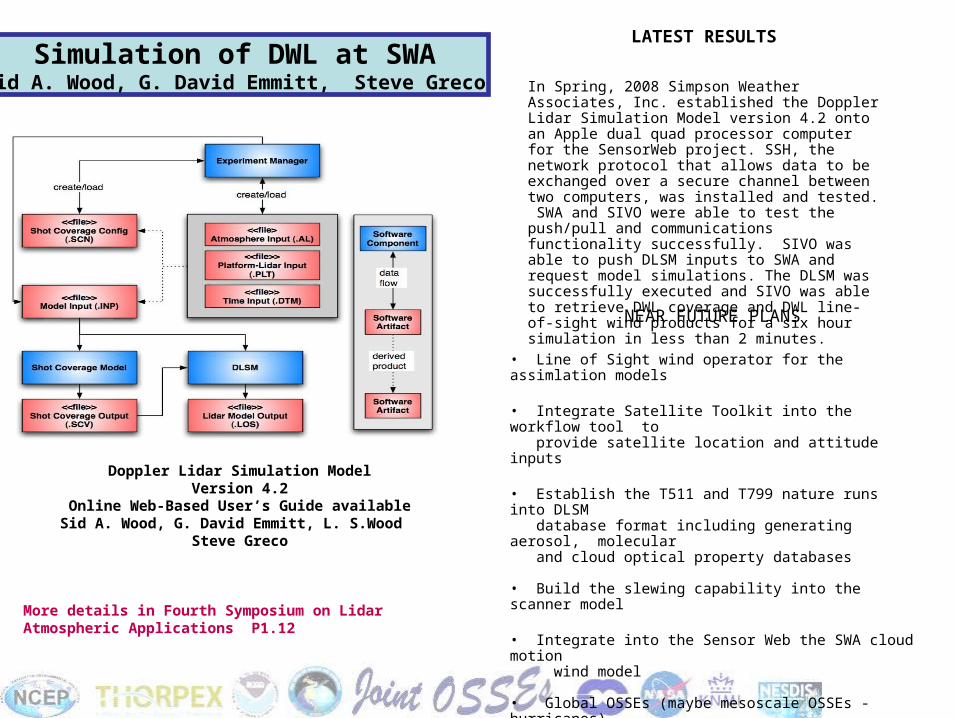
In Spring, 2008 Simpson Weather Associates, Inc. established the Doppler Lidar Simulation Model version 4.2 onto an Apple dual quad processor computer for the SensorWeb project. SSH, the network protocol that allows data to be exchanged over a secure channel between two computers, was installed and tested. SWA and SIVO were able to test the push/pull and communications functionality successfully. SIVO was able to push DLSM inputs to SWA and request model simulations. The DLSM was successfully executed and SIVO was able to retrieve DWL coverage and DWL line-of-sight wind products for a six hour simulation in less than 2 minutes.
• Line of Sight wind operator for the assimlation models
• Integrate Satellite Toolkit into the workflow tool to provide satellite location and attitude inputs
• Establish the T511 and T799 nature runs into DLSM database format including generating aerosol, molecular and cloud optical property databases
• Build the slewing capability into the scanner model
• Integrate into the Sensor Web the SWA cloud motion wind model
• Global OSSEs (maybe mesoscale OSSEs - hurricanes)
NEAR FUTURE PLANS
LATEST RESULTSSimulation of DWL at SWA
Sid A. Wood, G. David Emmitt, Steve Greco
Doppler Lidar Simulation ModelVersion 4.2
Online Web-Based User’s Guide availableSid A. Wood, G. David Emmitt, L. S.Wood Steve Greco
More details in Fourth Symposium on Lidar Atmospheric Applications P1.12

Simulation of DWL in Cloudy conditions at SWAUtility of Doppler Wind Lidars in cloudy
conditions
• There are concerns expressed that airborne lidars may be marginally useful in cloudy conditions (same for space-based lidars)
• Airborne and space-based data suggests otherwise.• An airborne wind lidar combined with dropsondes makes a
powerful combination–The DWL can provide direct measure of
representativeness of the dropsonde observations enabling dynamic assignment of representativeness in the total observation error (σo) assigned for DA.
Current expectations
• From space, current laser technology will detect cloud on 80% of individual laser shots; however, 80% of all laser shots will provide a ground return (i.e. 75% of the shots that intercept cloud will also provide a ground return (based upon analyses of GLAS data).
• Difficult to generalize for airborne lidars since mission objectives could be targeting cloudy phenomena. However, experience by those flying airborne lidars is that laser shots penetrate clouds far more frequently than initially expected. Thus clouds are seen as optically porous at near infrared wavelengths.
Vertical cross section of CALIPSO returns illustrating performance in veryCloudy areas. Note the returns below clouds.
Recommendations
• Recommend hybrid wind lidar for research from high altitude aircraft such as ER2, WB-57, Proteus, Global Hawk..–Hybrid Doppler wind lidar (DWL) includes a molecular
subsystem for aerosol weak regions–A coherent sub system for cloudy situations and
aerosol rich regions (PBL, elevated dust layers..)• Co-fly hybrid DWL with dropsondes as will be done in
TPARC using the NAVY P3 and the DLR Falcon.
• SPOT: Satellite Pour l'Observation de la Terre
• CFLOS: Cloud Free Line of Sight• TODWL: Twin Otter Doppler Wind
Lidar• HRDL: High Resolution Doppler
Lidar• DIAL: Differential Absorption Lidar• LITE: Lidar Technology Experiment• GLAS: Geoscience Laser Altimeter
System
Vertical cross section below Cloud Lidar System flown on ER2
Data from an airborne water vaporDIAL flown by NASA
Hurricane Bonnie, 1998
Figure from

DWL Operations within a Sensor Web Modeling and Data Assimilation System:Recent Results
2G. D. Emmitt, 2S. Greco, 2S. A. Wood, M. Seablom, 5E. Brin, 5,6,$L. P. Riishojgaard
A model-driven sensor web is an Earth observing system that
uses information derived from data assimilation systems and
numerical weather prediction models to drive targeted observations
made from earth-orbiting spacecraft as well as from atmospheric-
and ground-based observing systems.
Demonstrate the value of implementing sensor web concepts for meteorological use casesQuantify cost savings to missionsQuantify improvement in achieving science goalsDesign and Build an integrated simulator with functional elements that will allow multiple “what if” scenarios in which different configurations of sensors, communication networks, numerical models, data analysis systems, and targeting techniques may be tested
SENSOR WEB
Project Goal
Sensor Web Simulator Design During 2007 most elements of the lidar use case (1-5) were
executed “by hand” to help aid in the design of the simulator
prototype Five separate Observing System Simulation Experiments
(OSSEs) were conducted that concluded: Under certain situations1, the lidar duty cycle may be
reduced 30% without impacting forecast skill Under certain situations, having the model task the lidar to
perform a roll maneuver improves detection of features of
interest 30% (tropical cyclones, jet streaks, rapidly changing
atmospheric conditions)
Adaptive Targeting


Radio Occultation concept
LEO
Occulting GPS
Ionosphere
Neutral atmosphere
Earth
Raw measurement: change of the delay (phase) of the signal path between the GPS and LEO during the occultation. (It includes the effect of the atmosphere).
GPS transmits at two different frequencies: ~1.6 GHz (L1) and ~1.3 GHz (L2).
An occultation occurs when a GPS (GNSS) satellite rises or sets across the limb wrt to a LEO satellite. A ray passing through the atmosphere is refracted due to the vertical gradient of refractivity (density). During an occultation (~ 3min) the ray path slices through the atmosphere
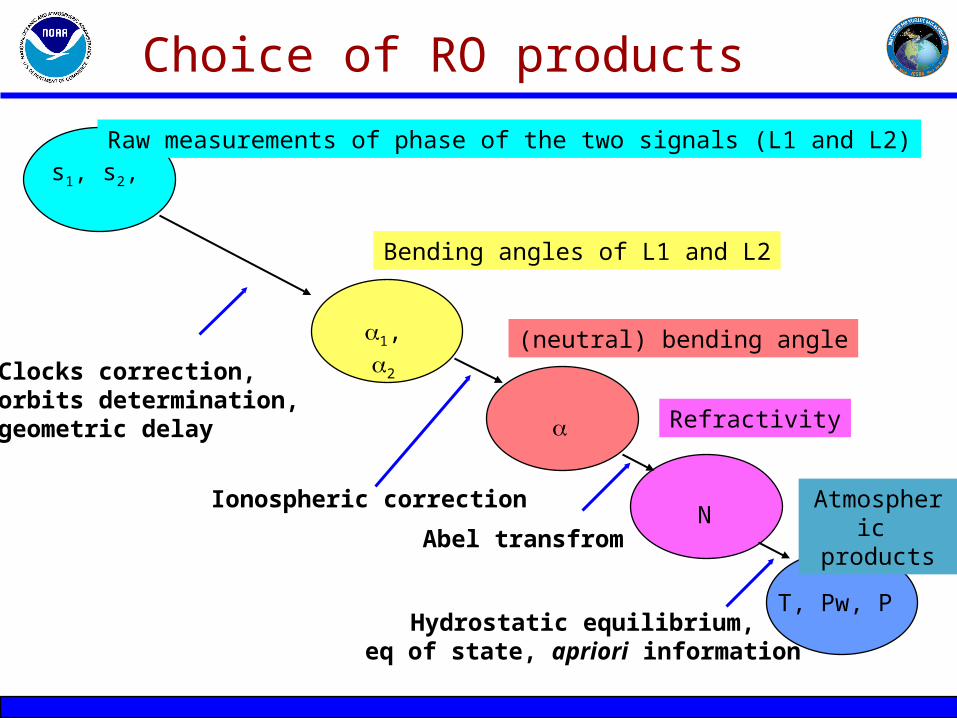
s1, s2,
1, 2
N
T, Pw, P
Raw measurements of phase of the two signals (L1 and L2)
Bending angles of L1 and L2
(neutral) bending angle
Refractivity
Ionospheric correction
Abel transfrom
Hydrostatic equilibrium,eq of state, apriori information
Clocks correction,orbits determination, geometric delay
Choice of RO products
Atmospheric products