osu richardson and peavy hall energy...
TRANSCRIPT
OSU Richardson and Peavy Hall
Energy Study:
Energy Conservation Measure Analysis
January 25, 2012 {Revised April 30, 2012}

January 25, 2012 OSU Richardson and Peavy Hall Energy Study: Energy Conservation Measure Analysis {Revised April 30, 2012}
11-1077 | iii
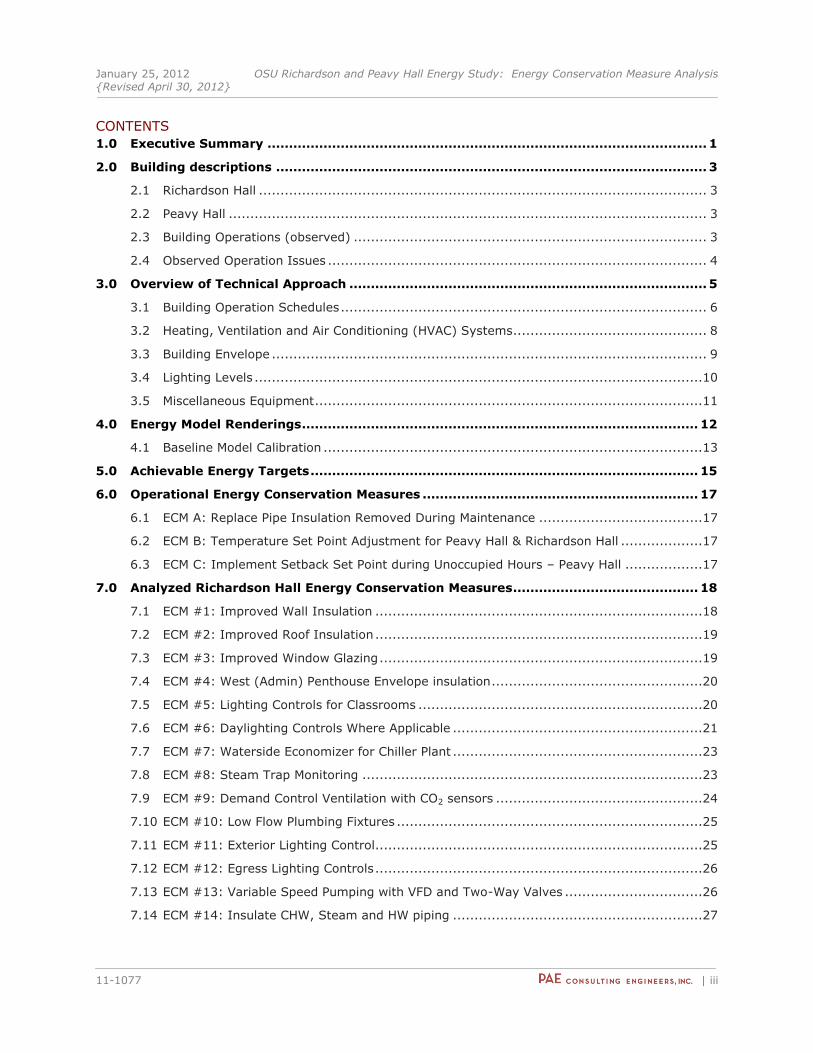
CONTENTS
1.0 Executive Summary ...................................................................................................... 1
2.0 Building descriptions .................................................................................................... 3
2.1 Richardson Hall ........................................................................................................ 3
2.2 Peavy Hall ............................................................................................................... 3
2.3 Building Operations (observed) .................................................................................. 3
2.4 Observed Operation Issues ........................................................................................ 4
3.0 Overview of Technical Approach ................................................................................... 5
3.1 Building Operation Schedules ..................................................................................... 6
3.2 Heating, Ventilation and Air Conditioning (HVAC) Systems ............................................. 8
3.3 Building Envelope ..................................................................................................... 9
3.4 Lighting Levels ........................................................................................................10
3.5 Miscellaneous Equipment ..........................................................................................11
4.0 Energy Model Renderings ............................................................................................ 12
4.1 Baseline Model Calibration ........................................................................................13
5.0 Achievable Energy Targets .......................................................................................... 15
6.0 Operational Energy Conservation Measures ................................................................ 17
6.1 ECM A: Replace Pipe Insulation Removed During Maintenance ......................................17
6.2 ECM B: Temperature Set Point Adjustment for Peavy Hall & Richardson Hall ...................17
6.3 ECM C: Implement Setback Set Point during Unoccupied Hours – Peavy Hall ..................17
7.0 Analyzed Richardson Hall Energy Conservation Measures ........................................... 18
7.1 ECM #1: Improved Wall Insulation ............................................................................18
7.2 ECM #2: Improved Roof Insulation ............................................................................19
7.3 ECM #3: Improved Window Glazing ...........................................................................19
7.4 ECM #4: West (Admin) Penthouse Envelope insulation .................................................20
7.5 ECM #5: Lighting Controls for Classrooms ..................................................................20
7.6 ECM #6: Daylighting Controls Where Applicable ..........................................................21
7.7 ECM #7: Waterside Economizer for Chiller Plant ..........................................................23
7.8 ECM #8: Steam Trap Monitoring ...............................................................................23
7.9 ECM #9: Demand Control Ventilation with CO2 sensors ................................................24
7.10 ECM #10: Low Flow Plumbing Fixtures .......................................................................25
7.11 ECM #11: Exterior Lighting Control............................................................................25
7.12 ECM #12: Egress Lighting Controls ............................................................................26
7.13 ECM #13: Variable Speed Pumping with VFD and Two-Way Valves ................................26
7.14 ECM #14: Insulate CHW, Steam and HW piping ..........................................................27
January 25, 2012 OSU Richardson and Peavy Hall Energy Study: Energy Conservation Measure Analysis {Revised April 30, 2012}
11-1077 | iv
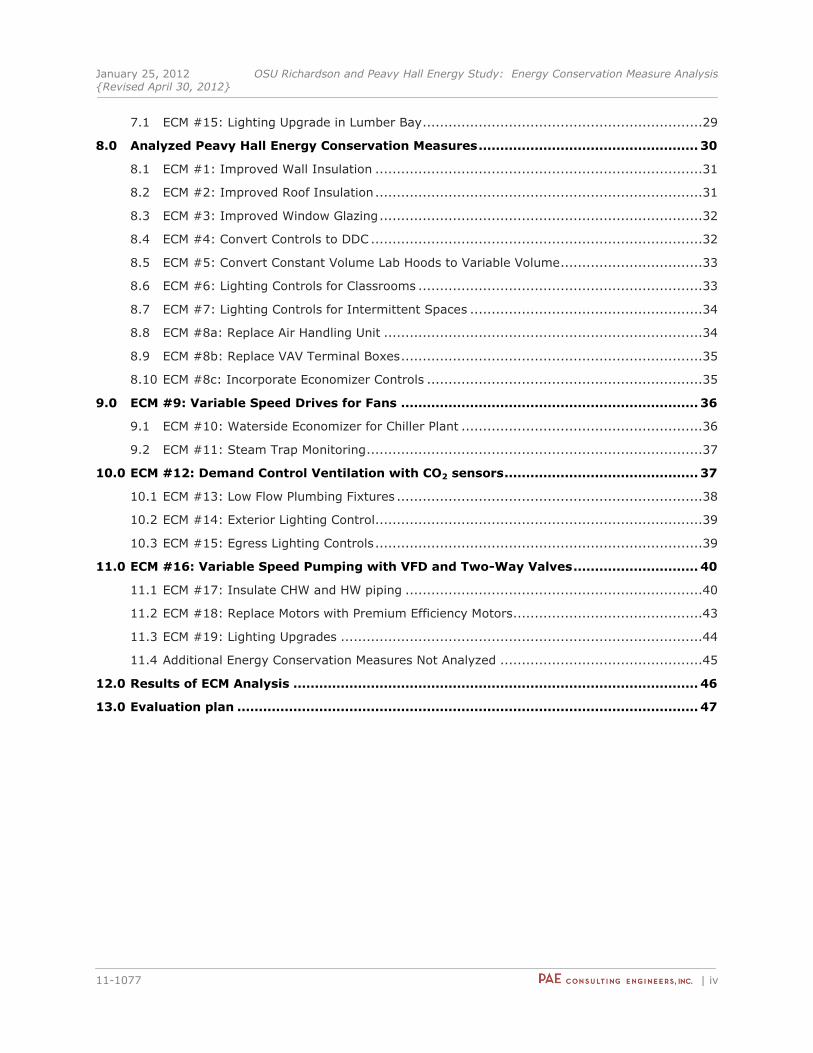
7.1 ECM #15: Lighting Upgrade in Lumber Bay .................................................................29
8.0 Analyzed Peavy Hall Energy Conservation Measures ................................................... 30
8.1 ECM #1: Improved Wall Insulation ............................................................................31
8.2 ECM #2: Improved Roof Insulation ............................................................................31
8.3 ECM #3: Improved Window Glazing ...........................................................................32
8.4 ECM #4: Convert Controls to DDC .............................................................................32
8.5 ECM #5: Convert Constant Volume Lab Hoods to Variable Volume .................................33
8.6 ECM #6: Lighting Controls for Classrooms ..................................................................33
8.7 ECM #7: Lighting Controls for Intermittent Spaces ......................................................34
8.8 ECM #8a: Replace Air Handling Unit ..........................................................................34
8.9 ECM #8b: Replace VAV Terminal Boxes ......................................................................35
8.10 ECM #8c: Incorporate Economizer Controls ................................................................35
9.0 ECM #9: Variable Speed Drives for Fans ..................................................................... 36
9.1 ECM #10: Waterside Economizer for Chiller Plant ........................................................36
9.2 ECM #11: Steam Trap Monitoring ..............................................................................37
10.0 ECM #12: Demand Control Ventilation with CO2 sensors ............................................. 37
10.1 ECM #13: Low Flow Plumbing Fixtures .......................................................................38
10.2 ECM #14: Exterior Lighting Control............................................................................39
10.3 ECM #15: Egress Lighting Controls ............................................................................39
11.0 ECM #16: Variable Speed Pumping with VFD and Two-Way Valves ............................. 40
11.1 ECM #17: Insulate CHW and HW piping .....................................................................40
11.2 ECM #18: Replace Motors with Premium Efficiency Motors ............................................43
11.3 ECM #19: Lighting Upgrades ....................................................................................44
11.4 Additional Energy Conservation Measures Not Analyzed ...............................................45
12.0 Results of ECM Analysis .............................................................................................. 46
13.0 Evaluation plan ........................................................................................................... 47
January 25, 2012 OSU Richardson and Peavy Hall Energy Study: Energy Conservation Measure Analysis {Revised April 30, 2012}
11-1077 | v
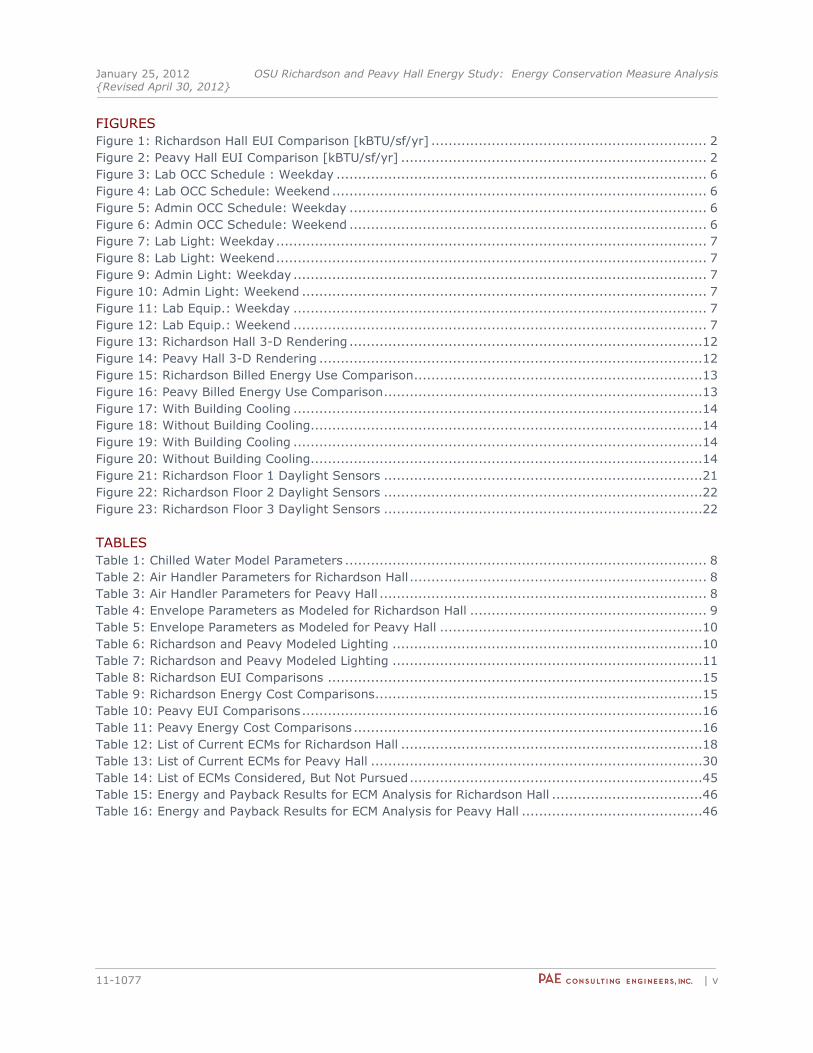
FIGURES
Figure 1: Richardson Hall EUI Comparison [kBTU/sf/yr] ................................................................ 2 Figure 2: Peavy Hall EUI Comparison [kBTU/sf/yr] ....................................................................... 2 Figure 3: Lab OCC Schedule : Weekday ...................................................................................... 6 Figure 4: Lab OCC Schedule: Weekend ....................................................................................... 6 Figure 5: Admin OCC Schedule: Weekday ................................................................................... 6 Figure 6: Admin OCC Schedule: Weekend ................................................................................... 6 Figure 7: Lab Light: Weekday .................................................................................................... 7 Figure 8: Lab Light: Weekend .................................................................................................... 7 Figure 9: Admin Light: Weekday ................................................................................................ 7 Figure 10: Admin Light: Weekend .............................................................................................. 7 Figure 11: Lab Equip.: Weekday ................................................................................................ 7 Figure 12: Lab Equip.: Weekend ................................................................................................ 7 Figure 13: Richardson Hall 3-D Rendering ..................................................................................12 Figure 14: Peavy Hall 3-D Rendering .........................................................................................12 Figure 15: Richardson Billed Energy Use Comparison ...................................................................13 Figure 16: Peavy Billed Energy Use Comparison ..........................................................................13 Figure 17: With Building Cooling ...............................................................................................14 Figure 18: Without Building Cooling...........................................................................................14 Figure 19: With Building Cooling ...............................................................................................14 Figure 20: Without Building Cooling...........................................................................................14 Figure 21: Richardson Floor 1 Daylight Sensors ..........................................................................21 Figure 22: Richardson Floor 2 Daylight Sensors ..........................................................................22 Figure 23: Richardson Floor 3 Daylight Sensors ..........................................................................22
TABLES
Table 1: Chilled Water Model Parameters .................................................................................... 8 Table 2: Air Handler Parameters for Richardson Hall ..................................................................... 8 Table 3: Air Handler Parameters for Peavy Hall ............................................................................ 8 Table 4: Envelope Parameters as Modeled for Richardson Hall ....................................................... 9 Table 5: Envelope Parameters as Modeled for Peavy Hall .............................................................10 Table 6: Richardson and Peavy Modeled Lighting ........................................................................10 Table 7: Richardson and Peavy Modeled Lighting ........................................................................11 Table 8: Richardson EUI Comparisons .......................................................................................15 Table 9: Richardson Energy Cost Comparisons ............................................................................15 Table 10: Peavy EUI Comparisons .............................................................................................16 Table 11: Peavy Energy Cost Comparisons .................................................................................16 Table 12: List of Current ECMs for Richardson Hall ......................................................................18 Table 13: List of Current ECMs for Peavy Hall .............................................................................30 Table 14: List of ECMs Considered, But Not Pursued ....................................................................45 Table 15: Energy and Payback Results for ECM Analysis for Richardson Hall ...................................46 Table 16: Energy and Payback Results for ECM Analysis for Peavy Hall ..........................................46
January 25, 2012 OSU Richardson and Peavy Hall Energy Study: Energy Conservation Measure Analysis {Revised April 30, 2012}
11-1077 | vi
PROJECT DIRECTORY
OWNER Oregon State University
Larrie Easterly
Project Manager
Email: [email protected]
ENERGY PAE Consulting Engineers, Inc.
ANALYST 808 SW 3rd Avenue, Suite 300
Portland, OR 97204
503-226-2921
Steve Reidy, PE, LEED AP
Project Manager, P.I.C.
Email: [email protected]
Jeff Becksfort, PE, LEED AP
Mechanical Lead
Email: [email protected]
Mike Smith, LEED AP
Mechanical
Email: [email protected]
Acknowledgment: “This material is based upon work supported by the Department of Energy under Award Number DE-EE0000140.”
Disclaimer: “This report was prepared as an account of work sponsored by an agency of the United States Government. Neither the United States Government nor any agency thereof, nor any of their employees, makes any warranty, express or implied, or assumes any legal liability or responsibility for the accuracy, completeness, or usefulness of any information, apparatus, product, or process disclosed, or represents that its use would not infringe privately owned rights. Reference herein to any specific commercial product, process, or service by trade name, trademark, manufacturer, or otherwise does not necessarily constitute or imply its endorsement, recommendation, or favoring by the United States Government or any agency thereof. The views and opinions of authors expressed herein do not necessarily state or reflect those of the United States Government or any agency thereof.”
January 25, 2012 OSU Richardson and Peavy Hall Energy Study: Energy Conservation Measure Analysis {Revised April 30, 2012}
11-1077 | 1
1.0 EXECUTIVE SUMMARY
Oregon State University Richardson Hall and Peavy Hall have been studied to examine
potential cost-effective energy upgrades for the buildings. A tour of the buildings was
conducted and an energy conservation measure (ECM) list was developed to perform
an energy analysis using computer simulation software. Using eQuest (DOE2.2)
energy analysis software baseline energy models were developed and each ECM was
modeled individually against the baseline to determine the anticipated energy savings
expected by installing the energy efficiency upgrade to the building. This report
presents these results and gives economic considerations for ECM decision making. In
addition, building operational issues were identified that need to be addressed and
impact the performance and energy use of the buildings.
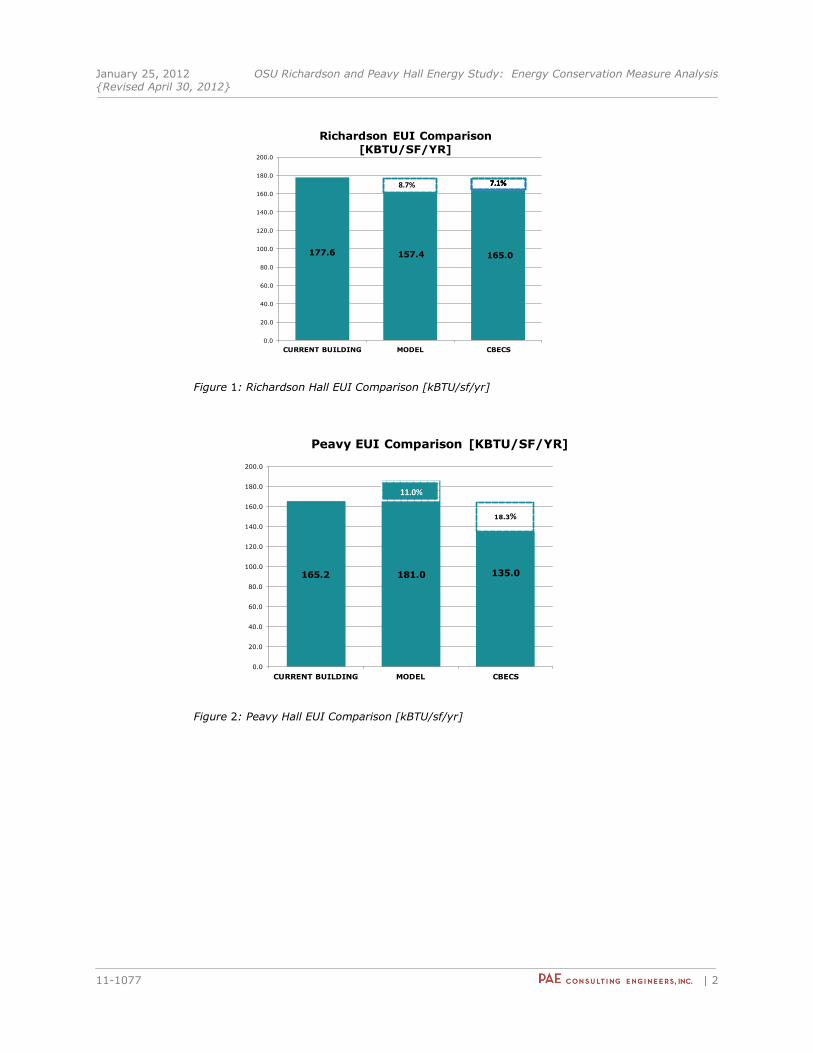
The energy use of Richardson Hall and Peavy Hall were compared to similar typical
buildings. Figures 1 and 2 below indicate a breakdown comparing energy use intensity
(EUI) values for the current energy bills, the modeled existing buildings and average
results from the US Commercial Building Energy Survey (CBECS 2003). Energy use for
Richardson Hall is currently approximately 7.1% higher than an average comparable
building. Energy use for Peavy Hall is currently approximately 18.3% higher than an
average comparable building. The annual building energy costs are also approximately
4.7% and 21.5% higher than average for Richardson and Peavy Halls, respectively.
PAE targeted energy reductions of 25% energy cost below the CBECS average for
these buildings as achievable with appropriate energy conservation measures. Please
see section 5 for a full analysis of building energy use and energy cost comparisons.
Sections 6, 7 and 8 of this report describe the operational and analyzed ECMs
developed for the building and the anticipated impact to building performance and
energy use. Implementation of the full ECM package could save 20% of the annual
energy costs for Richardson Hall and 50% of the annual energy costs for Peavy Hall
compared to the modeled baselines. This would result in a total energy cost savings of
approximately $47,000 for Richardson and $167,000 for Peavy Hall and with a simple
payback on investment of approximately 15 and 11 years, respectively.
PAE recommends implementation of all analyzed energy conservation measures
studied to maximize the opportunity of energy savings. However, the feasibility of
increasing insulation for exterior walls and replacing windows should be studied further
prior to implementation to verify the costs associated with these measures. In
addition, it is recommended that ECMs identified in Section 9 be considered for further
study for possible implementation. In particular, Peavy Hall has an open roof that may
accommodate a rooftop solar heating system for either heating water, hot water or
ventilation air preheat.
January 25, 2012 OSU Richardson and Peavy Hall Energy Study: Energy Conservation Measure Analysis {Revised April 30, 2012}
11-1077 | 2
0.0
20.0
40.0
60.0
80.0
100.0
120.0
140.0
160.0
180.0
200.0
CURRENT BUILDING MODEL CBECS
Richardson EUI Comparison
[KBTU/SF/YR]
8.7% 7.1%7.1%
165.0
7.1%
177.6 157.4
Figure 1: Richardson Hall EUI Comparison [kBTU/sf/yr]
0.0
20.0
40.0
60.0
80.0
100.0
120.0
140.0
160.0
180.0
200.0
CURRENT BUILDING MODEL CBECS
Peavy EUI Comparison [KBTU/SF/YR]
11.0%
18.3%
165.2 181.0 135.0
Figure 2: Peavy Hall EUI Comparison [kBTU/sf/yr]
January 25, 2012 OSU Richardson and Peavy Hall Energy Study: Energy Conservation Measure Analysis {Revised April 30, 2012}
11-1077 | 3
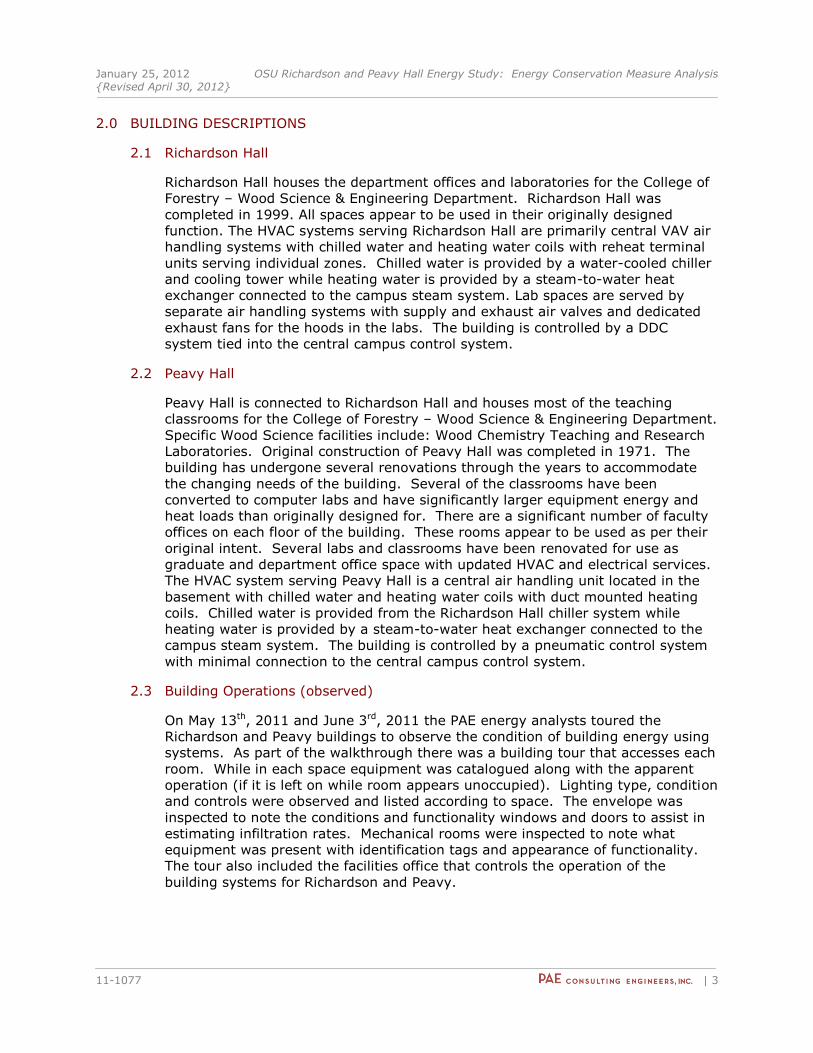
2.0 BUILDING DESCRIPTIONS
2.1 Richardson Hall
Richardson Hall houses the department offices and laboratories for the College of
Forestry – Wood Science & Engineering Department. Richardson Hall was
completed in 1999. All spaces appear to be used in their originally designed
function. The HVAC systems serving Richardson Hall are primarily central VAV air
handling systems with chilled water and heating water coils with reheat terminal
units serving individual zones. Chilled water is provided by a water-cooled chiller
and cooling tower while heating water is provided by a steam-to-water heat
exchanger connected to the campus steam system. Lab spaces are served by
separate air handling systems with supply and exhaust air valves and dedicated
exhaust fans for the hoods in the labs. The building is controlled by a DDC
system tied into the central campus control system.
2.2 Peavy Hall
Peavy Hall is connected to Richardson Hall and houses most of the teaching
classrooms for the College of Forestry – Wood Science & Engineering Department.
Specific Wood Science facilities include: Wood Chemistry Teaching and Research
Laboratories. Original construction of Peavy Hall was completed in 1971. The
building has undergone several renovations through the years to accommodate
the changing needs of the building. Several of the classrooms have been
converted to computer labs and have significantly larger equipment energy and
heat loads than originally designed for. There are a significant number of faculty
offices on each floor of the building. These rooms appear to be used as per their
original intent. Several labs and classrooms have been renovated for use as
graduate and department office space with updated HVAC and electrical services.
The HVAC system serving Peavy Hall is a central air handling unit located in the
basement with chilled water and heating water coils with duct mounted heating
coils. Chilled water is provided from the Richardson Hall chiller system while
heating water is provided by a steam-to-water heat exchanger connected to the
campus steam system. The building is controlled by a pneumatic control system
with minimal connection to the central campus control system.
2.3 Building Operations (observed)
On May 13th, 2011 and June 3rd, 2011 the PAE energy analysts toured the
Richardson and Peavy buildings to observe the condition of building energy using
systems. As part of the walkthrough there was a building tour that accesses each
room. While in each space equipment was catalogued along with the apparent
operation (if it is left on while room appears unoccupied). Lighting type, condition
and controls were observed and listed according to space. The envelope was
inspected to note the conditions and functionality windows and doors to assist in
estimating infiltration rates. Mechanical rooms were inspected to note what
equipment was present with identification tags and appearance of functionality.
The tour also included the facilities office that controls the operation of the
building systems for Richardson and Peavy.
January 25, 2012 OSU Richardson and Peavy Hall Energy Study: Energy Conservation Measure Analysis {Revised April 30, 2012}
11-1077 | 4
The list of observations was then used to generate inputs for the baseline model.
Equipment was input into the model on a space-by-space basis to capture the
energy use and heat into the space. Photos of lighting fixtures were reviewed
with lighting designers in an attempt to estimate the energy use per fixture. All
mechanical equipment manufacturer information was used to gather equipment
operating information to help guide modeling of HVAC systems. Trend data was
requested to verify the operation of the mechanical systems but this information
has not been able to be provided. Trend data would be used to verify system
controls and operation of the mechanical system for operating schedules, outside
airflow rates, reset schedules, setback temperatures, reset temperatures, etc.
2.4 Observed Operation Issues
The general findings of the walkthrough are noted for both buildings in sections
3.2 through 3.5. Some current operational issues that should be addressed in the
short term are mentioned below.
2.4.1 Peavy Library Remodel
While inspecting the library in Peavy building there were some occupants
that noted some space heating issues in the space. It seems that the
space is experiencing control issues and is overheating the space during
occupied hours. In addition many of the lights were not working and
looked to be very old. The occupants were packing library materials in
preparation for a remodel which is supposed to address some of the space
issues.
2.4.2 Richardson Main Lobby Daylighting Controls
While walking through the west lobbies of Richardson Hall daylight sensors
were observed but seem to not be properly calibrated or controlled. This
was noticed by the high lighting levels while there was direct sunlight
entering the space. Please see the ECM analysis below (Section 5) for
approximated energy savings for this operational energy conservation
measure.
2.4.3 Richardson Wood Science Research Lab
While walking through the high-bay research lab, a head OSU researcher
took the opportunity to express the lack of proper HVAC system operation.
His concern was with regard to proper space temperatures to ensure wood
experiments would be allowed to dry in a controlled environment. He gave
detailed description of how the space would reset after attempts to setback
temperatures and how his colleagues would be forced to physically
override terminal units in the ceiling. The nearby lab space containing the
kiln also had issues keeping up with the equipment load of the space. It is
suspected this issue was due to the drying kiln being larger than
anticipated in the Richardson building design.
January 25, 2012 OSU Richardson and Peavy Hall Energy Study: Energy Conservation Measure Analysis {Revised April 30, 2012}
11-1077 | 5
2.4.4 Pipe Insulation
It was observed that pipe insulation at some valves and fittings were
removed to service equipment but not replaced. Significant energy loss
will result from the missing insulation for the steam and chilled water
systems. Refer to ECM 14 for Richardson Hall and ECM 17 for Peavy Hall
for approximate energy savings that will result from replacement of
insulation that has been removed.
3.0 OVERVIEW OF TECHNICAL APPROACH
The energy analysis for the OSU Richardson Hall and Peavy Hall buildings was
performed using standard engineering calculation procedures and the DOE2.2
computer analysis program.
The building was modeled by using DOE2.2 inputs that closely approximate the actual
building. The floor plans of the building serve as the foundation of the model, with
individual spaces and areas divided into “zones” based upon space type, usage and the
HVAC system serving the zone. The exterior of the building, or envelope, is added to
the perimeter zones, complete with windows, geographical orientation (North, South,
etc.), glass type, external shading, construction type, insulation values and interior
space finish (carpet, concrete, etc.). Internal heat loads are modeled by adding
people, lights, and equipment to each zone. Occupancy schedules model the
movement of people in and out of the zones over the course of a day. Lighting
schedules model the time of use of lighting in each zone. Space temperatures to be
maintained for each zone in heating and cooling modes are specified.
The DOE2.2 simulation was run using hourly Corvallis, Oregon weather data. The
weather data simulates the effect of solar energy, outdoor air temperature, and wind
speeds on the envelope of the building and the outside air used for ventilation. The
predicted energy use and costs generated by the baseline model are a function of the
local utility rates and the efficiencies of the HVAC systems modeled.
Each energy conservation measure (ECM) is analyzed separately. Then a model with all
of the recommended measures is performed to determine the final energy performance
to capture the interactions between them.
ASHRAE 90.1 - 2004 Appendix G, as well as design drawings/specifications, were used
to determine the recommended building and baseline model characteristics.
Disclaimer
Building energy models are intended to show relative savings and determine the cost
effectiveness of conservation measures. They are not intended to be used for predicting the actual energy use of proposed building.
Actual utility billing is based on a number of factors determined only after the building
has been built and operating. Energy models are based on the best information available
but cannot account for every factor that affects actual building’s energy use. Therefore the information presented here should be understood as a best estimate.
January 25, 2012 OSU Richardson and Peavy Hall Energy Study: Energy Conservation Measure Analysis {Revised April 30, 2012}
11-1077 | 6
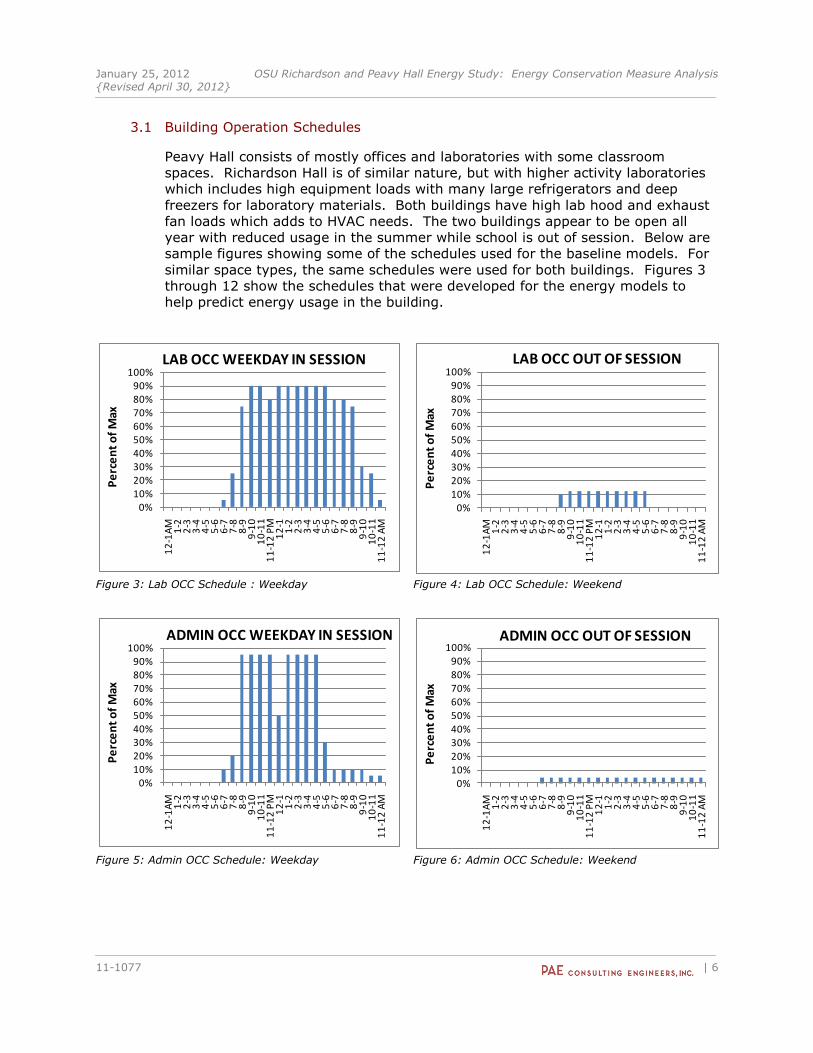
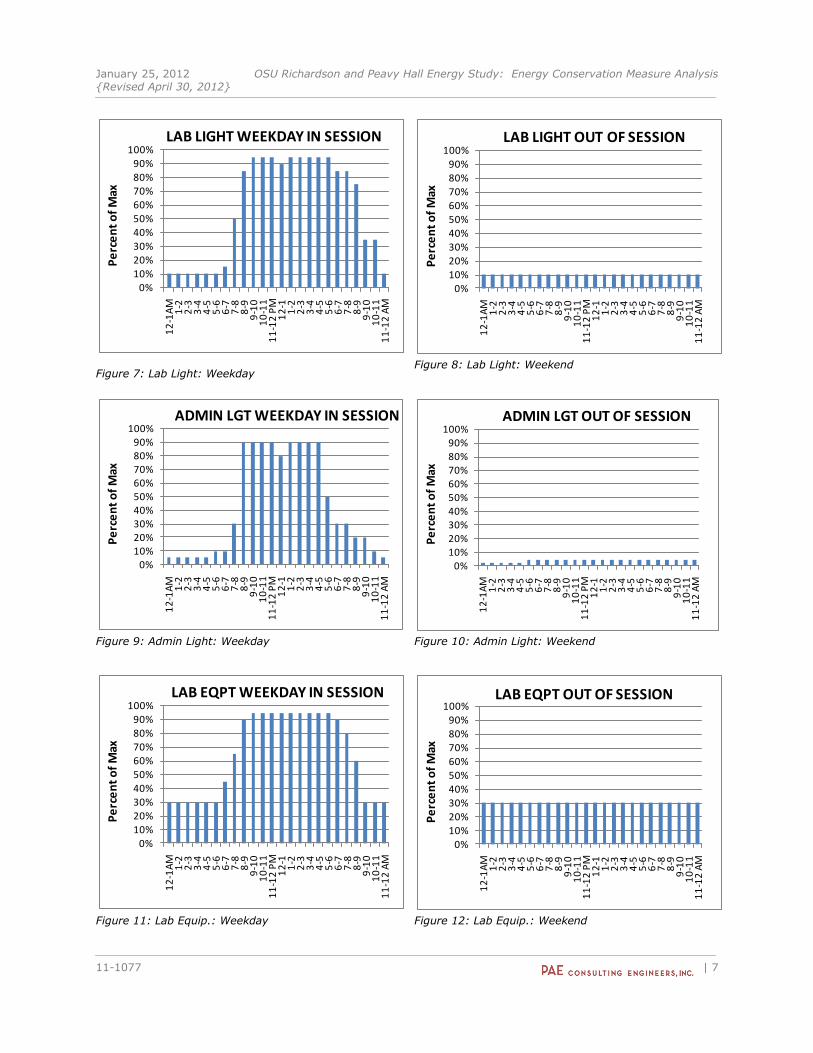
3.1 Building Operation Schedules
Peavy Hall consists of mostly offices and laboratories with some classroom
spaces. Richardson Hall is of similar nature, but with higher activity laboratories
which includes high equipment loads with many large refrigerators and deep
freezers for laboratory materials. Both buildings have high lab hood and exhaust
fan loads which adds to HVAC needs. The two buildings appear to be open all
year with reduced usage in the summer while school is out of session. Below are
sample figures showing some of the schedules used for the baseline models. For
similar space types, the same schedules were used for both buildings. Figures 3
through 12 show the schedules that were developed for the energy models to
help predict energy usage in the building.
Figure 3: Lab OCC Schedule : Weekday Figure 4: Lab OCC Schedule: Weekend
Figure 5: Admin OCC Schedule: Weekday Figure 6: Admin OCC Schedule: Weekend
0%10%20%30%40%50%60%70%80%90%
100%
12
-1A
M1
-22
-33
-44
-55
-66
-77
-88
-99
-10
10
-11
11
-12
PM
12
-11
-22
-33
-44
-55
-66
-77
-88
-99
-10
10
-11
11
-12
AM
Pe
rce
nt
of
Max
LAB OCC WEEKDAY IN SESSION
0%
10%
20%
30%
40%
50%60%
70%
80%
90%100%
12
-1A
M1
-22
-33
-44
-55
-66
-77
-88
-99
-10
10
-11
11
-12
PM
12
-11
-22
-33
-44
-55
-66
-77
-88
-99
-10
10
-11
11
-12
AM
Pe
rce
nt
of
Max
LAB OCC OUT OF SESSION
0%10%20%30%40%50%60%70%80%90%
100%
12
-1A
M1
-22
-33
-44
-55
-66
-77
-88
-99
-10
10
-11
11
-12
PM
12
-11
-22
-33
-44
-55
-66
-77
-88
-99
-10
10
-11
11
-12
AM
Pe
rce
nt
of
Max
ADMIN OCC WEEKDAY IN SESSION
0%
10%
20%
30%
40%
50%60%
70%
80%
90%100%
12
-1A
M1
-22
-33
-44
-55
-66
-77
-88
-99
-10
10
-11
11
-12
PM
12
-11
-22
-33
-44
-55
-66
-77
-88
-99
-10
10
-11
11
-12
AM
Pe
rce
nt
of
Max
ADMIN OCC OUT OF SESSION
January 25, 2012 OSU Richardson and Peavy Hall Energy Study: Energy Conservation Measure Analysis {Revised April 30, 2012}
11-1077 | 7
Figure 7: Lab Light: Weekday Figure 8: Lab Light: Weekend
Figure 9: Admin Light: Weekday Figure 10: Admin Light: Weekend
Figure 11: Lab Equip.: Weekday Figure 12: Lab Equip.: Weekend
0%
10%
20%
30%
40%
50%
60%70%
80%
90%
100%
12
-1A
M1
-22
-33
-44
-55
-66
-77
-88
-99
-10
10
-11
11
-12
PM
12
-11
-22
-33
-44
-55
-66
-77
-88
-99
-10
10
-11
11
-12
AM
Pe
rce
nt
of
Max
LAB LIGHT WEEKDAY IN SESSION
0%
10%
20%
30%
40%
50%
60%
70%
80%
90%
100%
12
-1A
M1
-22
-33
-44
-55
-66
-77
-88
-99
-10
10
-11
11
-12
PM
12
-11
-22
-33
-44
-55
-66
-77
-88
-99
-10
10
-11
11
-12
AM
Pe
rce
nt
of
Max
LAB LIGHT OUT OF SESSION
0%10%20%30%40%50%60%70%80%90%
100%
12
-1A
M1
-22
-33
-44
-55
-66
-77
-88
-99
-10
10
-11
11
-12
PM
12
-11
-22
-33
-44
-55
-66
-77
-88
-99
-10
10
-11
11
-12
AM
Pe
rce
nt
of
Max
ADMIN LGT WEEKDAY IN SESSION
0%
10%
20%
30%
40%
50%
60%
70%
80%
90%
100%
12
-1A
M1
-22
-33
-44
-55
-66
-77
-88
-99
-10
10
-11
11
-12
PM
12
-11
-22
-33
-44
-55
-66
-77
-88
-99
-10
10
-11
11
-12
AM
Pe
rce
nt
of
Max
ADMIN LGT OUT OF SESSION
0%
10%
20%
30%
40%
50%
60%70%
80%
90%
100%
12
-1A
M1
-22
-33
-44
-55
-66
-77
-88
-99
-10
10
-11
11
-12
PM
12
-11
-22
-33
-44
-55
-66
-77
-88
-99
-10
10
-11
11
-12
AM
Pe
rce
nt
of
Max
LAB EQPT WEEKDAY IN SESSION
0%
10%
20%
30%
40%
50%
60%
70%
80%
90%
100%
12
-1A
M1
-22
-33
-44
-55
-66
-77
-88
-99
-10
10
-11
11
-12
PM
12
-11
-22
-33
-44
-55
-66
-77
-88
-99
-10
10
-11
11
-12
AM
Pe
rce
nt
of
Max
LAB EQPT OUT OF SESSION
January 25, 2012 OSU Richardson and Peavy Hall Energy Study: Energy Conservation Measure Analysis {Revised April 30, 2012}
11-1077 | 8
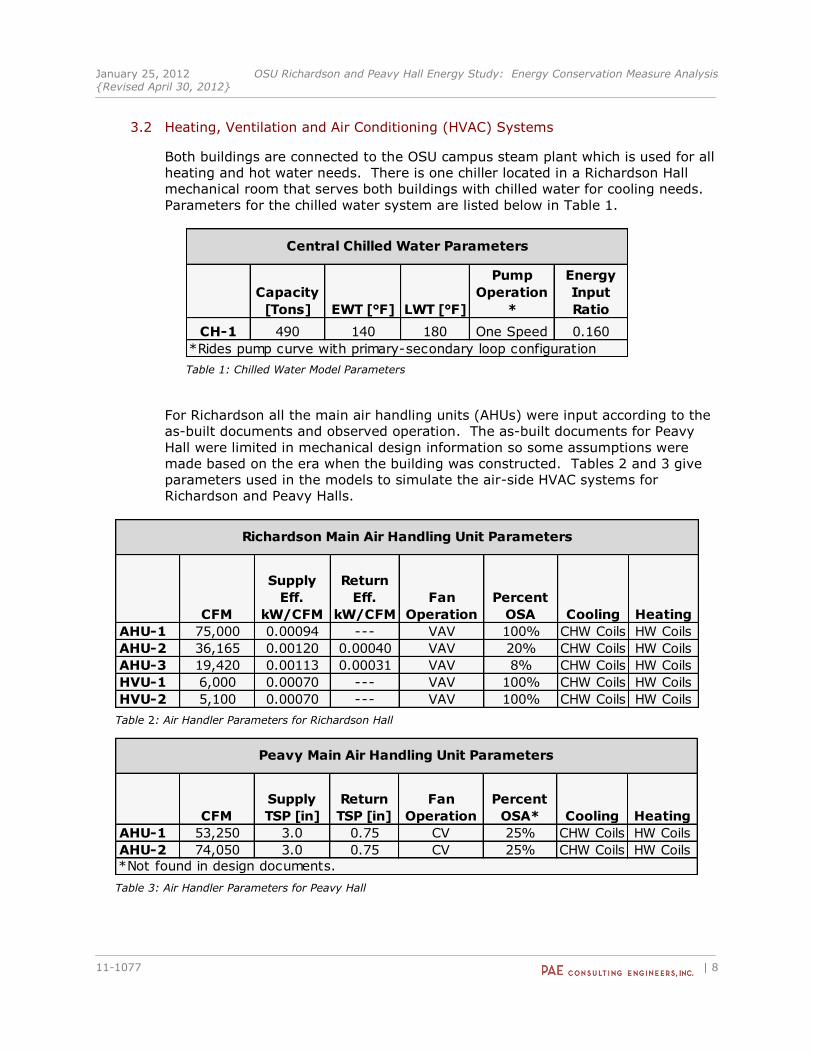
3.2 Heating, Ventilation and Air Conditioning (HVAC) Systems
Both buildings are connected to the OSU campus steam plant which is used for all
heating and hot water needs. There is one chiller located in a Richardson Hall
mechanical room that serves both buildings with chilled water for cooling needs.
Parameters for the chilled water system are listed below in Table 1.
Capacity
[Tons] EWT [°F] LWT [°F]
Pump
Operation
*
Energy
Input
Ratio
CH-1 490 140 180 One Speed 0.160
*Rides pump curve with primary-secondary loop configuration
Central Chilled Water Parameters
Table 1: Chilled Water Model Parameters
For Richardson all the main air handling units (AHUs) were input according to the
as-built documents and observed operation. The as-built documents for Peavy
Hall were limited in mechanical design information so some assumptions were
made based on the era when the building was constructed. Tables 2 and 3 give
parameters used in the models to simulate the air-side HVAC systems for
Richardson and Peavy Halls.
CFM
Supply
Eff.
kW/CFM
Return
Eff.
kW/CFM
Fan
Operation
Percent
OSA Cooling Heating
AHU-1 75,000 0.00094 --- VAV 100% CHW Coils HW Coils
AHU-2 36,165 0.00120 0.00040 VAV 20% CHW Coils HW Coils
AHU-3 19,420 0.00113 0.00031 VAV 8% CHW Coils HW Coils
HVU-1 6,000 0.00070 --- VAV 100% CHW Coils HW Coils
HVU-2 5,100 0.00070 --- VAV 100% CHW Coils HW Coils
Richardson Main Air Handling Unit Parameters
Table 2: Air Handler Parameters for Richardson Hall
CFM
Supply
TSP [in]
Return
TSP [in]
Fan
Operation
Percent
OSA* Cooling Heating
AHU-1 53,250 3.0 0.75 CV 25% CHW Coils HW Coils
AHU-2 74,050 3.0 0.75 CV 25% CHW Coils HW Coils
Peavy Main Air Handling Unit Parameters
*Not found in design documents.
Table 3: Air Handler Parameters for Peavy Hall
January 25, 2012 OSU Richardson and Peavy Hall Energy Study: Energy Conservation Measure Analysis {Revised April 30, 2012}
11-1077 | 9
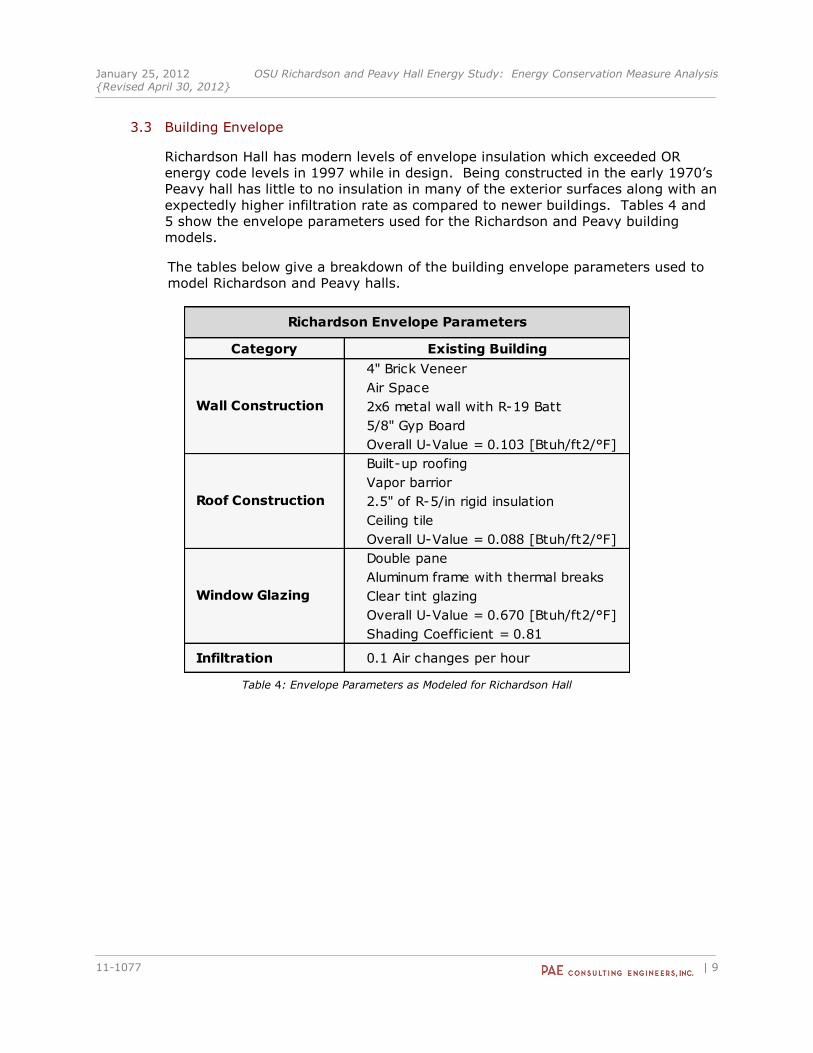
3.3 Building Envelope
Richardson Hall has modern levels of envelope insulation which exceeded OR
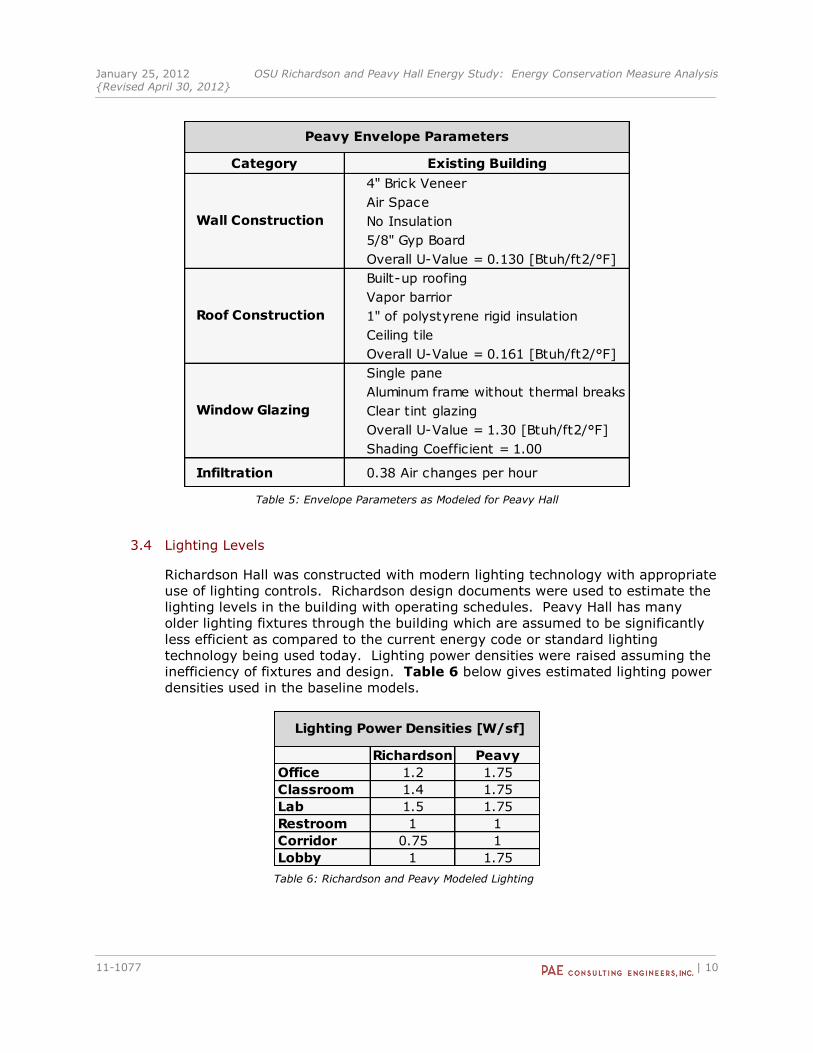
energy code levels in 1997 while in design. Being constructed in the early 1970’s
Peavy hall has little to no insulation in many of the exterior surfaces along with an
expectedly higher infiltration rate as compared to newer buildings. Tables 4 and
5 show the envelope parameters used for the Richardson and Peavy building
models.
The tables below give a breakdown of the building envelope parameters used to
model Richardson and Peavy halls.
Category Existing Building
4" Brick Veneer
Air Space
2x6 metal wall with R-19 Batt
5/8" Gyp Board
Overall U-Value = 0.103 [Btuh/ft2/°F]
Built-up roofing
Vapor barrior
2.5" of R-5/in rigid insulation
Ceiling tile
Overall U-Value = 0.088 [Btuh/ft2/°F]
Double pane
Aluminum frame with thermal breaks
Clear tint glazing
Overall U-Value = 0.670 [Btuh/ft2/°F]
Shading Coefficient = 0.81
Infiltration 0.1 Air changes per hour
Richardson Envelope Parameters
Wall Construction
Roof Construction
Window Glazing
Table 4: Envelope Parameters as Modeled for Richardson Hall
January 25, 2012 OSU Richardson and Peavy Hall Energy Study: Energy Conservation Measure Analysis {Revised April 30, 2012}
11-1077 | 10
Category Existing Building
4" Brick Veneer
Air Space
No Insulation
5/8" Gyp Board
Overall U-Value = 0.130 [Btuh/ft2/°F]
Built-up roofing
Vapor barrior
1" of polystyrene rigid insulation
Ceiling tile
Overall U-Value = 0.161 [Btuh/ft2/°F]
Single pane
Aluminum frame without thermal breaks
Clear tint glazing
Overall U-Value = 1.30 [Btuh/ft2/°F]
Shading Coefficient = 1.00
Infiltration 0.38 Air changes per hour
Window Glazing
Peavy Envelope Parameters
Wall Construction
Roof Construction
Table 5: Envelope Parameters as Modeled for Peavy Hall
3.4 Lighting Levels
Richardson Hall was constructed with modern lighting technology with appropriate
use of lighting controls. Richardson design documents were used to estimate the
lighting levels in the building with operating schedules. Peavy Hall has many
older lighting fixtures through the building which are assumed to be significantly
less efficient as compared to the current energy code or standard lighting
technology being used today. Lighting power densities were raised assuming the
inefficiency of fixtures and design. Table 6 below gives estimated lighting power
densities used in the baseline models.
Richardson Peavy
Office 1.2 1.75
Classroom 1.4 1.75
Lab 1.5 1.75
Restroom 1 1
Corridor 0.75 1
Lobby 1 1.75
Lighting Power Densities [W/sf]
Table 6: Richardson and Peavy Modeled Lighting
January 25, 2012 OSU Richardson and Peavy Hall Energy Study: Energy Conservation Measure Analysis {Revised April 30, 2012}
11-1077 | 11
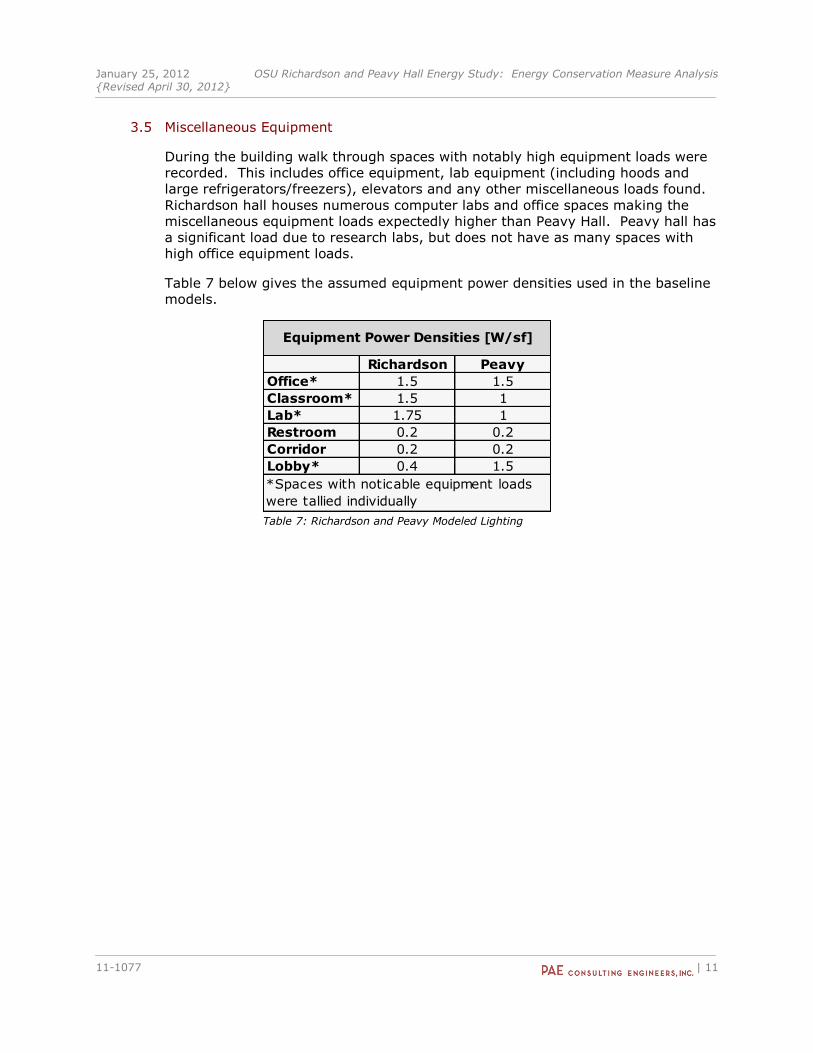
3.5 Miscellaneous Equipment
During the building walk through spaces with notably high equipment loads were
recorded. This includes office equipment, lab equipment (including hoods and
large refrigerators/freezers), elevators and any other miscellaneous loads found.
Richardson hall houses numerous computer labs and office spaces making the
miscellaneous equipment loads expectedly higher than Peavy Hall. Peavy hall has
a significant load due to research labs, but does not have as many spaces with
high office equipment loads.
Table 7 below gives the assumed equipment power densities used in the baseline
models.
Richardson Peavy
Office* 1.5 1.5
Classroom* 1.5 1
Lab* 1.75 1
Restroom 0.2 0.2
Corridor 0.2 0.2
Lobby* 0.4 1.5
Equipment Power Densities [W/sf]
*Spaces with noticable equipment loads
were tallied individually Table 7: Richardson and Peavy Modeled Lighting
January 25, 2012 OSU Richardson and Peavy Hall Energy Study: Energy Conservation Measure Analysis {Revised April 30, 2012}
11-1077 | 12
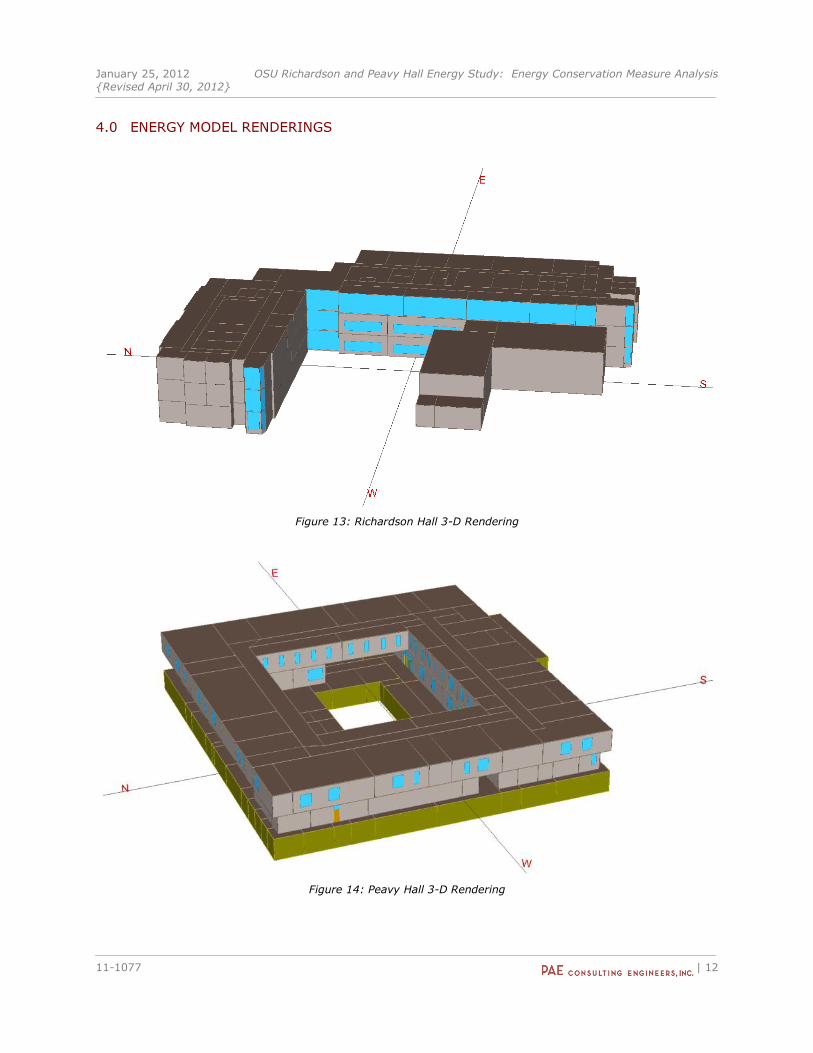
4.0 ENERGY MODEL RENDERINGS
Figure 13: Richardson Hall 3-D Rendering
Figure 14: Peavy Hall 3-D Rendering
January 25, 2012 OSU Richardson and Peavy Hall Energy Study: Energy Conservation Measure Analysis {Revised April 30, 2012}
11-1077 | 13
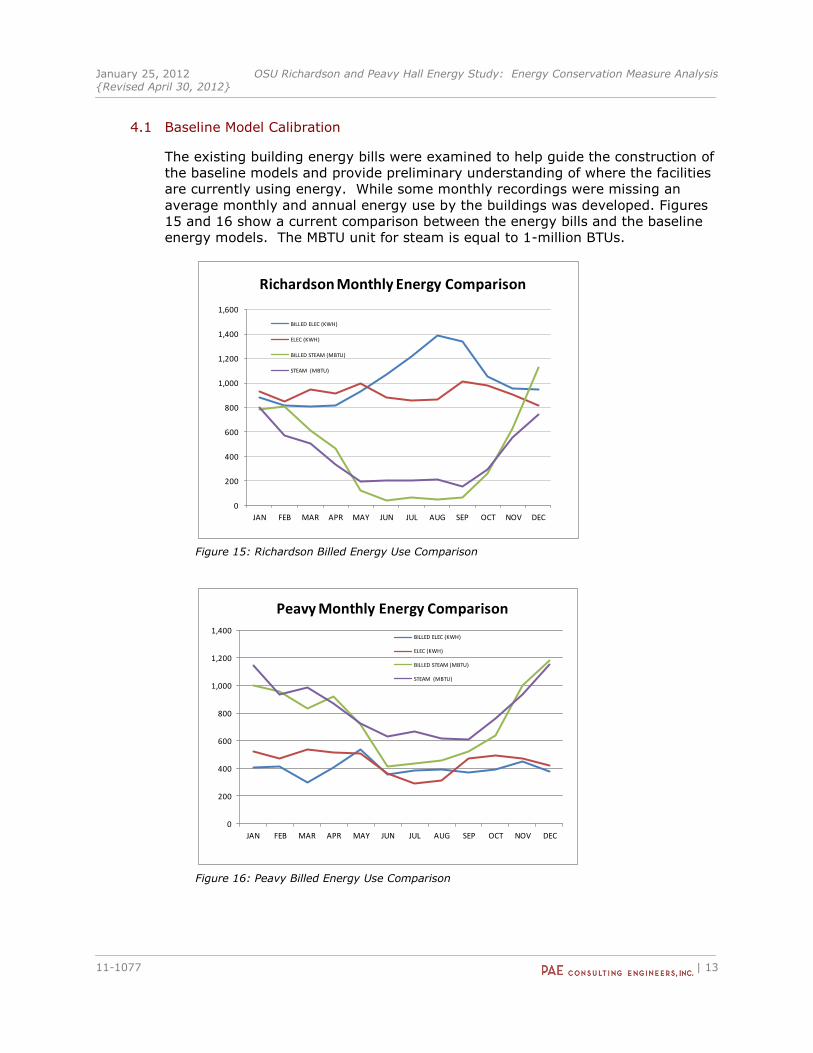
4.1 Baseline Model Calibration
The existing building energy bills were examined to help guide the construction of
the baseline models and provide preliminary understanding of where the facilities
are currently using energy. While some monthly recordings were missing an
average monthly and annual energy use by the buildings was developed. Figures
15 and 16 show a current comparison between the energy bills and the baseline
energy models. The MBTU unit for steam is equal to 1-million BTUs.
Figure 15: Richardson Billed Energy Use Comparison
Figure 16: Peavy Billed Energy Use Comparison
0
200
400
600
800
1,000
1,200
1,400
1,600
JAN FEB MAR APR MAY JUN JUL AUG SEP OCT NOV DEC
Richardson Monthly Energy Comparison
BILLED ELEC (KWH)
ELEC (KWH)
BILLED STEAM (MBTU)
STEAM (MBTU)
0
200
400
600
800
1,000
1,200
1,400
JAN FEB MAR APR MAY JUN JUL AUG SEP OCT NOV DEC
Peavy Monthly Energy Comparison
BILLED ELEC (KWH)
ELEC (KWH)
BILLED STEAM (MBTU)
STEAM (MBTU)
January 25, 2012 OSU Richardson and Peavy Hall Energy Study: Energy Conservation Measure Analysis {Revised April 30, 2012}
11-1077 | 14
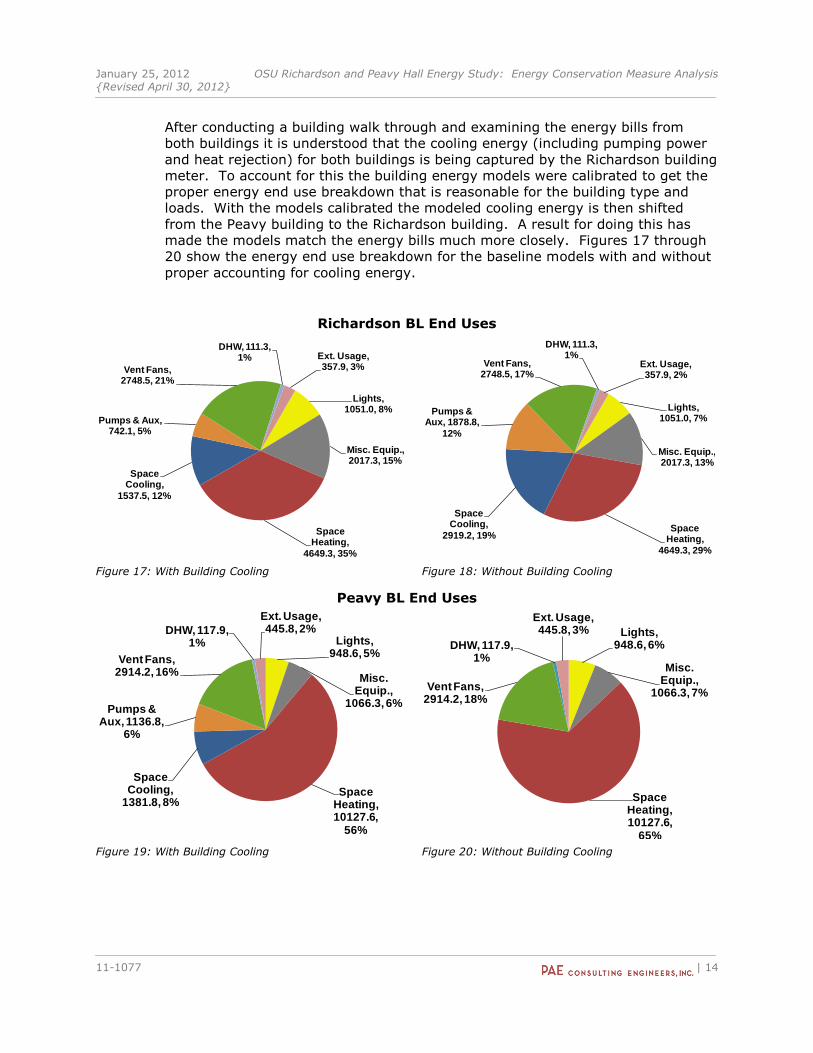
After conducting a building walk through and examining the energy bills from
both buildings it is understood that the cooling energy (including pumping power
and heat rejection) for both buildings is being captured by the Richardson building
meter. To account for this the building energy models were calibrated to get the
proper energy end use breakdown that is reasonable for the building type and
loads. With the models calibrated the modeled cooling energy is then shifted
from the Peavy building to the Richardson building. A result for doing this has
made the models match the energy bills much more closely. Figures 17 through
20 show the energy end use breakdown for the baseline models with and without
proper accounting for cooling energy.
Richardson BL End Uses
Figure 17: With Building Cooling Figure 18: Without Building Cooling
Peavy BL End Uses
Figure 19: With Building Cooling Figure 20: Without Building Cooling
Lights, 1051.0, 8%
Misc. Equip., 2017.3, 15%
Space Heating,
4649.3, 35%
Space Cooling,
1537.5, 12%
Pumps & Aux, 742.1, 5%
Vent Fans, 2748.5, 21%
DHW, 111.3, 1% Ext. Usage,
357.9, 3%
Richardson Model Energy End Uses [MBTU]
Lights, 1051.0, 7%
Misc. Equip., 2017.3, 13%
Space Heating,
4649.3, 29%
Space Cooling,
2919.2, 19%
Pumps & Aux, 1878.8,
12%
Vent Fans, 2748.5, 17%
DHW, 111.3, 1%
Ext. Usage, 357.9, 2%
Richardson Model Energy End Uses [MBTU]
Lights, 948.6, 5%
Misc. Equip.,
1066.3, 6%
Space Heating, 10127.6,
56%
Space Cooling,
1381.8, 8%
Pumps & Aux, 1136.8,
6%
Vent Fans, 2914.2, 16%
DHW, 117.9, 1%
Ext. Usage, 445.8, 2%
Peavy Model Energy End Uses [MBTU]
Lights, 948.6, 6%
Misc. Equip.,
1066.3, 7%
Space Heating, 10127.6,
65%
Vent Fans, 2914.2, 18%
DHW, 117.9, 1%
Ext. Usage, 445.8, 3%
Peavy Model Energy End Uses [MBTU]
January 25, 2012 OSU Richardson and Peavy Hall Energy Study: Energy Conservation Measure Analysis {Revised April 30, 2012}
11-1077 | 15
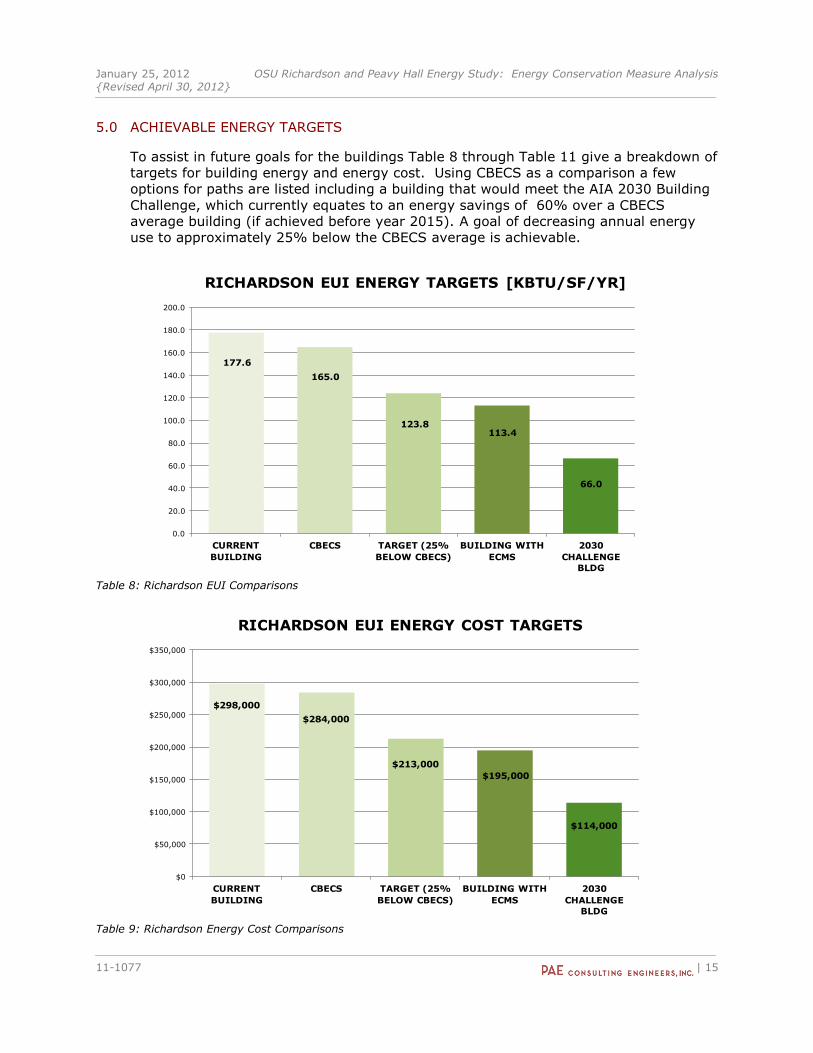
5.0 ACHIEVABLE ENERGY TARGETS
To assist in future goals for the buildings Table 8 through Table 11 give a breakdown of
targets for building energy and energy cost. Using CBECS as a comparison a few
options for paths are listed including a building that would meet the AIA 2030 Building
Challenge, which currently equates to an energy savings of 60% over a CBECS
average building (if achieved before year 2015). A goal of decreasing annual energy
use to approximately 25% below the CBECS average is achievable.
0.0
20.0
40.0
60.0
80.0
100.0
120.0
140.0
160.0
180.0
200.0
CURRENT
BUILDING
CBECS TARGET (25%
BELOW CBECS)
BUILDING WITH
ECMS
2030
CHALLENGE
BLDG
RICHARDSON EUI ENERGY TARGETS [KBTU/SF/YR]
123.8
177.6
113.4
165.0
66.0
Table 8: Richardson EUI Comparisons
$298,000
$284,000
$213,000
$195,000
$114,000
$0
$50,000
$100,000
$150,000
$200,000
$250,000
$300,000
$350,000
CURRENT
BUILDING
CBECS TARGET (25%
BELOW CBECS)
BUILDING WITH
ECMS
2030
CHALLENGE
BLDG
RICHARDSON EUI ENERGY COST TARGETS
Table 9: Richardson Energy Cost Comparisons
January 25, 2012 OSU Richardson and Peavy Hall Energy Study: Energy Conservation Measure Analysis {Revised April 30, 2012}
11-1077 | 16
0.0
20.0
40.0
60.0
80.0
100.0
120.0
140.0
160.0
180.0
CURRENT
BUILDING
CBECS TARGET (25%
BELOW CBECS)
BUILDING WITH
ECMS
2030
CHALLENGE
BLDG
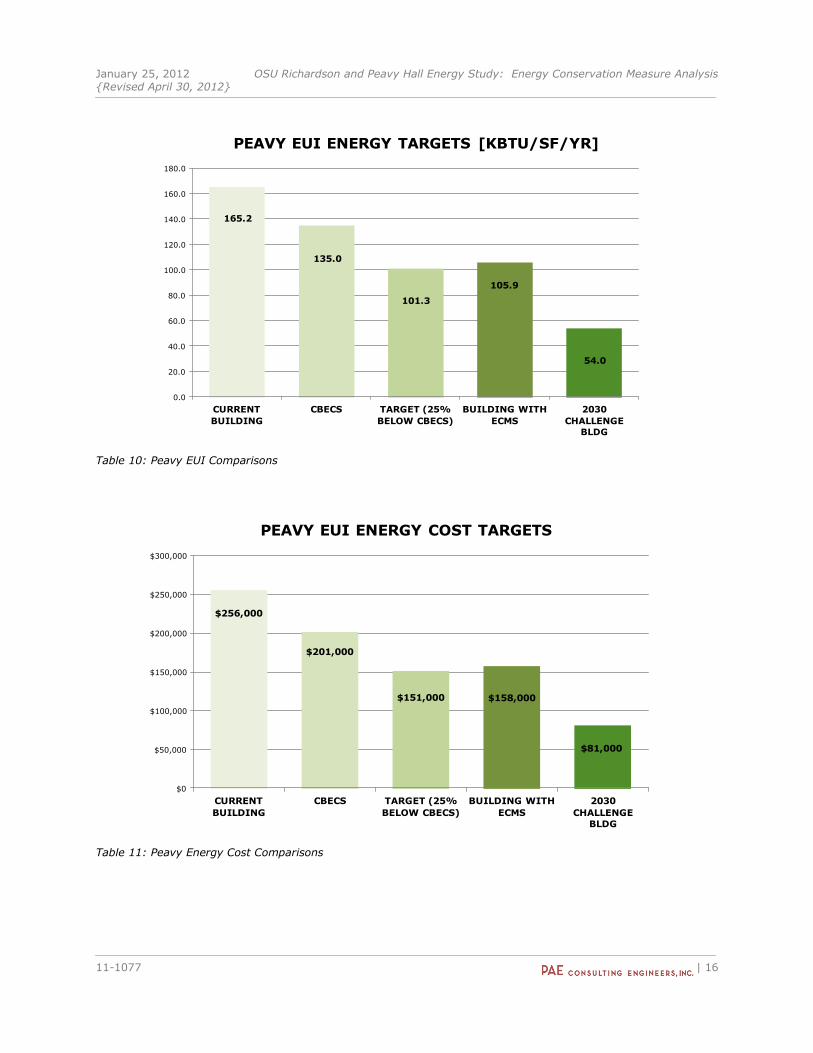
PEAVY EUI ENERGY TARGETS [KBTU/SF/YR]
101.3
165.2
105.9
135.0
54.0
Table 10: Peavy EUI Comparisons
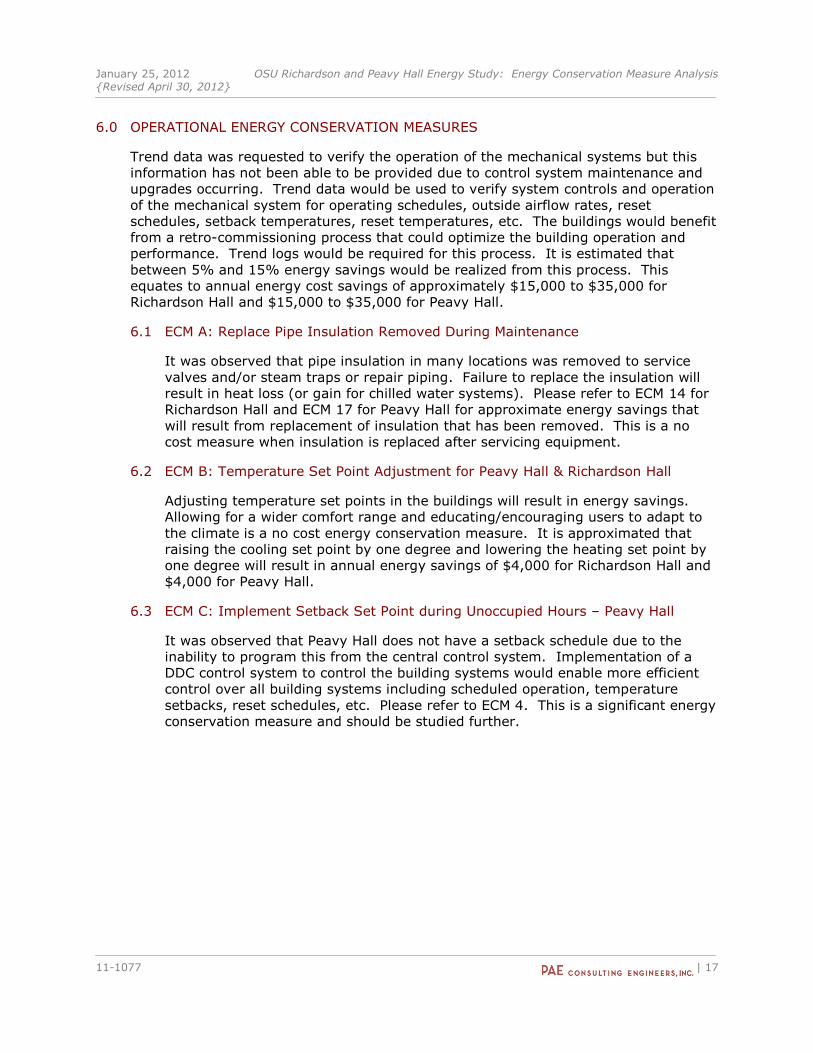
$256,000
$201,000
$151,000 $158,000
$81,000
$0
$50,000
$100,000
$150,000
$200,000
$250,000
$300,000
CURRENT
BUILDING
CBECS TARGET (25%
BELOW CBECS)
BUILDING WITH
ECMS
2030
CHALLENGE
BLDG
PEAVY EUI ENERGY COST TARGETS
Table 11: Peavy Energy Cost Comparisons
January 25, 2012 OSU Richardson and Peavy Hall Energy Study: Energy Conservation Measure Analysis {Revised April 30, 2012}
11-1077 | 17
6.0 OPERATIONAL ENERGY CONSERVATION MEASURES
Trend data was requested to verify the operation of the mechanical systems but this
information has not been able to be provided due to control system maintenance and
upgrades occurring. Trend data would be used to verify system controls and operation
of the mechanical system for operating schedules, outside airflow rates, reset
schedules, setback temperatures, reset temperatures, etc. The buildings would benefit
from a retro-commissioning process that could optimize the building operation and
performance. Trend logs would be required for this process. It is estimated that
between 5% and 15% energy savings would be realized from this process. This
equates to annual energy cost savings of approximately $15,000 to $35,000 for
Richardson Hall and $15,000 to $35,000 for Peavy Hall.
6.1 ECM A: Replace Pipe Insulation Removed During Maintenance
It was observed that pipe insulation in many locations was removed to service
valves and/or steam traps or repair piping. Failure to replace the insulation will
result in heat loss (or gain for chilled water systems). Please refer to ECM 14 for
Richardson Hall and ECM 17 for Peavy Hall for approximate energy savings that
will result from replacement of insulation that has been removed. This is a no
cost measure when insulation is replaced after servicing equipment.
6.2 ECM B: Temperature Set Point Adjustment for Peavy Hall & Richardson Hall
Adjusting temperature set points in the buildings will result in energy savings.
Allowing for a wider comfort range and educating/encouraging users to adapt to
the climate is a no cost energy conservation measure. It is approximated that
raising the cooling set point by one degree and lowering the heating set point by
one degree will result in annual energy savings of $4,000 for Richardson Hall and
$4,000 for Peavy Hall.
6.3 ECM C: Implement Setback Set Point during Unoccupied Hours – Peavy Hall
It was observed that Peavy Hall does not have a setback schedule due to the
inability to program this from the central control system. Implementation of a
DDC control system to control the building systems would enable more efficient
control over all building systems including scheduled operation, temperature
setbacks, reset schedules, etc. Please refer to ECM 4. This is a significant energy
conservation measure and should be studied further.
January 25, 2012 OSU Richardson and Peavy Hall Energy Study: Energy Conservation Measure Analysis {Revised April 30, 2012}
11-1077 | 18
7.0 ANALYZED RICHARDSON HALL ENERGY CONSERVATION MEASURES
PAE conducted a meeting on June 24, 2011 to review the preliminary energy modeling
results and determine which energy conservation measures will continue to be studied.
The following results incorporate the comments from this meeting. See appendix for a
copy of the information discussed and the comments documented on this information.
The costs for each measure have been approximated based on compliance with the
Buy American and Davis-Bacon requirements.
1 Improved Wall Insulation (meet current OR Energy Code levels)
2 Improved Roof Insulation (meet current OR Energy Code levels)
3 Improved Window Glazing (meet current OR Energy Code levels)
4 West (admin) penthouse envelope insulation
5 Lighting controls for the classrooms
6 Daylighting controls where applicable
7 Waterside economizer for chiller plant
8 Steam trap monitoring, temperature sensors for failure of traps / replacement of traps
9 CO2 demand based ventilation
10 Low flow plumbing fixtures
11 Exterior lighting control
12 Egress lighting controls
13 Pumping energy savings with VFD and two way valves for HW & CHW
14 Insulate steam and condensate piping where missing (traps, PRV's, etc.)
15 Lighting upgrade for Lumber Bay
Richardson Hall - Energy Conservation Measures
Table 12: List of Current ECMs for Richardson Hall
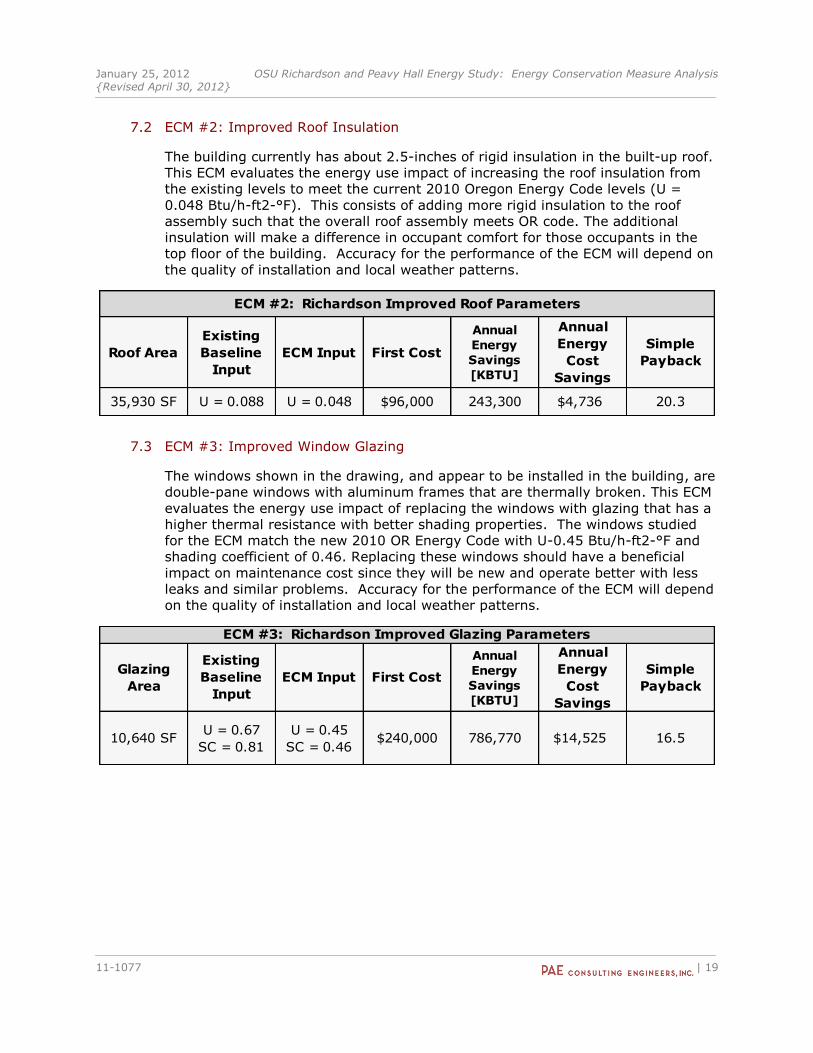
7.1 ECM #1: Improved Wall Insulation
Currently the building has R-19 batt insulation between 2x6 metal wall studs as
shown in the original design documents. This ECM evaluates the energy use
impact of increasing the wall insulation from the existing conditions to meet the
current 2010 Oregon Energy Code levels. This consists of adding rigid insulation
to the wall construction to meet an overall assembly value of U = 0.064 Btu/h-ft2-
°F. This is assumed to be achieved by adding blown-in insulation to the wall with
the addition of more rigid insulation if necessary to meet code Levels. This
measure should also help in reducing infiltration and make occupants closer to the
perimeter more comfortable throughout the year. Accuracy for the performance
of the ECM will depend on the quality of installation and local weather patterns.
Wall Area
Existing
Baseline
Input
ECM Input First Cost
Annual
Energy
Savings
[KBTU]
Annual
Energy
Cost
Savings
Simple
Payback
43,090 SF U = 0.103 U = 0.064 $144,000 44,547 $998 144.3
ECM #1: Richardson Improved Wall Parameters
January 25, 2012 OSU Richardson and Peavy Hall Energy Study: Energy Conservation Measure Analysis {Revised April 30, 2012}
11-1077 | 19
7.2 ECM #2: Improved Roof Insulation
The building currently has about 2.5-inches of rigid insulation in the built-up roof.
This ECM evaluates the energy use impact of increasing the roof insulation from
the existing levels to meet the current 2010 Oregon Energy Code levels (U =
0.048 Btu/h-ft2-°F). This consists of adding more rigid insulation to the roof
assembly such that the overall roof assembly meets OR code. The additional
insulation will make a difference in occupant comfort for those occupants in the
top floor of the building. Accuracy for the performance of the ECM will depend on
the quality of installation and local weather patterns.
Roof Area
Existing
Baseline
Input
ECM Input First Cost
Annual
Energy
Savings
[KBTU]
Annual
Energy
Cost
Savings
Simple
Payback
35,930 SF U = 0.088 U = 0.048 $96,000 243,300 $4,736 20.3
ECM #2: Richardson Improved Roof Parameters
7.3 ECM #3: Improved Window Glazing
The windows shown in the drawing, and appear to be installed in the building, are
double-pane windows with aluminum frames that are thermally broken. This ECM
evaluates the energy use impact of replacing the windows with glazing that has a
higher thermal resistance with better shading properties. The windows studied
for the ECM match the new 2010 OR Energy Code with U-0.45 Btu/h-ft2-°F and
shading coefficient of 0.46. Replacing these windows should have a beneficial
impact on maintenance cost since they will be new and operate better with less
leaks and similar problems. Accuracy for the performance of the ECM will depend
on the quality of installation and local weather patterns.
Glazing
Area
Existing
Baseline
Input
ECM Input First Cost
Annual
Energy
Savings
[KBTU]
Annual
Energy
Cost
Savings
Simple
Payback
10,640 SFU = 0.67
SC = 0.81
U = 0.45
SC = 0.46$240,000 786,770 $14,525 16.5
ECM #3: Richardson Improved Glazing Parameters
January 25, 2012 OSU Richardson and Peavy Hall Energy Study: Energy Conservation Measure Analysis {Revised April 30, 2012}
11-1077 | 20
7.4 ECM #4: West (Admin) Penthouse Envelope insulation
The West penthouse currently has no insulation above the mechanical room. This
ECM evaluates the energy use impact of adding insulation in the penthouse that is
above the mechanical room in the admin area. It is assumed that R-13 batt could
be laid in this space to help reduce heat gain/loss from the mechanical room to
nearby interior spaces. This should have no added maintenance staff impacts or
other effects other than reducing heat loss from the mechanical room.
Roof Area
Existing
Baseline
Input
ECM Input First Cost
Annual
Energy
Savings
[KBTU]
Annual
Energy
Cost
Savings
Simple
Payback
3,080 SF No Insulation U = 0.077* $20,000 69,750 $1,360 14.7
ECM #4: Richardson Mechanical Penthouse Insulation Parameters
*Assuming continuous lay in of batt insulation
7.5 ECM #5: Lighting Controls for Classrooms
Currently many classrooms lack the ability to automatically shut down lights when
the space is unoccupied. This ECM evaluates the energy use savings by adding
lighting controls for classroom spaces. This would consist of adding occupancy
sensors to ensure lights power down when classrooms are not in use. Since there
is no way to explicitly analyze how often the lights could be powered down during
a typical school day in session it is customary to take a 10% credit from the
lighting power density. The credit was taken for five classrooms in the building
(Classroom 107, GIS 203, GIS 217, Computer Lab 215, Wood Science Teaching
243). This measure will have added maintenance costs to keep occupancy
sensors and controls working properly to serve the space well by shutting down
lights at appropriate times without disruption of function to space. The savings
estimates are seen as conservative and should save a minimum of 10% off of the
lighting in the space. Savings will depend on how frequently particular
classrooms are currently having lights left on when people leave the classroom.
Rooms
Existing
Baseline
Input
ECM Input First Cost
Annual
Energy
Savings
[KBTU]
Annual
Energy
Cost
Savings
Simple
Payback
5 No Sensors
Sensor in
each of 5
classrooms
$1,500 11,770 $200 7.5
ECM #5: Richardson Classroom Lighting Control Parameters
January 25, 2012 OSU Richardson and Peavy Hall Energy Study: Energy Conservation Measure Analysis {Revised April 30, 2012}
11-1077 | 21
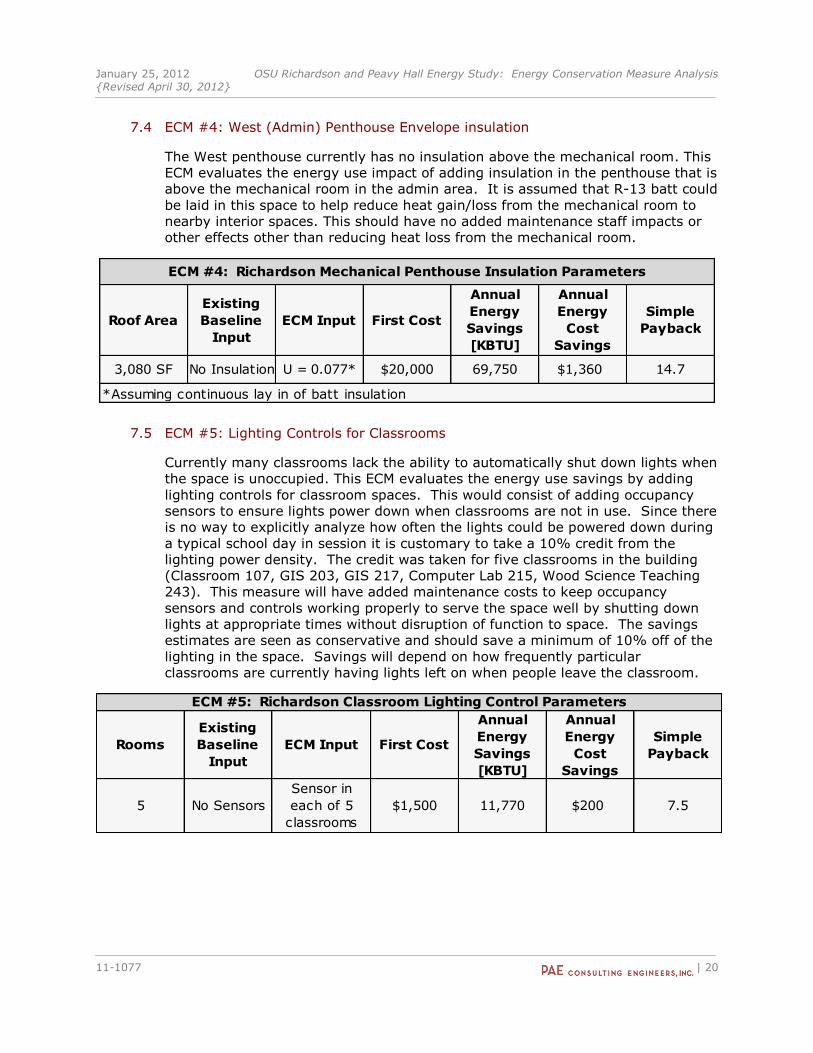
7.6 ECM #6: Daylighting Controls Where Applicable
Richardson Hall currently has daylight sensors in the main lobby and upper west
lobbies. Many of these spaces are receiving ample light to have daylighting photo
sensors added along ballast controls. This ECM evaluates the energy use impact
of adding daylighting controls where they are not already in place (or not fully
functioning) in areas of adequate sun exposure. It was assumed that multi-step
dimming fixtures would be used to adjust lighting levels when receiving natural
light. Daylighting sensors were placed in the model as shown below. Some of
the spaces given daylighting control include the lobby, first floor classroom, west
and south facing offices. Office lights could be controlled by photo sensors with
occupants given the ability to override controls or use task lighting if needed.
Below are floor plans showing placement of sensors in the energy model. The
sensors places in the model do not necessarily suggest the number of sensor that
would have to be purchased to control the spaces that are daylight controlled in
the model. This measure will add costs for maintenance to keep sensors and
lighting controls operating properly. The energy model is able to predict the
hours of the year when there will be sufficient sunlight to shut the lights off.
Using the 30-year-average weather file the model uses this to predict the total
energy savings throughout the year. The actual performance of the added
daylighting sensors will heavily depend on actual weather and proper installation
of sensors and controls.
Figure 21: Richardson Floor 1 Daylight Sensors
January 25, 2012 OSU Richardson and Peavy Hall Energy Study: Energy Conservation Measure Analysis {Revised April 30, 2012}
11-1077 | 22
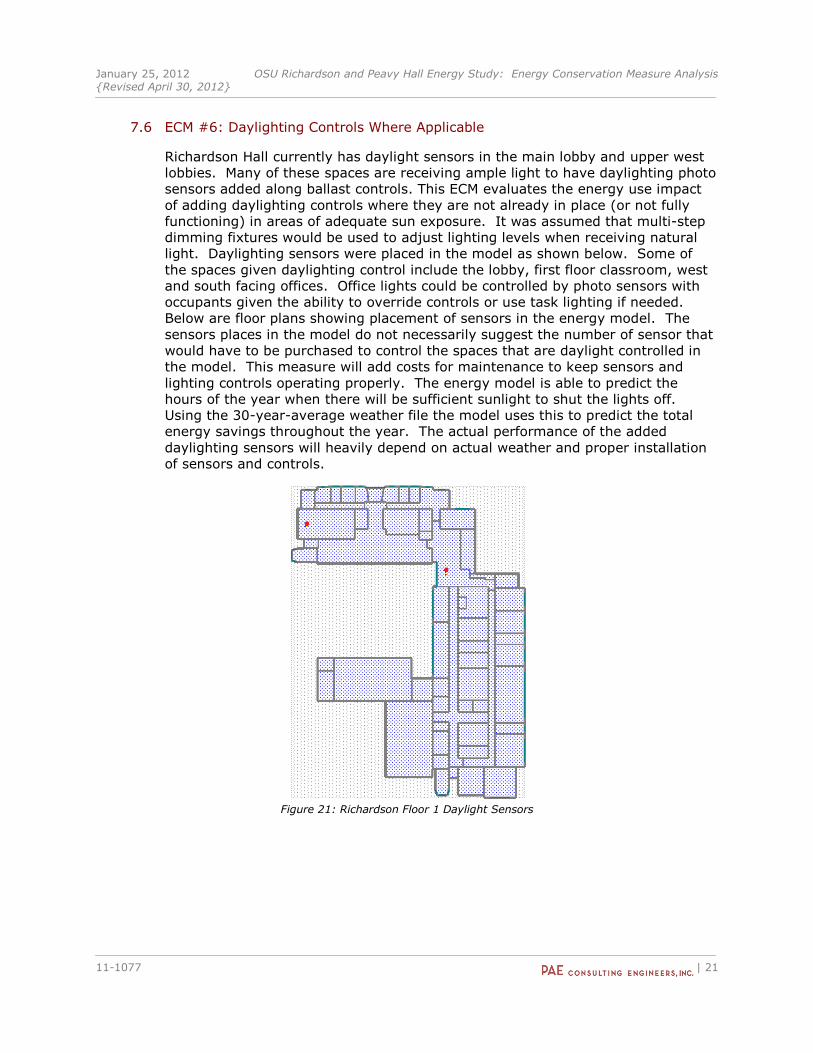
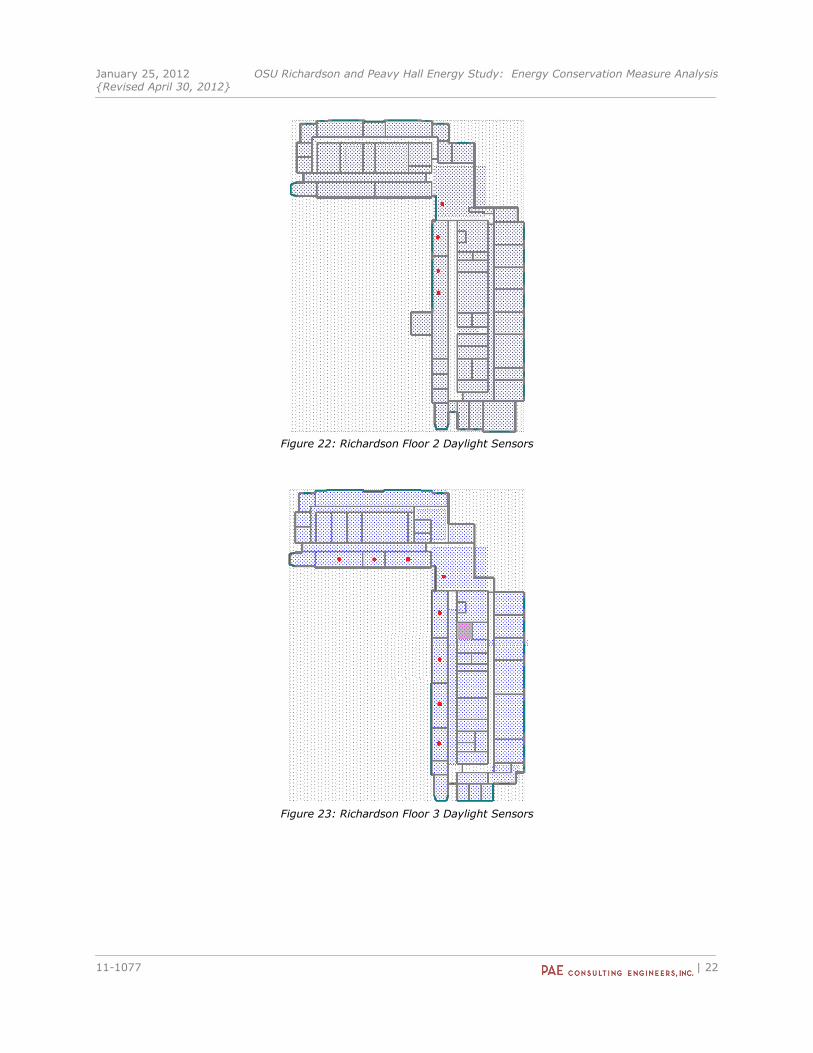
Figure 22: Richardson Floor 2 Daylight Sensors
Figure 23: Richardson Floor 3 Daylight Sensors
January 25, 2012 OSU Richardson and Peavy Hall Energy Study: Energy Conservation Measure Analysis {Revised April 30, 2012}
11-1077 | 23
Daylight
Spaces
Existing
Baseline
Input
ECM Input First Cost
Annual
Energy
Savings
[KBTU]
Annual
Energy
Cost
Savings
Simple
Payback
14 No SensorsDaylight sensor
in 14 spaces$3,000 32,726 $533 5.6
ECM #6: Richardson Daylighting Control Parameters
7.7 ECM #7: Waterside Economizer for Chiller Plant
The existing central chiller system currently has no water-side economizer. This
ECM evaluates the energy use benefits of adding water-side economizer operation
to the central chiller plant to take advantage of free cooling opportunities. This
involves adding a plate and frame heat exchanger and pumps to help bypass the
chiller when it is not necessary to run it. Modeled energy savings are broken out
separately for each building even though there is one central chiller plant for both
buildings. This measure will be an added maintenance cost to the facility. The
pumps and heat exchanger will have to be maintained plus facility operators will
have to make sure that the chilled water system is operating as designed to take
advantage of free cooling when conditions allow.
Existing Baseline
InputECM Input First Cost
Annual
Energy
Savings
[KBTU]
Annual
Energy Cost
Savings
Simple
Payback
No Central
Waterside
Economizer
Add Waterside
Economizer to Central
Chiller Plant
$51,000 165,937 $2,821 18.1
ECM #7: Richardson Waterside Economizer for Chiller Plants
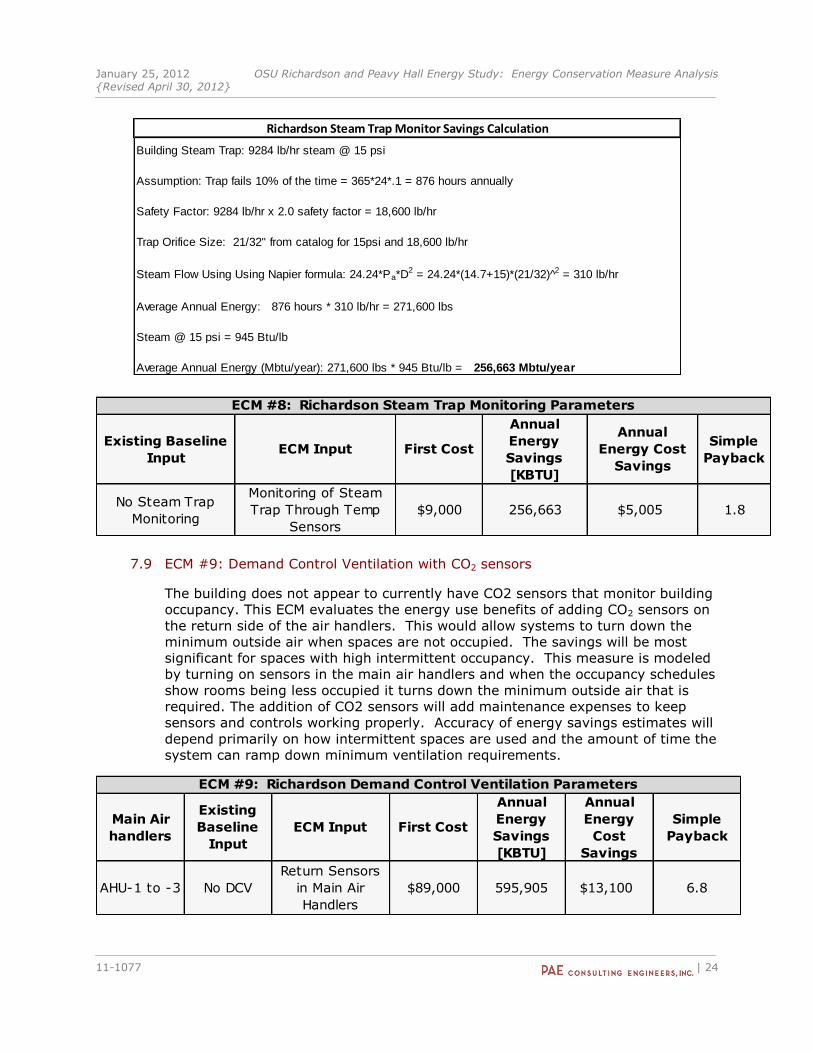
7.8 ECM #8: Steam Trap Monitoring
The building currently has steam traps delivering steam to the building from the
campus steam plant. As with all steam traps there is a certain amount of steam
that is being wasted by the traps being stuck open. This ECM evaluates the
energy benefits of adding a temperature sensor to steam traps to ensure that
steam is not wasted when traps become stuck open. When this happens the trap
allows steam into the condensate reservoir which then becomes a waste. A hand
calculation was performed to estimate the amount of steam and thus energy that
could be saved throughout the year by installing these sensors that will alert
anytime the trap fails and allows steam to be wasted. This measure should add no
maintenance coast to the facility and potentially save money by making facility
personnel aware when traps are failing to close. Accuracy of the calculation
resides on the assumption that traps fail 10% of the operating hours throughout
the year. This is expected to be quite conservative relative to how much the trap
often do fail in practice.
January 25, 2012 OSU Richardson and Peavy Hall Energy Study: Energy Conservation Measure Analysis {Revised April 30, 2012}
11-1077 | 24
Existing Baseline
InputECM Input First Cost
Annual
Energy
Savings
[KBTU]
Annual
Energy Cost
Savings
Simple
Payback
No Steam Trap
Monitoring
Monitoring of Steam
Trap Through Temp
Sensors
$9,000 256,663 $5,005 1.8
ECM #8: Richardson Steam Trap Monitoring Parameters
7.9 ECM #9: Demand Control Ventilation with CO2 sensors
The building does not appear to currently have CO2 sensors that monitor building
occupancy. This ECM evaluates the energy use benefits of adding CO2 sensors on
the return side of the air handlers. This would allow systems to turn down the
minimum outside air when spaces are not occupied. The savings will be most
significant for spaces with high intermittent occupancy. This measure is modeled
by turning on sensors in the main air handlers and when the occupancy schedules
show rooms being less occupied it turns down the minimum outside air that is
required. The addition of CO2 sensors will add maintenance expenses to keep
sensors and controls working properly. Accuracy of energy savings estimates will
depend primarily on how intermittent spaces are used and the amount of time the
system can ramp down minimum ventilation requirements.
Main Air
handlers
Existing
Baseline
Input
ECM Input First Cost
Annual
Energy
Savings
[KBTU]
Annual
Energy
Cost
Savings
Simple
Payback
AHU-1 to -3 No DCV
Return Sensors
in Main Air
Handlers
$89,000 595,905 $13,100 6.8
ECM #9: Richardson Demand Control Ventilation Parameters
Building Steam Trap: 9284 lb/hr steam @ 15 psi
Assumption: Trap fails 10% of the time = 365*24*.1 = 876 hours annually
Safety Factor: 9284 lb/hr x 2.0 safety factor = 18,600 lb/hr
Trap Orifice Size: 21/32" from catalog for 15psi and 18,600 lb/hr
Steam Flow Using Using Napier formula: 24.24*Pa*D2 = 24.24*(14.7+15)*(21/32)^2 = 310 lb/hr
Average Annual Energy: 876 hours * 310 lb/hr = 271,600 lbs
Steam @ 15 psi = 945 Btu/lb
Average Annual Energy (Mbtu/year): 271,600 lbs * 945 Btu/lb = 256,663 Mbtu/year
Richardson Steam Trap Monitor Savings Calculation
January 25, 2012 OSU Richardson and Peavy Hall Energy Study: Energy Conservation Measure Analysis {Revised April 30, 2012}
11-1077 | 25
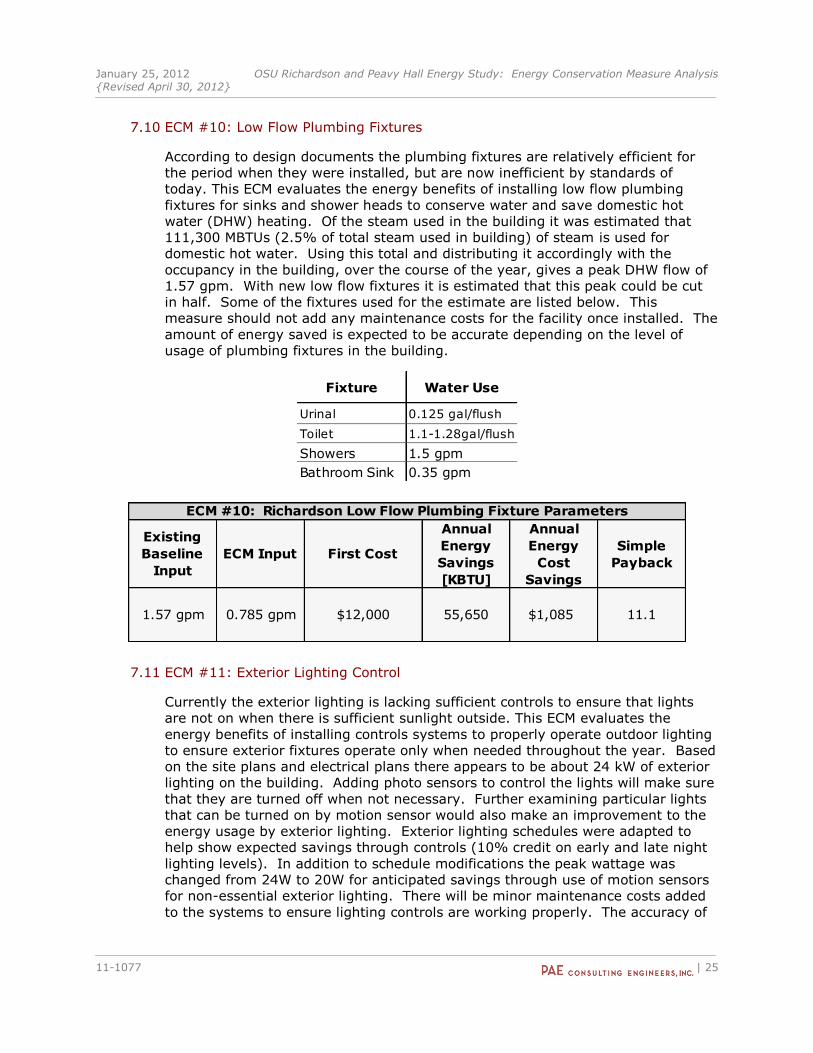
7.10 ECM #10: Low Flow Plumbing Fixtures
According to design documents the plumbing fixtures are relatively efficient for
the period when they were installed, but are now inefficient by standards of
today. This ECM evaluates the energy benefits of installing low flow plumbing
fixtures for sinks and shower heads to conserve water and save domestic hot
water (DHW) heating. Of the steam used in the building it was estimated that
111,300 MBTUs (2.5% of total steam used in building) of steam is used for
domestic hot water. Using this total and distributing it accordingly with the
occupancy in the building, over the course of the year, gives a peak DHW flow of
1.57 gpm. With new low flow fixtures it is estimated that this peak could be cut
in half. Some of the fixtures used for the estimate are listed below. This
measure should not add any maintenance costs for the facility once installed. The
amount of energy saved is expected to be accurate depending on the level of
usage of plumbing fixtures in the building.
Fixture Water Use
Urinal 0.125 gal/flush
Toilet 1.1-1.28gal/flush
Showers 1.5 gpm
Bathroom Sink 0.35 gpm
Existing
Baseline
Input
ECM Input First Cost
Annual
Energy
Savings
[KBTU]
Annual
Energy
Cost
Savings
Simple
Payback
1.57 gpm 0.785 gpm $12,000 55,650 $1,085 11.1
ECM #10: Richardson Low Flow Plumbing Fixture Parameters
7.11 ECM #11: Exterior Lighting Control
Currently the exterior lighting is lacking sufficient controls to ensure that lights
are not on when there is sufficient sunlight outside. This ECM evaluates the
energy benefits of installing controls systems to properly operate outdoor lighting
to ensure exterior fixtures operate only when needed throughout the year. Based
on the site plans and electrical plans there appears to be about 24 kW of exterior
lighting on the building. Adding photo sensors to control the lights will make sure
that they are turned off when not necessary. Further examining particular lights
that can be turned on by motion sensor would also make an improvement to the
energy usage by exterior lighting. Exterior lighting schedules were adapted to
help show expected savings through controls (10% credit on early and late night
lighting levels). In addition to schedule modifications the peak wattage was
changed from 24W to 20W for anticipated savings through use of motion sensors
for non-essential exterior lighting. There will be minor maintenance costs added
to the systems to ensure lighting controls are working properly. The accuracy of
January 25, 2012 OSU Richardson and Peavy Hall Energy Study: Energy Conservation Measure Analysis {Revised April 30, 2012}
11-1077 | 26
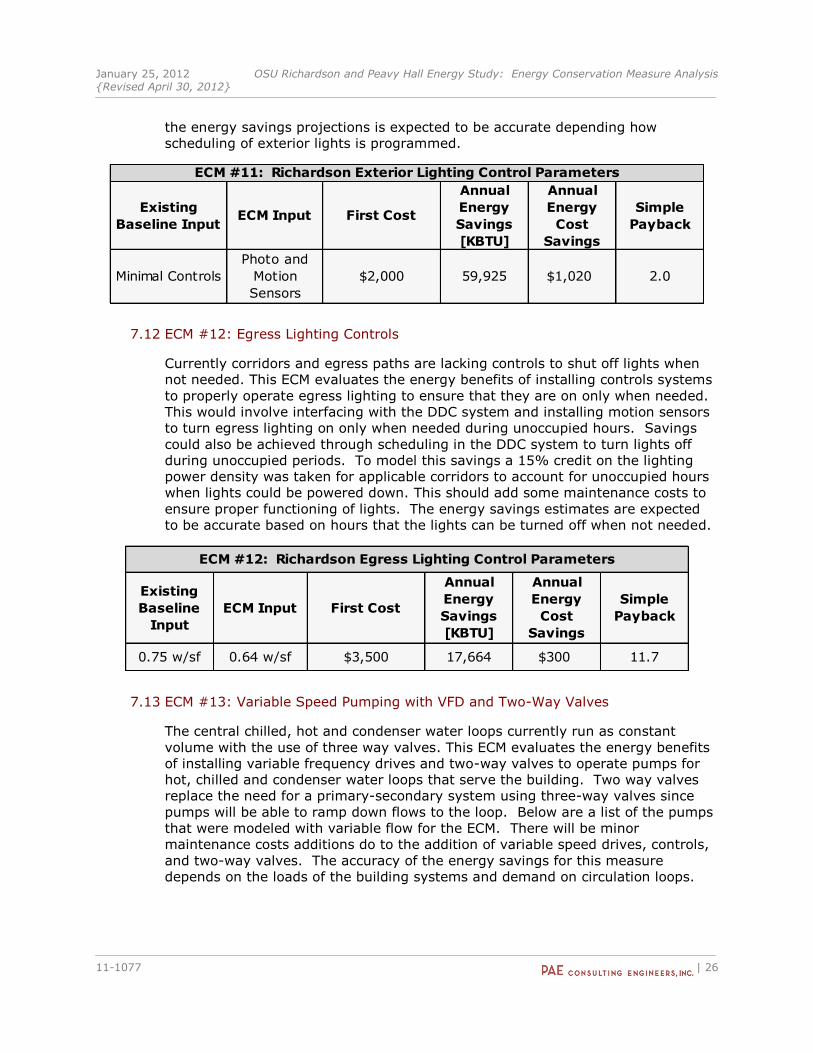
the energy savings projections is expected to be accurate depending how
scheduling of exterior lights is programmed.
Existing
Baseline InputECM Input First Cost
Annual
Energy
Savings
[KBTU]
Annual
Energy
Cost
Savings
Simple
Payback
Minimal Controls
Photo and
Motion
Sensors
$2,000 59,925 $1,020 2.0
ECM #11: Richardson Exterior Lighting Control Parameters
7.12 ECM #12: Egress Lighting Controls
Currently corridors and egress paths are lacking controls to shut off lights when
not needed. This ECM evaluates the energy benefits of installing controls systems
to properly operate egress lighting to ensure that they are on only when needed.
This would involve interfacing with the DDC system and installing motion sensors
to turn egress lighting on only when needed during unoccupied hours. Savings
could also be achieved through scheduling in the DDC system to turn lights off
during unoccupied periods. To model this savings a 15% credit on the lighting
power density was taken for applicable corridors to account for unoccupied hours
when lights could be powered down. This should add some maintenance costs to
ensure proper functioning of lights. The energy savings estimates are expected
to be accurate based on hours that the lights can be turned off when not needed.
Existing
Baseline
Input
ECM Input First Cost
Annual
Energy
Savings
[KBTU]
Annual
Energy
Cost
Savings
Simple
Payback
0.75 w/sf 0.64 w/sf $3,500 17,664 $300 11.7
ECM #12: Richardson Egress Lighting Control Parameters
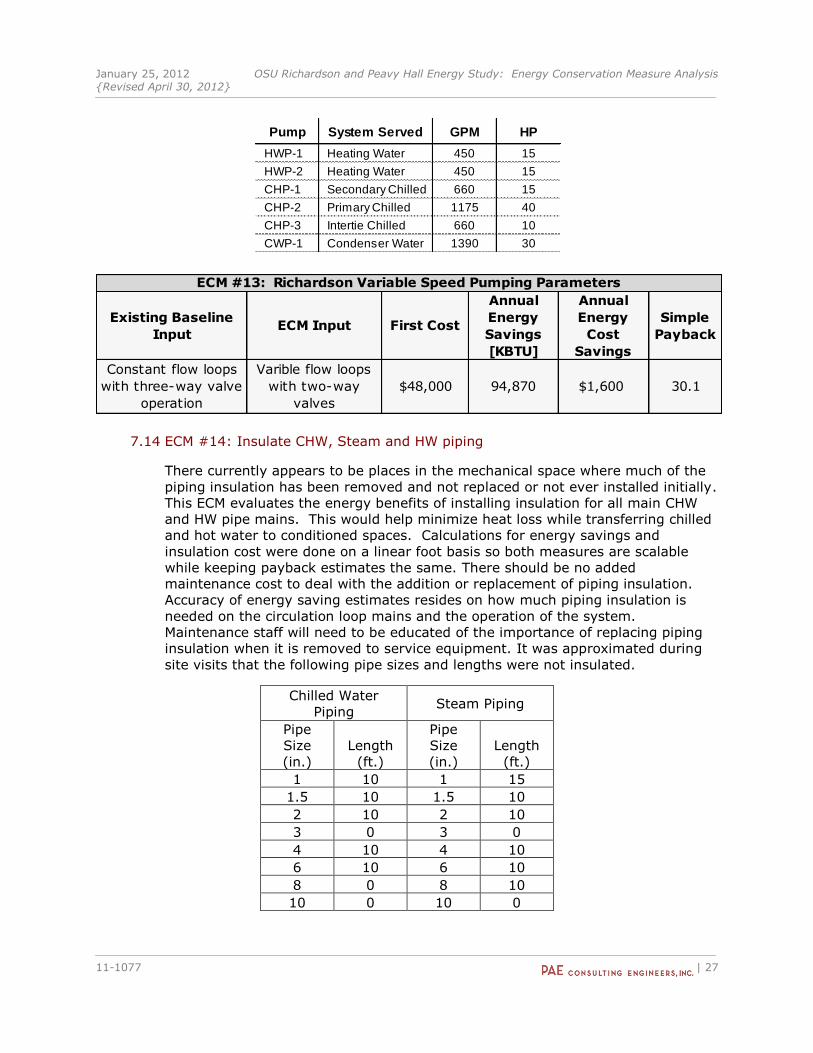
7.13 ECM #13: Variable Speed Pumping with VFD and Two-Way Valves
The central chilled, hot and condenser water loops currently run as constant
volume with the use of three way valves. This ECM evaluates the energy benefits
of installing variable frequency drives and two-way valves to operate pumps for
hot, chilled and condenser water loops that serve the building. Two way valves
replace the need for a primary-secondary system using three-way valves since
pumps will be able to ramp down flows to the loop. Below are a list of the pumps
that were modeled with variable flow for the ECM. There will be minor
maintenance costs additions do to the addition of variable speed drives, controls,
and two-way valves. The accuracy of the energy savings for this measure
depends on the loads of the building systems and demand on circulation loops.
January 25, 2012 OSU Richardson and Peavy Hall Energy Study: Energy Conservation Measure Analysis {Revised April 30, 2012}
11-1077 | 27
Existing Baseline
InputECM Input First Cost
Annual
Energy
Savings
[KBTU]
Annual
Energy
Cost
Savings
Simple
Payback
Constant flow loops
with three-way valve
operation
Varible flow loops
with two-way
valves
$48,000 94,870 $1,600 30.1
ECM #13: Richardson Variable Speed Pumping Parameters
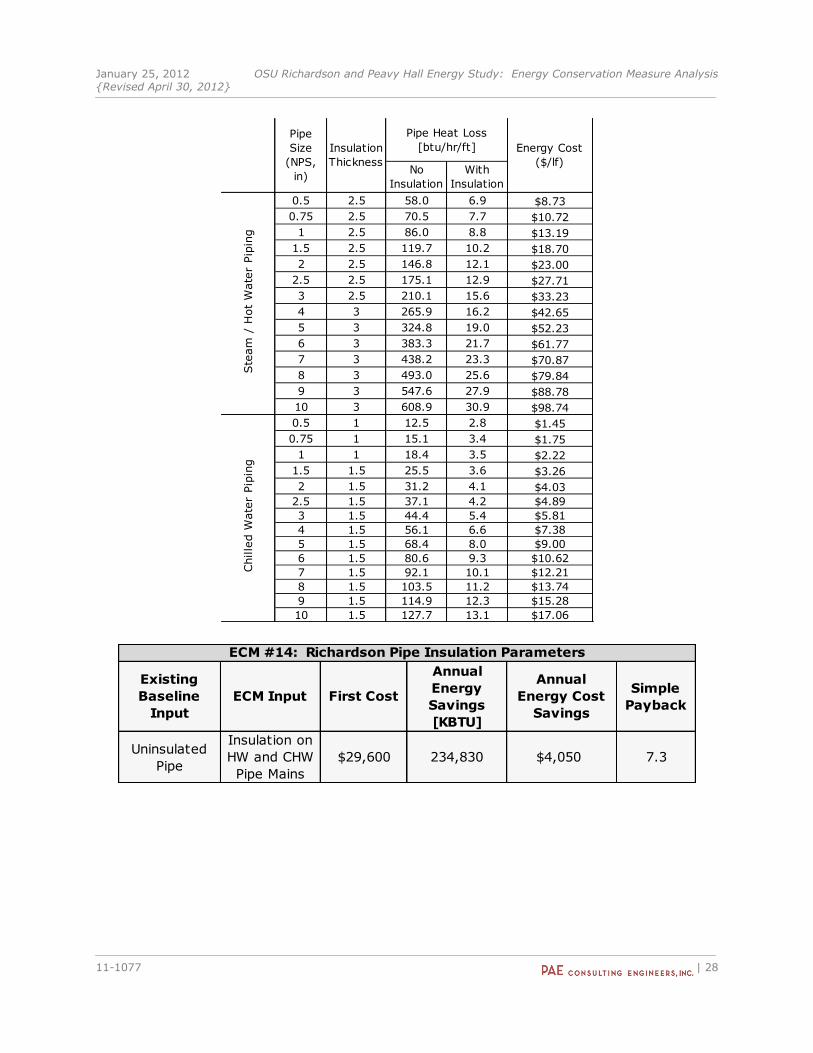
7.14 ECM #14: Insulate CHW, Steam and HW piping
There currently appears to be places in the mechanical space where much of the
piping insulation has been removed and not replaced or not ever installed initially.
This ECM evaluates the energy benefits of installing insulation for all main CHW
and HW pipe mains. This would help minimize heat loss while transferring chilled
and hot water to conditioned spaces. Calculations for energy savings and
insulation cost were done on a linear foot basis so both measures are scalable
while keeping payback estimates the same. There should be no added
maintenance cost to deal with the addition or replacement of piping insulation.
Accuracy of energy saving estimates resides on how much piping insulation is
needed on the circulation loop mains and the operation of the system.
Maintenance staff will need to be educated of the importance of replacing piping
insulation when it is removed to service equipment. It was approximated during
site visits that the following pipe sizes and lengths were not insulated.
Chilled Water
Piping Steam Piping
Pipe
Size
(in.)
Length
(ft.)
Pipe
Size
(in.)
Length
(ft.)
1 10 1 15
1.5 10 1.5 10
2 10 2 10
3 0 3 0
4 10 4 10
6 10 6 10
8 0 8 10
10 0 10 0
Pump System Served GPM HP
HWP-1 Heating Water 450 15
HWP-2 Heating Water 450 15
CHP-1 Secondary Chilled 660 15
CHP-2 Primary Chilled 1175 40
CHP-3 Intertie Chilled 660 10
CWP-1 Condenser Water 1390 30
January 25, 2012 OSU Richardson and Peavy Hall Energy Study: Energy Conservation Measure Analysis {Revised April 30, 2012}
11-1077 | 28
No
Insulation
With
Insulation
0.5 2.5 58.0 6.9 $8.73
0.75 2.5 70.5 7.7 $10.72
1 2.5 86.0 8.8 $13.19
1.5 2.5 119.7 10.2 $18.70
2 2.5 146.8 12.1 $23.00
2.5 2.5 175.1 12.9 $27.71
3 2.5 210.1 15.6 $33.23
4 3 265.9 16.2 $42.65
5 3 324.8 19.0 $52.23
6 3 383.3 21.7 $61.77
7 3 438.2 23.3 $70.87
8 3 493.0 25.6 $79.84
9 3 547.6 27.9 $88.78
10 3 608.9 30.9 $98.74
0.5 1 12.5 2.8 $1.45
0.75 1 15.1 3.4 $1.75
1 1 18.4 3.5 $2.22
1.5 1.5 25.5 3.6 $3.26
2 1.5 31.2 4.1 $4.03
2.5 1.5 37.1 4.2 $4.89
3 1.5 44.4 5.4 $5.81
4 1.5 56.1 6.6 $7.38
5 1.5 68.4 8.0 $9.00
6 1.5 80.6 9.3 $10.62
7 1.5 92.1 10.1 $12.21
8 1.5 103.5 11.2 $13.74
9 1.5 114.9 12.3 $15.28
10 1.5 127.7 13.1 $17.06
Pipe Heat Loss
[btu/hr/ft]
Ste
am
/ H
ot
Wate
r Pip
ing
Energy Cost
($/lf)
Chille
d W
ate
r Pip
ing
Pipe
Size
(NPS,
in)
Insulation
Thickness
Existing
Baseline
Input
ECM Input First Cost
Annual
Energy
Savings
[KBTU]
Annual
Energy Cost
Savings
Simple
Payback
Uninsulated
Pipe
Insulation on
HW and CHW
Pipe Mains
$29,600 234,830 $4,050 7.3
ECM #14: Richardson Pipe Insulation Parameters
January 25, 2012 OSU Richardson and Peavy Hall Energy Study: Energy Conservation Measure Analysis {Revised April 30, 2012}
11-1077 | 29
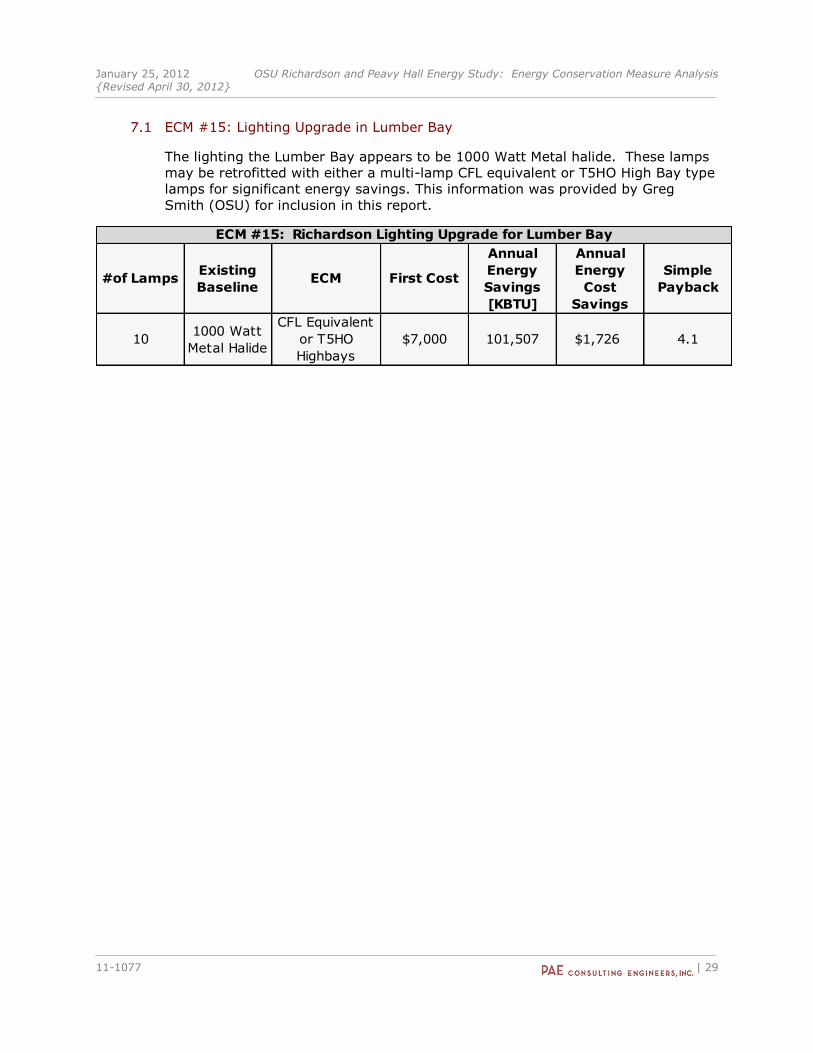
7.1 ECM #15: Lighting Upgrade in Lumber Bay
The lighting the Lumber Bay appears to be 1000 Watt Metal halide. These lamps
may be retrofitted with either a multi-lamp CFL equivalent or T5HO High Bay type
lamps for significant energy savings. This information was provided by Greg
Smith (OSU) for inclusion in this report.
#of LampsExisting
BaselineECM First Cost
Annual
Energy
Savings
[KBTU]
Annual
Energy
Cost
Savings
Simple
Payback
101000 Watt
Metal Halide
CFL Equivalent
or T5HO
Highbays
$7,000 101,507 $1,726 4.1
ECM #15: Richardson Lighting Upgrade for Lumber Bay
January 25, 2012 OSU Richardson and Peavy Hall Energy Study: Energy Conservation Measure Analysis {Revised April 30, 2012}
11-1077 | 30
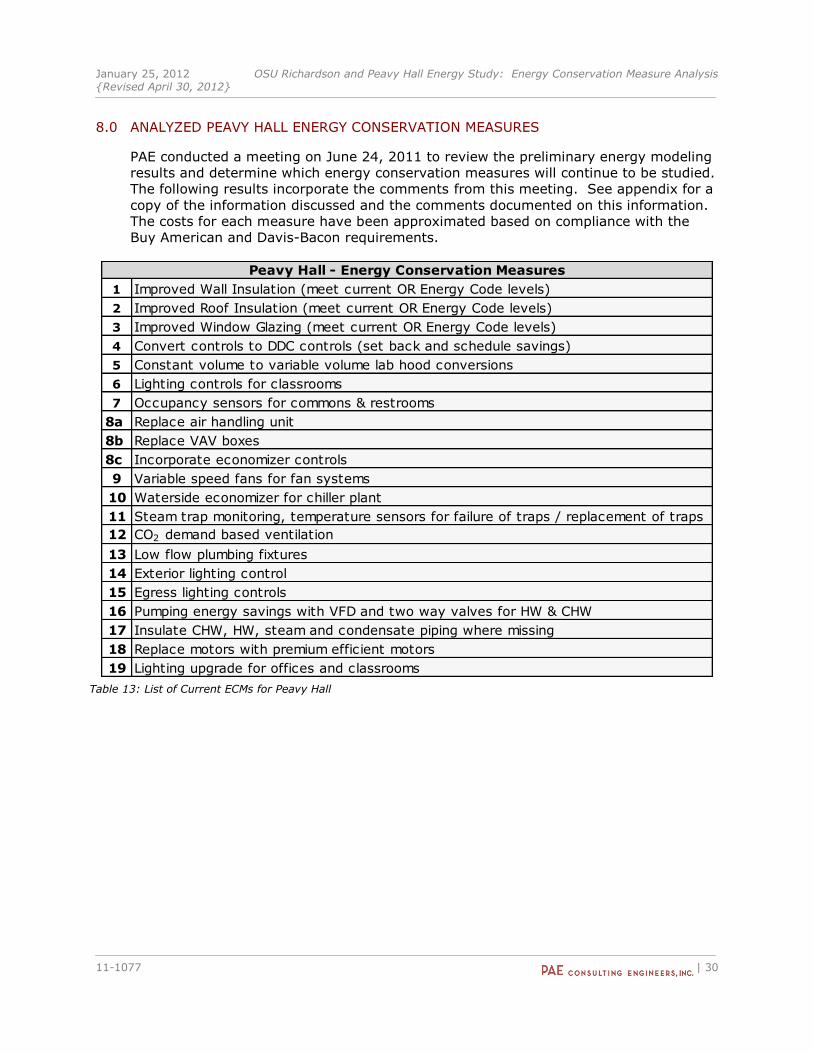
8.0 ANALYZED PEAVY HALL ENERGY CONSERVATION MEASURES
PAE conducted a meeting on June 24, 2011 to review the preliminary energy modeling
results and determine which energy conservation measures will continue to be studied.
The following results incorporate the comments from this meeting. See appendix for a
copy of the information discussed and the comments documented on this information.
The costs for each measure have been approximated based on compliance with the
Buy American and Davis-Bacon requirements.
1 Improved Wall Insulation (meet current OR Energy Code levels)
2 Improved Roof Insulation (meet current OR Energy Code levels)
3 Improved Window Glazing (meet current OR Energy Code levels)
4 Convert controls to DDC controls (set back and schedule savings)
5 Constant volume to variable volume lab hood conversions
6 Lighting controls for classrooms
7 Occupancy sensors for commons & restrooms
8a Replace air handling unit
8b Replace VAV boxes
8c Incorporate economizer controls
9 Variable speed fans for fan systems
10 Waterside economizer for chiller plant
11 Steam trap monitoring, temperature sensors for failure of traps / replacement of traps
12 CO2 demand based ventilation
13 Low flow plumbing fixtures
14 Exterior lighting control
15 Egress lighting controls
16 Pumping energy savings with VFD and two way valves for HW & CHW
17 Insulate CHW, HW, steam and condensate piping where missing
18 Replace motors with premium efficient motors
19 Lighting upgrade for offices and classrooms
Peavy Hall - Energy Conservation Measures
Table 13: List of Current ECMs for Peavy Hall
January 25, 2012 OSU Richardson and Peavy Hall Energy Study: Energy Conservation Measure Analysis {Revised April 30, 2012}
11-1077 | 31
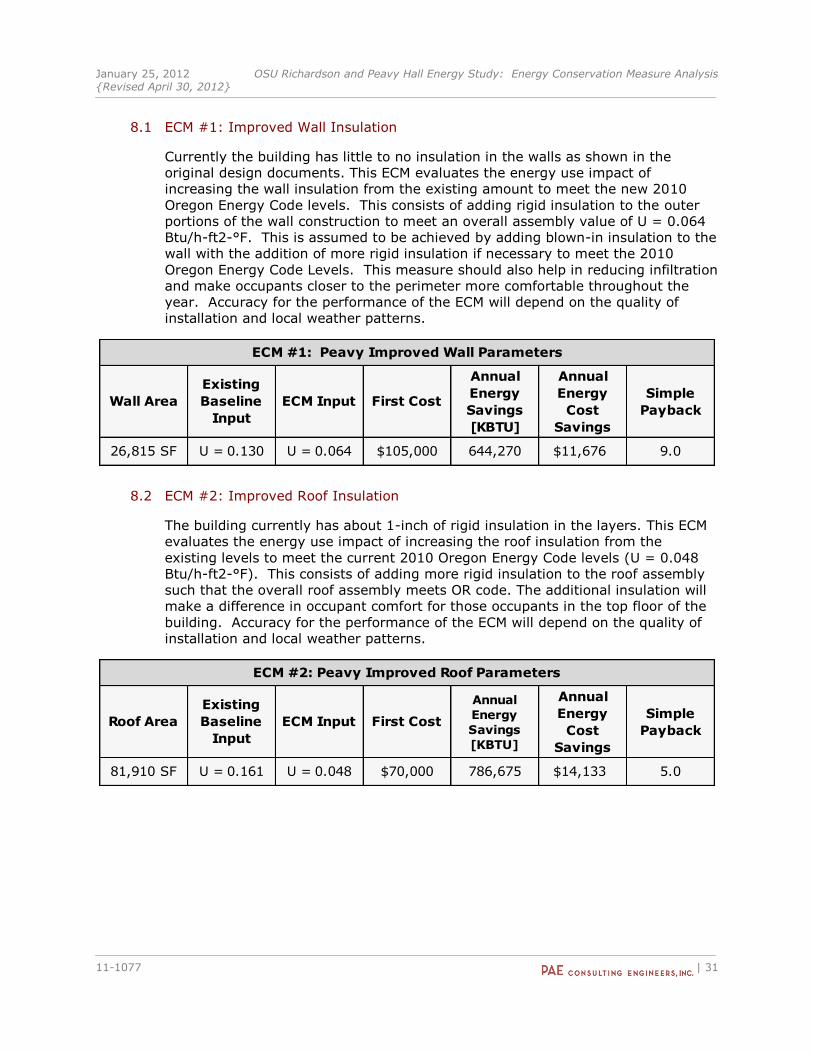
8.1 ECM #1: Improved Wall Insulation
Currently the building has little to no insulation in the walls as shown in the
original design documents. This ECM evaluates the energy use impact of
increasing the wall insulation from the existing amount to meet the new 2010
Oregon Energy Code levels. This consists of adding rigid insulation to the outer
portions of the wall construction to meet an overall assembly value of U = 0.064
Btu/h-ft2-°F. This is assumed to be achieved by adding blown-in insulation to the
wall with the addition of more rigid insulation if necessary to meet the 2010
Oregon Energy Code Levels. This measure should also help in reducing infiltration
and make occupants closer to the perimeter more comfortable throughout the
year. Accuracy for the performance of the ECM will depend on the quality of
installation and local weather patterns.
Wall Area
Existing
Baseline
Input
ECM Input First Cost
Annual
Energy
Savings
[KBTU]
Annual
Energy
Cost
Savings
Simple
Payback
26,815 SF U = 0.130 U = 0.064 $105,000 644,270 $11,676 9.0
ECM #1: Peavy Improved Wall Parameters
8.2 ECM #2: Improved Roof Insulation
The building currently has about 1-inch of rigid insulation in the layers. This ECM
evaluates the energy use impact of increasing the roof insulation from the
existing levels to meet the current 2010 Oregon Energy Code levels (U = 0.048
Btu/h-ft2-°F). This consists of adding more rigid insulation to the roof assembly
such that the overall roof assembly meets OR code. The additional insulation will
make a difference in occupant comfort for those occupants in the top floor of the
building. Accuracy for the performance of the ECM will depend on the quality of
installation and local weather patterns.
Roof Area
Existing
Baseline
Input
ECM Input First Cost
Annual
Energy
Savings
[KBTU]
Annual
Energy
Cost
Savings
Simple
Payback
81,910 SF U = 0.161 U = 0.048 $70,000 786,675 $14,133 5.0
ECM #2: Peavy Improved Roof Parameters
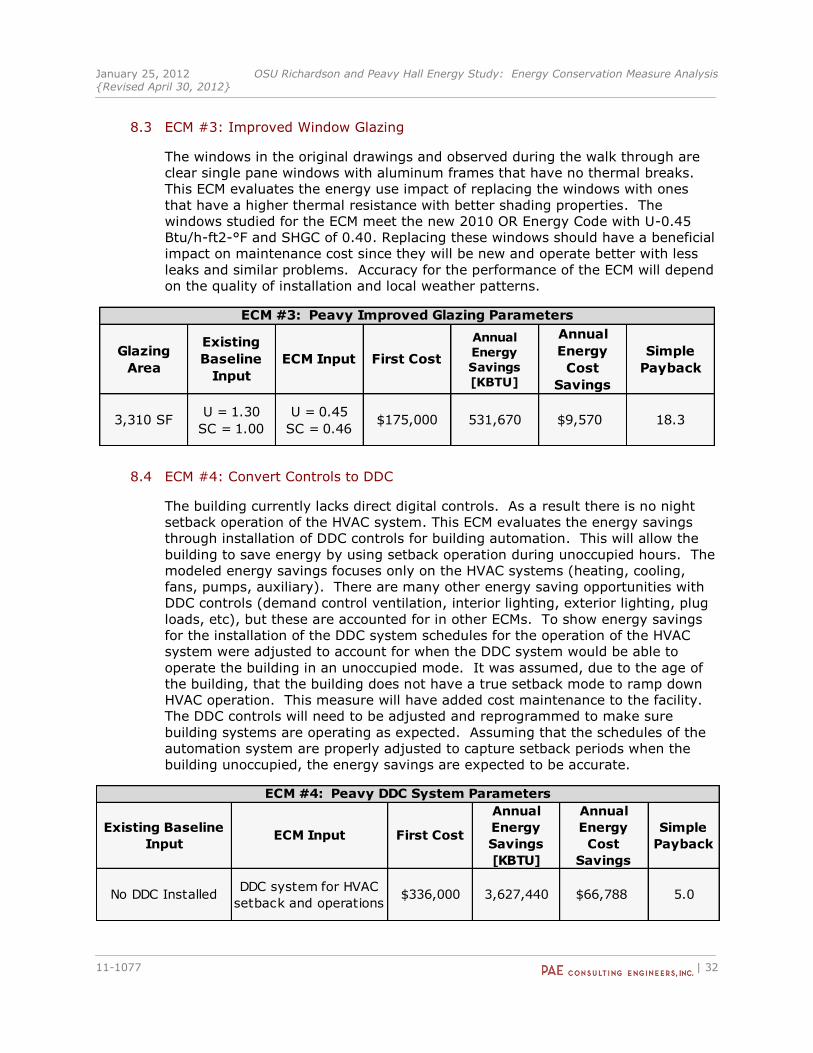
January 25, 2012 OSU Richardson and Peavy Hall Energy Study: Energy Conservation Measure Analysis {Revised April 30, 2012}
11-1077 | 32
8.3 ECM #3: Improved Window Glazing
The windows in the original drawings and observed during the walk through are
clear single pane windows with aluminum frames that have no thermal breaks.
This ECM evaluates the energy use impact of replacing the windows with ones
that have a higher thermal resistance with better shading properties. The
windows studied for the ECM meet the new 2010 OR Energy Code with U-0.45
Btu/h-ft2-°F and SHGC of 0.40. Replacing these windows should have a beneficial
impact on maintenance cost since they will be new and operate better with less
leaks and similar problems. Accuracy for the performance of the ECM will depend
on the quality of installation and local weather patterns.
Glazing
Area
Existing
Baseline
Input
ECM Input First Cost
Annual
Energy
Savings
[KBTU]
Annual
Energy
Cost
Savings
Simple
Payback
3,310 SFU = 1.30
SC = 1.00
U = 0.45
SC = 0.46$175,000 531,670 $9,570 18.3
ECM #3: Peavy Improved Glazing Parameters
8.4 ECM #4: Convert Controls to DDC
The building currently lacks direct digital controls. As a result there is no night
setback operation of the HVAC system. This ECM evaluates the energy savings
through installation of DDC controls for building automation. This will allow the
building to save energy by using setback operation during unoccupied hours. The
modeled energy savings focuses only on the HVAC systems (heating, cooling,
fans, pumps, auxiliary). There are many other energy saving opportunities with
DDC controls (demand control ventilation, interior lighting, exterior lighting, plug
loads, etc), but these are accounted for in other ECMs. To show energy savings
for the installation of the DDC system schedules for the operation of the HVAC
system were adjusted to account for when the DDC system would be able to
operate the building in an unoccupied mode. It was assumed, due to the age of
the building, that the building does not have a true setback mode to ramp down
HVAC operation. This measure will have added cost maintenance to the facility.
The DDC controls will need to be adjusted and reprogrammed to make sure
building systems are operating as expected. Assuming that the schedules of the
automation system are properly adjusted to capture setback periods when the
building unoccupied, the energy savings are expected to be accurate.
Existing Baseline
InputECM Input First Cost
Annual
Energy
Savings
[KBTU]
Annual
Energy
Cost
Savings
Simple
Payback
No DDC InstalledDDC system for HVAC
setback and operations$336,000 3,627,440 $66,788 5.0
ECM #4: Peavy DDC System Parameters
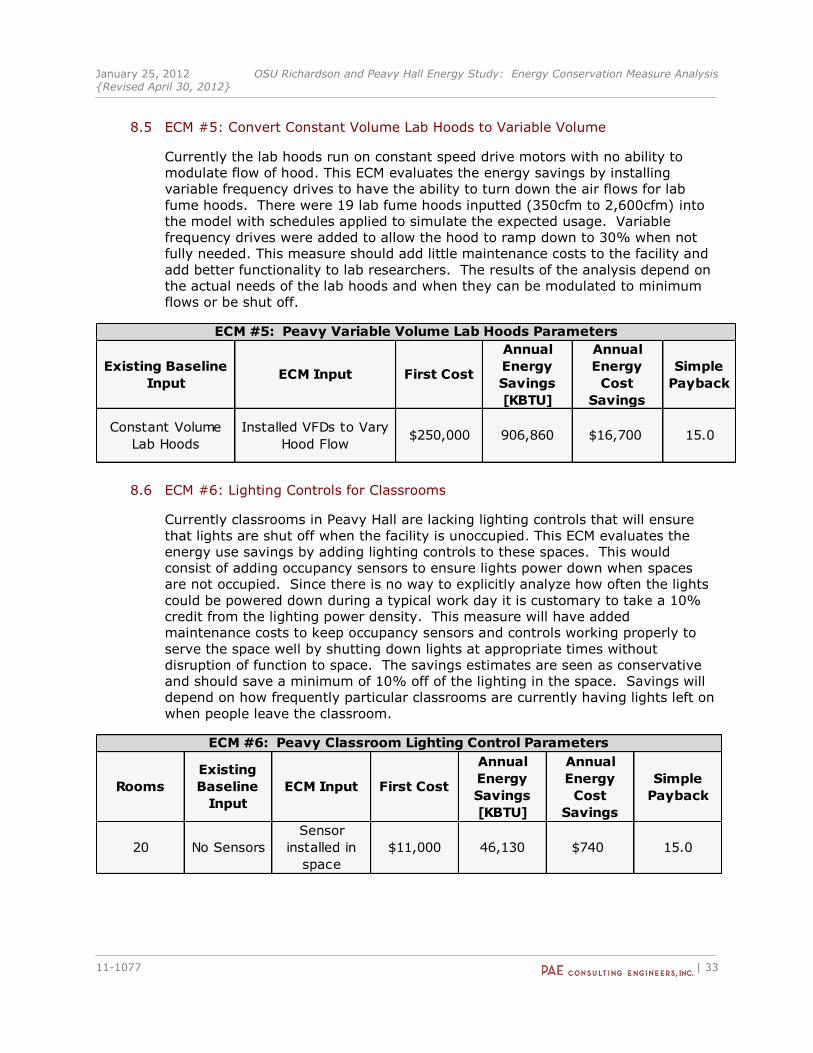
January 25, 2012 OSU Richardson and Peavy Hall Energy Study: Energy Conservation Measure Analysis {Revised April 30, 2012}
11-1077 | 33
8.5 ECM #5: Convert Constant Volume Lab Hoods to Variable Volume
Currently the lab hoods run on constant speed drive motors with no ability to
modulate flow of hood. This ECM evaluates the energy savings by installing
variable frequency drives to have the ability to turn down the air flows for lab
fume hoods. There were 19 lab fume hoods inputted (350cfm to 2,600cfm) into
the model with schedules applied to simulate the expected usage. Variable
frequency drives were added to allow the hood to ramp down to 30% when not
fully needed. This measure should add little maintenance costs to the facility and
add better functionality to lab researchers. The results of the analysis depend on
the actual needs of the lab hoods and when they can be modulated to minimum
flows or be shut off.
Existing Baseline
InputECM Input First Cost
Annual
Energy
Savings
[KBTU]
Annual
Energy
Cost
Savings
Simple
Payback
Constant Volume
Lab Hoods
Installed VFDs to Vary
Hood Flow$250,000 906,860 $16,700 15.0
ECM #5: Peavy Variable Volume Lab Hoods Parameters
8.6 ECM #6: Lighting Controls for Classrooms
Currently classrooms in Peavy Hall are lacking lighting controls that will ensure
that lights are shut off when the facility is unoccupied. This ECM evaluates the
energy use savings by adding lighting controls to these spaces. This would
consist of adding occupancy sensors to ensure lights power down when spaces
are not occupied. Since there is no way to explicitly analyze how often the lights
could be powered down during a typical work day it is customary to take a 10%
credit from the lighting power density. This measure will have added
maintenance costs to keep occupancy sensors and controls working properly to
serve the space well by shutting down lights at appropriate times without
disruption of function to space. The savings estimates are seen as conservative
and should save a minimum of 10% off of the lighting in the space. Savings will
depend on how frequently particular classrooms are currently having lights left on
when people leave the classroom.
Rooms
Existing
Baseline
Input
ECM Input First Cost
Annual
Energy
Savings
[KBTU]
Annual
Energy
Cost
Savings
Simple
Payback
20 No Sensors
Sensor
installed in
space
$11,000 46,130 $740 15.0
ECM #6: Peavy Classroom Lighting Control Parameters
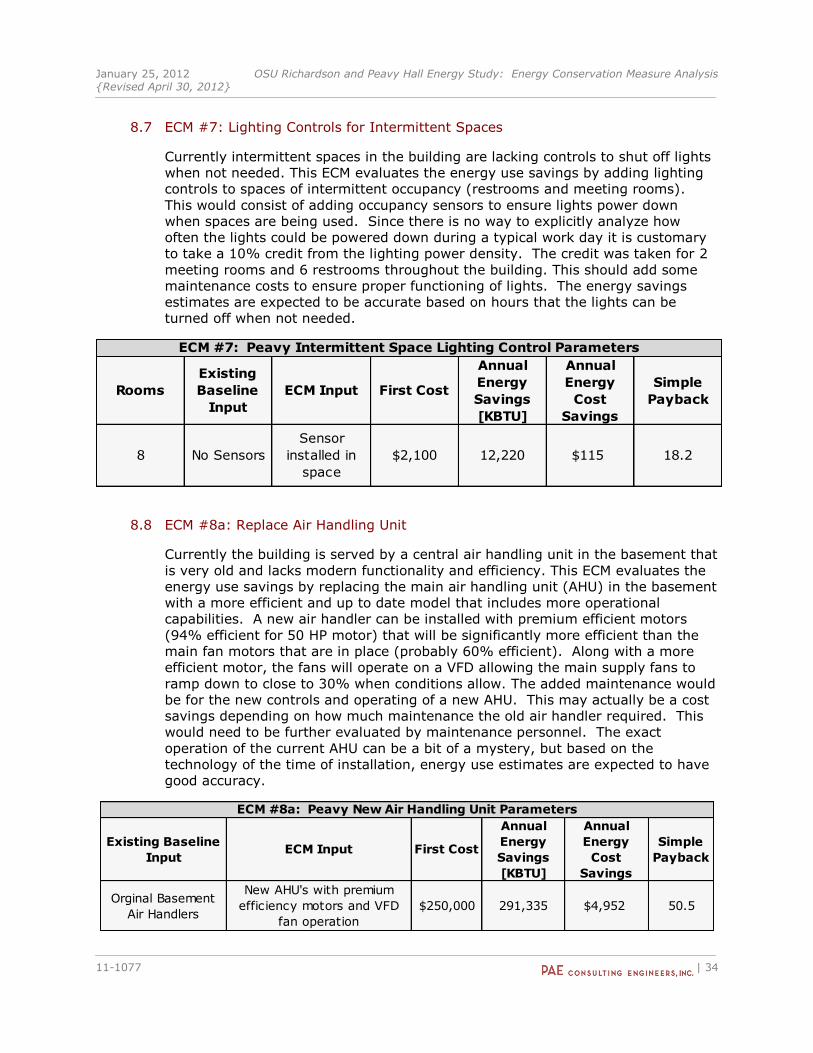
January 25, 2012 OSU Richardson and Peavy Hall Energy Study: Energy Conservation Measure Analysis {Revised April 30, 2012}
11-1077 | 34
8.7 ECM #7: Lighting Controls for Intermittent Spaces
Currently intermittent spaces in the building are lacking controls to shut off lights
when not needed. This ECM evaluates the energy use savings by adding lighting
controls to spaces of intermittent occupancy (restrooms and meeting rooms).
This would consist of adding occupancy sensors to ensure lights power down
when spaces are being used. Since there is no way to explicitly analyze how
often the lights could be powered down during a typical work day it is customary
to take a 10% credit from the lighting power density. The credit was taken for 2
meeting rooms and 6 restrooms throughout the building. This should add some
maintenance costs to ensure proper functioning of lights. The energy savings
estimates are expected to be accurate based on hours that the lights can be
turned off when not needed.
Rooms
Existing
Baseline
Input
ECM Input First Cost
Annual
Energy
Savings
[KBTU]
Annual
Energy
Cost
Savings
Simple
Payback
8 No Sensors
Sensor
installed in
space
$2,100 12,220 $115 18.2
ECM #7: Peavy Intermittent Space Lighting Control Parameters
8.8 ECM #8a: Replace Air Handling Unit
Currently the building is served by a central air handling unit in the basement that
is very old and lacks modern functionality and efficiency. This ECM evaluates the
energy use savings by replacing the main air handling unit (AHU) in the basement
with a more efficient and up to date model that includes more operational
capabilities. A new air handler can be installed with premium efficient motors
(94% efficient for 50 HP motor) that will be significantly more efficient than the
main fan motors that are in place (probably 60% efficient). Along with a more
efficient motor, the fans will operate on a VFD allowing the main supply fans to
ramp down to close to 30% when conditions allow. The added maintenance would
be for the new controls and operating of a new AHU. This may actually be a cost
savings depending on how much maintenance the old air handler required. This
would need to be further evaluated by maintenance personnel. The exact
operation of the current AHU can be a bit of a mystery, but based on the
technology of the time of installation, energy use estimates are expected to have
good accuracy.
Existing Baseline
InputECM Input First Cost
Annual
Energy
Savings
[KBTU]
Annual
Energy
Cost
Savings
Simple
Payback
Orginal Basement
Air Handlers
New AHU's with premium
efficiency motors and VFD
fan operation
$250,000 291,335 $4,952 50.5
ECM #8a: Peavy New Air Handling Unit Parameters
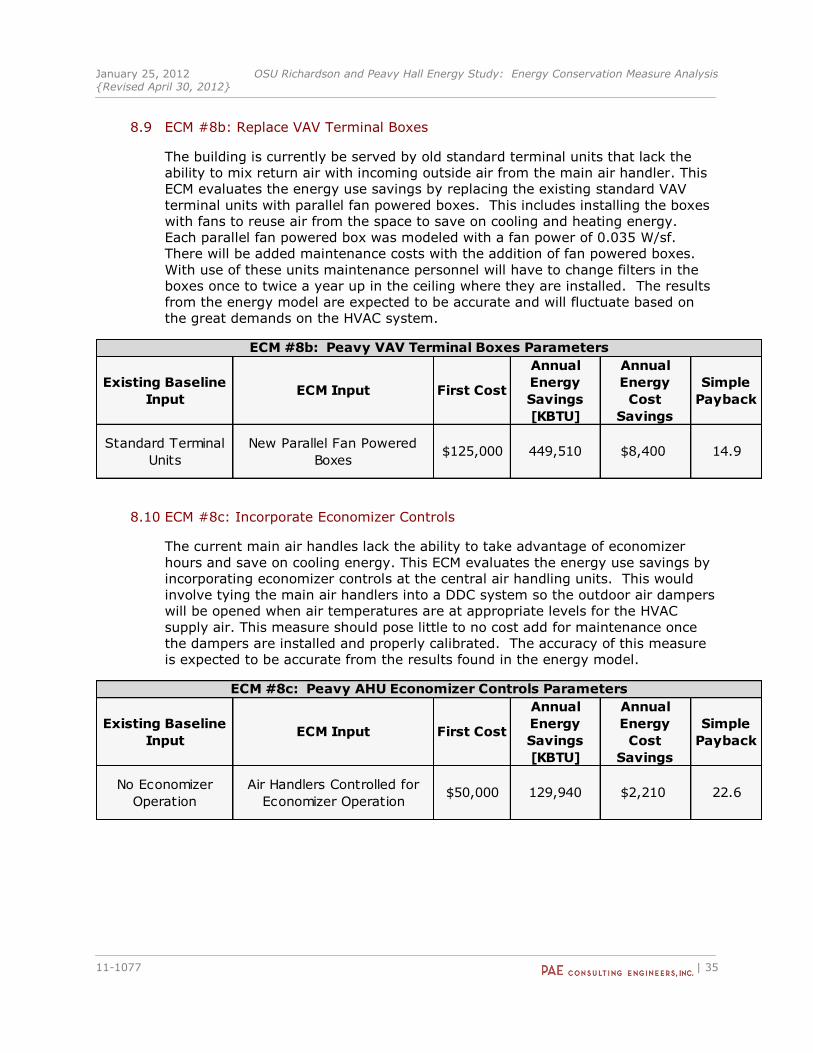
January 25, 2012 OSU Richardson and Peavy Hall Energy Study: Energy Conservation Measure Analysis {Revised April 30, 2012}
11-1077 | 35
8.9 ECM #8b: Replace VAV Terminal Boxes
The building is currently be served by old standard terminal units that lack the
ability to mix return air with incoming outside air from the main air handler. This
ECM evaluates the energy use savings by replacing the existing standard VAV
terminal units with parallel fan powered boxes. This includes installing the boxes
with fans to reuse air from the space to save on cooling and heating energy.
Each parallel fan powered box was modeled with a fan power of 0.035 W/sf.
There will be added maintenance costs with the addition of fan powered boxes.
With use of these units maintenance personnel will have to change filters in the
boxes once to twice a year up in the ceiling where they are installed. The results
from the energy model are expected to be accurate and will fluctuate based on
the great demands on the HVAC system.
Existing Baseline
InputECM Input First Cost
Annual
Energy
Savings
[KBTU]
Annual
Energy
Cost
Savings
Simple
Payback
Standard Terminal
Units
New Parallel Fan Powered
Boxes$125,000 449,510 $8,400 14.9
ECM #8b: Peavy VAV Terminal Boxes Parameters
8.10 ECM #8c: Incorporate Economizer Controls
The current main air handles lack the ability to take advantage of economizer
hours and save on cooling energy. This ECM evaluates the energy use savings by
incorporating economizer controls at the central air handling units. This would
involve tying the main air handlers into a DDC system so the outdoor air dampers
will be opened when air temperatures are at appropriate levels for the HVAC
supply air. This measure should pose little to no cost add for maintenance once
the dampers are installed and properly calibrated. The accuracy of this measure
is expected to be accurate from the results found in the energy model.
Existing Baseline
InputECM Input First Cost
Annual
Energy
Savings
[KBTU]
Annual
Energy
Cost
Savings
Simple
Payback
No Economizer
Operation
Air Handlers Controlled for
Economizer Operation$50,000 129,940 $2,210 22.6
ECM #8c: Peavy AHU Economizer Controls Parameters
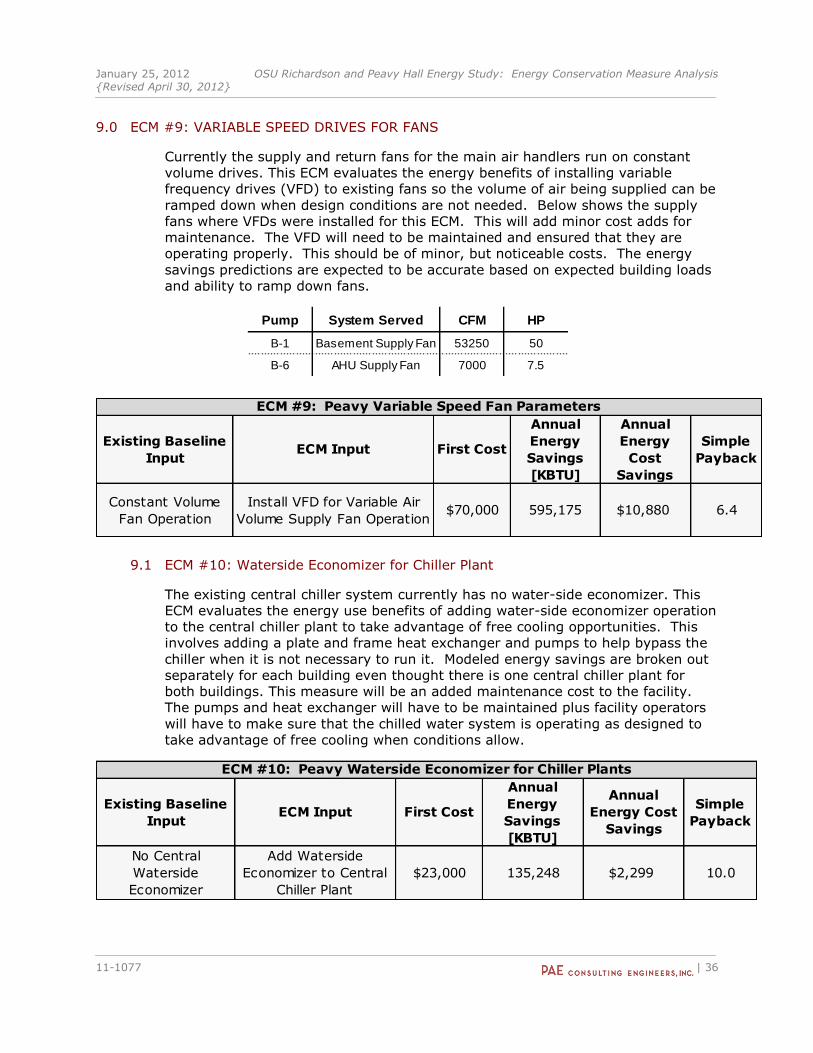
January 25, 2012 OSU Richardson and Peavy Hall Energy Study: Energy Conservation Measure Analysis {Revised April 30, 2012}
11-1077 | 36
9.0 ECM #9: VARIABLE SPEED DRIVES FOR FANS
Currently the supply and return fans for the main air handlers run on constant
volume drives. This ECM evaluates the energy benefits of installing variable
frequency drives (VFD) to existing fans so the volume of air being supplied can be
ramped down when design conditions are not needed. Below shows the supply
fans where VFDs were installed for this ECM. This will add minor cost adds for
maintenance. The VFD will need to be maintained and ensured that they are
operating properly. This should be of minor, but noticeable costs. The energy
savings predictions are expected to be accurate based on expected building loads
and ability to ramp down fans.
Existing Baseline
InputECM Input First Cost
Annual
Energy
Savings
[KBTU]
Annual
Energy
Cost
Savings
Simple
Payback
Constant Volume
Fan Operation
Install VFD for Variable Air
Volume Supply Fan Operation$70,000 595,175 $10,880 6.4
ECM #9: Peavy Variable Speed Fan Parameters
9.1 ECM #10: Waterside Economizer for Chiller Plant
The existing central chiller system currently has no water-side economizer. This
ECM evaluates the energy use benefits of adding water-side economizer operation
to the central chiller plant to take advantage of free cooling opportunities. This
involves adding a plate and frame heat exchanger and pumps to help bypass the
chiller when it is not necessary to run it. Modeled energy savings are broken out
separately for each building even thought there is one central chiller plant for
both buildings. This measure will be an added maintenance cost to the facility.
The pumps and heat exchanger will have to be maintained plus facility operators
will have to make sure that the chilled water system is operating as designed to
take advantage of free cooling when conditions allow.
Existing Baseline
InputECM Input First Cost
Annual
Energy
Savings
[KBTU]
Annual
Energy Cost
Savings
Simple
Payback
No Central
Waterside
Economizer
Add Waterside
Economizer to Central
Chiller Plant
$23,000 135,248 $2,299 10.0
ECM #10: Peavy Waterside Economizer for Chiller Plants
Pump System Served CFM HP
B-1 Basement Supply Fan 53250 50
B-6 AHU Supply Fan 7000 7.5
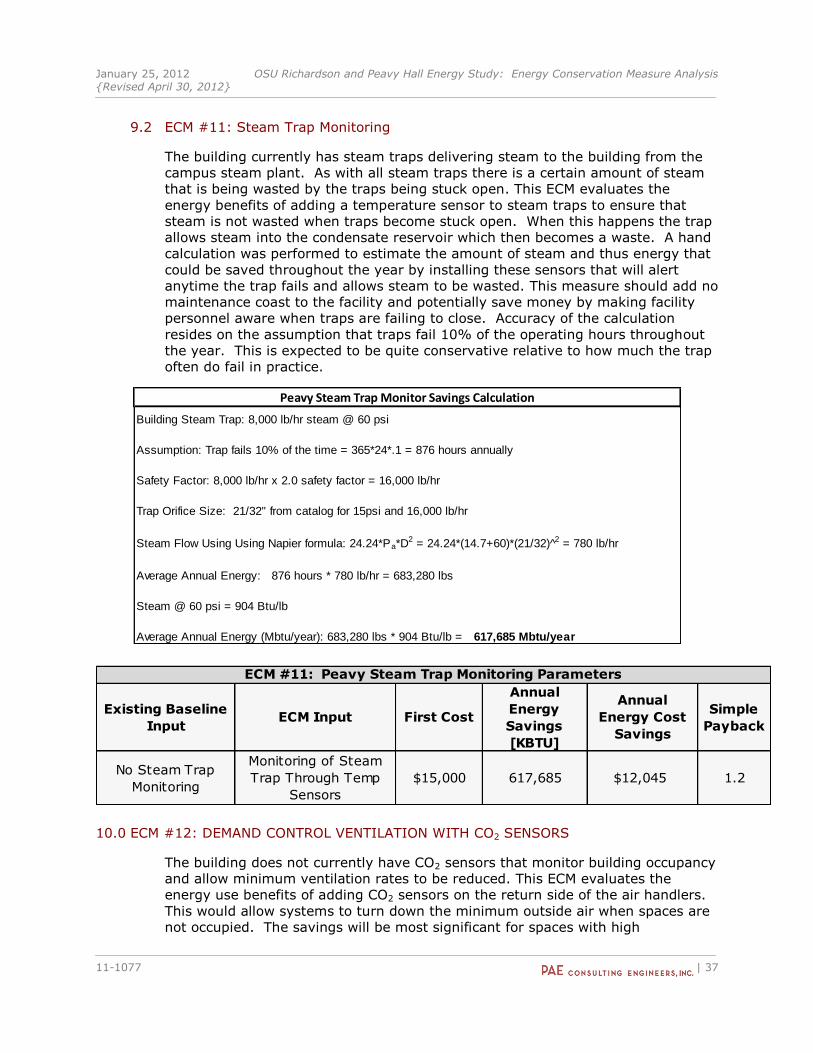
January 25, 2012 OSU Richardson and Peavy Hall Energy Study: Energy Conservation Measure Analysis {Revised April 30, 2012}
11-1077 | 37
9.2 ECM #11: Steam Trap Monitoring
The building currently has steam traps delivering steam to the building from the
campus steam plant. As with all steam traps there is a certain amount of steam
that is being wasted by the traps being stuck open. This ECM evaluates the
energy benefits of adding a temperature sensor to steam traps to ensure that
steam is not wasted when traps become stuck open. When this happens the trap
allows steam into the condensate reservoir which then becomes a waste. A hand
calculation was performed to estimate the amount of steam and thus energy that
could be saved throughout the year by installing these sensors that will alert
anytime the trap fails and allows steam to be wasted. This measure should add no
maintenance coast to the facility and potentially save money by making facility
personnel aware when traps are failing to close. Accuracy of the calculation
resides on the assumption that traps fail 10% of the operating hours throughout
the year. This is expected to be quite conservative relative to how much the trap
often do fail in practice.
Existing Baseline
InputECM Input First Cost
Annual
Energy
Savings
[KBTU]
Annual
Energy Cost
Savings
Simple
Payback
No Steam Trap
Monitoring
Monitoring of Steam
Trap Through Temp
Sensors
$15,000 617,685 $12,045 1.2
ECM #11: Peavy Steam Trap Monitoring Parameters
10.0 ECM #12: DEMAND CONTROL VENTILATION WITH CO2 SENSORS
The building does not currently have CO2 sensors that monitor building occupancy
and allow minimum ventilation rates to be reduced. This ECM evaluates the
energy use benefits of adding CO2 sensors on the return side of the air handlers.
This would allow systems to turn down the minimum outside air when spaces are
not occupied. The savings will be most significant for spaces with high
Building Steam Trap: 8,000 lb/hr steam @ 60 psi
Assumption: Trap fails 10% of the time = 365*24*.1 = 876 hours annually
Safety Factor: 8,000 lb/hr x 2.0 safety factor = 16,000 lb/hr
Trap Orifice Size: 21/32" from catalog for 15psi and 16,000 lb/hr
Steam Flow Using Using Napier formula: 24.24*Pa*D2 = 24.24*(14.7+60)*(21/32)^2 = 780 lb/hr
Average Annual Energy: 876 hours * 780 lb/hr = 683,280 lbs
Steam @ 60 psi = 904 Btu/lb
Average Annual Energy (Mbtu/year): 683,280 lbs * 904 Btu/lb = 617,685 Mbtu/year
Peavy Steam Trap Monitor Savings Calculation
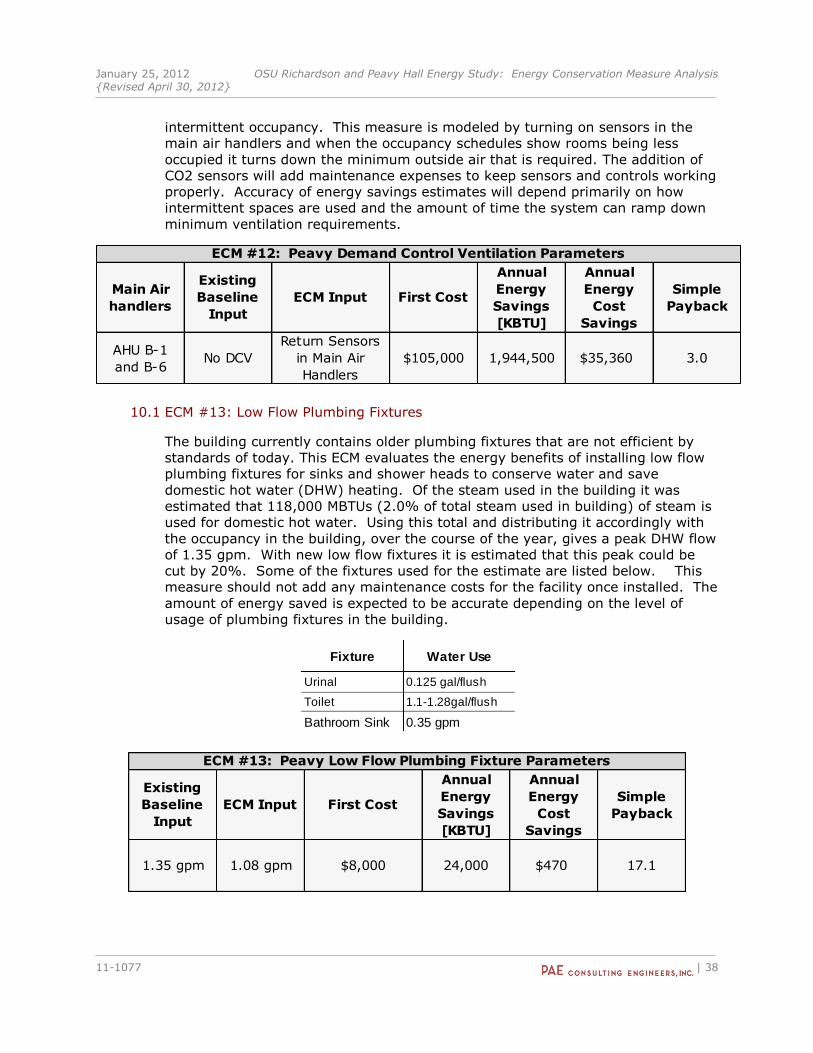
January 25, 2012 OSU Richardson and Peavy Hall Energy Study: Energy Conservation Measure Analysis {Revised April 30, 2012}
11-1077 | 38
intermittent occupancy. This measure is modeled by turning on sensors in the
main air handlers and when the occupancy schedules show rooms being less
occupied it turns down the minimum outside air that is required. The addition of
CO2 sensors will add maintenance expenses to keep sensors and controls working
properly. Accuracy of energy savings estimates will depend primarily on how
intermittent spaces are used and the amount of time the system can ramp down
minimum ventilation requirements.
Main Air
handlers
Existing
Baseline
Input
ECM Input First Cost
Annual
Energy
Savings
[KBTU]
Annual
Energy
Cost
Savings
Simple
Payback
AHU B-1
and B-6No DCV
Return Sensors
in Main Air
Handlers
$105,000 1,944,500 $35,360 3.0
ECM #12: Peavy Demand Control Ventilation Parameters
10.1 ECM #13: Low Flow Plumbing Fixtures
The building currently contains older plumbing fixtures that are not efficient by
standards of today. This ECM evaluates the energy benefits of installing low flow
plumbing fixtures for sinks and shower heads to conserve water and save
domestic hot water (DHW) heating. Of the steam used in the building it was
estimated that 118,000 MBTUs (2.0% of total steam used in building) of steam is
used for domestic hot water. Using this total and distributing it accordingly with
the occupancy in the building, over the course of the year, gives a peak DHW flow
of 1.35 gpm. With new low flow fixtures it is estimated that this peak could be
cut by 20%. Some of the fixtures used for the estimate are listed below. This
measure should not add any maintenance costs for the facility once installed. The
amount of energy saved is expected to be accurate depending on the level of
usage of plumbing fixtures in the building.
Existing
Baseline
Input
ECM Input First Cost
Annual
Energy
Savings
[KBTU]
Annual
Energy
Cost
Savings
Simple
Payback
1.35 gpm 1.08 gpm $8,000 24,000 $470 17.1
ECM #13: Peavy Low Flow Plumbing Fixture Parameters
Fixture Water Use
Urinal 0.125 gal/flush
Toilet 1.1-1.28gal/flush
Bathroom Sink 0.35 gpm
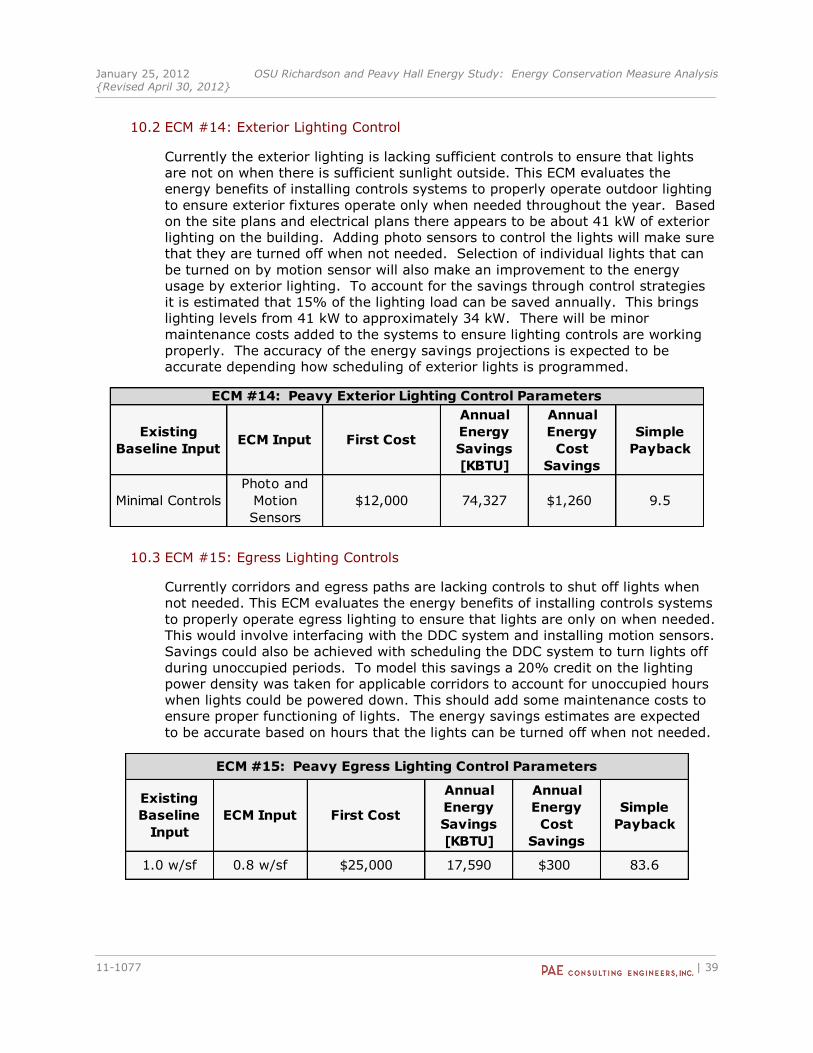
January 25, 2012 OSU Richardson and Peavy Hall Energy Study: Energy Conservation Measure Analysis {Revised April 30, 2012}
11-1077 | 39
10.2 ECM #14: Exterior Lighting Control
Currently the exterior lighting is lacking sufficient controls to ensure that lights
are not on when there is sufficient sunlight outside. This ECM evaluates the
energy benefits of installing controls systems to properly operate outdoor lighting
to ensure exterior fixtures operate only when needed throughout the year. Based
on the site plans and electrical plans there appears to be about 41 kW of exterior
lighting on the building. Adding photo sensors to control the lights will make sure
that they are turned off when not needed. Selection of individual lights that can
be turned on by motion sensor will also make an improvement to the energy
usage by exterior lighting. To account for the savings through control strategies
it is estimated that 15% of the lighting load can be saved annually. This brings
lighting levels from 41 kW to approximately 34 kW. There will be minor
maintenance costs added to the systems to ensure lighting controls are working
properly. The accuracy of the energy savings projections is expected to be
accurate depending how scheduling of exterior lights is programmed.
Existing
Baseline InputECM Input First Cost
Annual
Energy
Savings
[KBTU]
Annual
Energy
Cost
Savings
Simple
Payback
Minimal Controls
Photo and
Motion
Sensors
$12,000 74,327 $1,260 9.5
ECM #14: Peavy Exterior Lighting Control Parameters
10.3 ECM #15: Egress Lighting Controls
Currently corridors and egress paths are lacking controls to shut off lights when
not needed. This ECM evaluates the energy benefits of installing controls systems
to properly operate egress lighting to ensure that lights are only on when needed.
This would involve interfacing with the DDC system and installing motion sensors.
Savings could also be achieved with scheduling the DDC system to turn lights off
during unoccupied periods. To model this savings a 20% credit on the lighting
power density was taken for applicable corridors to account for unoccupied hours
when lights could be powered down. This should add some maintenance costs to
ensure proper functioning of lights. The energy savings estimates are expected
to be accurate based on hours that the lights can be turned off when not needed.
Existing
Baseline
Input
ECM Input First Cost
Annual
Energy
Savings
[KBTU]
Annual
Energy
Cost
Savings
Simple
Payback
1.0 w/sf 0.8 w/sf $25,000 17,590 $300 83.6
ECM #15: Peavy Egress Lighting Control Parameters
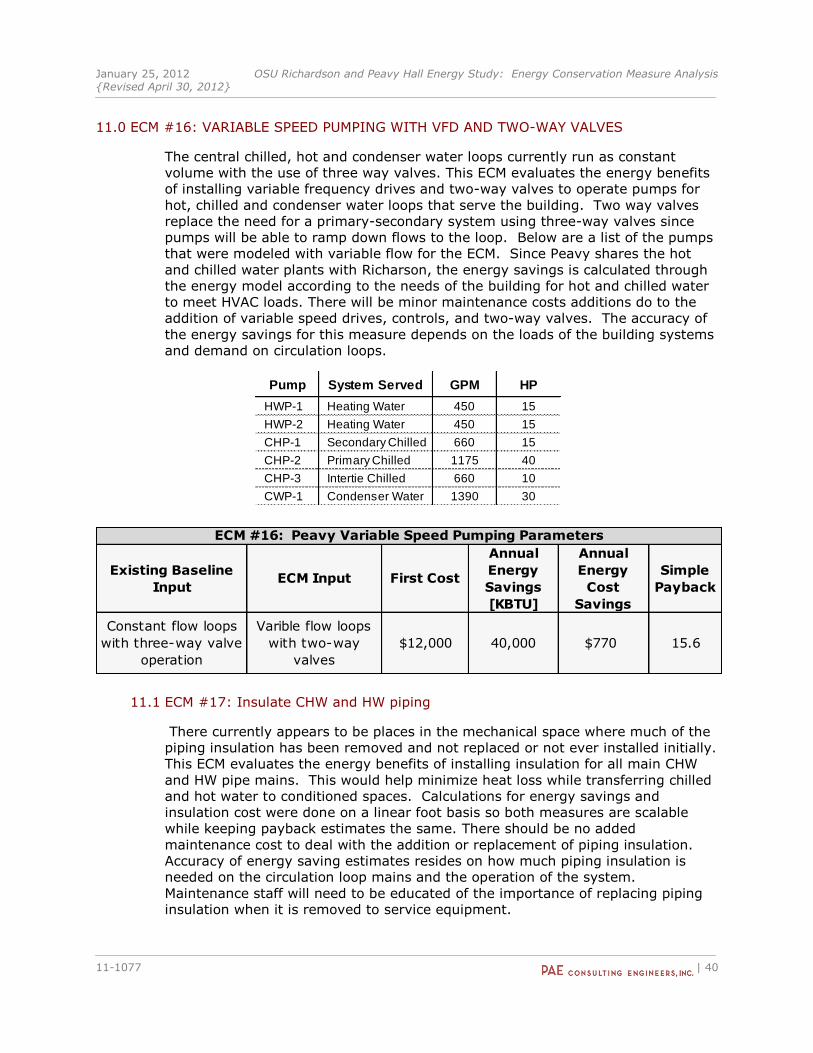
January 25, 2012 OSU Richardson and Peavy Hall Energy Study: Energy Conservation Measure Analysis {Revised April 30, 2012}
11-1077 | 40
11.0 ECM #16: VARIABLE SPEED PUMPING WITH VFD AND TWO-WAY VALVES
The central chilled, hot and condenser water loops currently run as constant
volume with the use of three way valves. This ECM evaluates the energy benefits
of installing variable frequency drives and two-way valves to operate pumps for
hot, chilled and condenser water loops that serve the building. Two way valves
replace the need for a primary-secondary system using three-way valves since
pumps will be able to ramp down flows to the loop. Below are a list of the pumps
that were modeled with variable flow for the ECM. Since Peavy shares the hot
and chilled water plants with Richarson, the energy savings is calculated through
the energy model according to the needs of the building for hot and chilled water
to meet HVAC loads. There will be minor maintenance costs additions do to the
addition of variable speed drives, controls, and two-way valves. The accuracy of
the energy savings for this measure depends on the loads of the building systems
and demand on circulation loops.
Existing Baseline
InputECM Input First Cost
Annual
Energy
Savings
[KBTU]
Annual
Energy
Cost
Savings
Simple
Payback
Constant flow loops
with three-way valve
operation
Varible flow loops
with two-way
valves
$12,000 40,000 $770 15.6
ECM #16: Peavy Variable Speed Pumping Parameters
11.1 ECM #17: Insulate CHW and HW piping
There currently appears to be places in the mechanical space where much of the
piping insulation has been removed and not replaced or not ever installed initially.
This ECM evaluates the energy benefits of installing insulation for all main CHW
and HW pipe mains. This would help minimize heat loss while transferring chilled
and hot water to conditioned spaces. Calculations for energy savings and
insulation cost were done on a linear foot basis so both measures are scalable
while keeping payback estimates the same. There should be no added
maintenance cost to deal with the addition or replacement of piping insulation.
Accuracy of energy saving estimates resides on how much piping insulation is
needed on the circulation loop mains and the operation of the system.
Maintenance staff will need to be educated of the importance of replacing piping
insulation when it is removed to service equipment.
Pump System Served GPM HP
HWP-1 Heating Water 450 15
HWP-2 Heating Water 450 15
CHP-1 Secondary Chilled 660 15
CHP-2 Primary Chilled 1175 40
CHP-3 Intertie Chilled 660 10
CWP-1 Condenser Water 1390 30
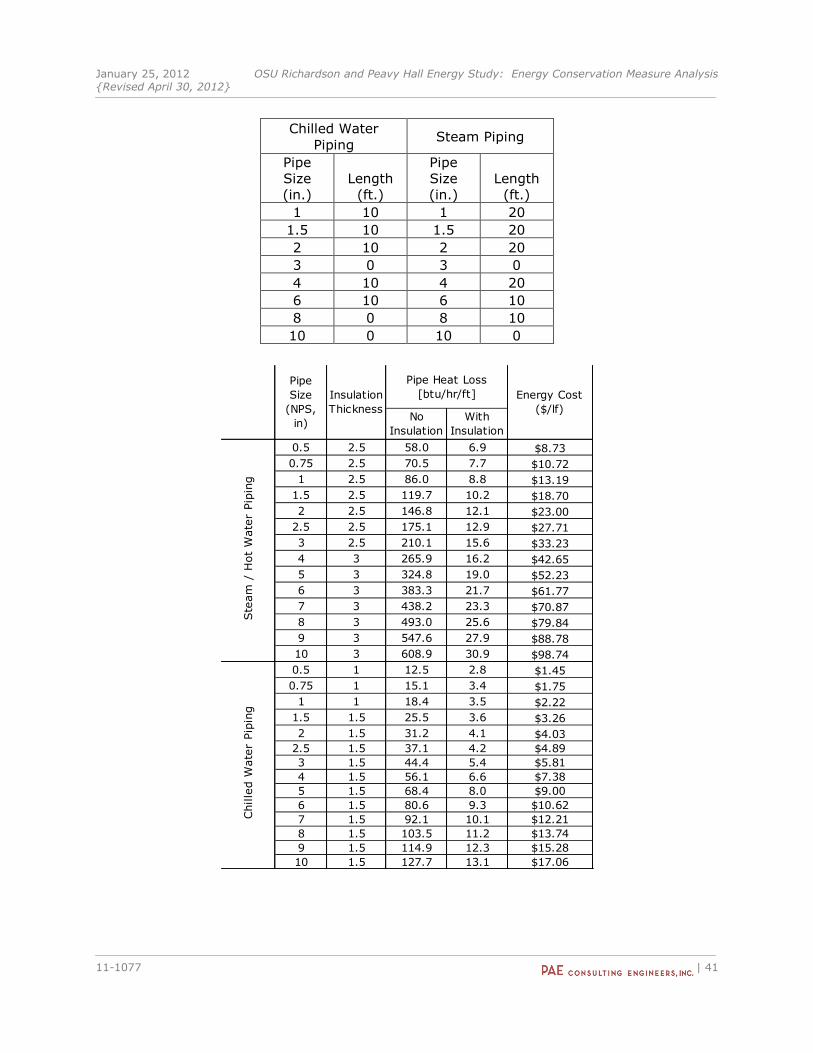
January 25, 2012 OSU Richardson and Peavy Hall Energy Study: Energy Conservation Measure Analysis {Revised April 30, 2012}
11-1077 | 41
Chilled Water
Piping Steam Piping
Pipe
Size
(in.)
Length
(ft.)
Pipe
Size
(in.)
Length
(ft.)
1 10 1 20
1.5 10 1.5 20
2 10 2 20
3 0 3 0
4 10 4 20
6 10 6 10
8 0 8 10
10 0 10 0
No
Insulation
With
Insulation
0.5 2.5 58.0 6.9 $8.73
0.75 2.5 70.5 7.7 $10.72
1 2.5 86.0 8.8 $13.19
1.5 2.5 119.7 10.2 $18.70
2 2.5 146.8 12.1 $23.00
2.5 2.5 175.1 12.9 $27.71
3 2.5 210.1 15.6 $33.23
4 3 265.9 16.2 $42.65
5 3 324.8 19.0 $52.23
6 3 383.3 21.7 $61.77
7 3 438.2 23.3 $70.87
8 3 493.0 25.6 $79.84
9 3 547.6 27.9 $88.78
10 3 608.9 30.9 $98.74
0.5 1 12.5 2.8 $1.45
0.75 1 15.1 3.4 $1.75
1 1 18.4 3.5 $2.22
1.5 1.5 25.5 3.6 $3.26
2 1.5 31.2 4.1 $4.03
2.5 1.5 37.1 4.2 $4.89
3 1.5 44.4 5.4 $5.81
4 1.5 56.1 6.6 $7.38
5 1.5 68.4 8.0 $9.00
6 1.5 80.6 9.3 $10.62
7 1.5 92.1 10.1 $12.21
8 1.5 103.5 11.2 $13.74
9 1.5 114.9 12.3 $15.28
10 1.5 127.7 13.1 $17.06
Pipe Heat Loss
[btu/hr/ft]
Ste
am
/ H
ot
Wate
r Pip
ing
Energy Cost
($/lf)
Chille
d W
ate
r Pip
ing
Pipe
Size
(NPS,
in)
Insulation
Thickness
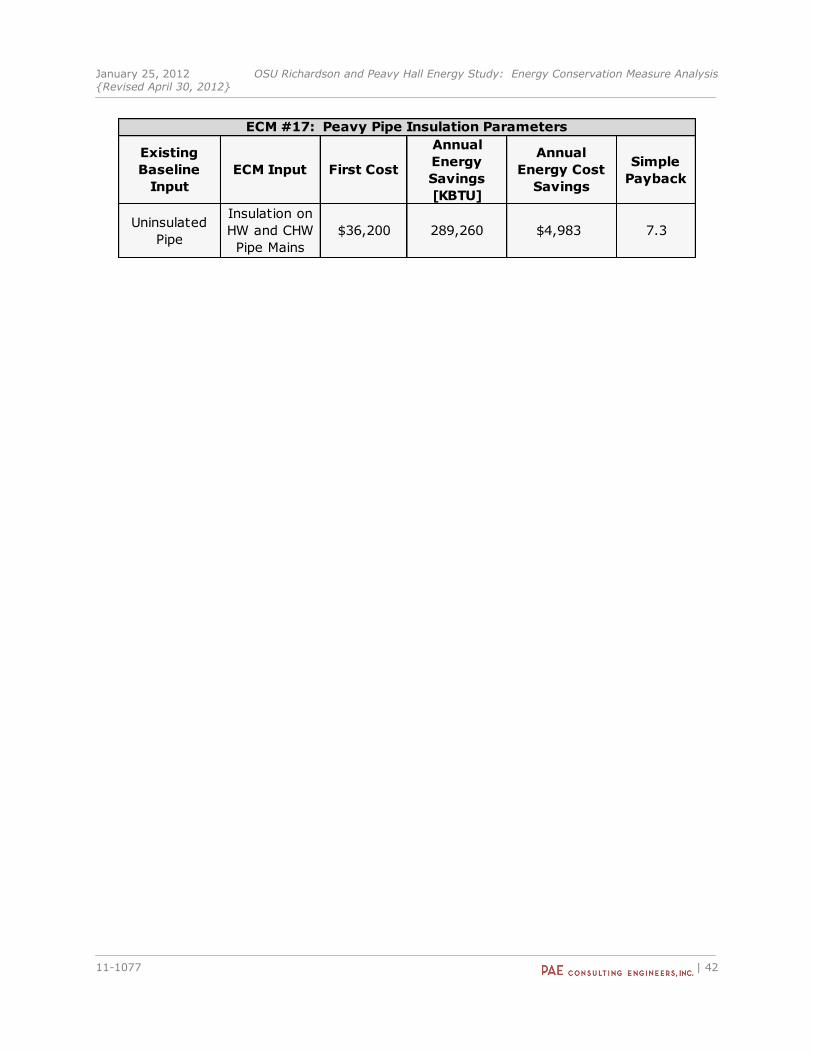
January 25, 2012 OSU Richardson and Peavy Hall Energy Study: Energy Conservation Measure Analysis {Revised April 30, 2012}
11-1077 | 42
Existing
Baseline
Input
ECM Input First Cost
Annual
Energy
Savings
[KBTU]
Annual
Energy Cost
Savings
Simple
Payback
Uninsulated
Pipe
Insulation on
HW and CHW
Pipe Mains
$36,200 289,260 $4,983 7.3
ECM #17: Peavy Pipe Insulation Parameters
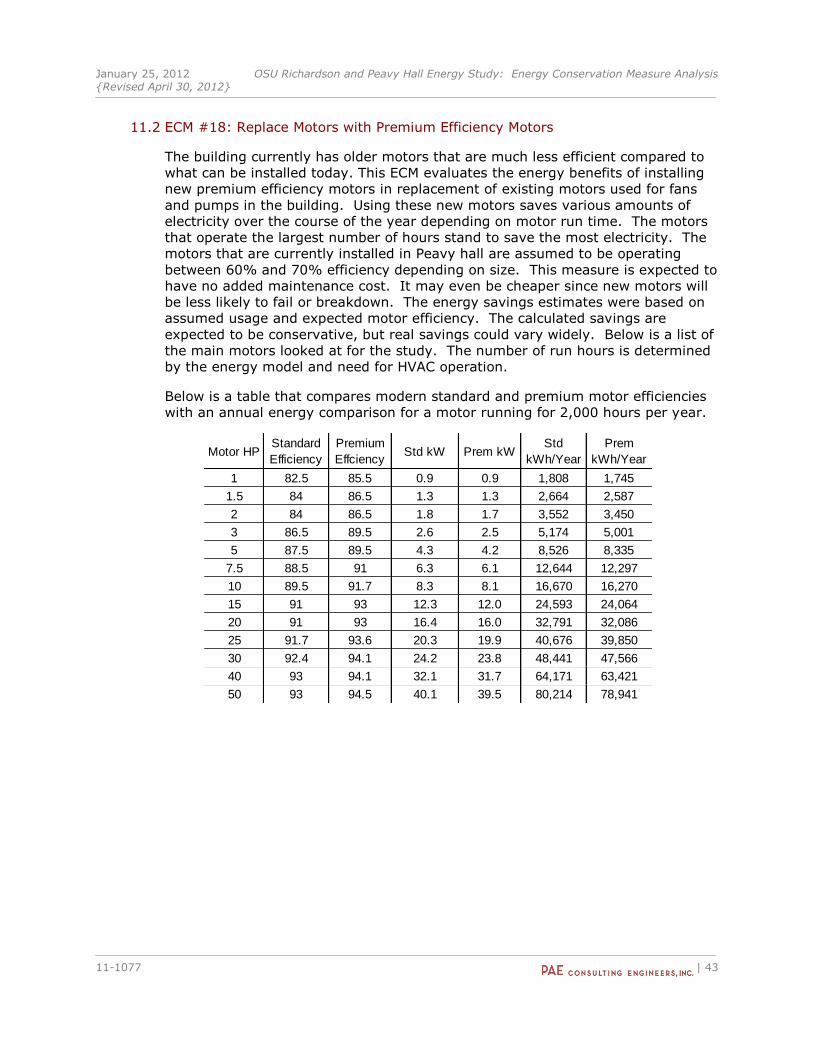
January 25, 2012 OSU Richardson and Peavy Hall Energy Study: Energy Conservation Measure Analysis {Revised April 30, 2012}
11-1077 | 43
11.2 ECM #18: Replace Motors with Premium Efficiency Motors
The building currently has older motors that are much less efficient compared to
what can be installed today. This ECM evaluates the energy benefits of installing
new premium efficiency motors in replacement of existing motors used for fans
and pumps in the building. Using these new motors saves various amounts of
electricity over the course of the year depending on motor run time. The motors
that operate the largest number of hours stand to save the most electricity. The
motors that are currently installed in Peavy hall are assumed to be operating
between 60% and 70% efficiency depending on size. This measure is expected to
have no added maintenance cost. It may even be cheaper since new motors will
be less likely to fail or breakdown. The energy savings estimates were based on
assumed usage and expected motor efficiency. The calculated savings are
expected to be conservative, but real savings could vary widely. Below is a list of
the main motors looked at for the study. The number of run hours is determined
by the energy model and need for HVAC operation.
Below is a table that compares modern standard and premium motor efficiencies
with an annual energy comparison for a motor running for 2,000 hours per year.
Motor HPStandard
Efficiency
Premium
EffciencyStd kW Prem kW
Std
kWh/Year
Prem
kWh/Year
1 82.5 85.5 0.9 0.9 1,808 1,745
1.5 84 86.5 1.3 1.3 2,664 2,587
2 84 86.5 1.8 1.7 3,552 3,450
3 86.5 89.5 2.6 2.5 5,174 5,001
5 87.5 89.5 4.3 4.2 8,526 8,335
7.5 88.5 91 6.3 6.1 12,644 12,297
10 89.5 91.7 8.3 8.1 16,670 16,270
15 91 93 12.3 12.0 24,593 24,064
20 91 93 16.4 16.0 32,791 32,086
25 91.7 93.6 20.3 19.9 40,676 39,850
30 92.4 94.1 24.2 23.8 48,441 47,566
40 93 94.1 32.1 31.7 64,171 63,421
50 93 94.5 40.1 39.5 80,214 78,941
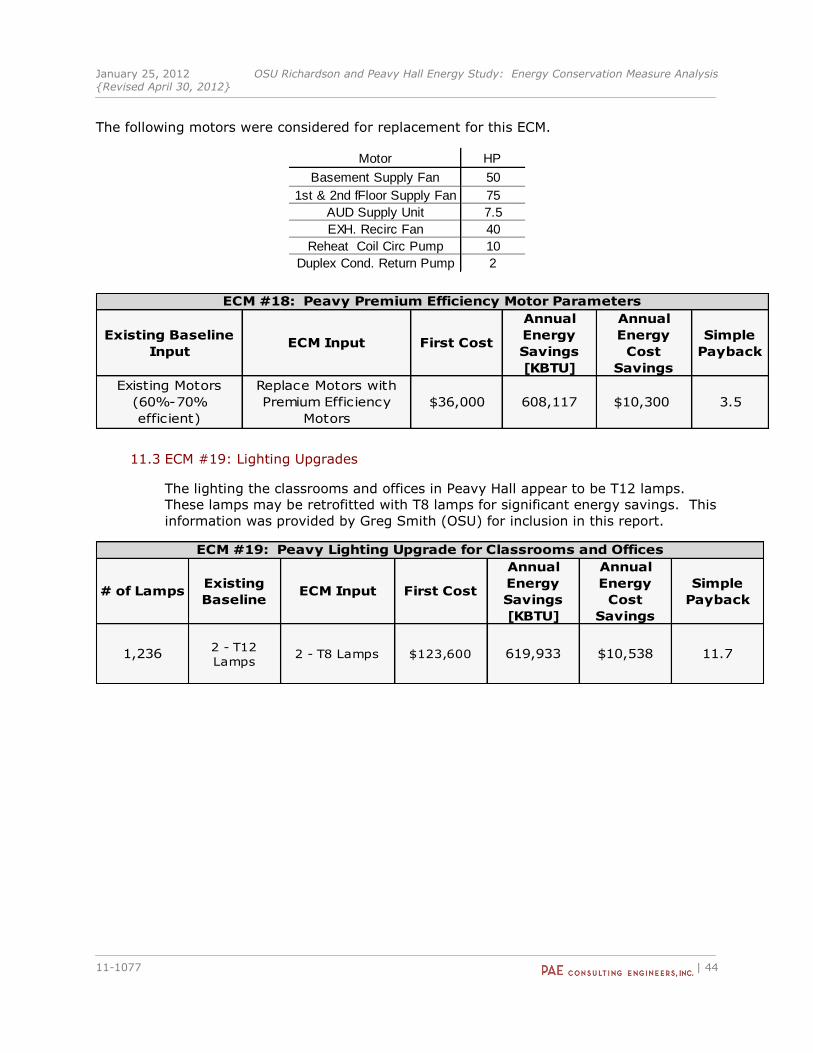
January 25, 2012 OSU Richardson and Peavy Hall Energy Study: Energy Conservation Measure Analysis {Revised April 30, 2012}
11-1077 | 44
The following motors were considered for replacement for this ECM.
Motor HP
Basement Supply Fan 50
1st & 2nd fFloor Supply Fan 75
AUD Supply Unit 7.5
EXH. Recirc Fan 40
Reheat Coil Circ Pump 10
Duplex Cond. Return Pump 2
Existing Baseline
InputECM Input First Cost
Annual
Energy
Savings
[KBTU]
Annual
Energy
Cost
Savings
Simple
Payback
Existing Motors
(60%-70%
efficient)
Replace Motors with
Premium Efficiency
Motors
$36,000 608,117 $10,300 3.5
ECM #18: Peavy Premium Efficiency Motor Parameters
11.3 ECM #19: Lighting Upgrades
The lighting the classrooms and offices in Peavy Hall appear to be T12 lamps.
These lamps may be retrofitted with T8 lamps for significant energy savings. This
information was provided by Greg Smith (OSU) for inclusion in this report.
# of LampsExisting
BaselineECM Input First Cost
Annual
Energy
Savings
[KBTU]
Annual
Energy
Cost
Savings
Simple
Payback
1,2362 - T12
Lamps2 - T8 Lamps $123,600 619,933 $10,538 11.7
ECM #19: Peavy Lighting Upgrade for Classrooms and Offices
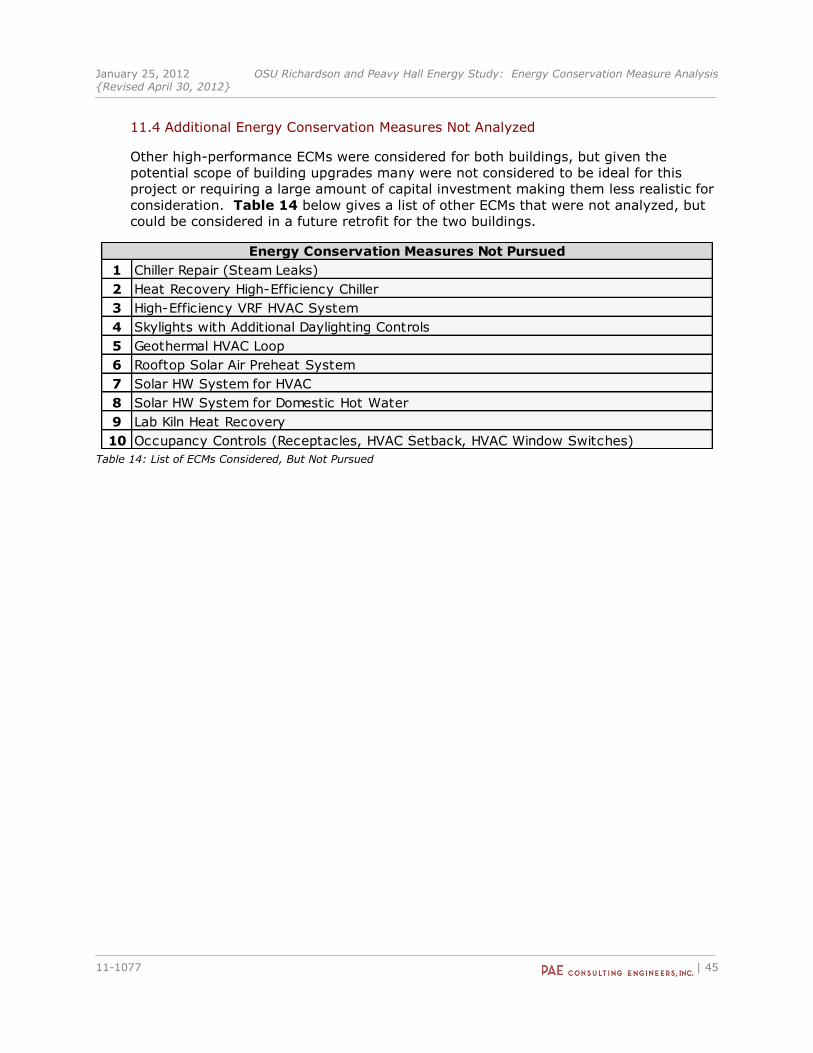
January 25, 2012 OSU Richardson and Peavy Hall Energy Study: Energy Conservation Measure Analysis {Revised April 30, 2012}
11-1077 | 45
11.4 Additional Energy Conservation Measures Not Analyzed
Other high-performance ECMs were considered for both buildings, but given the
potential scope of building upgrades many were not considered to be ideal for this
project or requiring a large amount of capital investment making them less realistic for
consideration. Table 14 below gives a list of other ECMs that were not analyzed, but
could be considered in a future retrofit for the two buildings.
1 Chiller Repair (Steam Leaks)
2 Heat Recovery High-Efficiency Chiller
3 High-Efficiency VRF HVAC System
4 Skylights with Additional Daylighting Controls
5 Geothermal HVAC Loop
6 Rooftop Solar Air Preheat System
7 Solar HW System for HVAC
8 Solar HW System for Domestic Hot Water
9 Lab Kiln Heat Recovery
10 Occupancy Controls (Receptacles, HVAC Setback, HVAC Window Switches)
Energy Conservation Measures Not Pursued
Table 14: List of ECMs Considered, But Not Pursued
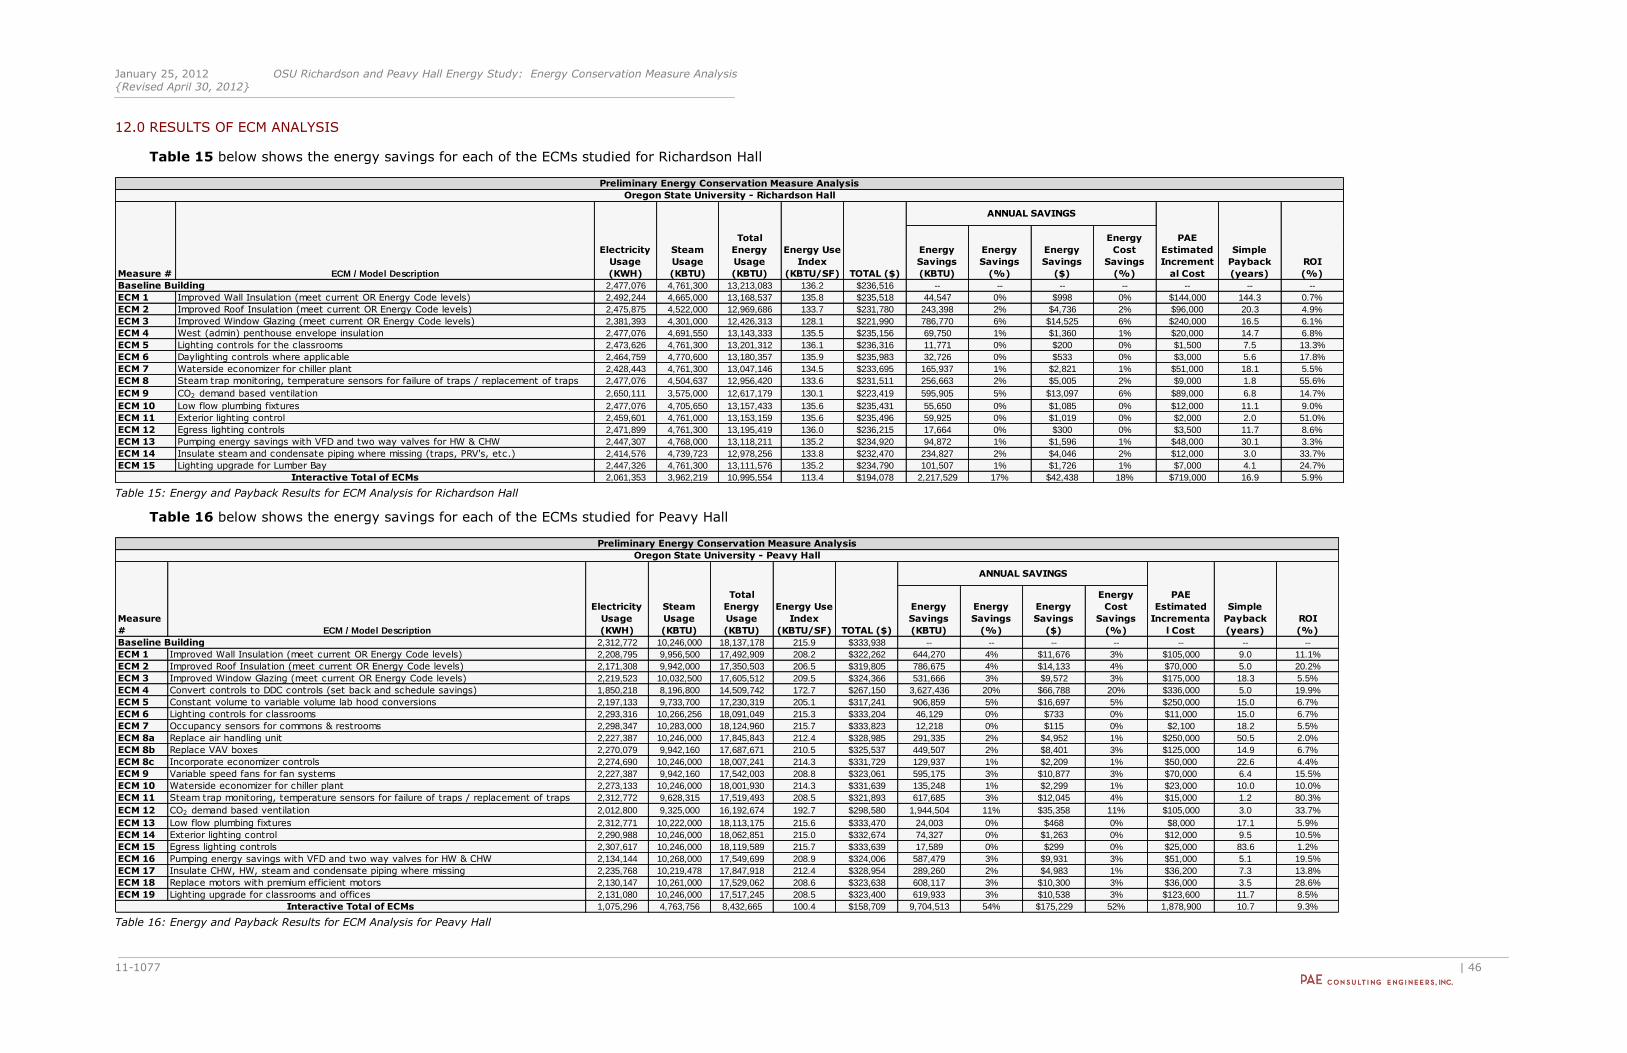
January 25, 2012 OSU Richardson and Peavy Hall Energy Study: Energy Conservation Measure Analysis {Revised April 30, 2012}
11-1077 | 46
12.0 RESULTS OF ECM ANALYSIS
Table 15 below shows the energy savings for each of the ECMs studied for Richardson Hall
2,477,076 4,761,300 13,213,083 136.2 $236,516 -- -- -- -- -- -- --
ECM 1 Improved Wall Insulation (meet current OR Energy Code levels) 2,492,244 4,665,000 13,168,537 135.8 $235,518 44,547 0% $998 0% $144,000 144.3 0.7%
ECM 2 Improved Roof Insulation (meet current OR Energy Code levels) 2,475,875 4,522,000 12,969,686 133.7 $231,780 243,398 2% $4,736 2% $96,000 20.3 4.9%
ECM 3 Improved Window Glazing (meet current OR Energy Code levels) 2,381,393 4,301,000 12,426,313 128.1 $221,990 786,770 6% $14,525 6% $240,000 16.5 6.1%
ECM 4 West (admin) penthouse envelope insulation 2,477,076 4,691,550 13,143,333 135.5 $235,156 69,750 1% $1,360 1% $20,000 14.7 6.8%
ECM 5 Lighting controls for the classrooms 2,473,626 4,761,300 13,201,312 136.1 $236,316 11,771 0% $200 0% $1,500 7.5 13.3%
ECM 6 Daylighting controls where applicable 2,464,759 4,770,600 13,180,357 135.9 $235,983 32,726 0% $533 0% $3,000 5.6 17.8%
ECM 7 Waterside economizer for chiller plant 2,428,443 4,761,300 13,047,146 134.5 $233,695 165,937 1% $2,821 1% $51,000 18.1 5.5%
ECM 8 Steam trap monitoring, temperature sensors for failure of traps / replacement of traps 2,477,076 4,504,637 12,956,420 133.6 $231,511 256,663 2% $5,005 2% $9,000 1.8 55.6%
ECM 9 CO2 demand based ventilation 2,650,111 3,575,000 12,617,179 130.1 $223,419 595,905 5% $13,097 6% $89,000 6.8 14.7%
ECM 10 Low flow plumbing fixtures 2,477,076 4,705,650 13,157,433 135.6 $235,431 55,650 0% $1,085 0% $12,000 11.1 9.0%
ECM 11 Exterior lighting control 2,459,601 4,761,000 13,153,159 135.6 $235,496 59,925 0% $1,019 0% $2,000 2.0 51.0%
ECM 12 Egress lighting controls 2,471,899 4,761,300 13,195,419 136.0 $236,215 17,664 0% $300 0% $3,500 11.7 8.6%
ECM 13 Pumping energy savings with VFD and two way valves for HW & CHW 2,447,307 4,768,000 13,118,211 135.2 $234,920 94,872 1% $1,596 1% $48,000 30.1 3.3%
ECM 14 Insulate steam and condensate piping where missing (traps, PRV's, etc.) 2,414,576 4,739,723 12,978,256 133.8 $232,470 234,827 2% $4,046 2% $12,000 3.0 33.7%
ECM 15 Lighting upgrade for Lumber Bay 2,447,326 4,761,300 13,111,576 135.2 $234,790 101,507 1% $1,726 1% $7,000 4.1 24.7%
2,061,353 3,962,219 10,995,554 113.4 $194,078 2,217,529 17% $42,438 18% $719,000 16.9 5.9%
Total
Energy
Usage
(KBTU)
Preliminary Energy Conservation Measure Analysis
Oregon State University - Richardson Hall
Simple
Payback
(years)
Energy
Cost
Savings
(%)
Energy
Savings
($)
Energy
Savings
(%)Measure #
ROI
(%)
PAE
Estimated
Increment
al Cost
ANNUAL SAVINGS
Energy
Savings
(KBTU)
Energy Use
Index
(KBTU/SF) TOTAL ($)
Interactive Total of ECMs
Baseline Building
ECM / Model Description
Electricity
Usage
(KWH)
Steam
Usage
(KBTU)
Table 15: Energy and Payback Results for ECM Analysis for Richardson Hall
Table 16 below shows the energy savings for each of the ECMs studied for Peavy Hall
2,312,772 10,246,000 18,137,178 215.9 $333,938 -- -- -- -- -- -- --
ECM 1 Improved Wall Insulation (meet current OR Energy Code levels) 2,208,795 9,956,500 17,492,909 208.2 $322,262 644,270 4% $11,676 3% $105,000 9.0 11.1%
ECM 2 Improved Roof Insulation (meet current OR Energy Code levels) 2,171,308 9,942,000 17,350,503 206.5 $319,805 786,675 4% $14,133 4% $70,000 5.0 20.2%
ECM 3 Improved Window Glazing (meet current OR Energy Code levels) 2,219,523 10,032,500 17,605,512 209.5 $324,366 531,666 3% $9,572 3% $175,000 18.3 5.5%
ECM 4 Convert controls to DDC controls (set back and schedule savings) 1,850,218 8,196,800 14,509,742 172.7 $267,150 3,627,436 20% $66,788 20% $336,000 5.0 19.9%
ECM 5 Constant volume to variable volume lab hood conversions 2,197,133 9,733,700 17,230,319 205.1 $317,241 906,859 5% $16,697 5% $250,000 15.0 6.7%
ECM 6 Lighting controls for classrooms 2,293,316 10,266,256 18,091,049 215.3 $333,204 46,129 0% $733 0% $11,000 15.0 6.7%
ECM 7 Occupancy sensors for commons & restrooms 2,298,347 10,283,000 18,124,960 215.7 $333,823 12,218 0% $115 0% $2,100 18.2 5.5%
ECM 8a Replace air handling unit 2,227,387 10,246,000 17,845,843 212.4 $328,985 291,335 2% $4,952 1% $250,000 50.5 2.0%
ECM 8b Replace VAV boxes 2,270,079 9,942,160 17,687,671 210.5 $325,537 449,507 2% $8,401 3% $125,000 14.9 6.7%
ECM 8c Incorporate economizer controls 2,274,690 10,246,000 18,007,241 214.3 $331,729 129,937 1% $2,209 1% $50,000 22.6 4.4%
ECM 9 Variable speed fans for fan systems 2,227,387 9,942,160 17,542,003 208.8 $323,061 595,175 3% $10,877 3% $70,000 6.4 15.5%
ECM 10 Waterside economizer for chiller plant 2,273,133 10,246,000 18,001,930 214.3 $331,639 135,248 1% $2,299 1% $23,000 10.0 10.0%
ECM 11 Steam trap monitoring, temperature sensors for failure of traps / replacement of traps 2,312,772 9,628,315 17,519,493 208.5 $321,893 617,685 3% $12,045 4% $15,000 1.2 80.3%
ECM 12 CO2 demand based ventilation 2,012,800 9,325,000 16,192,674 192.7 $298,580 1,944,504 11% $35,358 11% $105,000 3.0 33.7%
ECM 13 Low flow plumbing fixtures 2,312,771 10,222,000 18,113,175 215.6 $333,470 24,003 0% $468 0% $8,000 17.1 5.9%
ECM 14 Exterior lighting control 2,290,988 10,246,000 18,062,851 215.0 $332,674 74,327 0% $1,263 0% $12,000 9.5 10.5%
ECM 15 Egress lighting controls 2,307,617 10,246,000 18,119,589 215.7 $333,639 17,589 0% $299 0% $25,000 83.6 1.2%
ECM 16 Pumping energy savings with VFD and two way valves for HW & CHW 2,134,144 10,268,000 17,549,699 208.9 $324,006 587,479 3% $9,931 3% $51,000 5.1 19.5%
ECM 17 Insulate CHW, HW, steam and condensate piping where missing 2,235,768 10,219,478 17,847,918 212.4 $328,954 289,260 2% $4,983 1% $36,200 7.3 13.8%
ECM 18 Replace motors with premium efficient motors 2,130,147 10,261,000 17,529,062 208.6 $323,638 608,117 3% $10,300 3% $36,000 3.5 28.6%
ECM 19 Lighting upgrade for classrooms and offices 2,131,080 10,246,000 17,517,245 208.5 $323,400 619,933 3% $10,538 3% $123,600 11.7 8.5%
1,075,296 4,763,756 8,432,665 100.4 $158,709 9,704,513 54% $175,229 52% 1,878,900 10.7 9.3%
Electricity
Usage
(KWH)
Steam
Usage
(KBTU)
Total
Energy
Usage
(KBTU)
Energy Use
Index
(KBTU/SF) TOTAL ($)
PAE
Estimated
Incrementa
l Cost
Simple
Payback
(years)
ROI
(%)
Energy
Savings
(KBTU)
Energy
Savings
(%)
Energy
Savings
($)
Energy
Cost
Savings
(%)
Baseline Building
Interactive Total of ECMs
ANNUAL SAVINGS
Preliminary Energy Conservation Measure Analysis
Oregon State University - Peavy Hall
Measure
# ECM / Model Description
Table 16: Energy and Payback Results for ECM Analysis for Peavy Hall
January 25, 2012 OSU Richardson and Peavy Hall Energy Study: Energy Conservation Measure Analysis {Revised April 30, 2012}
11-1077 │47 | 47
13.0 EVALUATION PLAN
Once the building energy efficiency measures are completed it is suggested that a
measurement and verification plan be developed and implemented to observe the new
performance of the building and ensure new installed systems are operating as
expected.
The objective of the M&V plan is to provide the owner with valuable feedback on the
operation of the building systems. As commissioning is important in tuning the
building systems to operate correctly after installation, similarly, the M&V plan will
provide continual feedback of the building performance over time which allows the
owner the ability to view the benefit of the various energy conservation measures
incorporated into the building design as well as the opportunity to address energy
inefficiencies. Electricity use of major building components should be metered and
logged into a readily accessible on-site computer. Making hourly, daily, weekly, and
monthly data trends available will better inform the owner of required maintenance,
repair or replacement of building components.
Once the building has been fully occupied and completes a minimum of one year of
stable and optimized operation variables will be documented and incorporated into the
design and baseline building energy models. The energy analyst will compare the
revised baseline and design energy models to one another and generate a report
summarizing the results, including but not limited to whole building performance and
performance of specific energy conservation measures.
Weather for the period of observation must be considered and factors developed to
normalize the energy bills to account for any weather patterns differentiating from the
30-year norm for that location.
January 25, 2012 OSU Richardson and Peavy Hall Energy Study: Energy Conservation Measure Analysis {Revised April 30, 2012}
11-1077 │I | 1
APPENDIX
JUNE 24, 2012 MEETING NOTES
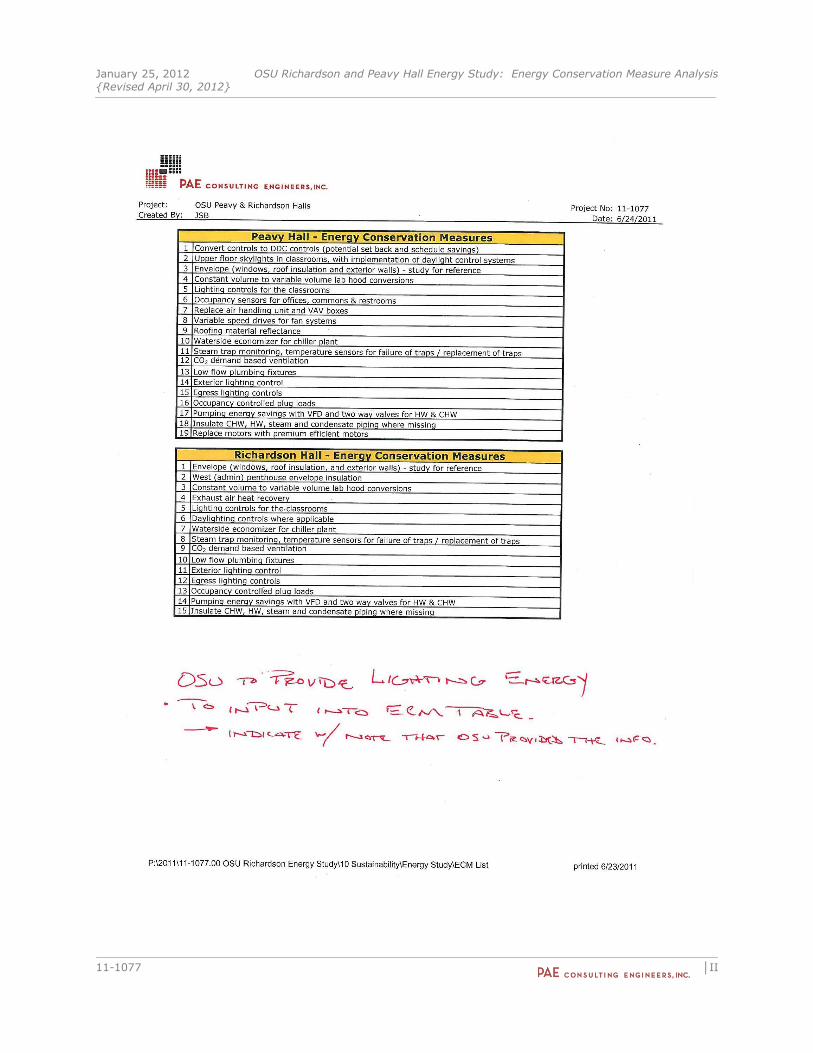
January 25, 2012 OSU Richardson and Peavy Hall Energy Study: Energy Conservation Measure Analysis {Revised April 30, 2012}
11-1077 │II | 2
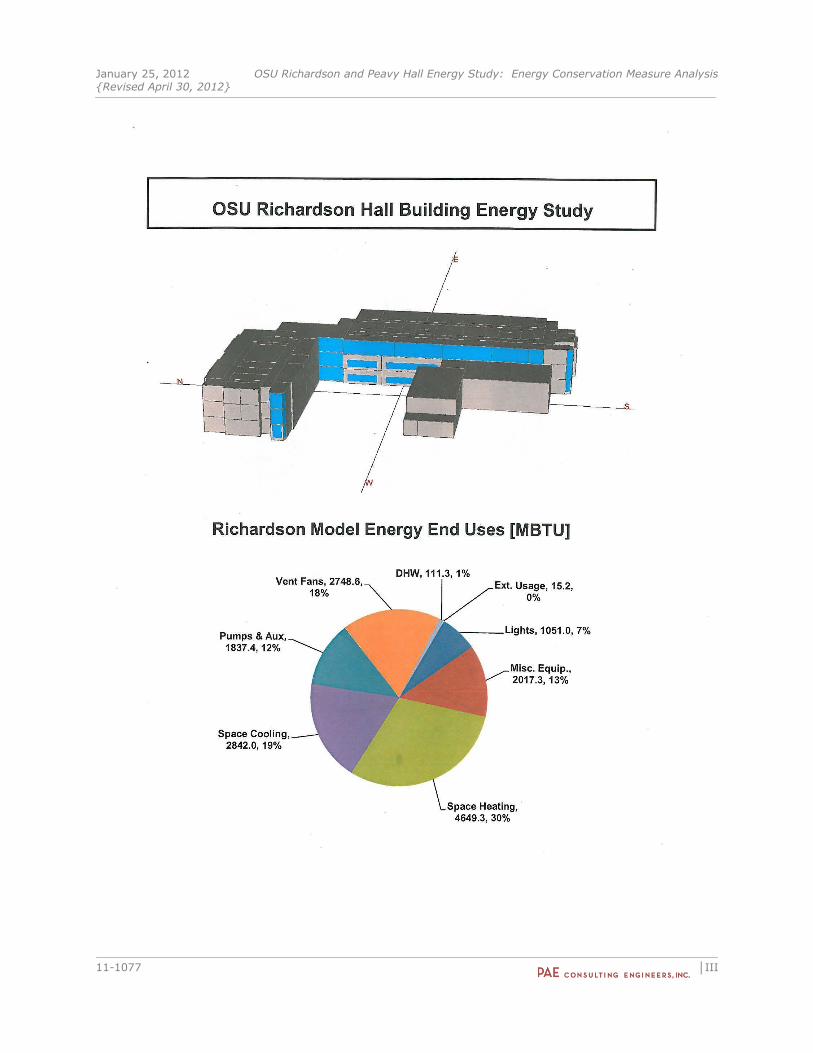
January 25, 2012 OSU Richardson and Peavy Hall Energy Study: Energy Conservation Measure Analysis {Revised April 30, 2012}
11-1077 │III | 3
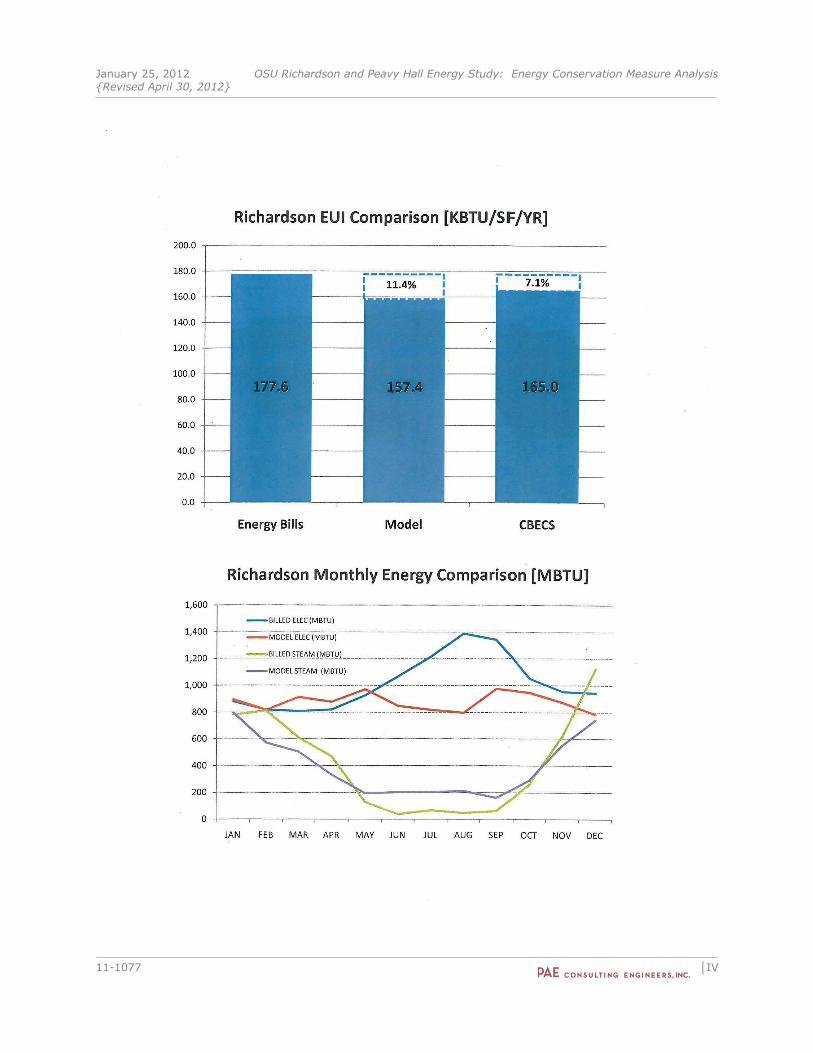
January 25, 2012 OSU Richardson and Peavy Hall Energy Study: Energy Conservation Measure Analysis {Revised April 30, 2012}
11-1077 │IV | 4
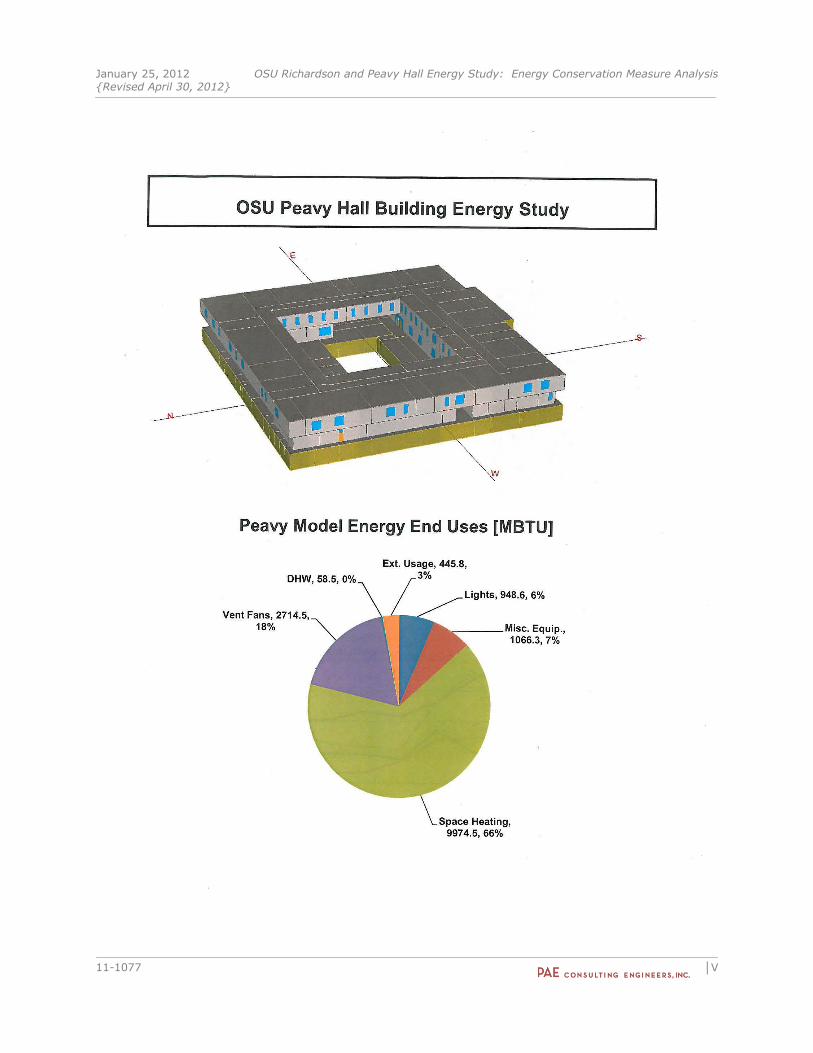
January 25, 2012 OSU Richardson and Peavy Hall Energy Study: Energy Conservation Measure Analysis {Revised April 30, 2012}
11-1077 │V | 5
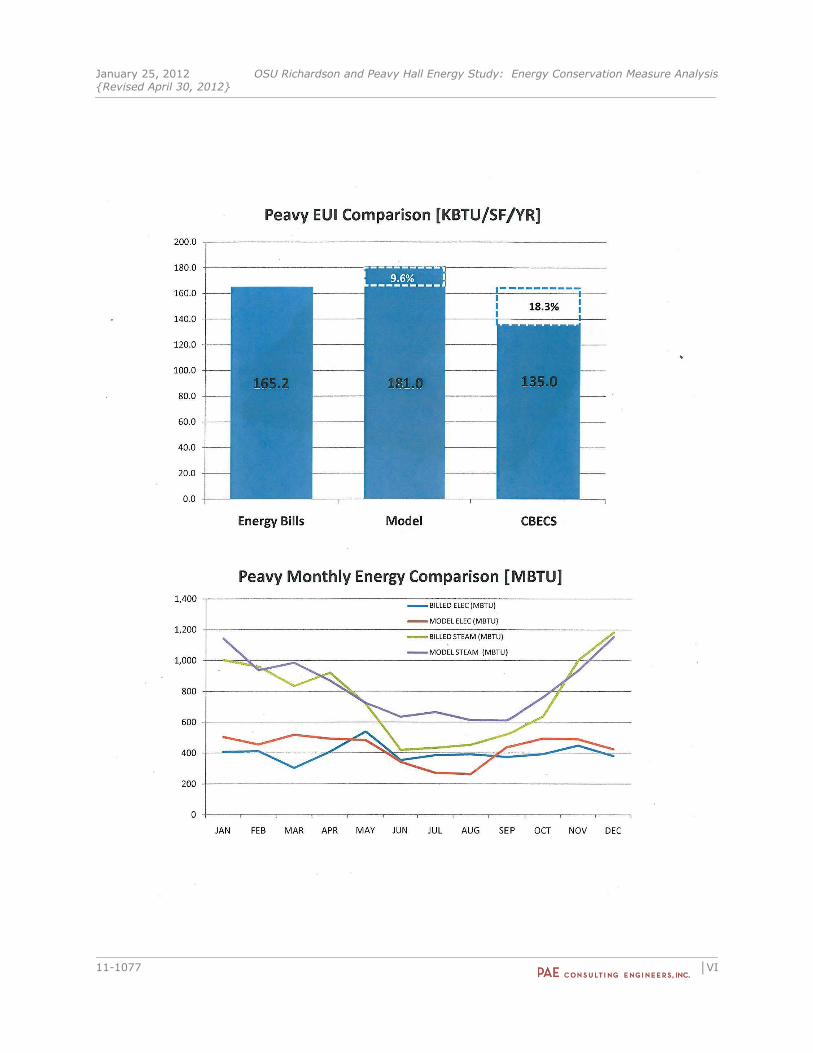
January 25, 2012 OSU Richardson and Peavy Hall Energy Study: Energy Conservation Measure Analysis {Revised April 30, 2012}
11-1077 │VI | 6
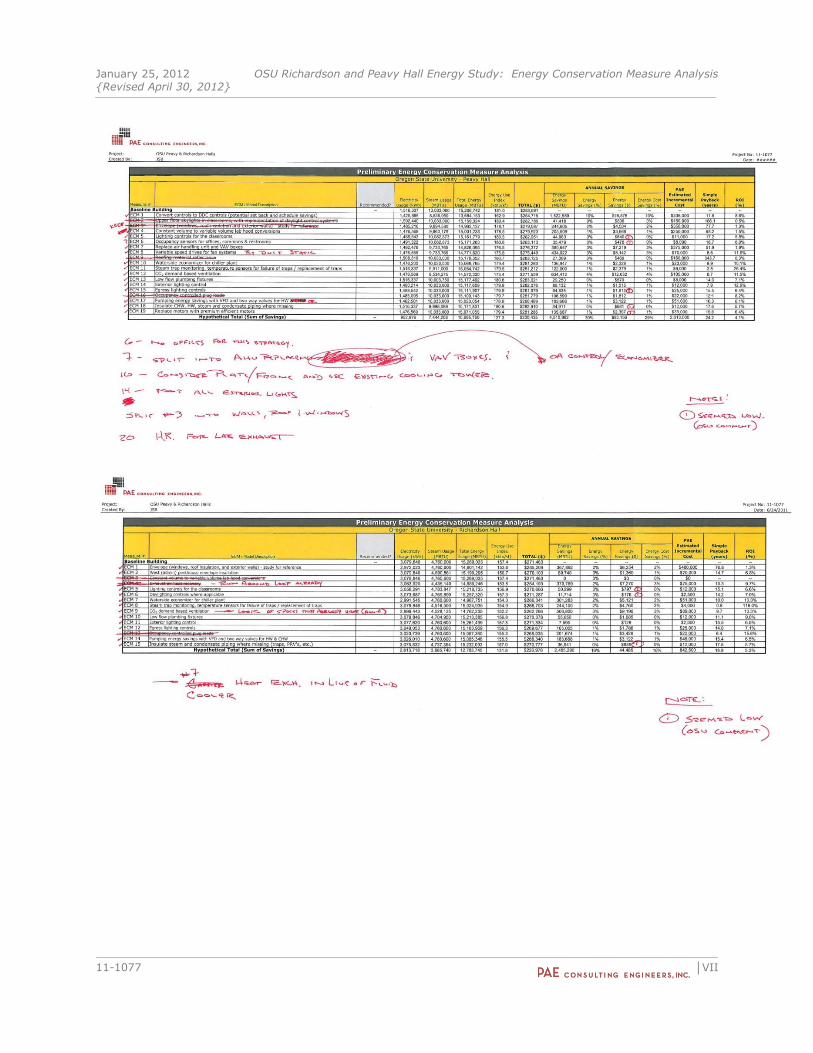
January 25, 2012 OSU Richardson and Peavy Hall Energy Study: Energy Conservation Measure Analysis {Revised April 30, 2012}
11-1077 │VII | 7