other graphs mean,median, mode and range statistical questions box and whisker plots data...
TRANSCRIPT

Statistics EOG Review
Other GraphsMean,Median, Mode and Range
Statistical Questions
Box and Whisker Plots
Data Distribution
10
20
30
40
50
40
30
20
10
50 50
40
30
20
10
50
40
30
20
10
50
40
30
20
10
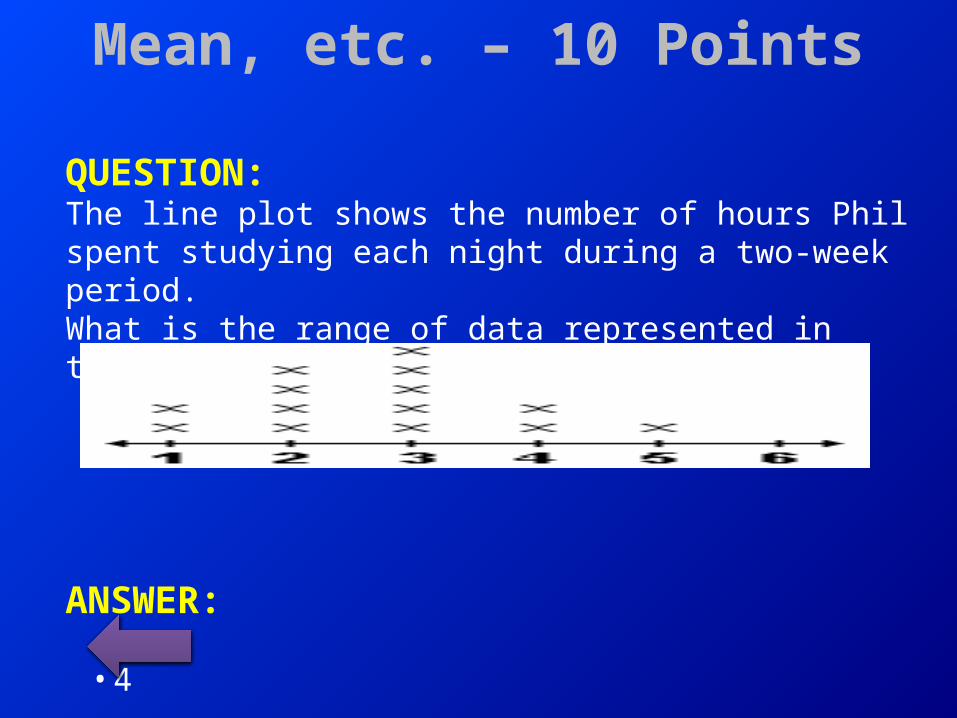
Mean, etc. – 10 Points
QUESTION:The line plot shows the number of hours Phil spent studying each night during a two-week period.What is the range of data represented in this line plot?
ANSWER:
• 4

Mean, etc– 20 Points
QUESTION:
The following is a set of scores on a math test: 68, 77, 93, 61, 84, 88, 76, 91, 80, 100, 89What is the median of the scores?
ANSWER: 84
Mean, etc– 30 Points
QUESTION:Susan has four 20-point projects for math class. Susan’s scores on the first 3 projects are shown below: Project 1: 18 Project 2: 15 Project 3: 16
Project 4: ?
What does she need to make on Project 4 so that the average for the four projects is 17?
ANSWER: 19
Mean, etc– 40 Points
QUESTION:• Trish is making money by walking dogs in her
neighborhood. She has set a goal of making an average of $50 per month. So far this year, her monthly totals have been $30, $25, $50, $20 and $65. How much money must she make next month to meet her goal?
ANSWER: $110
Mean, etc– 50 Points
QUESTION:•What number could you add to the following set of data to have a mean of 16? 12, 16, 18, 10, 14
ANSWER: 26

Statistical Questions– 10 Points
QUESTION:Which is the best example of a statistical question?A-What grade did Scott get on the last science test?B-What were the results for Ms. Gershon’s class on Monday’s science test?C-Did Penny take the science test on Monday?D-How long will it be before Ms. Gershon’s gives another science test?
ANSWER:
• B

Statistical Questions– 20 Points
QUESTION:Which statement most likely resulted from the use of statistics?
A-My height is 48 inches.B-25% of the students in my class are shorter than me.C-I think that no one in my class is taller than 54 inches.D-I have grown a lot in the last year.
ANSWER:• B

Statistical Questions– 30 Points
QUESTION:Which of the following is a statistical question?A-Is the temperature in this room 65 degrees?B-Is the temperature in this room more than 65 degrees?C-Has the temperature in this room been more than 65 degrees this month?D-When do you think that the temperature in this room will be greater than 65 degrees?ANSWER:
• C

Statistical Questions– 40 Points
QUESTION:
•Is this a statistical question?•What grade did Scott get on the last science test?
ANSWER:
•NO

Statistical Questions– 50 Points
QUESTION:
•What 2 components make up a good statistical question?
ANSWER:• Variability and name the population

Box and Whisker Plots– 10 Points
QUESTION:• Use the Box and Whisker plot below to find the IQR.
ANSWER:• 7
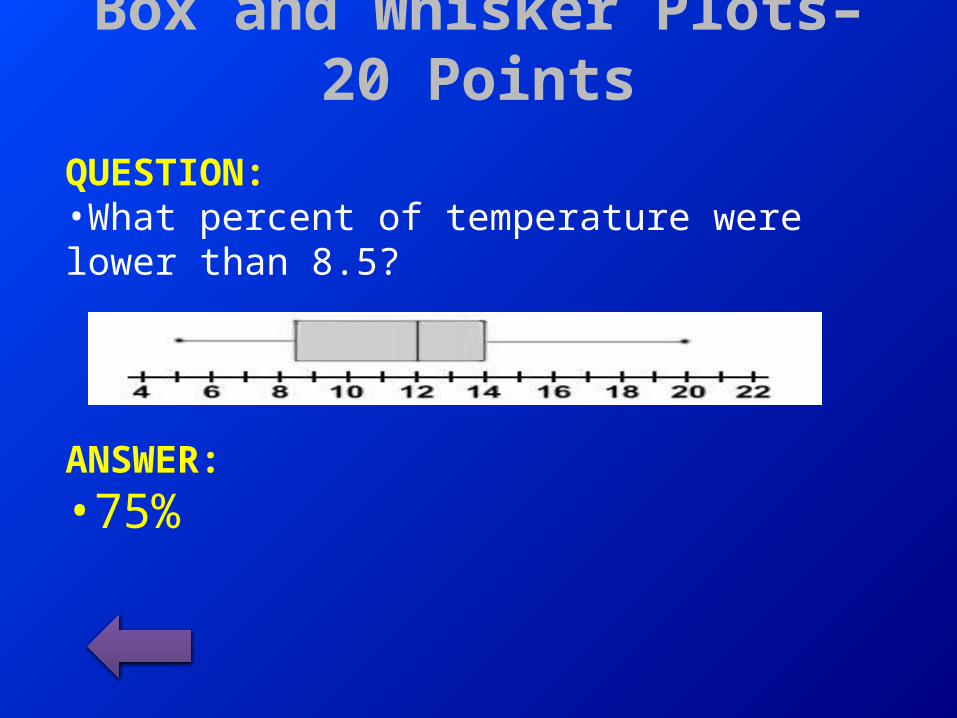
Box and Whisker Plots– 20 Points
QUESTION:•What percent of temperature were lower than 8.5?
ANSWER:•75%
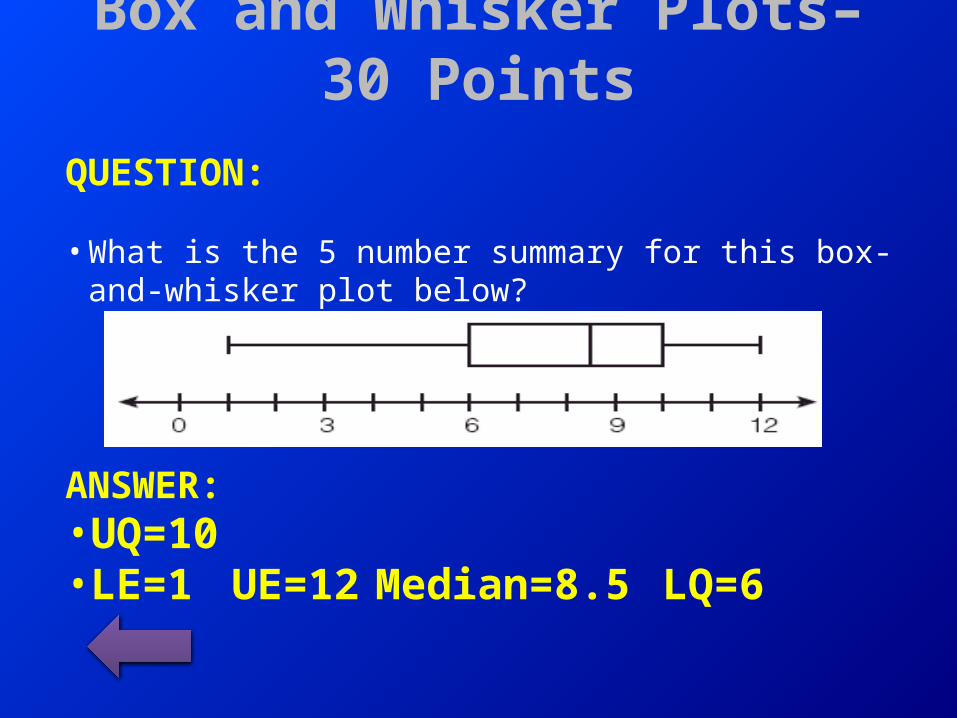
Box and Whisker Plots– 30 Points
QUESTION:
• What is the 5 number summary for this box-and-whisker plot below?
ANSWER:• UQ=10• LE=1 UE=12 Median=8.5 LQ=6

Box and Whisker Plots– 40 Points
QUESTION:• What does the box and whisker plot look like
for the following data?
ANSWER:
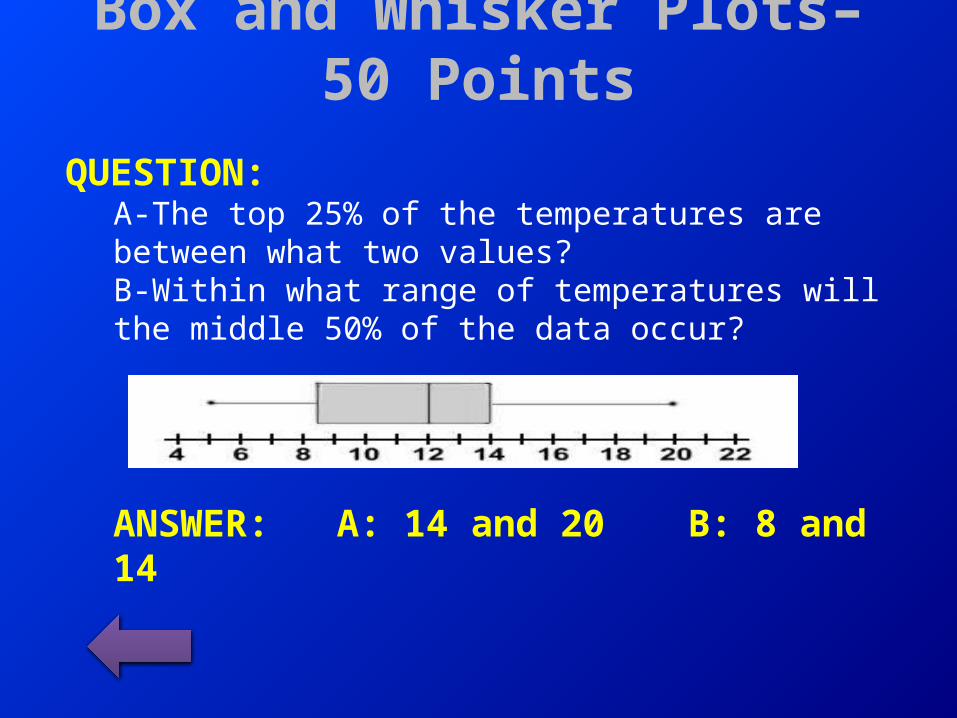
Box and Whisker Plots– 50 Points
QUESTION:A-The top 25% of the temperatures are between what two values? B-Within what range of temperatures will the middle 50% of the data occur?
ANSWER: A: 14 and 20 B: 8 and 14
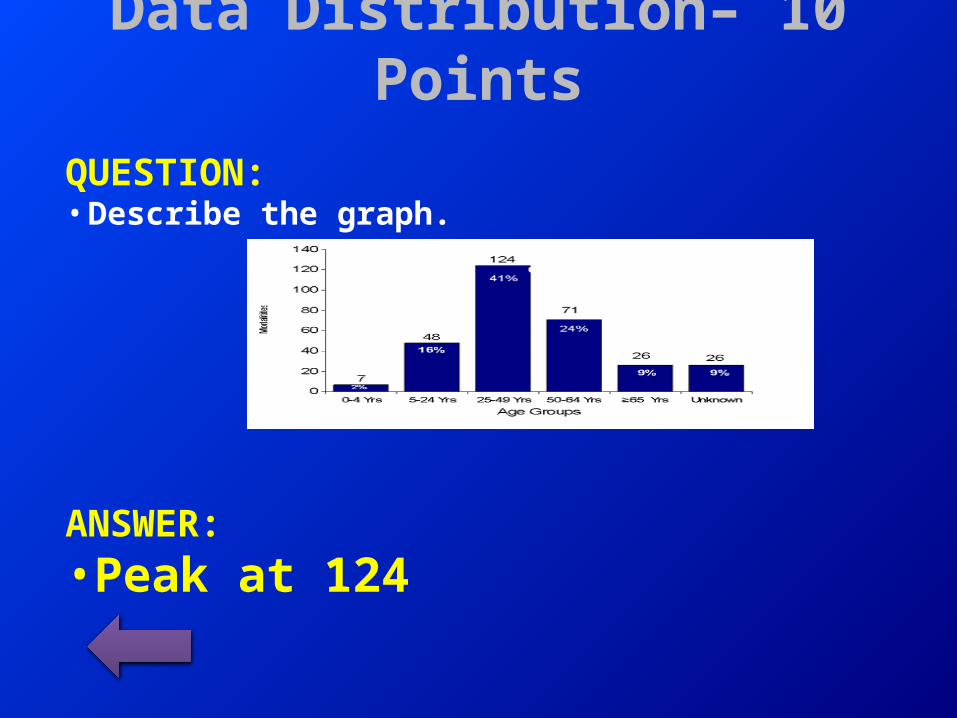
Data Distribution– 10 Points
QUESTION:• Describe the graph.
ANSWER:•Peak at 124
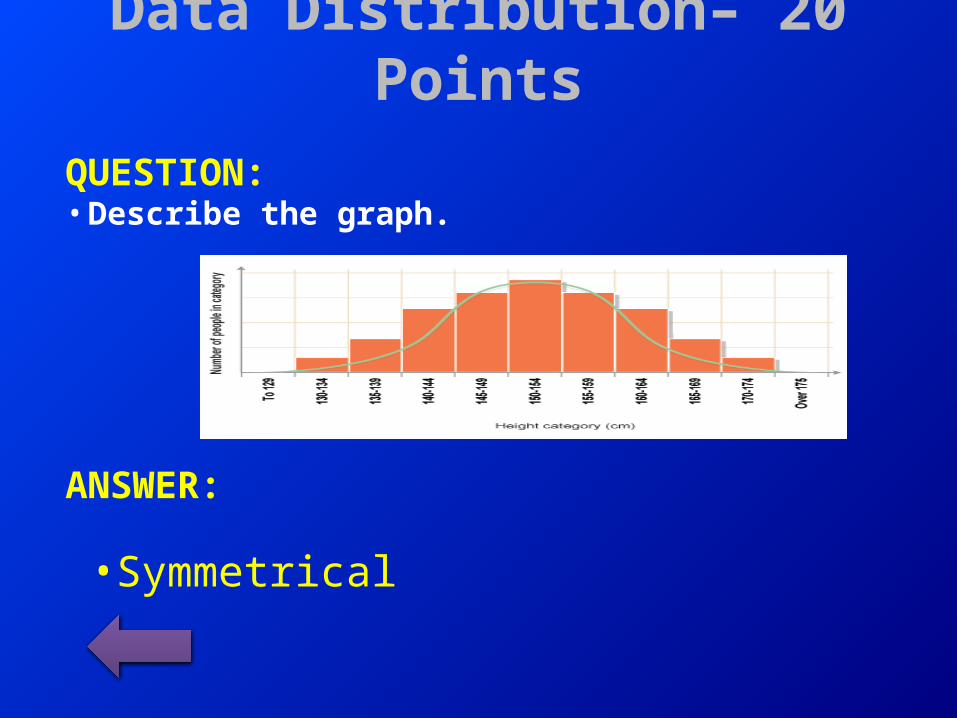
Data Distribution– 20 Points
QUESTION:• Describe the graph.
ANSWER:
• Symmetrical
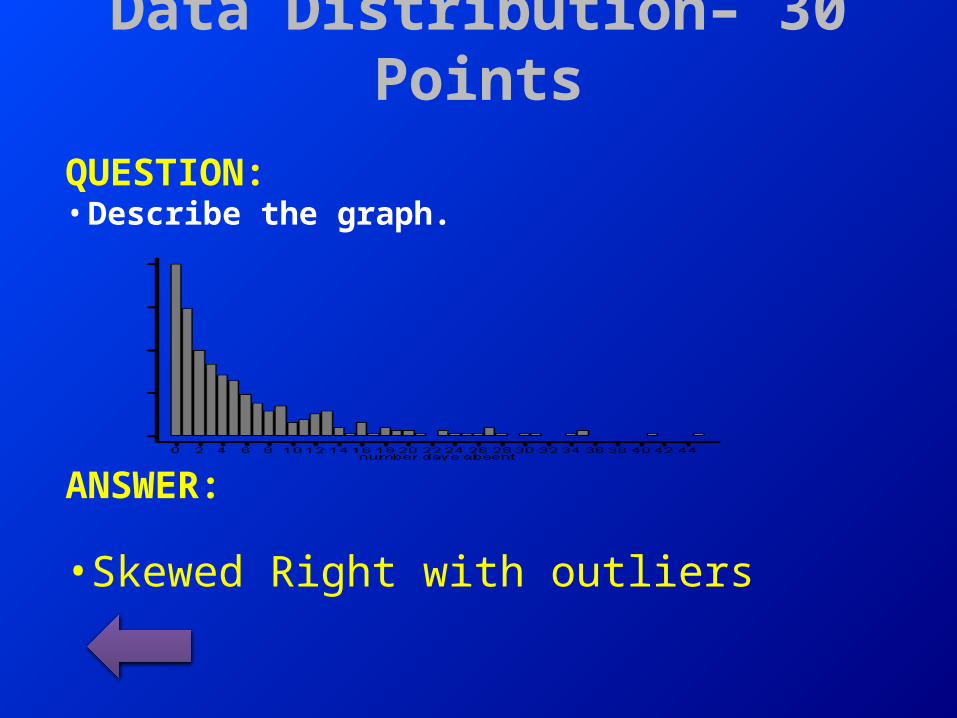
Data Distribution– 30 Points
QUESTION:• Describe the graph.
ANSWER:
• Skewed Right with outliers
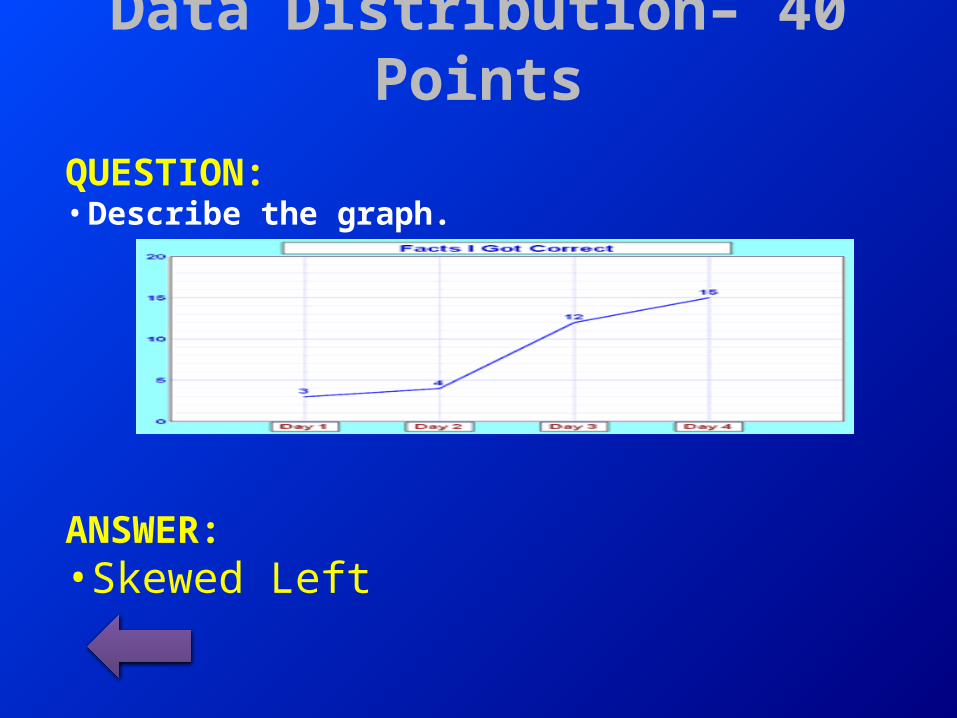
Data Distribution– 40 Points
QUESTION:• Describe the graph.
ANSWER:• Skewed Left
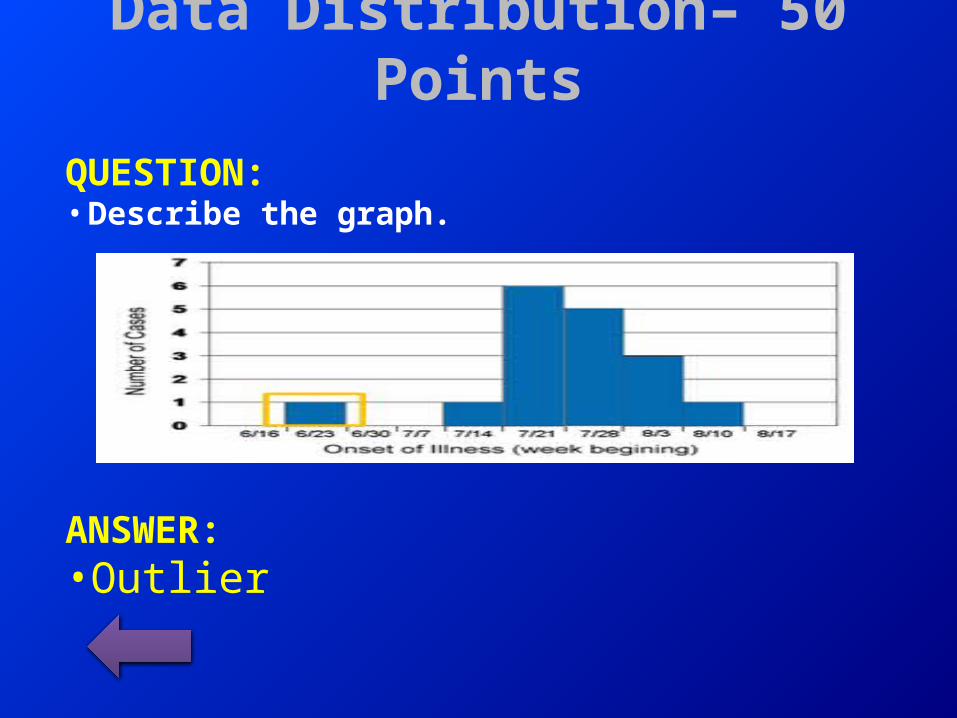
Data Distribution– 50 Points
QUESTION:• Describe the graph.
ANSWER:• Outlier

Other Graphs– 10 Points
QUESTION:• The line plot shows Amy’s scores on all of the
quizzes she took this year. If a score of 69 or lower is a failing grade, then how many quizzes did Amy fail?
ANSWER:
• 1 Quiz

Other Graphs– 20 Points
QUESTION:• What percent of the students scored 95 or above?
ANSWER:
• 20%
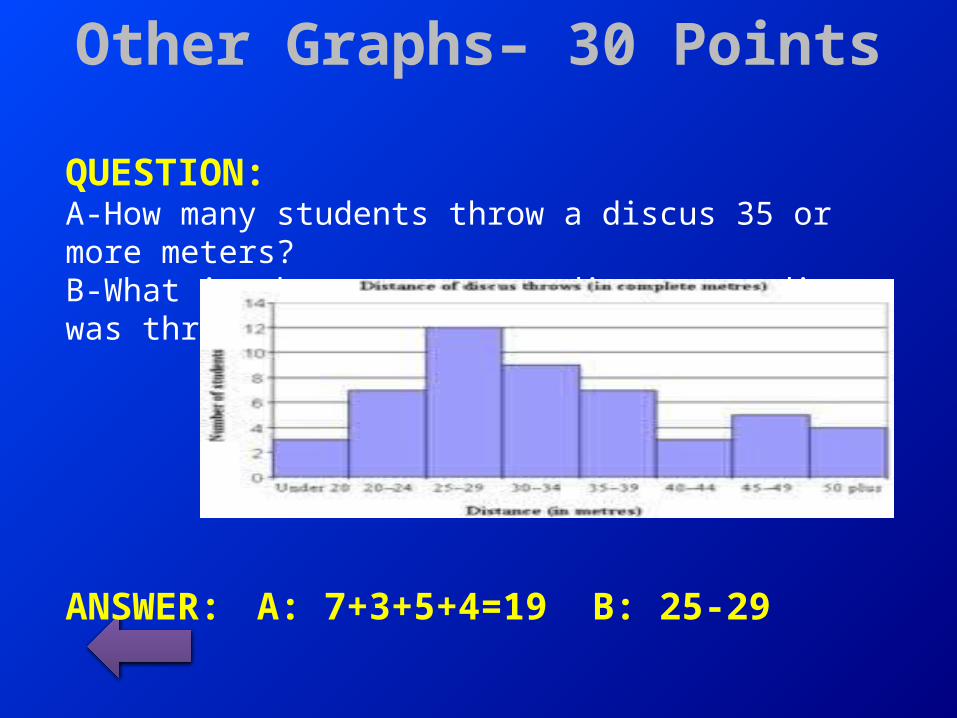
Other Graphs– 30 Points
QUESTION:A-How many students throw a discus 35 or more meters?B-What is the most common distance a discus was thrown?
ANSWER: A: 7+3+5+4=19 B: 25-29
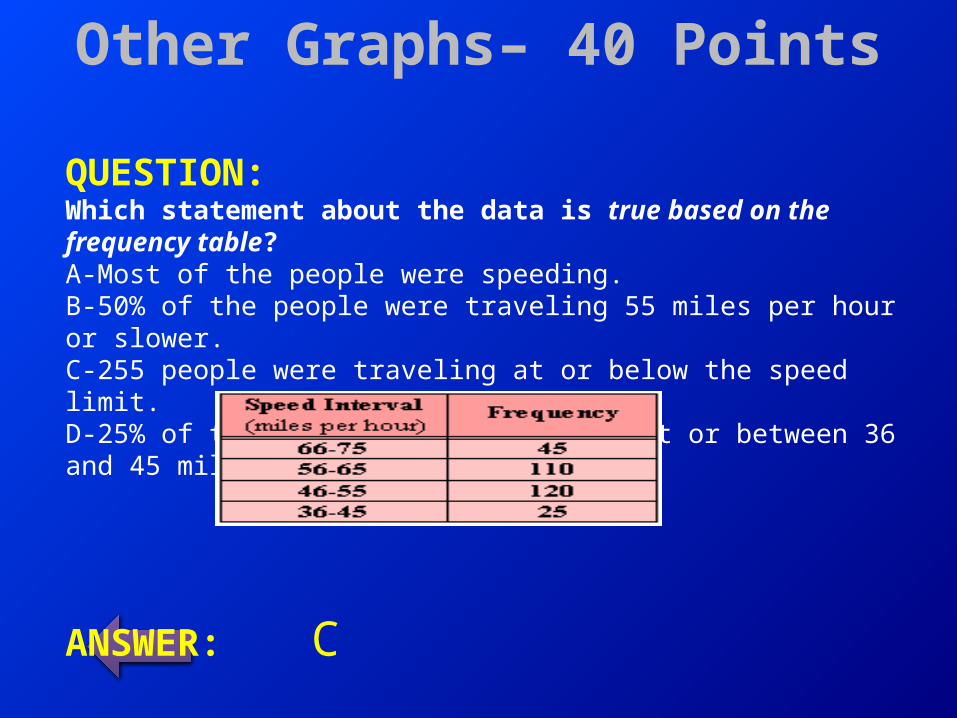
Other Graphs– 40 Points
QUESTION:Which statement about the data is true based on the frequency table?A-Most of the people were speeding.B-50% of the people were traveling 55 miles per hour or slower.C-255 people were traveling at or below the speed limit.D-25% of the people were travelling at or between 36 and 45 miles per hour.
ANSWER: C

Other Graphs– 50 PointsQUESTION:• A. What is the size of the intervals?• B. How many students scored 60 or below?
ANSWER:• A: 10 B: 3+1+1+3+2=10