otp group investor presentation based on 2q 2018 results · unique diversified access to the...
TRANSCRIPT
OTP Group
Investor presentation based on 2Q 2018 results
OTP Group has maintained strong profitability, capital adequacy and liquidity
2
Content
Investment Rationale 3-14
2Q 2018 Financial Performance of OTP Group 16-50
Macroeconomic overview 52-58
3
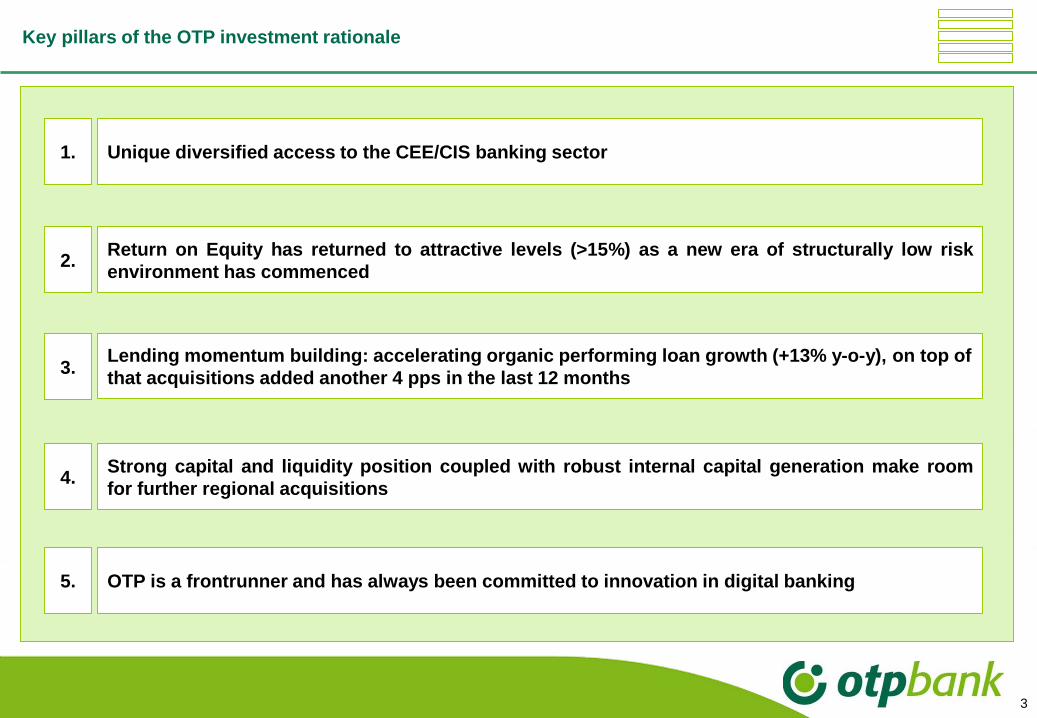
Key pillars of the OTP investment rationale
Unique diversified access to the CEE/CIS banking sector
Return on Equity has returned to attractive levels (>15%) as a new era of structurally low risk
environment has commenced
Lending momentum building: accelerating organic performing loan growth (+13% y-o-y), on top of
that acquisitions added another 4 pps in the last 12 months
Strong capital and liquidity position coupled with robust internal capital generation make room
for further regional acquisitions
OTP is a frontrunner and has always been committed to innovation in digital banking
1.
2.
3.
4.
5.
4
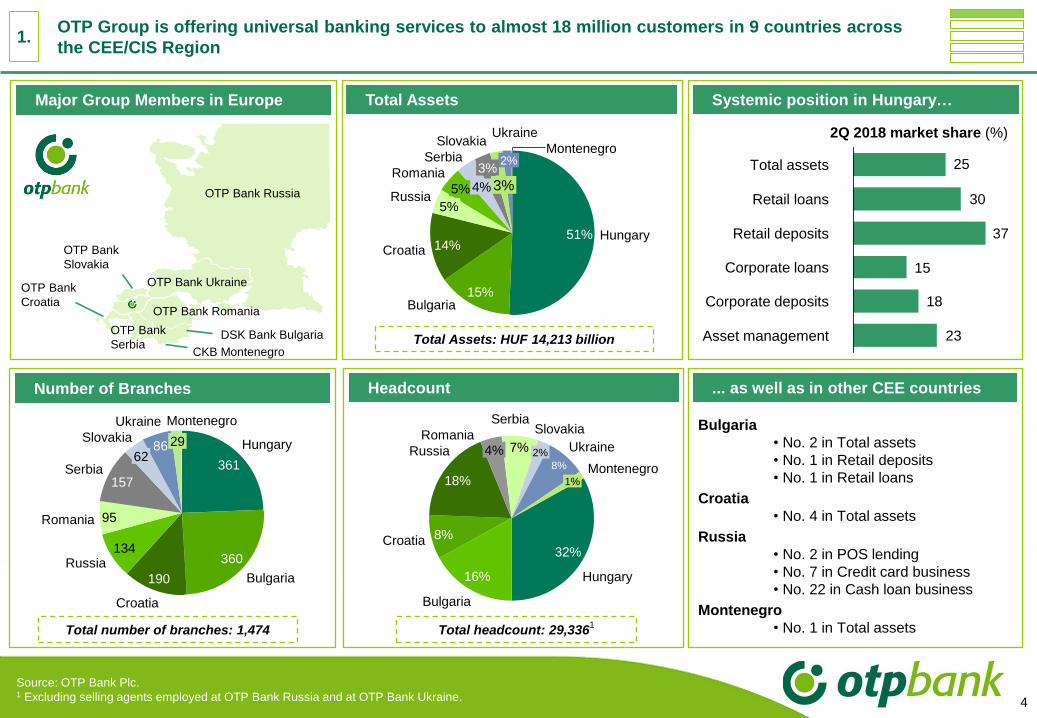
OTP Group is offering universal banking services to almost 18 million customers in 9 countries across
the CEE/CIS Region
Major Group Members in Europe
Number of Branches
Total Assets
Headcount
Total Assets: HUF 14,213 billion
OTP Bank
Slovakia
OTP Bank
Croatia
OTP Bank
SerbiaDSK Bank Bulgaria
OTP Bank Romania
OTP Bank Ukraine
CKB Montenegro
OTP Bank Russia
Source: OTP Bank Plc.1 Excluding selling agents employed at OTP Bank Russia and at OTP Bank Ukraine.
Systemic position in Hungary…
... as well as in other CEE countries
23
18
15
37
30
25Total assets
Retail loans
Retail deposits
Corporate deposits
Corporate loans
Asset management
2Q 2018 market share (%)
Croatia
361
Hungary
190
360
95
157
Russia134
Bulgaria
Romania
Serbia62
Slovakia
Montenegro
86 29
Ukraine
Total number of branches: 1,474
32%
16%
8%
18%
7%
8%
4% 2%
Hungary
Bulgaria
Russia
Croatia
1%
Romania
SerbiaSlovakia
Montenegro
Ukraine
Total headcount: 29,3361
5%
51%
2%
Hungary
15%
5%
Croatia
Bulgaria
14%
Russia
Romania
Ukraine
4%
Serbia3%
Slovakia
3%
Montenegro
Bulgaria
• No. 2 in Total assets
• No. 1 in Retail deposits
• No. 1 in Retail loans
Croatia
• No. 4 in Total assets
Russia
• No. 2 in POS lending
• No. 7 in Credit card business
• No. 22 in Cash loan business
Montenegro
• No. 1 in Total assets
1.
5
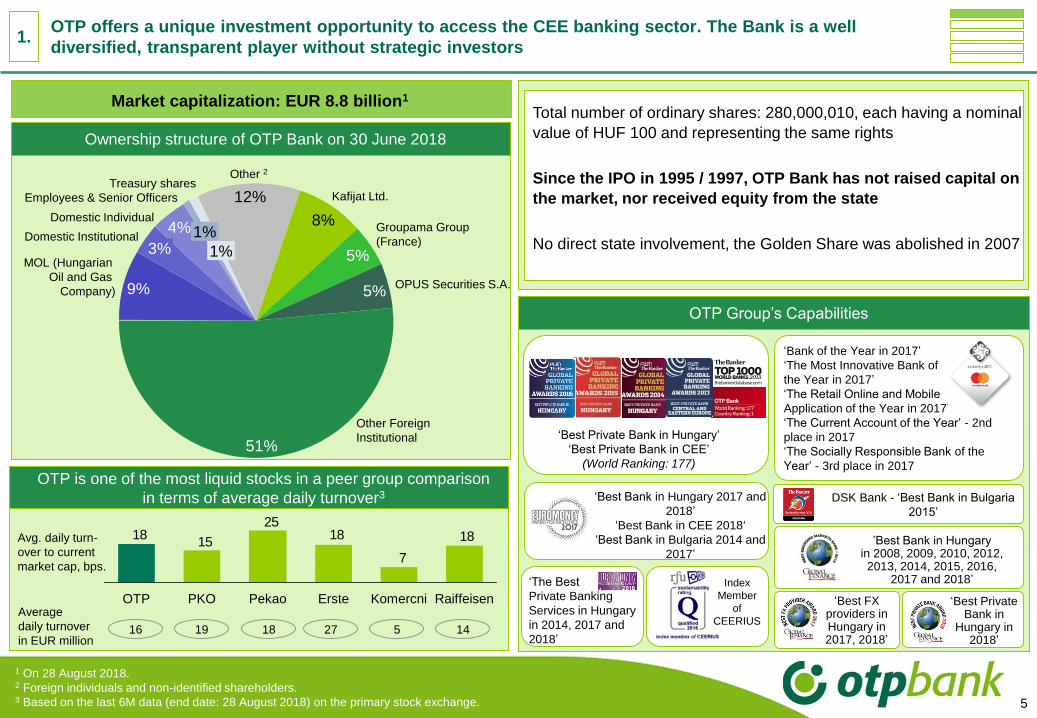
OTP offers a unique investment opportunity to access the CEE banking sector. The Bank is a well
diversified, transparent player without strategic investors
OTP Group’s Capabilities
‘Best Private Bank in Hungary’
‘Best Private Bank in CEE’
(World Ranking: 177)
‘Bank of the Year in 2017’
‘The Most Innovative Bank of
the Year in 2017’
‘The Retail Online and Mobile
Application of the Year in 2017’
‘The Current Account of the Year’ - 2nd
place in 2017
‘The Socially Responsible Bank of the
Year’ - 3rd place in 2017
OTP is one of the most liquid stocks in a peer group comparison
in terms of average daily turnover3
18
7
1825
1518
RaiffeisenKomercniErstePekaoPKOOTP
Avg. daily turn-
over to current
market cap, bps.
16 19 18 27 5 14
Average
daily turnover
in EUR million
’Best Bank in Hungary in 2008, 2009, 2010, 2012,2013, 2014, 2015, 2016,
2017 and 2018’Index
Member
of
CEERIUS
‘Best Bank in Hungary 2017 and
2018’
‘Best Bank in CEE 2018‘
‘Best Bank in Bulgaria 2014 and
2017’
DSK Bank - ‘Best Bank in Bulgaria
2015’
‘Best FX providers inHungary in2017, 2018’
‘The Best
Private Banking
Services in Hungary
in 2014, 2017 and
2018’
1.
‘Best PrivateBank in
Hungary in2018’
Total number of ordinary shares: 280,000,010, each having a nominal
value of HUF 100 and representing the same rights
Since the IPO in 1995 / 1997, OTP Bank has not raised capital on
the market, nor received equity from the state
No direct state involvement, the Golden Share was abolished in 2007
(Q-o-Q change)Ownership structure of OTP Bank on 30 June 2018
Other 2
Domestic Institutional
8%
3%MOL (Hungarian
Oil and Gas
Company)
1%
51%
Treasury shares
Domestic Individual
OPUS Securities S.A.5%
12%Employees & Senior Officers
1%4% Groupama Group
(France)
5%
9%
Kafijat Ltd.
Other Foreign
Institutional
Market capitalization: EUR 8.8 billion1
1 On 28 August 2018.2 Foreign individuals and non-identified shareholders.3 Based on the last 6M data (end date: 28 August 2018) on the primary stock exchange.
6
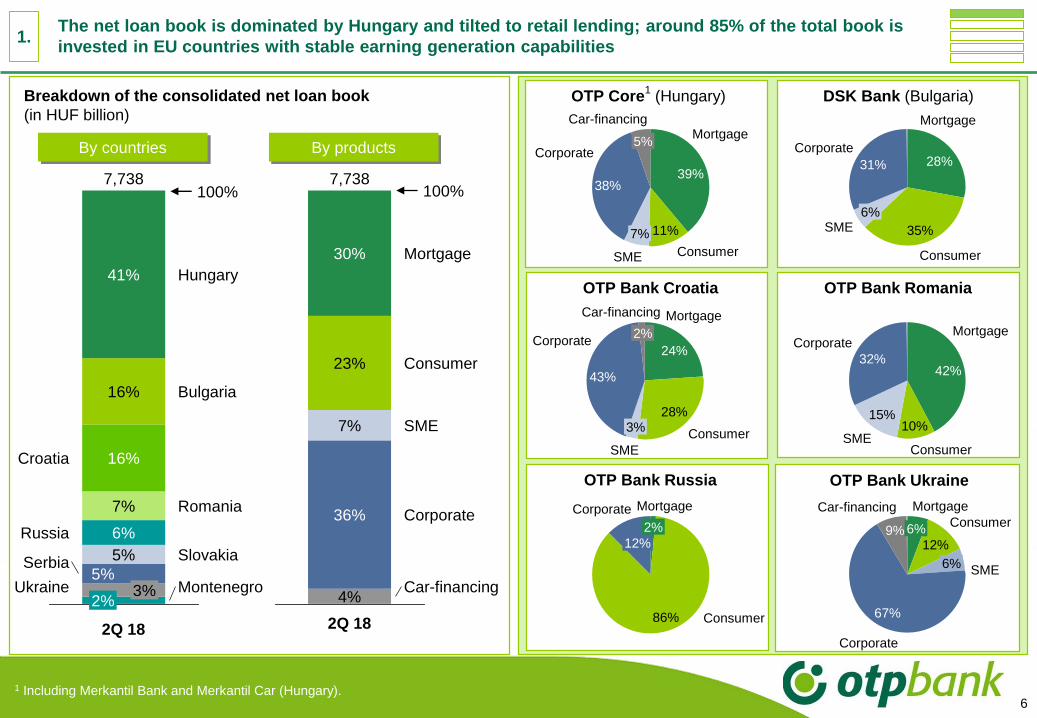
The net loan book is dominated by Hungary and tilted to retail lending; around 85% of the total book is
invested in EU countries with stable earning generation capabilities
Mortgage
Car-financing
Corporate
100%
SME
Consumer
7,738
23%
30%
36%
4%
2Q 18
7%
Breakdown of the consolidated net loan book
(in HUF billion)
7,738
Bulgaria
Romania
Slovakia
3%5%
7%
6%
16%
100%
2Q 18
Croatia
16%
MontenegroUkraine
Serbia
Russia
Hungary
5%
2%
41%
By countries By products
38%
SME
7%
Consumer
11%
Mortgage
39%
Car-financing
5%Corporate
OTP Core1
(Hungary)
OTP Bank RomaniaOTP Bank Croatia
DSK Bank (Bulgaria)
Mortgage
Corporate
31%
SME6%
Consumer
35%
28%
SME
15%
42%
Mortgage
32%
Corporate
Consumer
10%
1 Including Merkantil Bank and Merkantil Car (Hungary).
OTP Bank Russia OTP Bank Ukraine
6%9%Consumer
67%
Mortgage
6%SME
Corporate
12%
Car-financingMortgageCorporate
12%
Consumer86%
2%
Mortgage
43%
SME
2%
Consumer
Car-financing
3%28%
Corporate24%
1.
7
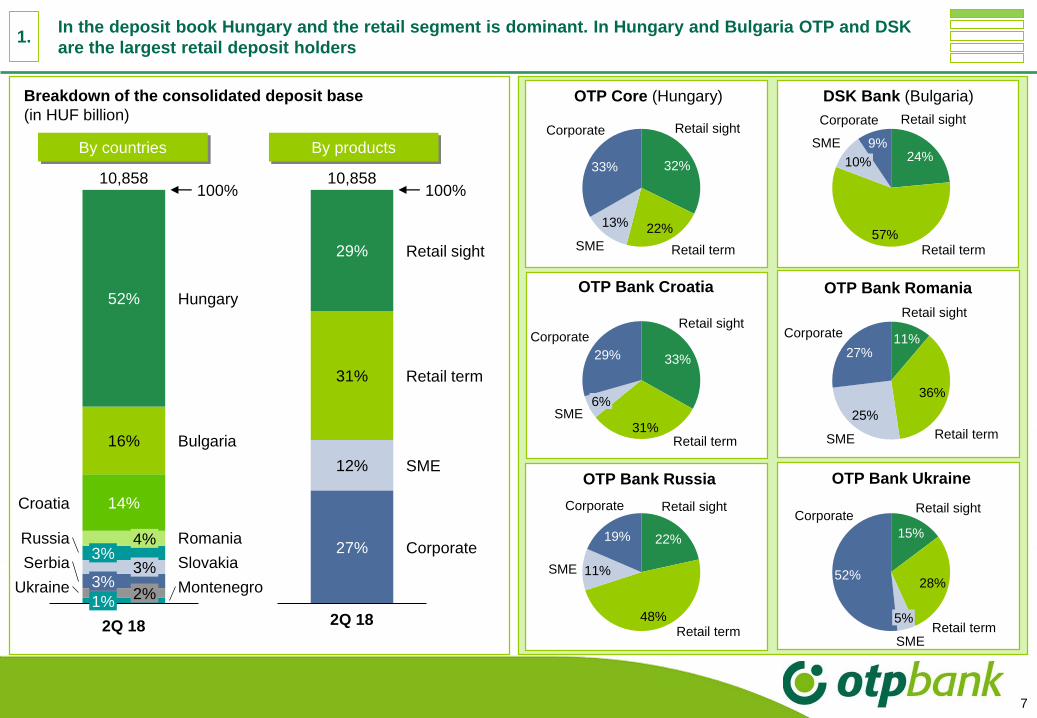
In the deposit book Hungary and the retail segment is dominant. In Hungary and Bulgaria OTP and DSK
are the largest retail deposit holders
Breakdown of the consolidated deposit base
(in HUF billion)
By countries By products
14%
16%
52%
3%
1%
4%
2%
3%3%
Hungary
2Q 18
Bulgaria
Croatia
RomaniaRussia
SlovakiaSerbia
100%
Ukraine Montenegro
10,858
27%
12%
31%
29%
10,858100%
Retail term
2Q 18
Retail sight
SME
Corporate
32%
22%13%
33%
Retail term
Retail sight
SME
Corporate
OTP Core (Hungary)
OTP Bank Ukraine
DSK Bank (Bulgaria)
24%
57%
9%
Retail sight
Retail term
10%
SME
Corporate
15%
28%52%
CorporateRetail sight
Retail term5%
SME
OTP Bank Russia
OTP Bank Croatia
11%
36%
25%
27%
Retail sight
SME Retail term
Corporate
22%
48%
11%
19%
Retail sightCorporate
Retail term
SME
33%
31%
29%
SME
Retail sight
Retail term
Corporate
6%
OTP Bank Romania
1.
16.212.3
-12.2
1.64.3
-1.5
0.5
15.616.6
2.2
-1.7
2.8 1.4 1.7 1.4 0.8 1.0 0.9 1.4 1.7 1.9 2.0
0.6 0.4 0.9 0.6 0.6 0.7 0.7 0.8 1.3 1.5 1.6
8
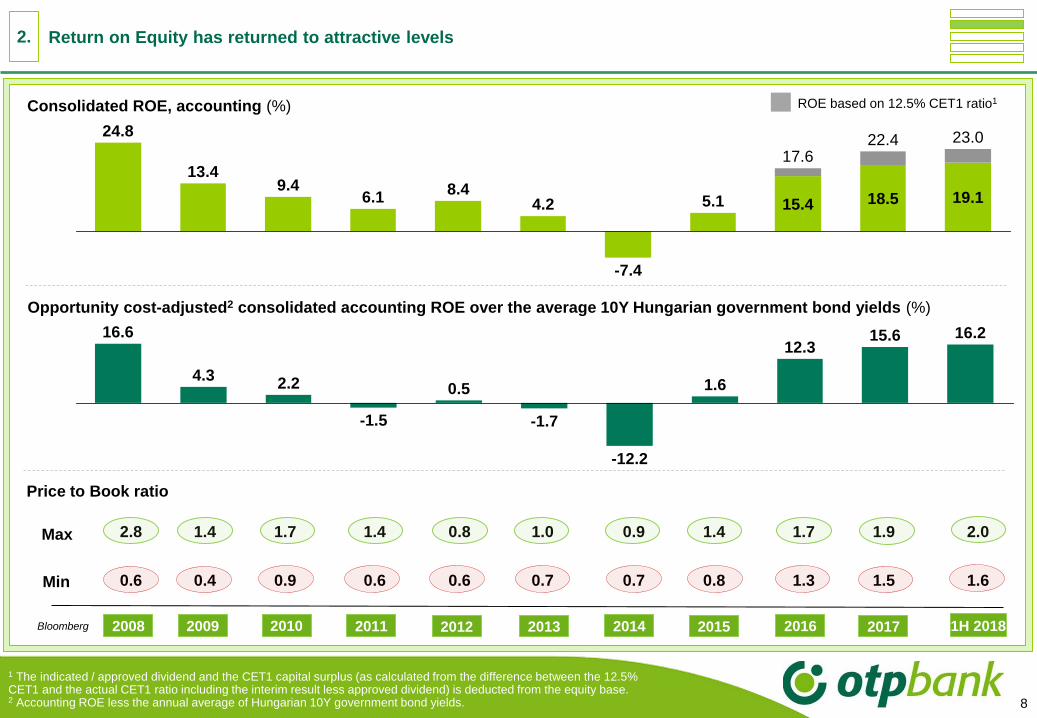
Return on Equity has returned to attractive levels
18.5 19.1
13.4
23.0
15.4
17.6
5.19.4 8.4
22.4
-7.4
4.26.1
24.8
Consolidated ROE, accounting (%)
Opportunity cost-adjusted2 consolidated accounting ROE over the average 10Y Hungarian government bond yields (%)
1 The indicated / approved dividend and the CET1 capital surplus (as calculated from the difference between the 12.5% CET1 and the actual CET1 ratio including the interim result less approved dividend) is deducted from the equity base.2 Accounting ROE less the annual average of Hungarian 10Y government bond yields.
2010 2011 2012 2013 20152014 201620092008
Price to Book ratio
Bloomberg
Max
Min
ROE based on 12.5% CET1 ratio1
2017
2.
1H 2018

9
The accounting ROE has been growing steadily since 2015 on the back of moderating provision charges
and vanishing negative adjustment items; the total revenue margin has been relatively resilient
Accounting ROE
Adjusted ROE2
Total Revenue
Margin3
Net Interest Margin3
Operating Costs /
Average Assets
Risk Cost Rate
Leverage (average
equity / avg. assets)
2010 2011 2012 2013 2014 20162015 2017
9.4% 6.1% 8.4% 4.2% -7.4% 5.1% 15.4% 18.5%
13.0% 11.8% 10.2% 9.6% 8.5% 9.6% 15.4% 18.7%
8.03% 8.12% 8.31% 8.44% 7.74% 7.03% 6.79% 6.71%
6.16% 6.31% 6.40% 6.37% 5.96% 5.17% 4.82% 4.56%
3.62% 3.76% 3.89% 4.07% 3.85% 3.66% 3.70% 3.68%
3.69% 2.95% 3.11% 3.51% 3.68% 3.18% 1.14% 0.43%
12.8% 13.6% 14.4% 14.8% 13.0% 11.5% 12.9% 12.7%
…
1 The indicated / approved dividend and the CET1 capital surplus (as calculated from the difference between the 12.5%
CET1 and the actual CET1 ratio including the interim result less approved dividend) is deducted from the equity base.2 Calculated from the Group’s adjusted after tax result. 3 Excluding one-off revenue items.
Accounting ROE on
12.5% CET1 ratio1 17.6% 22.4%5.4%
2.
1H 2018
19.1%
21.0%
6.35%
4.31%
3.50%
0.02%
12.1%
23.0%
10
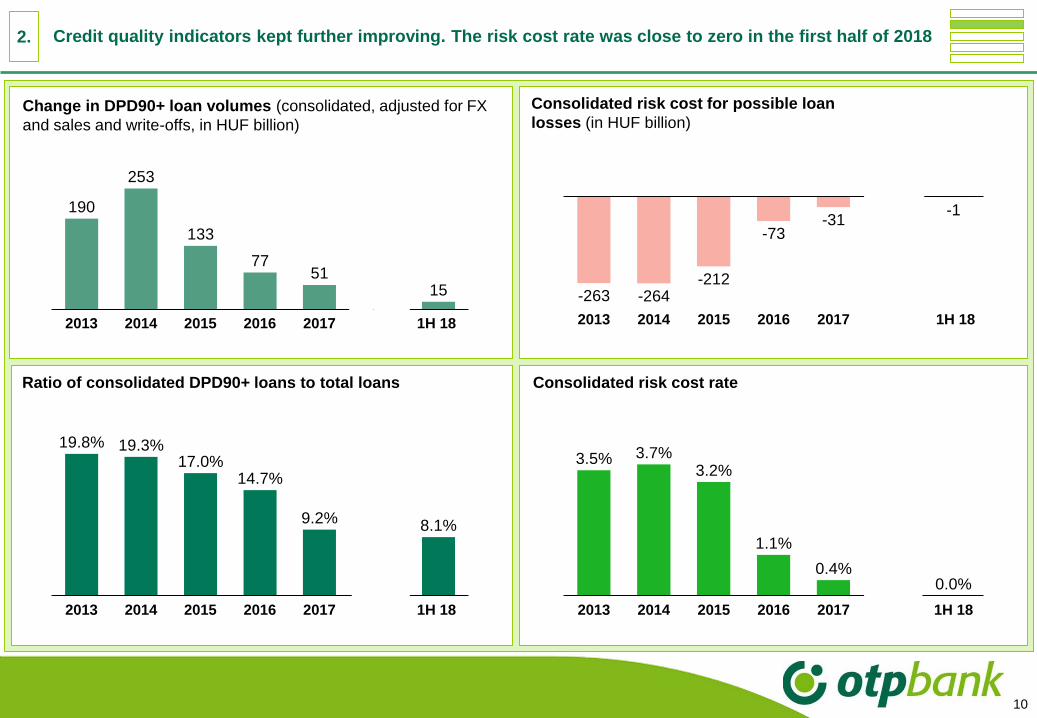
Change in DPD90+ loan volumes (consolidated, adjusted for FX
and sales and write-offs, in HUF billion)
Ratio of consolidated DPD90+ loans to total loans
Consolidated risk cost for possible loan
losses (in HUF billion)
Consolidated risk cost rate
19.8% 19.3%17.0%
14.7%
9.2% 8.1%
20162013 2014 2015 1H 182017
3.5% 3.7%3.2%
1.1%
0.4%0.0%
2014 20152013 1H 182016 2017
190
253
133
7751
15
20172013 2014 2015 1H 18 2016
-263 -264-212
-73-31
2013 1H 182014
-1
2015 2016 2017
Credit quality indicators kept further improving. The risk cost rate was close to zero in the first half of 20182.

11
In Hungary the retail loan penetration ratios halved since 2010 and returned to the levels before the lending
boom
Market penetration levels in Hungary in ...
housing loans
consumer loans (incl. home equities)
corporate loans
1 Latest available data. According to the supervisory balance sheet data provision.
8.18.012.4
15.115.2
8.8
14.512.3
10.311.28.3
11.1
16.2
14.7
7.211.6
14.110.4
8.4 7.37.9
12.915.115.5
10.88.5
17.3 16.8
22.1
17.020.8
29.0
18.0
27.327.924.1
29.528.426.9
2010 2011 2012 2013 20152014 20162009200820072006Net loan to deposit ratio
in the Hungarian credit
institution system1
30.4 Slovakia
20.4 Poland
Czech Republic
Romania
23.8
7.8
9.2 Slovakia
13.6 Poland
Czech RepublicRomania
6.86.5
20.7 Slovakia
22.2 PolandCzech Republic
Romania
21.9
12.0
168% 88%
1Q 181Q 09
(in % of GDP)
3.
2Q 2018
10.1 Bulgaria
11.3 Bulgaria
32.5 Bulgaria
2017

12
Following the contraction in the previous years, the last 2.5 years brought a spectacular turnaround in loan
volumes, while deposits have been growing steadily reflecting our clients' trust in the Bank
1 Consolidated: net loan volume between 2009-2013; OTP Core: estimation for 2009.
-5
5 5
-8 -3 -6 -5
10 8
3
6
2009 20132010 20142011 2012 2015 2016 2017 18 1H
25
Y-o-Y performing (DPD0-90) loan volume changes 1 (adjusted for FX-effect, %)
Consolidated OTP Core
8 11
-9 -12
-8 -12 -11
-1
-10
20142010 201720132009 20122011 2015
5
2016 18 1H
12
A teljesítő (DPD0-90) hitelállomány éves változása (árfolyamszűrten, %)Y-o-Y deposit volume changes (adjusted for FX-effect, %)
Consolidated OTP Core
3 8
5 11
5 6 1 2
7
2009
22
2010 2011
6
2012 20142013 2015 2016 2017 18 1H
7 4 10
9 2
13
5 3
-2
1 7
2014 20162009 2010 2011 2012 2013 2015 2017 18 1H
9
3.
Effect of acquisitions AXA-effect
AXA-effectEffect of acquisitions
YTD YTD
YTD YTD
13
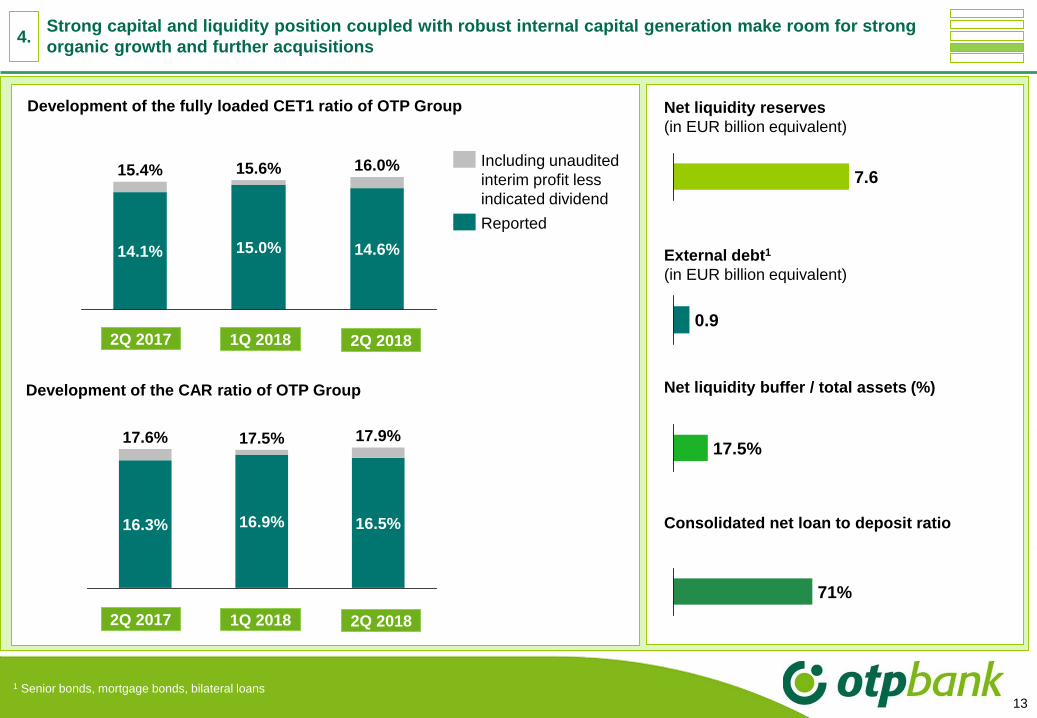
Development of the fully loaded CET1 ratio of OTP Group
1 Senior bonds, mortgage bonds, bilateral loans
Development of the CAR ratio of OTP Group Net liquidity buffer / total assets (%)
Consolidated net loan to deposit ratio
Net liquidity reserves
(in EUR billion equivalent)
External debt1
(in EUR billion equivalent)
1Q 20182Q 2017
7.6
0.9
17.5%
71%
15.6%
15.0%14.1% 14.6%
16.0%15.4%
2Q 2018
Reported
Including unaudited
interim profit less
indicated dividend
16.5%
17.9%17.5%
16.9%
17.6%
16.3%
1Q 20182Q 2017 2Q 2018
4.Strong capital and liquidity position coupled with robust internal capital generation make room for strong
organic growth and further acquisitions
14
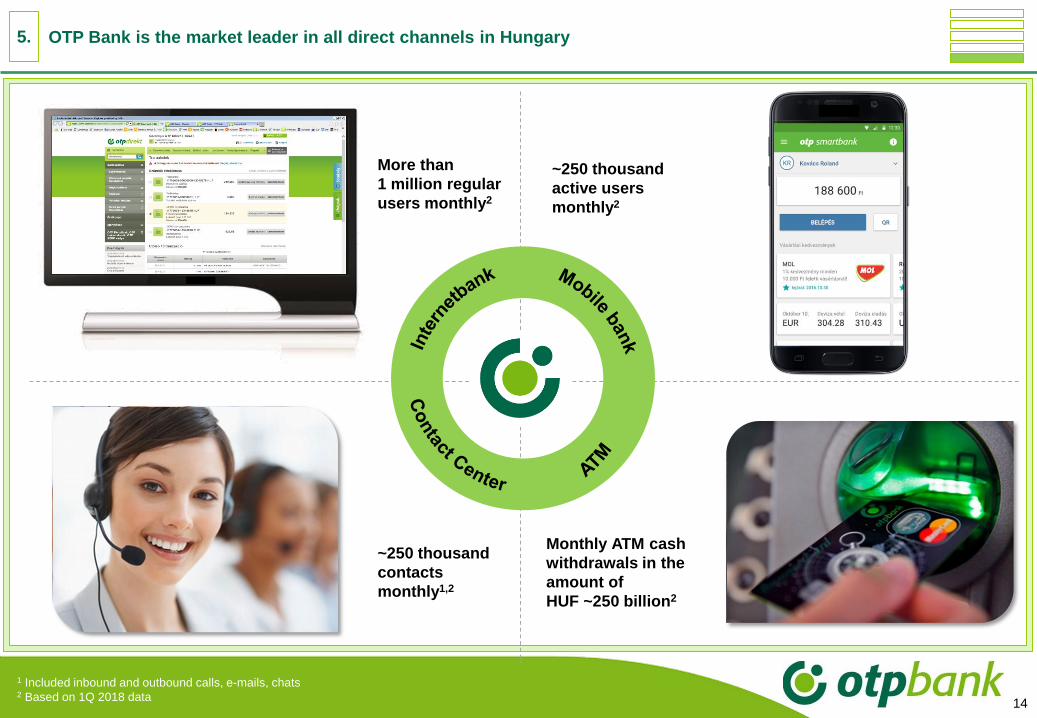
OTP Bank is the market leader in all direct channels in Hungary
1 Included inbound and outbound calls, e-mails, chats2 Based on 1Q 2018 data
More than
1 million regular
users monthly2
~250 thousand
contacts
monthly1,2
Monthly ATM cash
withdrawals in the
amount of
HUF ~250 billion2
~250 thousand
active users
monthly2
5.
15
Content
Investment Rationale 3-14
2Q 2018 Financial Performance of OTP Group 16-50
Macroeconomic overview 52-58
16
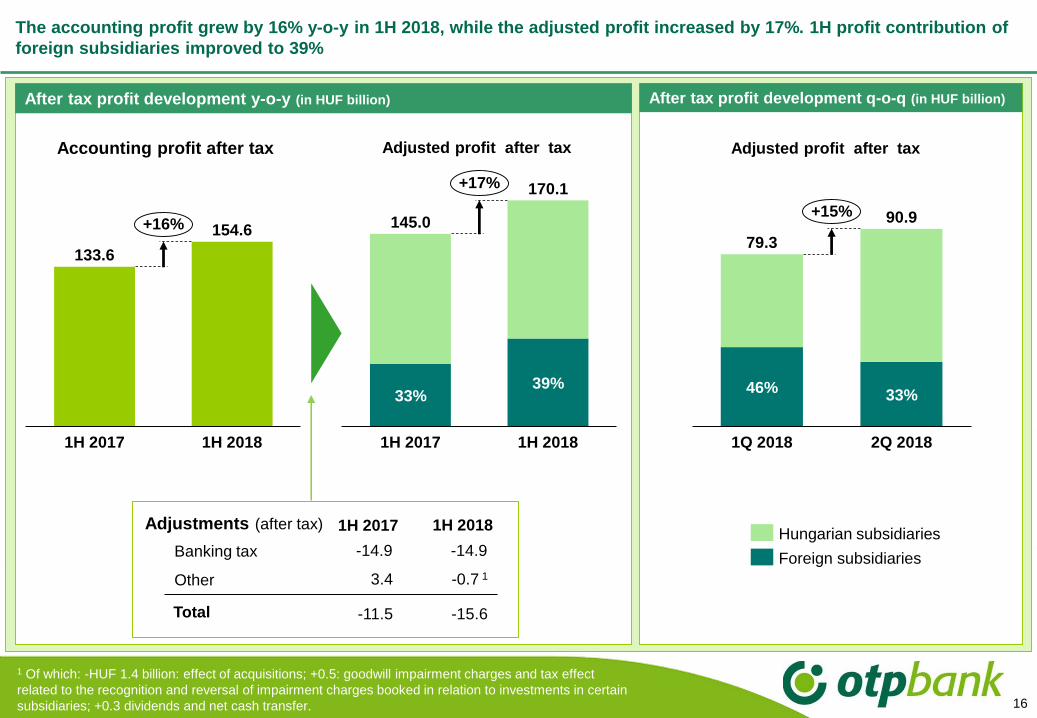
The accounting profit grew by 16% y-o-y in 1H 2018, while the adjusted profit increased by 17%. 1H profit contribution of
foreign subsidiaries improved to 39%
Accounting profit after tax
133.6
154.6
1H 2017 1H 2018
+16%
Adjusted profit after tax
Adjustments (after tax)
1H 2017
170.1
33%
1H 2018
39%
145.0
+17%
1H 2017 1H 2018
Banking tax
Other
Total
-14.9
3.4
-11.5
-14.9
-0.7 1
-15.6
(milliárd forintban)
46%
1Q 2018
33%
2Q 2018
79.3
90.9+15%
After tax profit development y-o-y (in HUF billion)
Adjusted profit after tax
After tax profit development q-o-q (in HUF billion)
Hungarian subsidiaries
Foreign subsidiaries
1 Of which: -HUF 1.4 billion: effect of acquisitions; +0.5: goodwill impairment charges and tax effect
related to the recognition and reversal of impairment charges booked in relation to investments in certain
subsidiaries; +0.3 dividends and net cash transfer.

1H 2017 1H 2018 Y-o-Y 2Q 2017 1Q 2018 2Q 2018 Q-o-Q Y-o-Y
in HUF billion in HUF billion
Consolidated adjusted 145.0 170.1 17% 78.3 79.3 90.9 15% 16%
OTP Core (Hungary) 90.2 95.4 6% 49.4 39.1 56.3 44% 14%
DSK (Bulgaria) 25.4 24.1 -5% 12.0 11.3 12.9 14% 7%
OBRu1 (Russia) 15.1 12.8 7.5 7.2 5.6 -22%
Touch Bank1 (Russia) -3.8 - -1.6 - -
OBH (Croatia, with Splitska banka) 5.1 12.2 140% 6.9 7.7 4.5 -41% -35%
OBU (Ukraine) 5.8 11.3 94% 2.5 5.8 5.4 -7% 117%
OBR (Romania) 0.9 1.4 59% -0.4 1.5 -0.1
OBSrb (Serbia, with Vojvodjanska banka) -1.5 1.6 -1.5 0.6 1.0 73%
OBS (Slovakia) -0.3 -0.1 -0.4 0.8 -0.9
CKB (Montenegro) 0.0 1.4 -0.1 0.7 0.7 -1%
Leasing (HUN, RO, BG, CR) 4.2 4.8 13% 2.1 2.5 2.3 -7% 7%
OTP Fund Management (Hungary) 2.0 1.9 -7% 1.0 1.1 0.8 -23% -17%
Corporate Centre and others 2.0 3.5 73% 0.8 1.1 2.4 124% 192%
17
1H after tax profit of OTP Core grew by 6% y-o-y. The consolidated growth of profitability was mainly supported by the
improving performance of the Croatian, Ukrainian, Serbian and Montenegrin operations
1 Starting from 1Q 2018 the performance of Touch Bank is presented as part of OBRu (OTP Bank Russia).
Until 4Q 2017 Touch Bank was presented separately.
11.2 14% 5.9 -5%
18
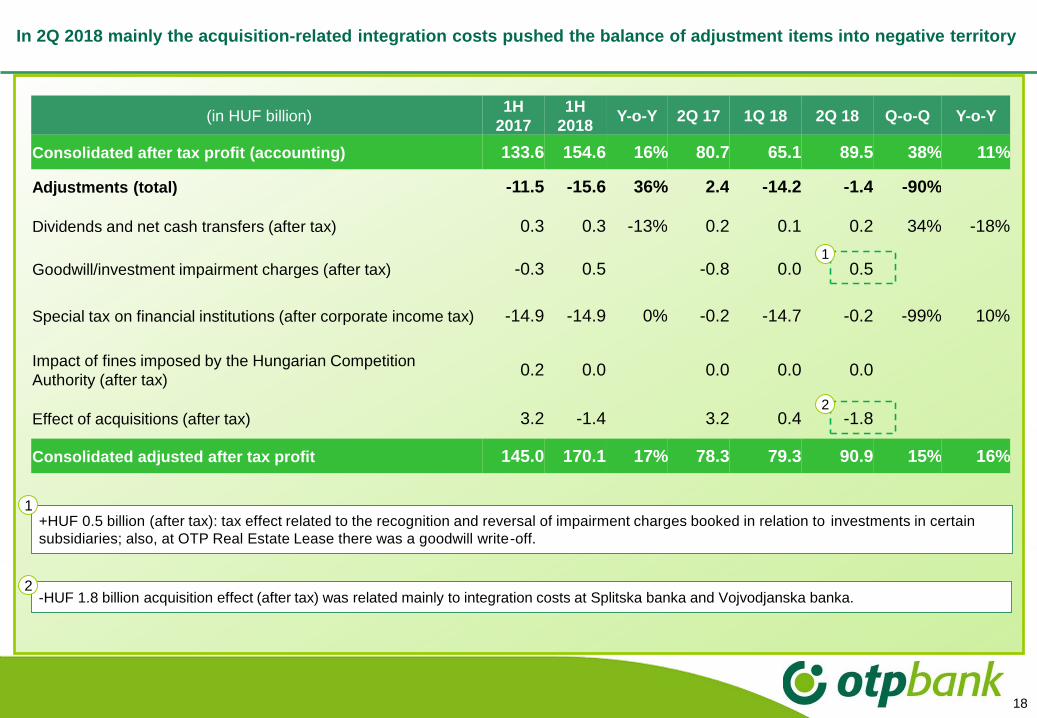
In 2Q 2018 mainly the acquisition-related integration costs pushed the balance of adjustment items into negative territory
-HUF 1.8 billion acquisition effect (after tax) was related mainly to integration costs at Splitska banka and Vojvodjanska banka.2
+HUF 0.5 billion (after tax): tax effect related to the recognition and reversal of impairment charges booked in relation to investments in certain
subsidiaries; also, at OTP Real Estate Lease there was a goodwill write-off.
1
(in HUF billion)1H
2017
1H
2018Y-o-Y 2Q 17 1Q 18 2Q 18 Q-o-Q Y-o-Y
Consolidated after tax profit (accounting) 133.6 154.6 16% 80.7 65.1 89.5 38% 11%
Adjustments (total) -11.5 -15.6 36% 2.4 -14.2 -1.4 -90%
Dividends and net cash transfers (after tax) 0.3 0.3 -13% 0.2 0.1 0.2 34% -18%
Goodwill/investment impairment charges (after tax) -0.3 0.5 -0.8 0.0 0.5
Special tax on financial institutions (after corporate income tax) -14.9 -14.9 0% -0.2 -14.7 -0.2 -99% 10%
Impact of fines imposed by the Hungarian Competition
Authority (after tax)0.2 0.0 0.0 0.0 0.0
Effect of acquisitions (after tax) 3.2 -1.4 3.2 0.4 -1.8
Consolidated adjusted after tax profit 145.0 170.1 17% 78.3 79.3 90.9 15% 16%
2
1
19
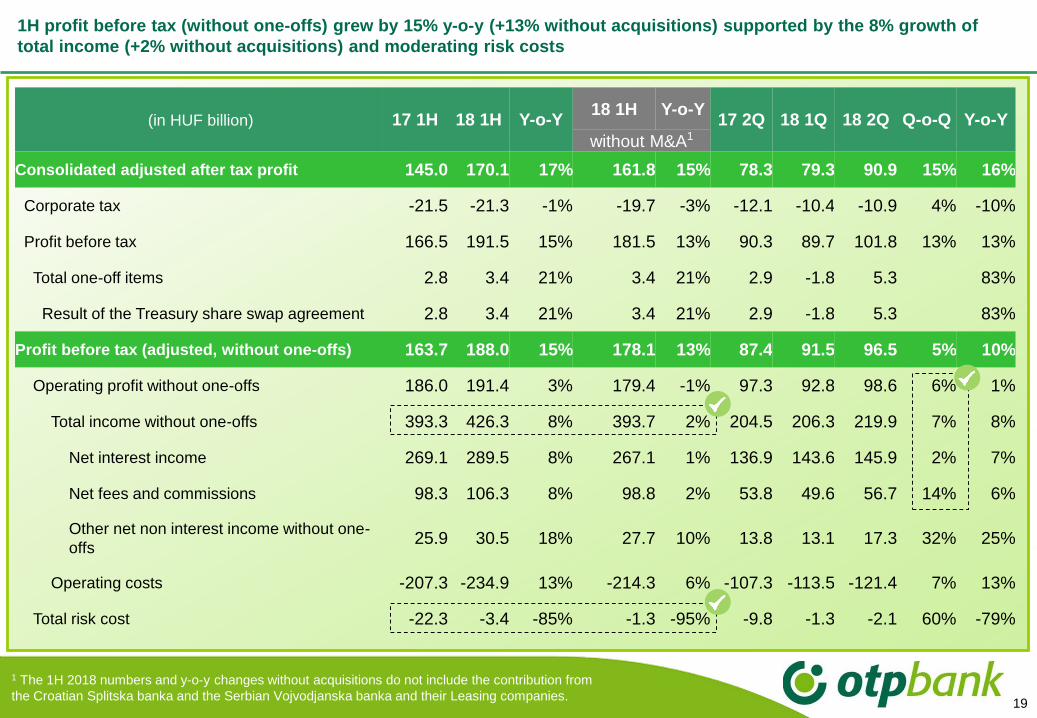
1H profit before tax (without one-offs) grew by 15% y-o-y (+13% without acquisitions) supported by the 8% growth of
total income (+2% without acquisitions) and moderating risk costs
1 The 1H 2018 numbers and y-o-y changes without acquisitions do not include the contribution from
the Croatian Splitska banka and the Serbian Vojvodjanska banka and their Leasing companies.
(in HUF billion) 17 1H 18 1H Y-o-Y18 1H Y-o-Y
17 2Q 18 1Q 18 2Q Q-o-Q Y-o-Y
without M&A1
Consolidated adjusted after tax profit 145.0 170.1 17% 161.8 15% 78.3 79.3 90.9 15% 16%
Corporate tax -21.5 -21.3 -1% -19.7 -3% -12.1 -10.4 -10.9 4% -10%
Profit before tax 166.5 191.5 15% 181.5 13% 90.3 89.7 101.8 13% 13%
Total one-off items 2.8 3.4 21% 3.4 21% 2.9 -1.8 5.3 83%
Result of the Treasury share swap agreement 2.8 3.4 21% 3.4 21% 2.9 -1.8 5.3 83%
Profit before tax (adjusted, without one-offs) 163.7 188.0 15% 178.1 13% 87.4 91.5 96.5 5% 10%
Operating profit without one-offs 186.0 191.4 3% 179.4 -1% 97.3 92.8 98.6 6% 1%
Total income without one-offs 393.3 426.3 8% 393.7 2% 204.5 206.3 219.9 7% 8%
Net interest income 269.1 289.5 8% 267.1 1% 136.9 143.6 145.9 2% 7%
Net fees and commissions 98.3 106.3 8% 98.8 2% 53.8 49.6 56.7 14% 6%
Other net non interest income without one-
offs25.9 30.5 18% 27.7 10% 13.8 13.1 17.3 32% 25%
Operating costs -207.3 -234.9 13% -214.3 6% -107.3 -113.5 -121.4 7% 13%
Total risk cost -22.3 -3.4 -85% -1.3 -95% -9.8 -1.3 -2.1 60% -79%
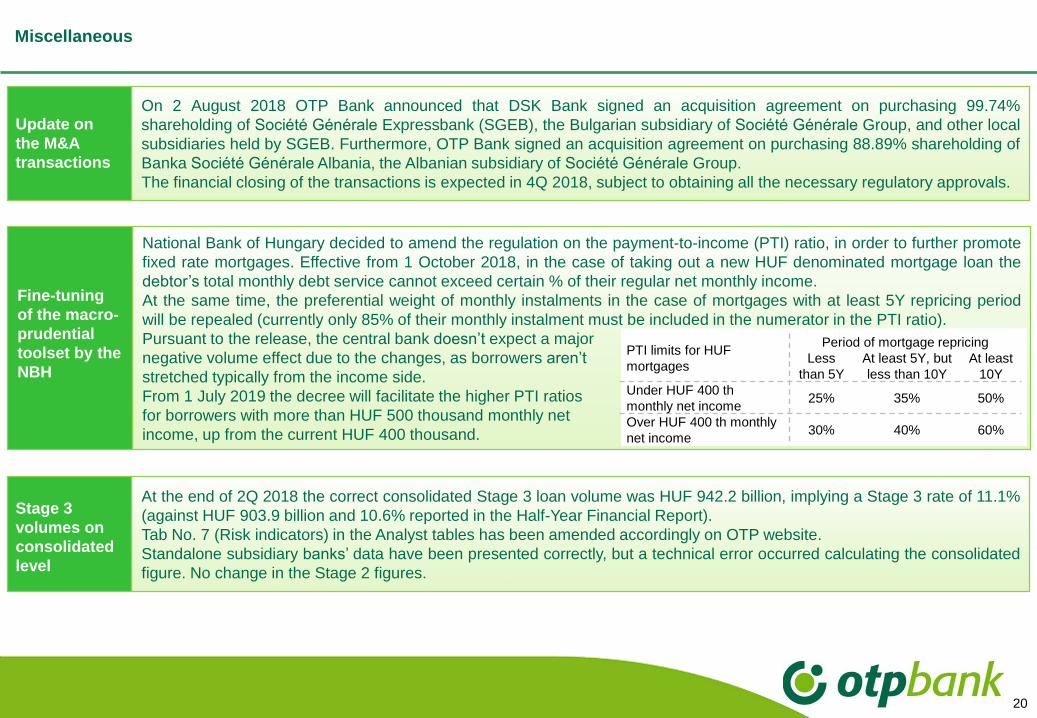
Miscellaneous
20
On 2 August 2018 OTP Bank announced that DSK Bank signed an acquisition agreement on purchasing 99.74%
shareholding of Société Générale Expressbank (SGEB), the Bulgarian subsidiary of Société Générale Group, and other local
subsidiaries held by SGEB. Furthermore, OTP Bank signed an acquisition agreement on purchasing 88.89% shareholding of
Banka Société Générale Albania, the Albanian subsidiary of Société Générale Group.
The financial closing of the transactions is expected in 4Q 2018, subject to obtaining all the necessary regulatory approvals.
Update on
the M&A
transactions
National Bank of Hungary decided to amend the regulation on the payment-to-income (PTI) ratio, in order to further promote
fixed rate mortgages. Effective from 1 October 2018, in the case of taking out a new HUF denominated mortgage loan the
debtor’s total monthly debt service cannot exceed certain % of their regular net monthly income.
At the same time, the preferential weight of monthly instalments in the case of mortgages with at least 5Y repricing period
will be repealed (currently only 85% of their monthly instalment must be included in the numerator in the PTI ratio).
Pursuant to the release, the central bank doesn’t expect a major
negative volume effect due to the changes, as borrowers aren’t
stretched typically from the income side.
From 1 July 2019 the decree will facilitate the higher PTI ratios
for borrowers with more than HUF 500 thousand monthly net
income, up from the current HUF 400 thousand.
Fine-tuning
of the macro-
prudential
toolset by the
NBH
PTI limits for HUF
mortgages
Period of mortgage repricing
Less
than 5Y
At least 5Y, but
less than 10Y
At least
10Y
Under HUF 400 th
monthly net income 25% 35% 50%
Over HUF 400 th monthly
net income 30% 40% 60%
At the end of 2Q 2018 the correct consolidated Stage 3 loan volume was HUF 942.2 billion, implying a Stage 3 rate of 11.1%
(against HUF 903.9 billion and 10.6% reported in the Half-Year Financial Report).
Tab No. 7 (Risk indicators) in the Analyst tables has been amended accordingly on OTP website.
Standalone subsidiary banks’ data have been presented correctly, but a technical error occurred calculating the consolidated
figure. No change in the Stage 2 figures.
Stage 3
volumes on
consolidated
level

21
CroatiaMarket shares in the Bulgarian banking sector
(1Q 2018, million EUR)
Bank
DSK+SGEB* (pro forma) 9,690 19.4%
1. UniCredit Bulbank 9,593 19.2%
2. DSK Bank 6,323 12.7%
3. United Bulgarian Bank 5,410 10.8%
4. First Investment Bank 4,316 8.7%
5. Eurobank Bulgaria 3,842 7.7%
6. Raiffeisenbank 3,615 7.2%
7. SG Expressbank 3,367 6.7%
8. Central Cooperative Bank 2,779 5.6%
In Bulgaria DSK Bank signed and agreement on purchasing the 7th biggest bank, Societe Generale
Expressbank (SGEB)
DSK
+6.7%p
DSK + SGEB
19.4%
12.7%
511
+151
DSK DSK + SGEB
360
Market share by total assets before and after the acquisition*
(pro forma, based on 1Q 2018 data)
Number of branches before and after the acquisition(based on 4Q 2017 data)
1.
* Including other assets being part of the transaction
Bulgaria
Total
assets
Market
share
Source: Bulgarian National Bank
(pro forma)
(pro forma)
22
Bulgaria
2017(in HUF billion)
DSK SGEBDSK +
SGEB(pro forma)
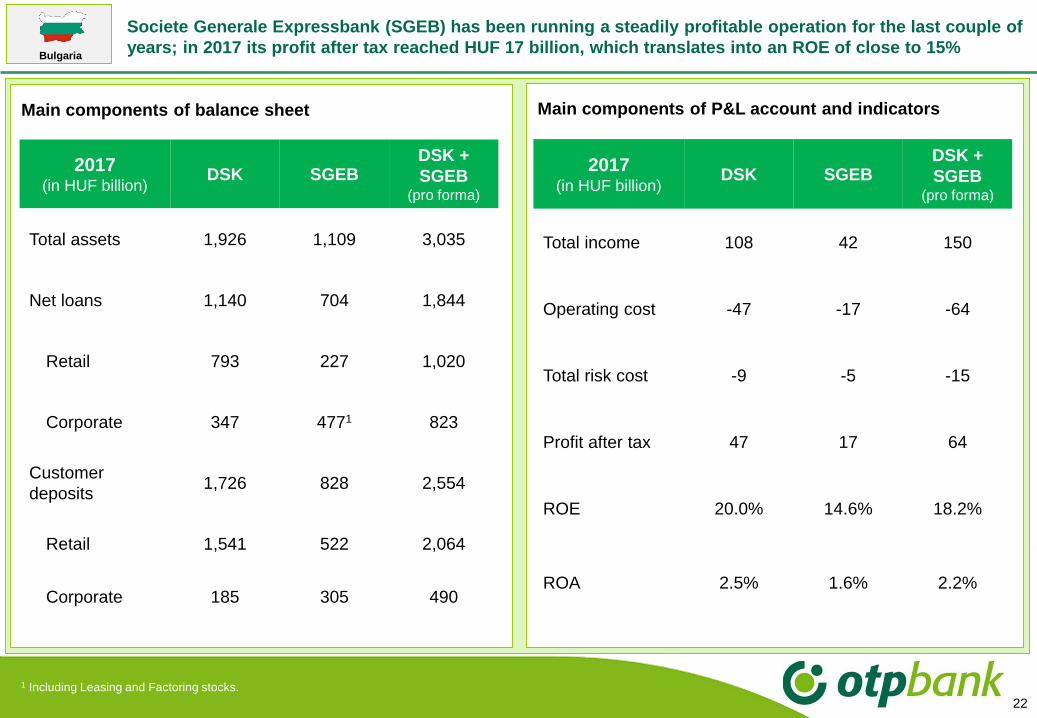
Total assets 1,926 1,109 3,035
Net loans 1,140 704 1,844
Retail 793 227 1,020
Corporate 347 4771 823
Customer
deposits1,726 828 2,554
Retail 1,541 522 2,064
Corporate 185 305 490
Societe Generale Expressbank (SGEB) has been running a steadily profitable operation for the last couple of
years; in 2017 its profit after tax reached HUF 17 billion, which translates into an ROE of close to 15%
2017(in HUF billion)
DSK SGEBDSK +
SGEB(pro forma)
Total income 108 42 150
Operating cost -47 -17 -64
Total risk cost -9 -5 -15
Profit after tax 47 17 64
ROE 20.0% 14.6% 18.2%
ROA 2.5% 1.6% 2.2%
Main components of P&L account and indicators
1 Including Leasing and Factoring stocks.
Main components of balance sheet

23
CroatiaMarket shares in the Albanian banking sector
(1Q 2018, million EUR)
Bank
1. National Commercial Bank 3,091 28.0%
2. Raiffeisen Bank Albania 1,837 16.6%
3. Credins Bank 1,387 12.6%
4. Intesa Sanpaolo Bank Albania 1,220 11.0%
Societe Generale Albania 633 5.7%
6. Alpha Bank Albania 583 5.3%
7. Tirana Bank 582 5.3%
8. Union Bank 363 3.3%
In Albania OTP signed and agreement on purchasing the 5th biggest bank, Societe Generale Albania
(SGAL); as a result the market share will reach 5.7%
0.9
SGAL
38
SGAL
Profit after tax
(2017, in HUF billion)
Number of branches
(based on 4Q 2017 data)
5.
Number of employees
(based on 4Q 2017 data)
413
SGAL
Net loan to deposit ratio
(based on 4Q 2017 data)
SGAL
71.2%
Albania
Source: Albanian Association of Banks
Total
assets
Market
share
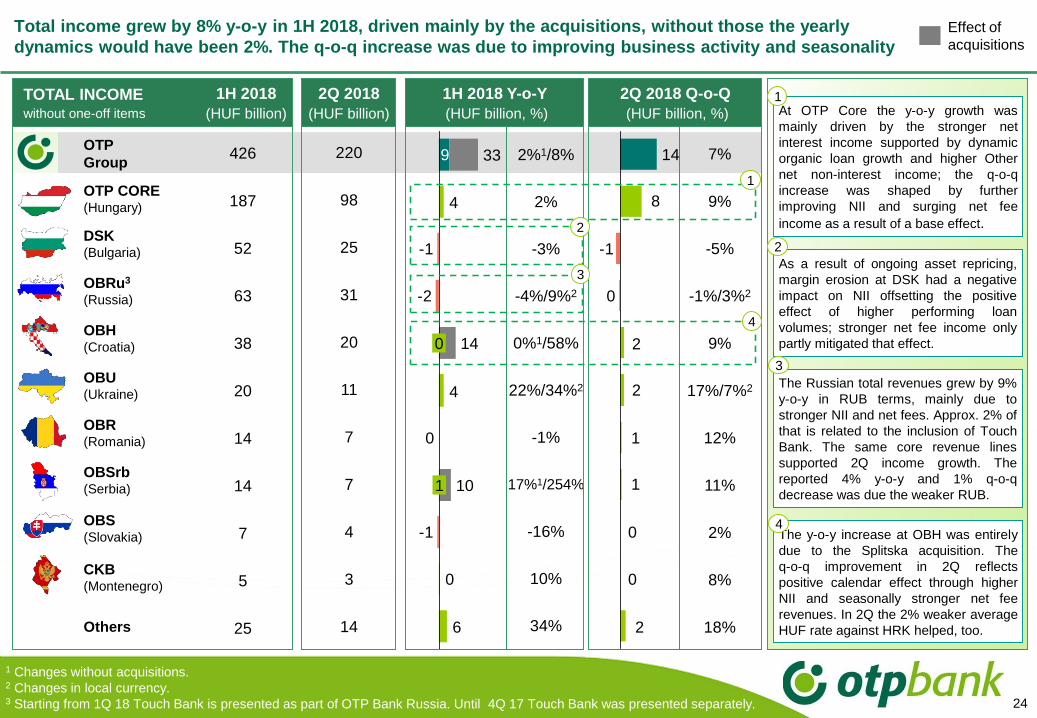
Total income grew by 8% y-o-y in 1H 2018, driven mainly by the acquisitions, without those the yearly
dynamics would have been 2%. The q-o-q increase was due to improving business activity and seasonality
24
9
6
0
4
4
-1
0
-2
-1
0
1
14
10
33220
98
25
31
20
11
7
7
4
3
14
426
187
52
63
38
20
14
14
7
5
25
2%1/8%
2%
-3%
-4%/9%2
0%1/58%
22%/34%2
-1%
17%1/254%
-16%
10%
34%
TOTAL INCOME without one-off items
1H 2018
(HUF billion)
2Q 2018
(HUF billion)
1H 2018 Y-o-Y
(HUF billion, %)
2Q 2018 Q-o-Q
(HUF billion, %)
2
0
0
1
1
2
2
0
-1
8
14 7%
9%
-5%
-1%/3%2
9%
17%/7%2
12%
11%
2%
8%
18%
1 Changes without acquisitions. 2 Changes in local currency. 3 Starting from 1Q 18 Touch Bank is presented as part of OTP Bank Russia. Until 4Q 17 Touch Bank was presented separately.
Effect of
acquisitions
OTP
Group
OTP CORE(Hungary)
DSK (Bulgaria)
OBRu3
(Russia)
OBH(Croatia)
OBU(Ukraine)
OBR(Romania)
OBSrb(Serbia)
OBS (Slovakia)
CKB(Montenegro)
Others
At OTP Core the y-o-y growth was
mainly driven by the stronger net
interest income supported by dynamic
organic loan growth and higher Other
net non-interest income; the q-o-q
increase was shaped by further
improving NII and surging net fee
income as a result of a base effect.
As a result of ongoing asset repricing,
margin erosion at DSK had a negative
impact on NII offsetting the positive
effect of higher performing loan
volumes; stronger net fee income only
partly mitigated that effect.
The Russian total revenues grew by 9%
y-o-y in RUB terms, mainly due to
stronger NII and net fees. Approx. 2% of
that is related to the inclusion of Touch
Bank. The same core revenue lines
supported 2Q income growth. The
reported 4% y-o-y and 1% q-o-q
decrease was due the weaker RUB.
The y-o-y increase at OBH was entirely
due to the Splitska acquisition. The
q-o-q improvement in 2Q reflects
positive calendar effect through higher
NII and seasonally stronger net fee
revenues. In 2Q the 2% weaker average
HUF rate against HRK helped, too.
1
2
3
4
1H 2018 Y-o-Y
(HUF billion, %)
2Q 2018 Q-o-Q
(HUF billion, %)
1
2
4
3

The net interest income grew moderately y-o-y even without acquisitions. On quarterly basis accelerating
business activity and a positive calendar effect were the key drivers of growth
25
146
60
16
25
14
8
5
5
3
2
3
2
3
289
120
34
50
27
14
11
10
6
4
6
3
6
%
2%
1%
-8%
-2%/2%2
4%
29%/18%2
6%
8%
-1%
6%
4%
35%
-4%
2
0
-1
0
1
2
0
0
0
0
0
0
0
NET INTEREST INCOME1H 2018
(HUF billion)
2Q 2018
(HUF billion)
1H 2018 Y-o-Y
(HUF billion, %)
2Q 2018 Q-o-Q
(HUF billion, %)
3
-2
-3
3
0
-1
0
1
1
2
204
0
0 7
9
1.4%1/8%
3%
-6%
-6%/6%2
0%1/54%
26%/39%2
-2%
9%1/235%
-17%
8%
13%
81%
70%
Effect of
acquisitions
OTP
Group
OTP CORE(Hungary)
DSK (Bulgaria)
OBRu3
(Russia)
OBH(Croatia)
OBU(Ukraine)
OBR(Romania)
OBSr(Serbia)
OBS(Slovakia)
CKB(Montenegro)
Merkantil(Hungary)
Corporate
Centre
Others
At OTP Core the 3% y-o-y growth in 1H
was due to expanding loans, but the
placement of excess liquidity as a result
of deposit inflow also generated
additional interest revenues. The q-o-q
increase was shaped mainly by further
growth in loan volumes, especially in the
cash loan and corporate segments.
At DSK ongoing margin contraction
outweighed the positive effect of higher
loan volumes. The q-o-q decline was
due to an accounting correction made in
2Q, negatively affecting the q-o-q NII
dynamics by HUF 1.8 billion. Without this
the NII would have grown by 1% q-o-q.
The Russian NII increased both q-o-q
and y-o-y in RUB terms as a result of
the favourable balance sheet changes.
1
2
3
1
2
4
3
In Ukraine NII was supported by strong
business activity and improving margins;
higher interest rate environment was
coupled with stronger interest revenues,
whereas borrowing costs remained
stable.
4
1 Changes without acquisitions. 2 Changes in local currency. 3 Starting from 1Q 18 Touch Bank is presented as part of OTP Bank Russia. Until 4Q 17 Touch Bank was presented separately.

Consumer
Mortgage
Corporate1
Total
On a quarterly basis the Group’s performing loans expanded by 5%. Hungary and Bulgaria posted accelerating growth
rates in retail; Hungarian mortgage growth reached 2% over the quarter, within that housing loans rose by 3%
Q-o-Q performing (DPD0-90) loan volume changes in 2Q 2018, adjusted for FX-effect
26
5% 6% 3% 3% 4% 10% 5% 12% 1% 22%
3% 5% 3% 4% 1% 15% 1% 7% 1% 0%
2% 2% 4% 0% -8% 1% 4% 2% 3%
9% 10% 4% -4% 8% 11% 10% 18% 0% 47%
1 Loans to MSE and MLE clients and local governments.
3% -2%
Housing loan Home equity
CKB(Montenegro)
OBRu(Russia)
OBU(Ukraine)
DSK(Bulgaria)
OBR(Romania)
OBH(Croatia)
OBS(Slovakia)
OBSr(Serbia)
Core(Hungary)
Cons.
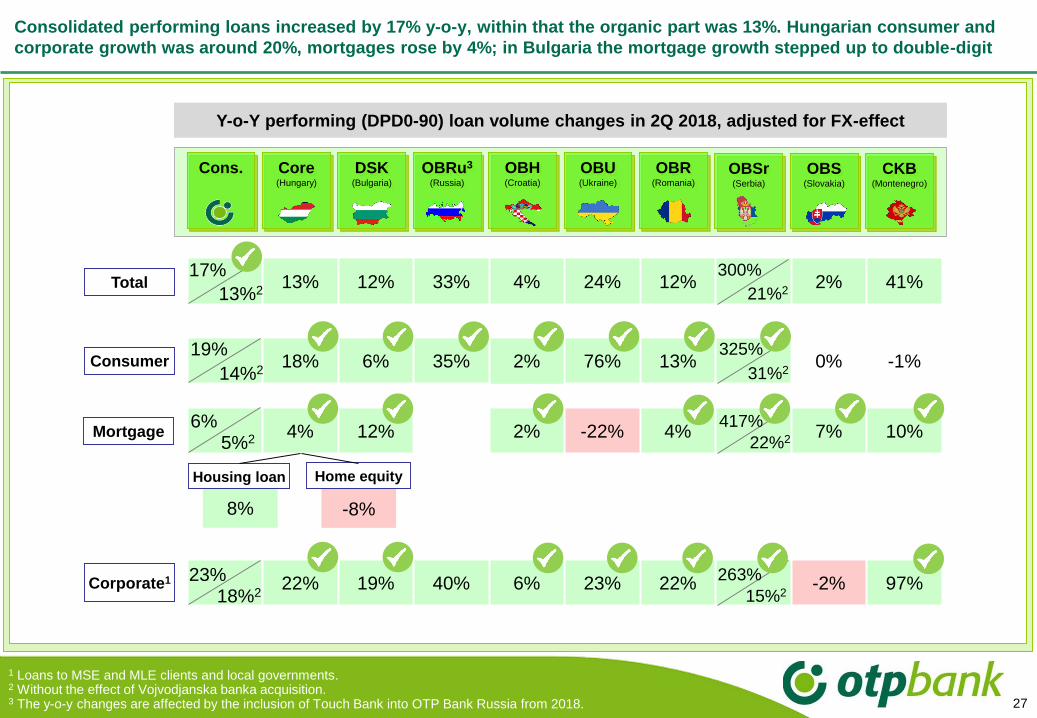
Consolidated performing loans increased by 17% y-o-y, within that the organic part was 13%. Hungarian consumer and
corporate growth was around 20%, mortgages rose by 4%; in Bulgaria the mortgage growth stepped up to double-digit
Y-o-Y performing (DPD0-90) loan volume changes in 2Q 2018, adjusted for FX-effect
27
CKB(Montenegro)
OBRu3
(Russia)
OBU(Ukraine)
DSK(Bulgaria)
OBR(Romania)
OBH(Croatia)
OBS(Slovakia)
OBSr(Serbia)
Core(Hungary)
Cons.
13% 12% 33% 4% 24% 12% 2% 41%
18% 6% 35% 2% 76% 13% 0% -1%
4% 12% 2% -22% 4% 7% 10%
22% 19% 40% 6% 23% 22% -2% 97%
8% -8%
Housing loan Home equity
17%
19%
6%
23%
13%2
14%2
5%2
18%2
300%
325%
417%
263%
21%2
31%2
22%2
15%2
Consumer
Mortgage
Corporate1
Total
1 Loans to MSE and MLE clients and local governments.2 Without the effect of Vojvodjanska banka acquisition.3 The y-o-y changes are affected by the inclusion of Touch Bank into OTP Bank Russia from 2018.
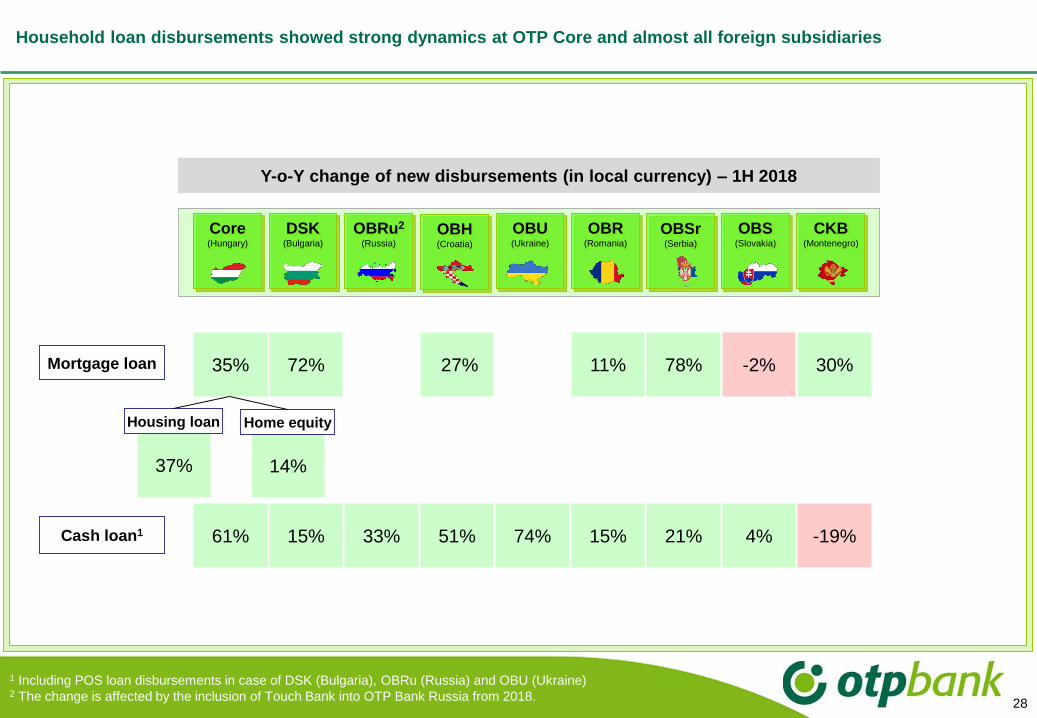
Household loan disbursements showed strong dynamics at OTP Core and almost all foreign subsidiaries
Y-o-Y change of new disbursements (in local currency) – 1H 2018
28
OBSr(Serbia)
OBRu2
(Russia)
DSK(Bulgaria)
OBU(Ukraine)
OBR(Romania)
OBH(Croatia)
OBS(Slovakia)
CKB(Montenegro)
Core(Hungary)
1 Including POS loan disbursements in case of DSK (Bulgaria), OBRu (Russia) and OBU (Ukraine)2 The change is affected by the inclusion of Touch Bank into OTP Bank Russia from 2018.
Cash loan1
Mortgage loan 35% 72% 27% 11% 78% -2% 30%
61% 15% 33% 51% 74% 15% 21% 4% -19%
37% 14%
Housing loan Home equity
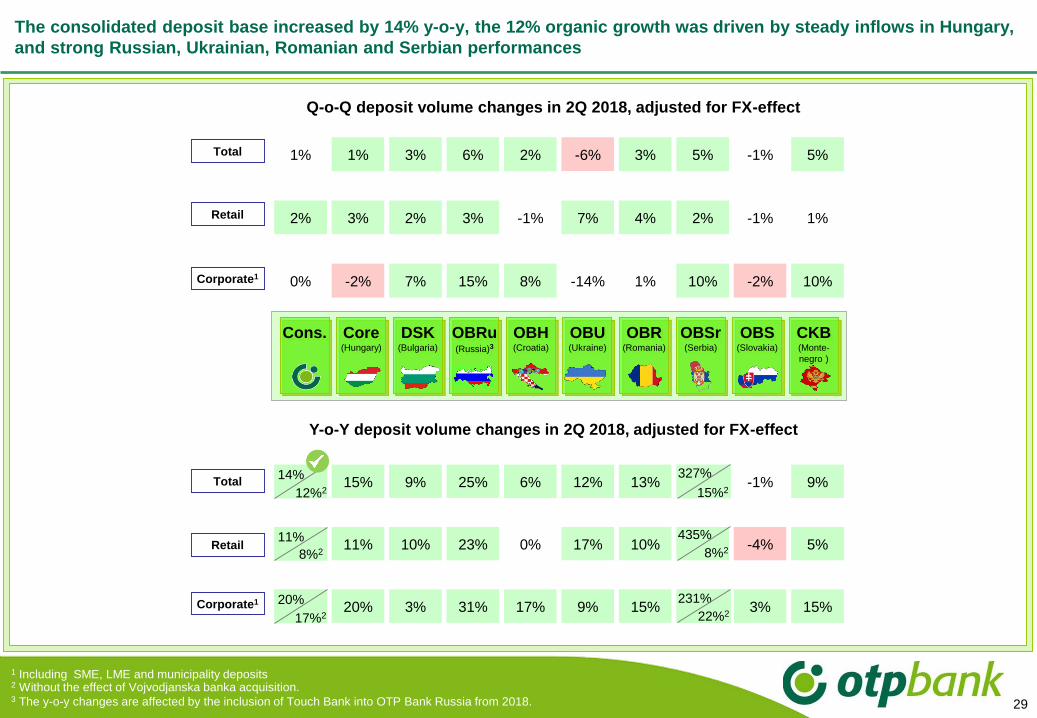
The consolidated deposit base increased by 14% y-o-y, the 12% organic growth was driven by steady inflows in Hungary,
and strong Russian, Ukrainian, Romanian and Serbian performances
29
1 Including SME, LME and municipality deposits2 Without the effect of Vojvodjanska banka acquisition.3 The y-o-y changes are affected by the inclusion of Touch Bank into OTP Bank Russia from 2018.
Corporate1
Retail
Total
Corporate1
Retail
Total
Q-o-Q deposit volume changes in 2Q 2018, adjusted for FX-effect
1% 1% 3% 6% 2% -6% 3% 5% -1% 5%
2% 3% 2% 3% -1% 7% 4% 2% -1% 1%
0% -2% 7% 15% 8% -14% 1% 10% -2% 10%
24% 15% 9% 25% 6% 12% 13% -1% 9%
22% 11% 10% 23% 0% 17% 10% -4% 5%
28% 20% 3% 31% 17% 9% 15% 3% 15%
Y-o-Y deposit volume changes in 2Q 2018, adjusted for FX-effect
20%
17%2
11%
8%2
14%
12%2
231%
22%2
435%
8%2
327%
15%2
CKB(Monte-
negro )
OBRu(Russia)3
OBH(Croatia)
DSK(Bulgaria)
OBU(Ukraine)
OBR(Romania)
OBSr(Serbia)
OBS(Slovakia)
Core(Hungary)
Cons.
30
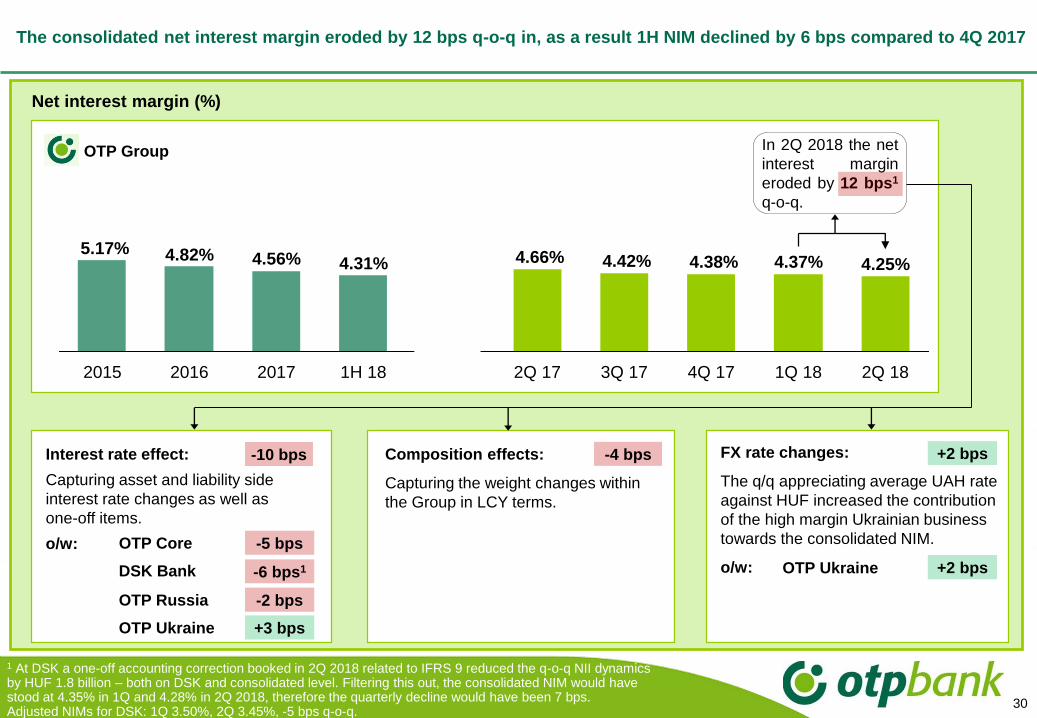
The consolidated net interest margin eroded by 12 bps q-o-q in, as a result 1H NIM declined by 6 bps compared to 4Q 2017
Net interest margin (%)
OTP Group
4.42%
2Q 181H 18 3Q 172Q 172017
4.31% 4.38%4.56% 4.25%
1Q 18
4.37%
4Q 17
4.66%
2016
4.82%
2015
5.17%
In 2Q 2018 the net
interest margin
eroded by 12 bps1
q-o-q.
Interest rate effect:
Capturing asset and liability side
interest rate changes as well as
one-off items.
o/w:
-10 bps Composition effects:
Capturing the weight changes within
the Group in LCY terms.
FX rate changes:
The q/q appreciating average UAH rate
against HUF increased the contribution
of the high margin Ukrainian business
towards the consolidated NIM.
o/w:
OTP Core -5 bps
DSK Bank OTP Ukraine
OTP Russia -2 bps
OTP Ukraine +3 bps
-6 bps1
-4 bps +2 bps
+2 bps
1 At DSK a one-off accounting correction booked in 2Q 2018 related to IFRS 9 reduced the q-o-q NII dynamics by HUF 1.8 billion – both on DSK and consolidated level. Filtering this out, the consolidated NIM would have stood at 4.35% in 1Q and 4.28% in 2Q 2018, therefore the quarterly decline would have been 7 bps.Adjusted NIMs for DSK: 1Q 3.50%, 2Q 3.45%, -5 bps q-o-q.
3.48 3.22 3.01 3.27 3.14 3.16 3.06 2.97
2Q 184Q 172016 2017 1Q 183Q 171H 18 2Q 17
31
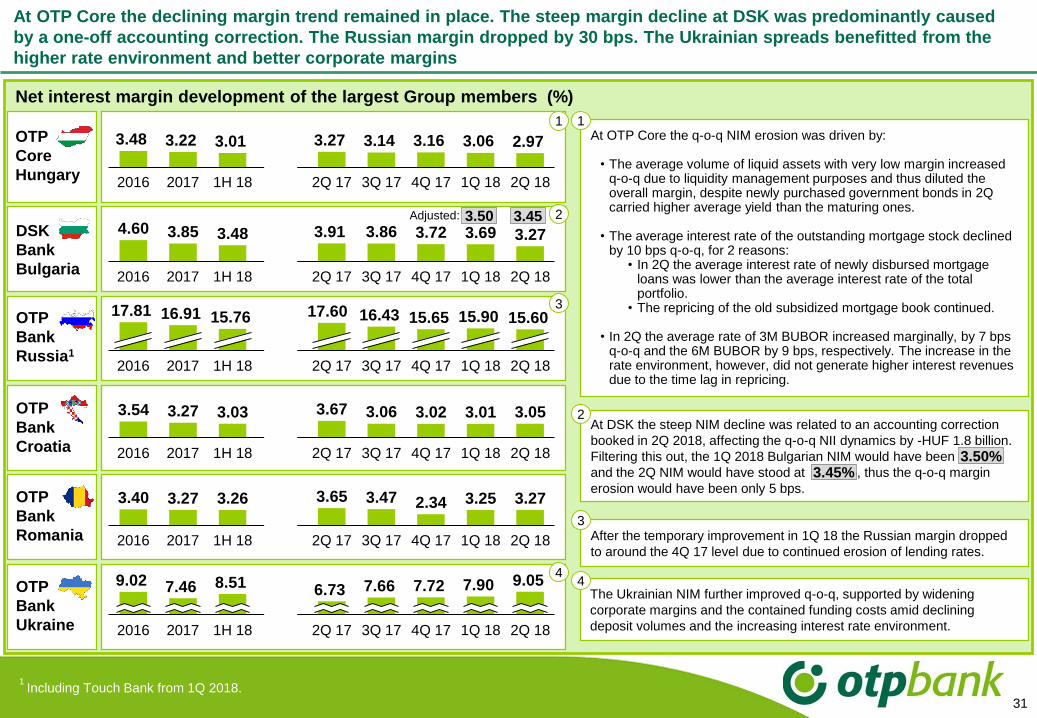
At OTP Core the declining margin trend remained in place. The steep margin decline at DSK was predominantly caused
by a one-off accounting correction. The Russian margin dropped by 30 bps. The Ukrainian spreads benefitted from the
higher rate environment and better corporate margins
Net interest margin development of the largest Group members (%)
3.54 3.27 3.03 3.67 3.06 3.02 3.01 3.05
2Q 172016 2017 1H 18 3Q 17 2Q 184Q 17 1Q 18
2Q 17 2Q 184Q 17
6.739.05
2016
7.907.46
1Q 181H 18
7.66
3Q 17
7.729.02
2017
8.51
3.40 3.27 3.26 3.65 3.47 2.34 3.25 3.27
2Q 172016 2Q 182017 1H 18 4Q 17 1Q 183Q 17
4.60 3.85 3.48 3.86 3.72 3.69 3.27
2017 2Q 182016 2Q 171H 18 3Q 17 1Q 184Q 17
3.91
15.6517.60
1H 18 4Q 172Q 17 1Q 18
16.43 15.90
3Q 17
15.60
2017
17.81 16.91 15.76
2016 2Q 18
OTP
Core
Hungary
DSK
Bank
Bulgaria
OTP
Bank
Russia1
OTP
Bank
Croatia
OTP
Bank
Romania
OTP
Bank
Ukraine
At OTP Core the q-o-q NIM erosion was driven by:
• The average volume of liquid assets with very low margin increased q-o-q due to liquidity management purposes and thus diluted the overall margin, despite newly purchased government bonds in 2Q carried higher average yield than the maturing ones.
• The average interest rate of the outstanding mortgage stock declined by 10 bps q-o-q, for 2 reasons:
• In 2Q the average interest rate of newly disbursed mortgage loans was lower than the average interest rate of the total portfolio.
• The repricing of the old subsidized mortgage book continued.
• In 2Q the average rate of 3M BUBOR increased marginally, by 7 bps q-o-q and the 6M BUBOR by 9 bps, respectively. The increase in the rate environment, however, did not generate higher interest revenues due to the time lag in repricing.
After the temporary improvement in 1Q 18 the Russian margin dropped
to around the 4Q 17 level due to continued erosion of lending rates.
The Ukrainian NIM further improved q-o-q, supported by widening
corporate margins and the contained funding costs amid declining
deposit volumes and the increasing interest rate environment.
1 Including Touch Bank from 1Q 2018.
3.50 3.45Adjusted:
1
2
3
44
1
3
At DSK the steep NIM decline was related to an accounting correction
booked in 2Q 2018, affecting the q-o-q NII dynamics by -HUF 1.8 billion.
Filtering this out, the 1Q 2018 Bulgarian NIM would have been 3.50%
and the 2Q NIM would have stood at 3.45%, thus the q-o-q margin
erosion would have been only 5 bps.
2
3.50%3.45%

The net fee income grew by 2% y-o-y without the effect of acquisitions; the 14% q-o-q increase was due to
numerous base effects, but stronger business activity also fuelled the growth
32
57
29
7
7
4
3
1
2
1
1
2
106
53
14
13
8
5
2
3
2
1
3
%NET FEE INCOME1H 2018
(HUF billion)
2Q 2018
(HUF billion)
1H 2018 Y-o-Y
(HUF billion, %)
2Q 2018 Q-o-Q
(HUF billion, %)
7
5
1
0
1
0
0
0
0
0
0
14%
22%
8%
4%/8%2
17%
13%/3%2
7%
12%
7%
28%
-10%
-1
1
1
0
1
0
0
0
0
3
2
0
8
3
2%1/8%
-2%
7%
8%/22%2
-2%1/74%
13%/24%2
12%
15%1/291%
-10%
22%
2%
Effect of
acquisitions
OTP
Group
OTP CORE(Hungary)
DSK (Bulgaria)
OBRu3
(Russia)
OBH(Croatia)
OBU(Ukraine)
OBR(Romania)
OBSrb(Serbia)
OBS (Slovakia)
CKB(Montenegro)
Fund mgmt.
(Hungary)
The y-o-y increase at CKB is reasoned
by the fact that deposit insurance fees
booked earlier within net fees were
shifted to the operating cost line. The
q-o-q surge was fuelled by higher card,
transaction and security related fee
income.
1
2
2
1 Changes without acquisitions. 2 Changes in local currency. 3 Starting from 1Q 18 Touch Bank is presented as part of OTP Bank Russia. Until 4Q 17 Touch Bank was presented separately.
The y-o-y decline at Core is reasoned
by lower distribution fees on certain
household targeted government bonds,
while the q-o-q surge is explained
mainly by stronger business activity and
a base effect and a technical item:
- HUF 1.6 billion card-related FTT for
the whole year booked in 1Q in a
lump-sum;
- the accounting of contributions
payable into the Compensation Fund
and also the related tax deductions
induced altogether HUF 2.3 billion
q-o-q net fee income improvement.
Stronger business activity was the key
driver behind y-o-y and q-o-q F&C
growth at all major foreign subsidiaries.
In Ukraine and Russia y-o-y weaker
local currencies helped this line, too. In
Russia cash loans sold with insurance
policies, as well as card-related fee
income propelled F&C in particular.
3
1
2
3

The 1H other net non-interest income rose by 10% without acquisitions, partially due to a technical change
and higher FX gains at OTP Core
33
OTHER INCOMEwithout one-off items
2Q 2018
(HUF billion)
1H 2018 Y-o-Y
(HUF billion, %)
2Q 2018 Q-o-Q
(HUF billion, %)
2
0
0
0
0
0
0
0
-1
2
4
1H 2018
(HUF billion)
2
1
0
0
0
0
0
0
0
0
1
1
53
Effect of
acquisitions
OTP
Group
OTP CORE(Hungary)
DSK (Bulgaria)
OBRu3
(Russia)
OBH(Croatia)
OBU(Ukraine)
OBR(Romania)
OBSrb(Serbia)
OBS (Slovakia)
CKB(Montenegro)
Others
17
8
2
0
2
0
1
1
0
0
3
30
15
4
0
3
1
2
1
0
0
5
10%1/18%
15%
-6%
-59%
5%1/60%
16%/30%2
-3%
143%1/361%
-41%
270%
40%
32%
35%
-26%
6%
32%
-55%
63%
46%
37%
-528%
156%
At OTP Core the improvement was
mainly attributable to better FX-result
realized in 2Q 2018, and a technical
item drove other revenues higher, too.
Certain revenue and expenditure items
in relation to intragroup services were
not eliminated on consolidation from 2Q
2018, and the eliminations booked in 1Q
2018 were reversed in 2Q 2018. This
affected the q-o-q development of other
income, net fee income and operating
expenses at OTP Core, explaining HUF
0.6 billion q-o-q improvement in the
other income. On the other hand,
operating costs went up by HUF 0.5 and
fee expenditures by HUF 0.1 billion
(ceteris paribus).
The q-o-q improvement was partially
related to asset sale at the Other
Hungarian subsidiaries.
1
2
1
1 Changes without acquisitions. 2 Changes in local currency. 3 Starting from 1Q 18 Touch Bank is presented as part of OTP Bank Russia. Until 4Q 17 Touch Bank was presented separately.
2

Operating costs grew 13% y-o-y in 1H 2018, whereas without acquisitions the increase was 7.5%
on an FX-adjusted basis
34
3
4
6
8
24
30
108
12
21
10
235
OPERATING COSTS – 1H 2018(HUF billion)
Y-o-Y (FX-adj., HUF bn)
0
0
1
1
1
1
6
0
15
0
8
2 7
8
31
Y-o-Y
(HUF bn)
Y-o-Y
(%)
0
1
1
0
1
0
2
6
11
0
0
8
8
4
28 5.6%1 / 13%
6%
7%
-1%3/14%
-1%1/58%
0%
13%
11%1/236%
14%
16%
8%
Y-o-Y (FX-adj., %)
Effect of acquisitions
OTP
Group
OTP CORE(Hungary)
DSK (Bulgaria)
OBRu2
(Russia)
OBH(Croatia)
OBU(Ukraine)
OBR(Romania)
OBSrb(Serbia)
OBS (Slovakia)
CKB(Montenegro)
Merkantil
(Hungary)
7.5%1 / 15%
6%
6%
11%3/29%
-2%1/55%
10%
14%
5%1/217%
12%
14%
8%
1 Without the OPEX of the newly consolidated entities due to the Splitska and Vojvodjanska transactions. 2 Starting from 1Q 2018 Touch Bank is presented as part of OTP Bank Russia. Until 4Q 2017 Touch Bank was presented separately. 3 Without the effect of inclusion of Touch Bank in 1H 2018.
Effect of Touch Bank
inclusion in 1H 2018
1
OTP Core: higher personnel expenses (+7%) as
higher average headcount (+4%) and salary hikes
(avg. wage inflation in financial sector in 1H: 8.6%)
couldn’t be offset by reduced social and health care
contributions (-2.5 pps from 2018). Amortization
went up by 10%. Other expense growth was also
shaped by stronger business activity, and the
accounting change of intragroup services from 2018
resulted in a HUF 0.5 billion additional cost in 1H.
Russia: 11% FX-adjusted growth w/o Touch Bank.
Bulk of that was personnel expenses-driven: the
average headcount w/o agents grew by 4% coupled
with a 11.6% y-o-y nominal wage inflation in 1H.
Stronger business activity resulted in higher variable
costs: marketing expenses doubled and postal and
telco costs grew materially.
1
2
2
3
4
5
6
Ukraine: increasing personnel expenses amid 26%
wage inflation in 1H y-o-y, and other cost growth
induced by stronger business activity (real estate-
related costs +16%, marketing costs +12%).
3
Romania: employers’ wage costs went up by ~9%
in the financial sector y-o-y, the avg. headcount at
OBR went up by 6%, explained by soaring volumes.
Marketing expenses were up by around 50%.
4
Slovakia: Higher personnel expenses (+15%,
explained partly by higher bonuses; headcount +3%
on avg.), 50% higher marketing budget.
5
CKB: FX-adj. cost growth HUF 0.5 billion, o/w 0.4
billion was due to reclassification: deposit protection
fees were shifted from net fees to operating costs.
6
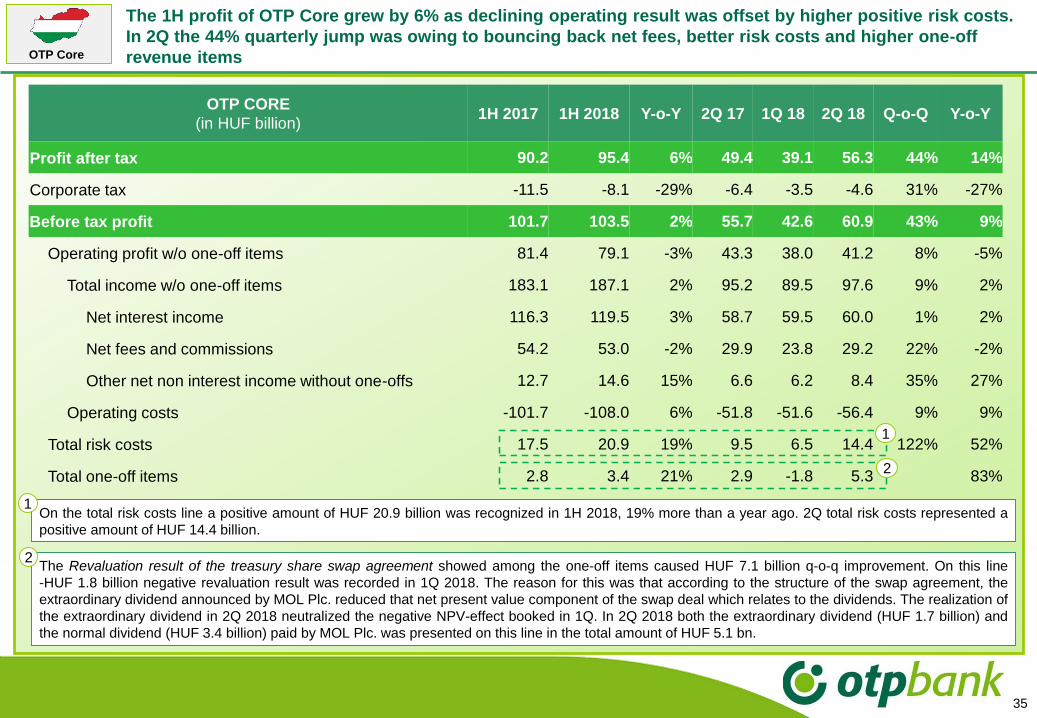
OTP CORE
(in HUF billion)1H 2017 1H 2018 Y-o-Y 2Q 17 1Q 18 2Q 18 Q-o-Q Y-o-Y
Profit after tax 90.2 95.4 6% 49.4 39.1 56.3 44% 14%
Corporate tax -11.5 -8.1 -29% -6.4 -3.5 -4.6 31% -27%
Before tax profit 101.7 103.5 2% 55.7 42.6 60.9 43% 9%
Operating profit w/o one-off items 81.4 79.1 -3% 43.3 38.0 41.2 8% -5%
Total income w/o one-off items 183.1 187.1 2% 95.2 89.5 97.6 9% 2%
Net interest income 116.3 119.5 3% 58.7 59.5 60.0 1% 2%
Net fees and commissions 54.2 53.0 -2% 29.9 23.8 29.2 22% -2%
Other net non interest income without one-offs 12.7 14.6 15% 6.6 6.2 8.4 35% 27%
Operating costs -101.7 -108.0 6% -51.8 -51.6 -56.4 9% 9%
Total risk costs 17.5 20.9 19% 9.5 6.5 14.4 122% 52%
Total one-off items 2.8 3.4 21% 2.9 -1.8 5.3 83%
35
OTP Core
On the total risk costs line a positive amount of HUF 20.9 billion was recognized in 1H 2018, 19% more than a year ago. 2Q total risk costs represented a
positive amount of HUF 14.4 billion.
1
The 1H profit of OTP Core grew by 6% as declining operating result was offset by higher positive risk costs.
In 2Q the 44% quarterly jump was owing to bouncing back net fees, better risk costs and higher one-off
revenue items
The Revaluation result of the treasury share swap agreement showed among the one-off items caused HUF 7.1 billion q-o-q improvement. On this line
-HUF 1.8 billion negative revaluation result was recorded in 1Q 2018. The reason for this was that according to the structure of the swap agreement, the
extraordinary dividend announced by MOL Plc. reduced that net present value component of the swap deal which relates to the dividends. The realization of
the extraordinary dividend in 2Q 2018 neutralized the negative NPV-effect booked in 1Q. In 2Q 2018 both the extraordinary dividend (HUF 1.7 billion) and
the normal dividend (HUF 3.4 billion) paid by MOL Plc. was presented on this line in the total amount of HUF 5.1 bn.
2
2
1

36
Mortgage loan disbursement momentum remained strong in Hungary. OTP enjoys a dominant and even
improving market share in new mortgage and cash loan disbursements, as well as in retail savingsOTP Core
The cumulative amount of non-refundable CSOK subsidies
contracted at OTP Bank since the launch of the programme(HUF billion)
4Q
2017
2Q
2018
2Q
2016
3Q
2016
3Q
2017
85
38
77
1Q
2018
98
2Q
2017
5746
4Q
2016
1Q
2017
67
2718
1Q
2016
2 94
3Q
2015
4Q
2015
Change of mortgage loan application and disbursement of
OTP Bank (1H 2018, y-o-y changes)
35%
30%
Disbursements
New applications
OTP’s market share in mortgage loan contractual amounts
28.6%
2016
27.7%26.7%
2015
26.0%
2011
26.9% 29.3%
2014 1H
2018
2017
29.4%
2013
25.6%
2012
Market share in newly disbursed cash loans
35.4%
1H 2018
38.1%
20172016
36.0% 37.9%
2015
OTP Bank’s market share in household savings
2015 20172016
31.1%
1H
2018
31.6%30.7%
2012
27.9% 28.7%27.2%
2014
27.0%29.8%
2011 2013
Performing cash loan volume growth (y-o-y , FX-adjusted)
41%Growth of
performing cash
loan volumes

37
Corporate business had a successful 6M period, too: volumes grew further and corporate lending market
share improved by 0.8 pp ytd; the bank was also active in commercial factoring and disbursement of EU funds
OTP Group’s market share in loans to Hungarian companies1
1 Aggregated market share of OTP Bank, OTP Mortgage Bank, OTP Building Society and Merkantil, based on
central bank data (Supervisory Balance Sheet data provision until 2016 and Monetary Statistics from 2017.2 Source: Hungarian Factoring Association
7.5% 8.1%8.8% 9.1%
10.6%
12.4%13.0%
13.8%14.7%
13.9%14.7%
2008 2014 201520132009 2010 2011 2012 2016 2017 1H
2018
+96%
Performing loan volume change at micro and small
companies (FX-adjusted)
7%
14%11% 13% 12%
20172015 1H 182014 2016
-7%
-2%
14%19%
10%
2014 20162015 2017 1H 18
Performing medium and large corporate loan volume change
(FX-adjusted)
OTP Core
YTD
YTD
OTP Group’s market share in
commercial factoring
turnover2
52%61%
1H 2017 1H 2018
+9%p
MFB Points - the amount of
credit accepted through the
OTP network
(in HUF billion)
7
20
2017 1H 2018
+181%
38
DSK Bank Bulgaria
New cash loan disbursements (in HUF billion, without refinancing)
Income statement
Return on Equity
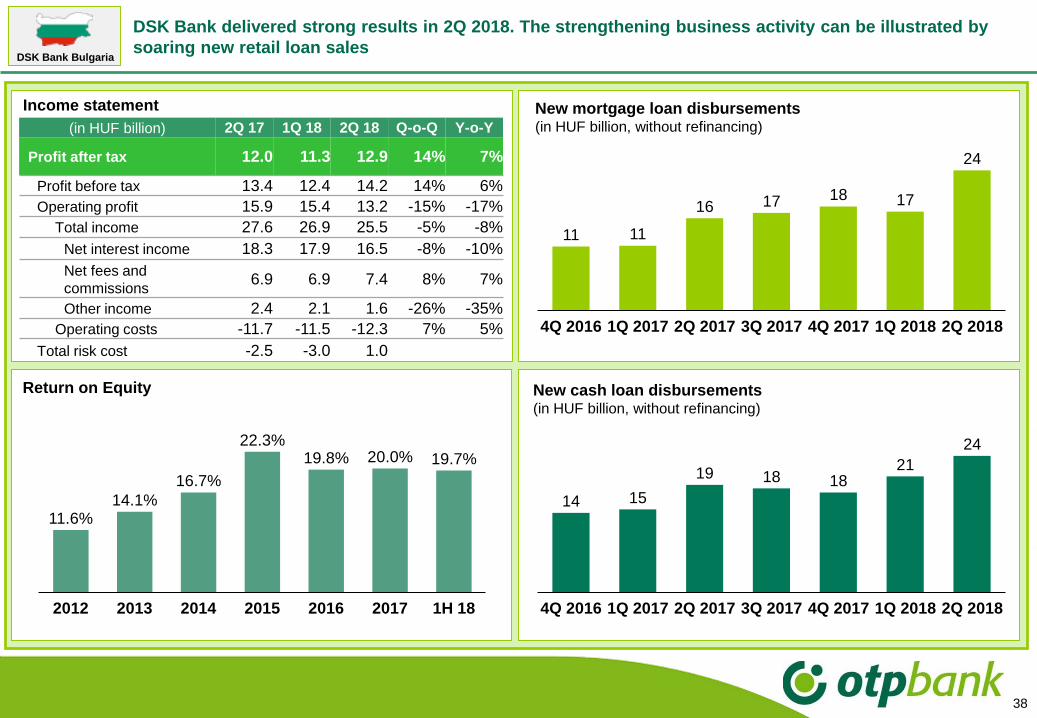
11.6%14.1%
16.7%
22.3%19.8% 20.0% 19.7%
2017 1H 182012 20162013 2014 2015
New mortgage loan disbursements (in HUF billion, without refinancing)
11 11
16 17 18 17
24
1Q 20174Q 2016 2Q 2017 1Q 20183Q 2017 4Q 2017 2Q 2018
DSK Bank delivered strong results in 2Q 2018. The strengthening business activity can be illustrated by
soaring new retail loan sales
(in HUF billion) 2Q 17 1Q 18 2Q 18 Q-o-Q Y-o-Y
Profit after tax 12.0 11.3 12.9 14% 7%
Profit before tax 13.4 12.4 14.2 14% 6%
Operating profit 15.9 15.4 13.2 -15% -17%
Total income 27.6 26.9 25.5 -5% -8%
Net interest income 18.3 17.9 16.5 -8% -10%
Net fees and
commissions6.9 6.9 7.4 8% 7%
Other income 2.4 2.1 1.6 -26% -35%
Operating costs -11.7 -11.5 -12.3 7% 5%
Total risk cost -2.5 -3.0 1.0
14 15
19 18 1821
24
3Q 20172Q 20174Q 2016 1Q 2017 4Q 2017 1Q 2018 2Q 2018

39
In 2Q the Russian profit decreased q-o-q due to seasonally higher risk cost, while operating profit improved
by 2% in RUB terms. Performing loan volumes grew in the main retail as well as corporate segments y-o-y.
Risk cost rate stood at 5.5% in 1H
Mikro- és kisvállalkozói hitelállomány y/y változása(árfolyamszűrt állományalakulás)
DPD0-90 loan volumes (FX-adjusted, in HUF billion)
POS
Credit card Other loans (mostly corporate)
Cash loan
148198
1H 2017 1H 2018
+34%
79 90
1H 2017 1H 2018
+15%53 75
1H 20181H 2017
+42%
89128
1H 2017 1H 2018
+44%
10.1%1
5.6%1
6.2%1
POS
Credit card
Cash loan
OTP Bank Russia - risk cost rates
(in HUF billion) 2Q 17 1Q 18 2Q 18 Q-o-Q Y-o-Y
Profit after tax 7.5 7.2 5.6 -22% -25%
Profit before tax 9.5 9.1 7.3 -20% -23%
Operating profit 19.2 16.4 16.2 -1% -16%
Total income 32.6 31.5 31.4 -1% -4%
Net interest income 26.1 25.2 24.8 -2% -5%
Net fees and
commissions6.1 6.2 6.5 4% 7%
Other income 0.3 0.1 0.1 6% -73%
Operating costs -13.3 -15.1 -15.2 1% 14%
Total risk cost -9.8 -7.3 -8.9 21% -9%
Income statement
Return on Equity
28.0%
1.3%
-10.0%-14.5%
20.2% 21.0%17.8%
2013 20152012 20162014 2017 1H 18
OTP Bank Russia
14.5%
16.8% 17.1%
7.3%7.6% 8.2%
5.5%
Cumulated ratio
– total loans
General note: from 1Q 2018 Touch Bank is presented as part of OTP Bank Russia. Until 4Q 2017 Touch Bank’s
performance was presented separately. 1 Quarterly risk cost rate in 2Q 2018
1Q 2Q 3Q 4Q 1Q 2Q 3Q 4Q 1Q 2Q 3Q 4Q 1Q 2Q 3Q 4Q 1Q 2Q 3Q 4Q 1Q 2Q 3Q 4Q 1Q 2Q
2012 2013 2014 2015 2016 2017 2018
40
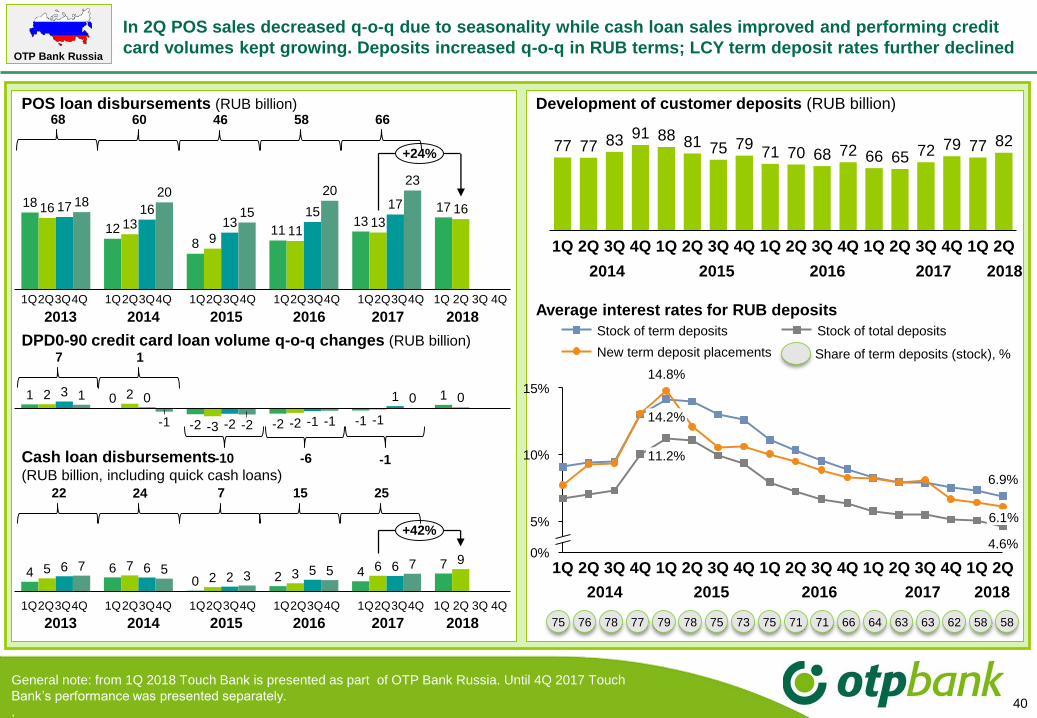
POS loan disbursements (RUB billion)
DPD0-90 credit card loan volume q-o-q changes (RUB billion)
Cash loan disbursements (RUB billion, including quick cash loans)
In 2Q POS sales decreased q-o-q due to seasonality while cash loan sales improved and performing credit
card volumes kept growing. Deposits increased q-o-q in RUB terms; LCY term deposit rates further declined
18
128
1113
1716
139
1113
1617 1613
151718
20
15
2023
+24%
1
-2 -2 -1
12 2
-3 -2 -1
03 0
-2 -1
11
-1 -2 -1
0 0
4 60 2 4
75 72 3
69
6 62
5 67 53 5
7
+42%
68 60 46
OTP Bank Russia
58
2013 2014 2015 2016 2017 2018
1Q 2Q3Q4Q 1Q 2Q3Q4Q 1Q 2Q3Q4Q 1Q 2Q3Q4Q 1Q 2Q3Q4Q 1Q 2Q 3Q 4Q
77 77 83 91 88 81 75 7971 70 68 72 66 65 72 79 77 82
4Q4Q1Q 2Q 1Q 3Q3Q 2Q 3Q 1Q 2Q 4Q 1Q 2Q 2Q3Q 4Q 1Q
2014 2015 2016 2017 2018
Development of customer deposits (RUB billion)
Average interest rates for RUB deposits
5%
10%
0%
15%
11.2%
1Q 3Q2Q
6.1%
3Q 4Q
14.2%
4Q
14.8%
1Q2Q 2Q 2Q3Q 4Q 1Q 2Q 4Q1Q 1Q3Q
6.9%
4.6%
Stock of term deposits
New term deposit placements
Stock of total deposits
Share of term deposits (stock), %
66
-10
75 76 78 77 79 7578 73 75
2013 2014 2015 2016 2017 2018
1Q 2Q3Q4Q 1Q 2Q3Q4Q 1Q 2Q3Q4Q 1Q 2Q3Q4Q 1Q 2Q3Q4Q 1Q 2Q 3Q 4Q
71 71
-6
22 24 7 15 25
66
7 1
64 63 63
-1
62
2014 2015 2016 2017 2018
58 58
General note: from 1Q 2018 Touch Bank is presented as part of OTP Bank Russia. Until 4Q 2017 Touch
Bank’s performance was presented separately.
.
41
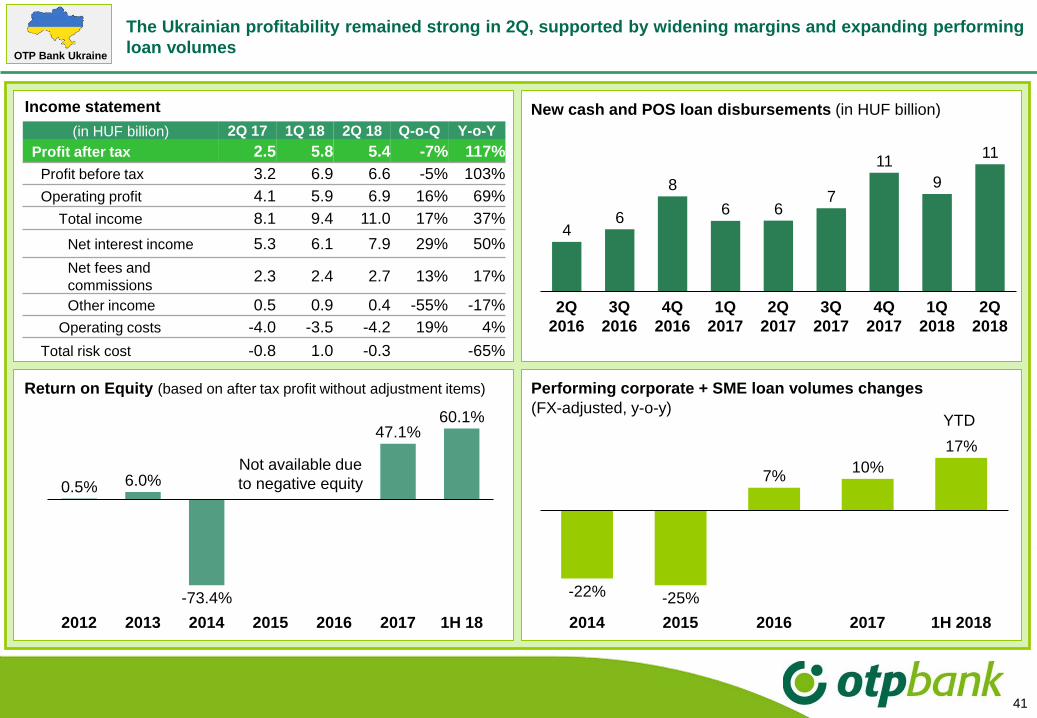
The Ukrainian profitability remained strong in 2Q, supported by widening margins and expanding performing
loan volumes
New cash and POS loan disbursements (in HUF billion)
Performing corporate + SME loan volumes changes
-22% -25%
7%10%
17%
1H 201820172014 2015 2016
(FX-adjusted, y-o-y)
(in HUF billion) 2Q 17 1Q 18 2Q 18 Q-o-Q Y-o-Y
Profit after tax 2.5 5.8 5.4 -7% 117%
Profit before tax 3.2 6.9 6.6 -5% 103%
Operating profit 4.1 5.9 6.9 16% 69%
Total income 8.1 9.4 11.0 17% 37%
Net interest income 5.3 6.1 7.9 29% 50%
Net fees and
commissions2.3 2.4 2.7 13% 17%
Other income 0.5 0.9 0.4 -55% -17%
Operating costs -4.0 -3.5 -4.2 19% 4%
Total risk cost -0.8 1.0 -0.3 -65%
Income statement
Return on Equity (based on after tax profit without adjustment items)
0.5% 6.0%
-73.4%
47.1%60.1%
2012 2013 1H 182014 2015 20172016
OTP Bank Ukraine
Not available due
to negative equity
46
8
6 67
11
9
11
1Q
2018
2Q
2016
3Q
2016
3Q
2017
4Q
2016
1Q
2017
4Q
2017
2Q
2018
2Q
2017
YTD
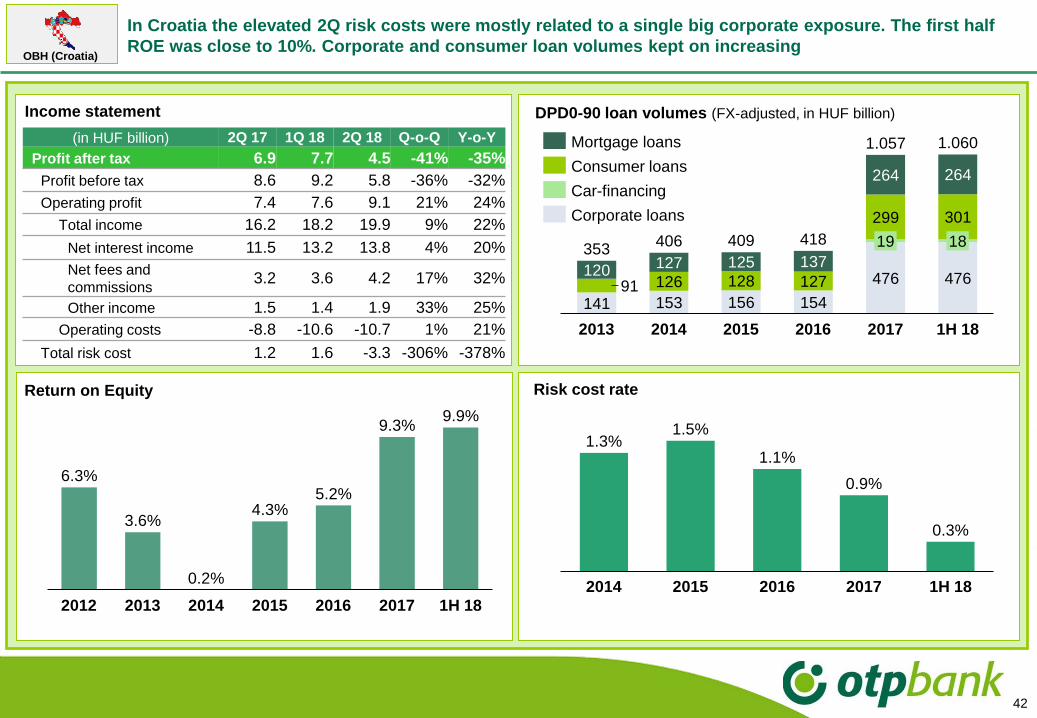
In Croatia the elevated 2Q risk costs were mostly related to a single big corporate exposure. The first half
ROE was close to 10%. Corporate and consumer loan volumes kept on increasing
42
OBH (Croatia)
DPD0-90 loan volumes (FX-adjusted, in HUF billion)
Risk cost rate
141 153 156 154
476 47691 126 128 127
299 301
120 127 125 137
264 264
1819
20162013
418
2014 20172015 1H 18
353406 409
1.057 1.060
1.1%
1H 1820152014
1.3%
2016 2017
1.5%
0.9%
0.3%
Mortgage loans
Car-financing
Consumer loans
Corporate loans
Income statement
Return on Equity
6.3%
3.6%4.3%
5.2%
9.3%9.9%
20142012 2013 20172015 2016 1H 18
0.2%
(in HUF billion) 2Q 17 1Q 18 2Q 18 Q-o-Q Y-o-Y
Profit after tax 6.9 7.7 4.5 -41% -35%
Profit before tax 8.6 9.2 5.8 -36% -32%
Operating profit 7.4 7.6 9.1 21% 24%
Total income 16.2 18.2 19.9 9% 22%
Net interest income 11.5 13.2 13.8 4% 20%
Net fees and
commissions3.2 3.6 4.2 17% 32%
Other income 1.5 1.4 1.9 33% 25%
Operating costs -8.8 -10.6 -10.7 1% 21%
Total risk cost 1.2 1.6 -3.3 -306% -378%
43
18.4% 18.4%19.2%
17.0%17.0%
16.4% 15.8% 14.7%
14.1% 12.2%
11.2%9.2% 8.9% 8.1%
2Q2Q2Q 1Q4Q 4Q 1Q4Q3Q3Q1Q3Q2Q1Q
108%
95%
110%99%
89%95%95%92%89%90%
98%99%97%93%
0.05 0.00
2.71
1.80
0.030.35
0.65 0.700.56
1.320.87
2.953.433.60
15 5 16
6
4 9 11
10 1012
0
2Q
7 8
4Q 1Q3Q
17
2Q
2531
1Q4Q
3
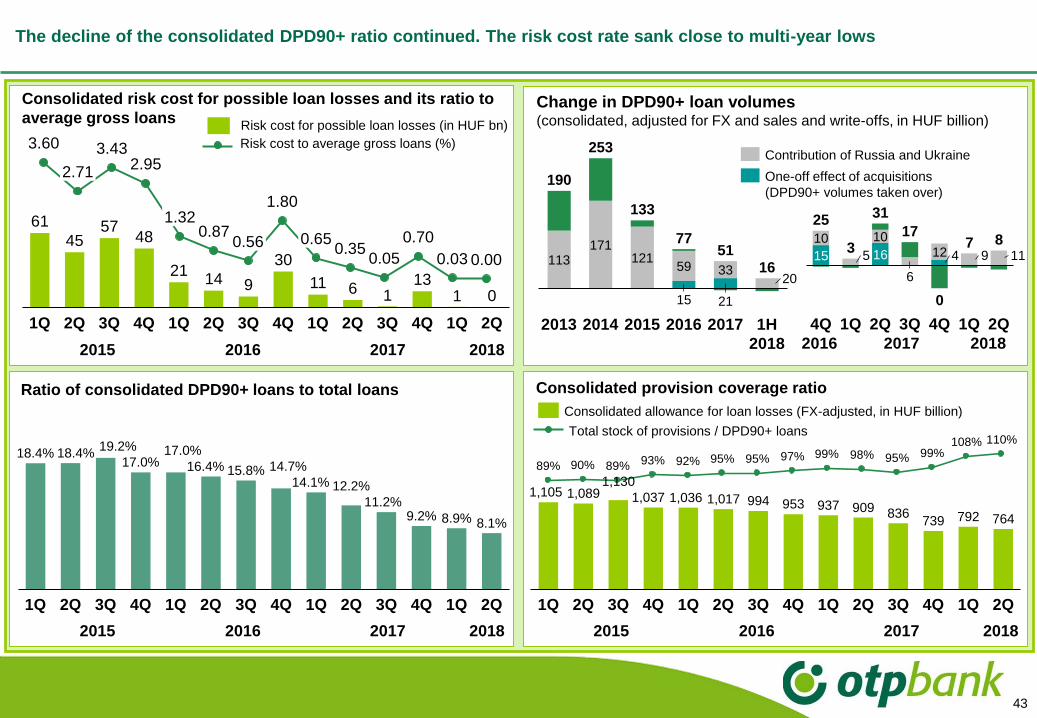
The decline of the consolidated DPD90+ ratio continued. The risk cost rate sank close to multi-year lows
1,105 1,0891,130
1,037 1,036 1,017 994 953 937 909 836739 792 764
4Q2Q3Q2Q 1Q1Q 3Q1Q4Q 2Q4Q2Q1Q 3Q
61
4557
48
2114 9
30
11 6 113
1
1Q 2Q2Q
0
1Q4Q 3Q 4Q1Q3Q2Q1Q4Q2Q 3Q
113171
121
15 21
2059 33
51
1H
2018
16
2016 2017
77
2015
133
2014
253
2013
190 One-off effect of acquisitions
(DPD90+ volumes taken over)
Contribution of Russia and Ukraine
Change in DPD90+ loan volumes(consolidated, adjusted for FX and sales and write-offs, in HUF billion)
Consolidated provision coverage ratioRatio of consolidated DPD90+ loans to total loans
Consolidated risk cost for possible loan losses and its ratio to
average gross loansRisk cost for possible loan losses (in HUF bn)
Risk cost to average gross loans (%)
Total stock of provisions / DPD90+ loans
Consolidated allowance for loan losses (FX-adjusted, in HUF billion)
2015 2016 2017 2018
2015 2016 2017 2018 2015 2016 2017 2018
2016 2017 2018
44
10
16
4
15
14
-4
2
15
3
25
31
7
0
17
8
1
-2 0 0
1
-1 0 0 0
1 1 0
0 -1
0 00 0
0 -2 -2 -1
2 1 1
0
01
83
-3
0
-2
42 2
13 107 8 9 8 7 7 9
15
-7-2-1 -2
1
-3
-11
-3
-1-1
3
-2 -1
15 14
-5-1
2 1 2 2 3 1
-1
0
0 -1
10 1
0 0
40
0
0 0 1 2 1
0-3
00
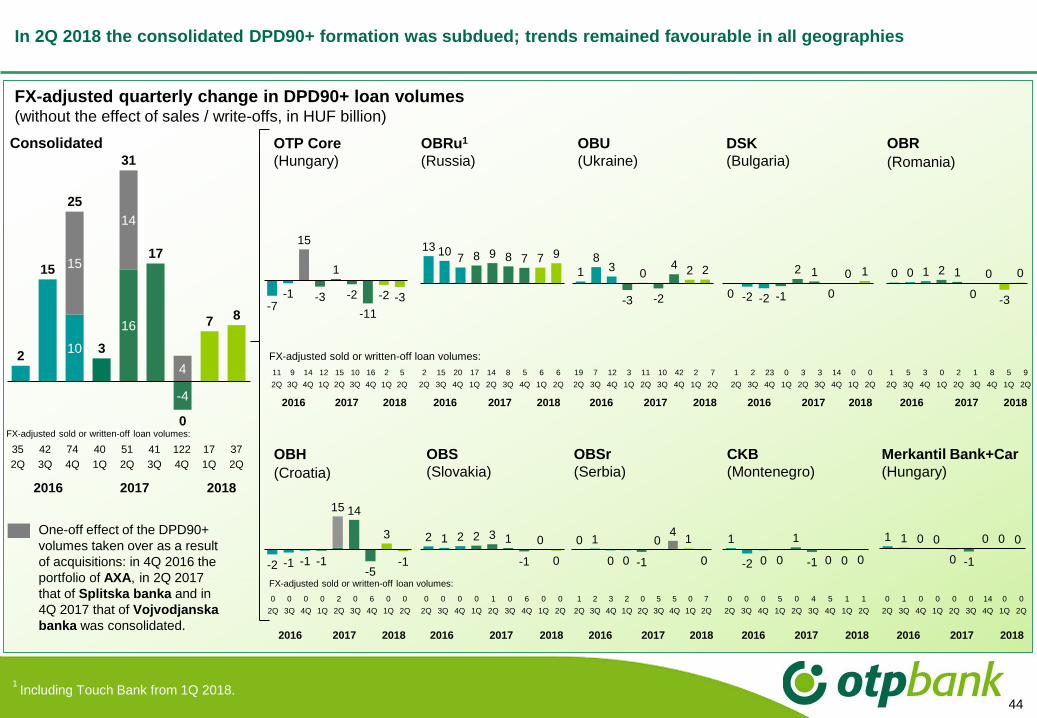
In 2Q 2018 the consolidated DPD90+ formation was subdued; trends remained favourable in all geographies
FX-adjusted sold or written-off loan volumes:
FX-adjusted sold or written-off loan volumes:
FX-adjusted sold or written-off loan volumes:
1 2 3 2 0 5 5 0 7
2Q 3Q 4Q 1Q 2Q 3Q 4Q 1Q 2Q
Consolidated OTP Core
(Hungary)
OBRu1
(Russia)
OBR
(Romania)
OBU
(Ukraine)
DSK
(Bulgaria)
CKB
(Montenegro)
OBSr
(Serbia)
Merkantil Bank+Car
(Hungary)
OBS
(Slovakia)
OBH
(Croatia)
FX-adjusted quarterly change in DPD90+ loan volumes(without the effect of sales / write-offs, in HUF billion)
35 42 74 40 51 41 122 17 37
2Q 3Q 4Q 1Q 2Q 3Q 4Q 1Q 2Q
11 9 14 12 15 10 16 2 5
2Q 3Q 4Q 1Q 2Q 3Q 4Q 1Q 2Q
2 15 20 17 14 8 5 6 6
2Q 3Q 4Q 1Q 2Q 3Q 4Q 1Q 2Q
19 7 12 3 11 10 42 2 7
2Q 3Q 4Q 1Q 2Q 3Q 4Q 1Q 2Q
1 2 23 0 3 3 14 0 0
2Q 3Q 4Q 1Q 2Q 3Q 4Q 1Q 2Q
1 5 3 0 2 1 8 5 9
2Q 3Q 4Q 1Q 2Q 3Q 4Q 1Q 2Q
0 0 0 0 2 0 6 0 0
2Q 3Q 4Q 1Q 2Q 3Q 4Q 1Q 2Q
0 0 0 0 1 0 6 0 0
2Q 3Q 4Q 1Q 2Q 3Q 4Q 1Q 2Q
0 0 0 5 0 4 5 1 1
2Q 3Q 4Q 1Q 2Q 3Q 4Q 1Q 2Q
0 1 0 0 0 0 14 0 0
2Q 3Q 4Q 1Q 2Q 3Q 4Q 1Q 2Q
One-off effect of the DPD90+
volumes taken over as a result
of acquisitions: in 4Q 2016 the
portfolio of AXA, in 2Q 2017
that of Splitska banka and in
4Q 2017 that of Vojvodjanska
banka was consolidated.
2016 2017 2018
2016 2017 2018 2016 2017 2018 2016 2017 2018 2016 2017 2018 2016 2017 2018
2016 2017 2018 2016 2017 2018 2016 2017 2018 2016 2017 2018 2016 2017 2018
1 Including Touch Bank from 1Q 2018.
45
6.2
3Q 4Q
7.5
2Q 2Q
5.5
1Q
6.48.3
2Q
-0.3
0.4
3Q
0.9
2Q1Q
1.40.1
4Q
18.4 15.3
1Q 2Q
15.3
4Q
15.8
3Q
17.2
2Q
111 116
3Q
117
2Q4Q 1Q
116
2Q
108 122
4Q3Q
119119
2Q 2Q
128
1Q
125134
3Q
130
2Q
127
1Q 2Q
140139
4Q
2Q2Q 1Q
-0.6-2.2
-1.1
4Q3Q
-1.9-1.4
3Q
81
2Q
82 88
4Q 2Q1Q
98 99
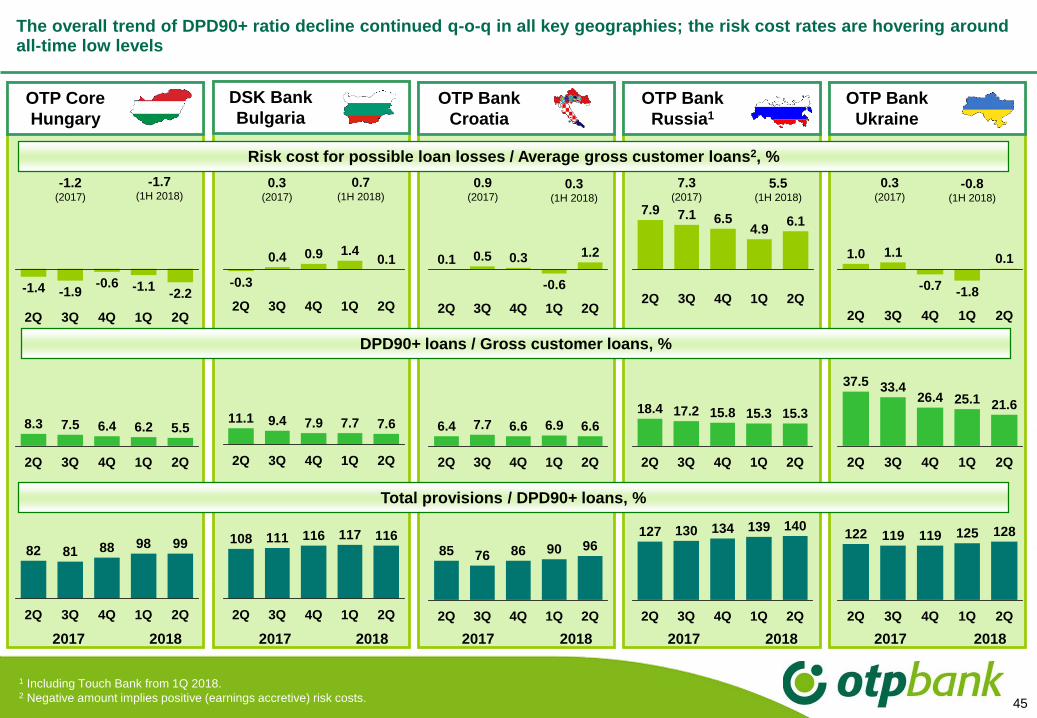
The overall trend of DPD90+ ratio decline continued q-o-q in all key geographies; the risk cost rates are hovering around all-time low levels
OTP Bank
Russia1
OTP Bank
Ukraine
DSK Bank
BulgariaOTP Core
Hungary
2Q1Q4Q3Q
1.1
-1.8
0.1
-0.7
2Q
1.0
2Q
7.16.1
4.9
4Q
6.5
2Q 1Q3Q
7.9
7.99.4
3Q
11.1
2Q 4Q
7.7 7.6
1Q 2Q
21.625.1
1Q 2Q4Q
26.4
3Q
33.437.5
2Q
2017 2018 2017 2018
-1.2(2017)
0.3(2017)
7.3(2017)
0.3(2017)
1 Including Touch Bank from 1Q 2018.2 Negative amount implies positive (earnings accretive) risk costs.
4Q 1Q
6.4
3Q
6.96.6
2Q 2Q
6.67.7
2Q
86
3Q2Q
90
1Q
96
4Q
7685
OTP Bank
Croatia
0.5
-0.6
1Q3Q2Q
0.1
4Q
1.20.3
2Q
0.9(2017)
Risk cost for possible loan losses / Average gross customer loans2, %
DPD90+ loans / Gross customer loans, %
Total provisions / DPD90+ loans, %
2017 2018 2017 2018 2017 2018
-1.7(1H 2018)
5.5(1H 2018)
0.3(1H 2018)
0.7(1H 2018)
-0.8(1H 2018)
46
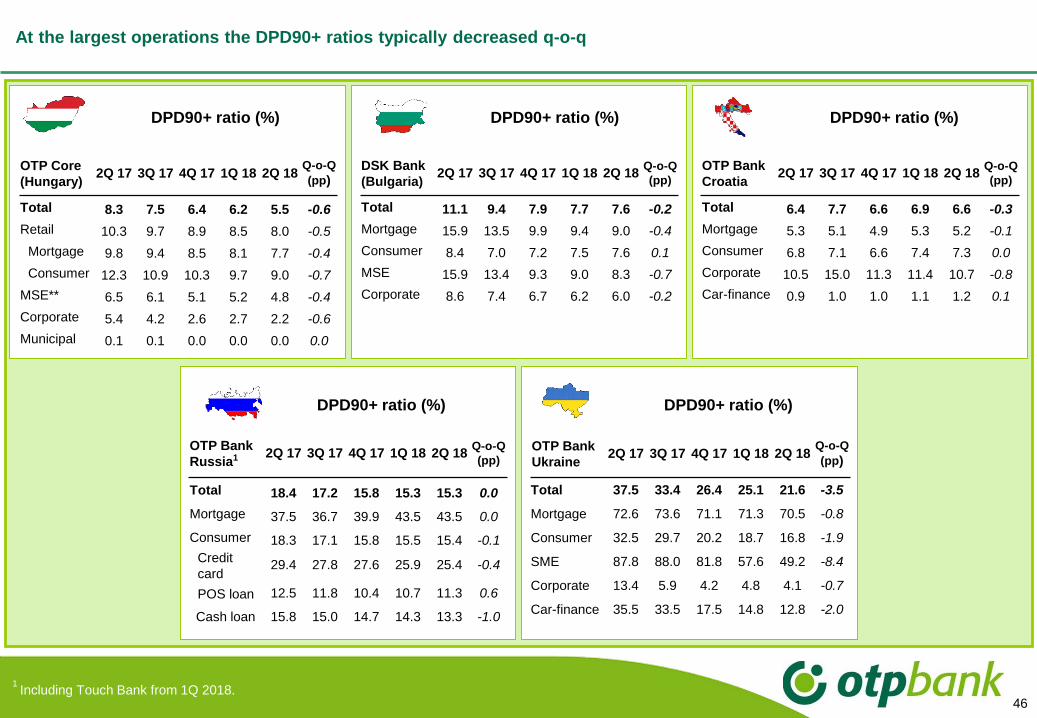
DPD90+ ratio (%)
DPD90+ ratio (%)
DPD90+ ratio (%)
DPD90+ ratio (%)
OTP Core
(Hungary)2Q 17 3Q 17 4Q 17 1Q 18 2Q 18
Q-o-Q
(pp)
Total 8.3 7.5 6.4 6.2 5.5 -0.6
Retail 10.3 9.7 8.9 8.5 8.0 -0.5
Mortgage 9.8 9.4 8.5 8.1 7.7 -0.4
Consumer 12.3 10.9 10.3 9.7 9.0 -0.7
MSE** 6.5 6.1 5.1 5.2 4.8 -0.4
Corporate 5.4 4.2 2.6 2.7 2.2 -0.6
Municipal 0.1 0.1 0.0 0.0 0.0 0.0
OTP Bank
Russia1 2Q 17 3Q 17 4Q 17 1Q 18 2Q 18Q-o-Q
(pp)
Total 18.4 17.2 15.8 15.3 15.3 0.0
Mortgage 37.5 36.7 39.9 43.5 43.5 0.0
Consumer 18.3 17.1 15.8 15.5 15.4 -0.1
Credit
card29.4 27.8 27.6 25.9 25.4 -0.4
POS loan 12.5 11.8 10.4 10.7 11.3 0.6
Cash loan 15.8 15.0 14.7 14.3 13.3 -1.0
OTP Bank
Ukraine 2Q 17 3Q 17 4Q 17 1Q 18 2Q 18
Q-o-Q
(pp)
Total 37.5 33.4 26.4 25.1 21.6 -3.5
Mortgage 72.6 73.6 71.1 71.3 70.5 -0.8
Consumer 32.5 29.7 20.2 18.7 16.8 -1.9
SME 87.8 88.0 81.8 57.6 49.2 -8.4
Corporate 13.4 5.9 4.2 4.8 4.1 -0.7
Car-finance 35.5 33.5 17.5 14.8 12.8 -2.0
At the largest operations the DPD90+ ratios typically decreased q-o-q
OTP Bank
Croatia2Q 17 3Q 17 4Q 17 1Q 18 2Q 18
Q-o-Q
(pp)
Total 6.4 7.7 6.6 6.9 6.6 -0.3
Mortgage 5.3 5.1 4.9 5.3 5.2 -0.1
Consumer 6.8 7.1 6.6 7.4 7.3 0.0
Corporate 10.5 15.0 11.3 11.4 10.7 -0.8
Car-finance 0.9 1.0 1.0 1.1 1.2 0.1
DPD90+ ratio (%) DPD90+ ratio (%)
DSK Bank
(Bulgaria)2Q 17 3Q 17 4Q 17 1Q 18 2Q 18
Q-o-Q
(pp)
Total 11.1 9.4 7.9 7.7 7.6 -0.2
Mortgage 15.9 13.5 9.9 9.4 9.0 -0.4
Consumer 8.4 7.0 7.2 7.5 7.6 0.1
MSE 15.9 13.4 9.3 9.0 8.3 -0.7
Corporate 8.6 7.4 6.7 6.2 6.0 -0.2
1 Including Touch Bank from 1Q 2018.
47
1
OTP Group consolidated capital adequacy ratios (IFRS) Capital adequacy ratios (under local regulation)
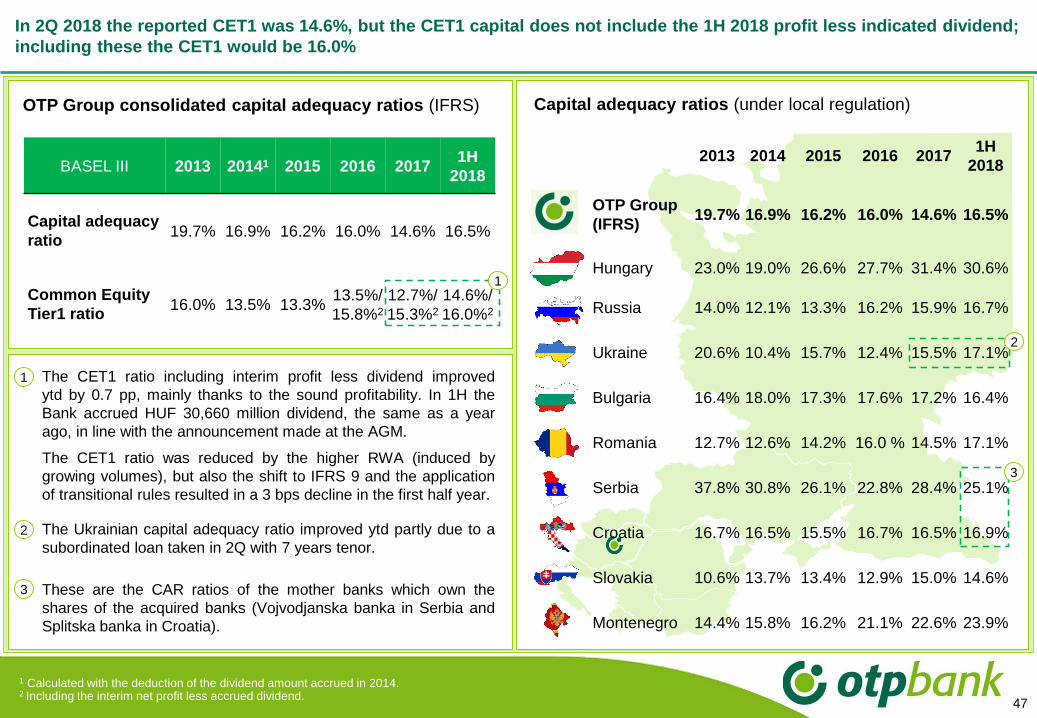
In 2Q 2018 the reported CET1 was 14.6%, but the CET1 capital does not include the 1H 2018 profit less indicated dividend;
including these the CET1 would be 16.0%
The CET1 ratio including interim profit less dividend improved
ytd by 0.7 pp, mainly thanks to the sound profitability. In 1H the
Bank accrued HUF 30,660 million dividend, the same as a year
ago, in line with the announcement made at the AGM.
The CET1 ratio was reduced by the higher RWA (induced by
growing volumes), but also the shift to IFRS 9 and the application
of transitional rules resulted in a 3 bps decline in the first half year.
BASEL III 2013 20141 2015 2016 20171H
2018
Capital adequacy
ratio19.7% 16.9% 16.2% 16.0% 14.6% 16.5%
Common Equity
Tier1 ratio16.0% 13.5% 13.3%
13.5%/
15.8%2
12.7%/
15.3%2
14.6%/
16.0%2
2013 2014 2015 2016 20171H
2018
OTP Group
(IFRS)19.7% 16.9% 16.2% 16.0% 14.6% 16.5%
Hungary 23.0% 19.0% 26.6% 27.7% 31.4% 30.6%
Russia 14.0% 12.1% 13.3% 16.2% 15.9% 16.7%
Ukraine 20.6% 10.4% 15.7% 12.4% 15.5% 17.1%
Bulgaria 16.4% 18.0% 17.3% 17.6% 17.2% 16.4%
Romania 12.7% 12.6% 14.2% 16.0 % 14.5% 17.1%
Serbia 37.8% 30.8% 26.1% 22.8% 28.4% 25.1%
Croatia 16.7% 16.5% 15.5% 16.7% 16.5% 16.9%
Slovakia 10.6% 13.7% 13.4% 12.9% 15.0% 14.6%
Montenegro 14.4% 15.8% 16.2% 21.1% 22.6% 23.9%
1
1 Calculated with the deduction of the dividend amount accrued in 2014.2 Including the interim net profit less accrued dividend.
3
2 The Ukrainian capital adequacy ratio improved ytd partly due to a
subordinated loan taken in 2Q with 7 years tenor.
3 These are the CAR ratios of the mother banks which own the
shares of the acquired banks (Vojvodjanska banka in Serbia and
Splitska banka in Croatia).
2
48
Last update: 21/09/2018Sovereign ratings: long term foreign currency government bond ratings, OTP Mortgage Bank Moody’s rating: covered bond rating; Other bank ratings: long term foreign currency deposit ratingsAbbreviations: BG - Bulgaria, CR - Croatia, HU - Hungary, MN - Montenegro, RO - Romania, RU - Russia, SRB - Serbia, SK - Slovakia, UA - Ukraine
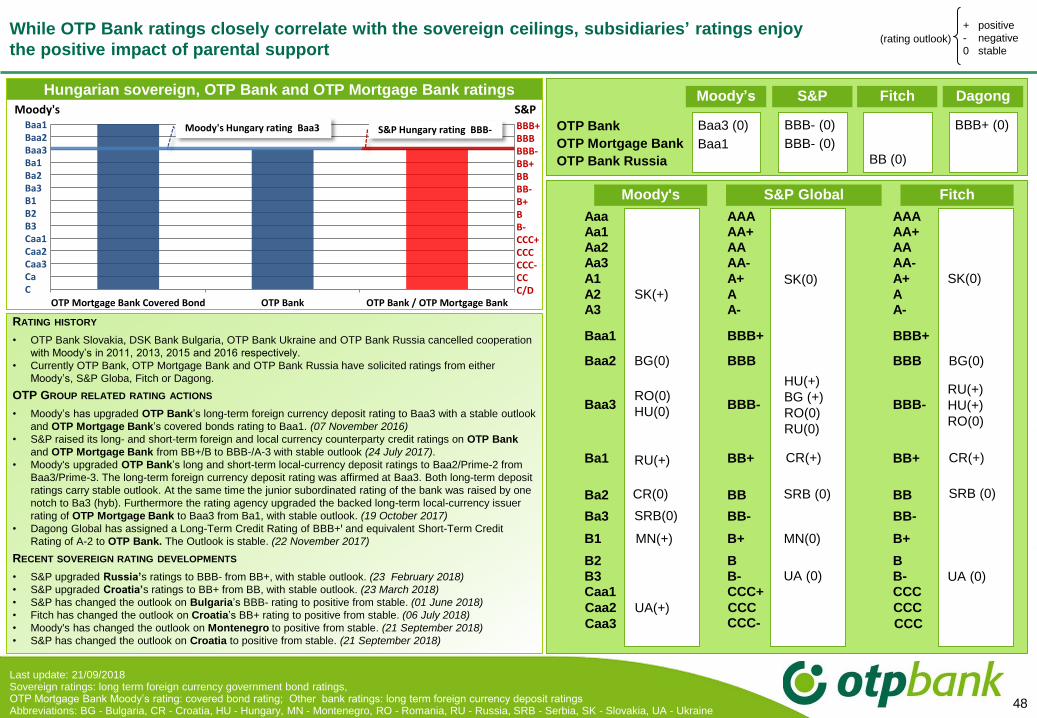
(rating outlook)While OTP Bank ratings closely correlate with the sovereign ceilings, subsidiaries’ ratings enjoy
the positive impact of parental support
Hungarian sovereign, OTP Bank and OTP Mortgage Bank ratings
RATING HISTORY
• OTP Bank Slovakia, DSK Bank Bulgaria, OTP Bank Ukraine and OTP Bank Russia cancelled cooperation
with Moody’s in 2011, 2013, 2015 and 2016 respectively.
• Currently OTP Bank, OTP Mortgage Bank and OTP Bank Russia have solicited ratings from either
Moody’s, S&P Globa, Fitch or Dagong.
OTP GROUP RELATED RATING ACTIONS
• Moody’s has upgraded OTP Bank’s long-term foreign currency deposit rating to Baa3 with a stable outlook
and OTP Mortgage Bank’s covered bonds rating to Baa1. (07 November 2016)
• S&P raised its long- and short-term foreign and local currency counterparty credit ratings on OTP Bank
and OTP Mortgage Bank from BB+/B to BBB-/A-3 with stable outlook (24 July 2017).
• Moody's upgraded OTP Bank’s long and short-term local-currency deposit ratings to Baa2/Prime-2 from
Baa3/Prime-3. The long-term foreign currency deposit rating was affirmed at Baa3. Both long-term deposit
ratings carry stable outlook. At the same time the junior subordinated rating of the bank was raised by one
notch to Ba3 (hyb). Furthermore the rating agency upgraded the backed long-term local-currency issuer
rating of OTP Mortgage Bank to Baa3 from Ba1, with stable outlook. (19 October 2017)
• Dagong Global has assigned a Long-Term Credit Rating of BBB+ꞌ and equivalent Short-Term Credit
Rating of A-2 to OTP Bank. The Outlook is stable. (22 November 2017)
RECENT SOVEREIGN RATING DEVELOPMENTS
• S&P upgraded Russia’s ratings to BBB- from BB+, with stable outlook. (23 February 2018)
• S&P upgraded Croatia’s ratings to BB+ from BB, with stable outlook. (23 March 2018)
• S&P has changed the outlook on Bulgaria’s BBB- rating to positive from stable. (01 June 2018)
• Fitch has changed the outlook on Croatia’s BB+ rating to positive from stable. (06 July 2018)
• Moody's has changed the outlook on Montenegro to positive from stable. (21 September 2018)
• S&P has changed the outlook on Croatia to positive from stable. (21 September 2018)
Aaa AAA AAAAa1 AA+ AA+Aa2 AA AAAa3 AA- AA-
A1 A+ A+ SK(0)
A2 SK(+) ASK(0)
AA3 A- A-
Baa1 BBB+ BBB+
Baa2 BG(0) BBB BBB
Baa3RO(0)
HU(0)BBB- BBB-
RU(+)
HU(+)
RO(0)
Ba1 RU(+) BB+ BB+
Ba2 BB BB
Ba3 BB- BB-
B1 B+ MN(0) B+
B2 B B
B3 B- B-Caa1 CCC+ CCC
UA (0)
Moody's S&P Global Fitch
SRB (0)
UA(+)Caa2 CCC
UA (0)
CCC
Caa3 CCC- CCC
HU(+)
BG (+)
RO(0)
RU(0)
SRB (0)
+ positive
- negative
0 stable
CR(0)
SRB(0)
MN(+)
1
2
3
4
5
6
7
8
9
10
11
12
13
14
1
2
3
4
5
6
7
8
9
10
11
12
13
14
OTP Mortgage Bank Covered Bond OTP Bank OTP Bank / OTP Mortgage Bank
Baa1Baa2Baa3Ba1Ba2Ba3B1B2B3Caa1Caa2Caa3CaC
BBB+BBBBBB-BB+BBBB-B+BB-CCC+CCCCCC-CCC/D
Moody's Hungary rating Baa3 S&P Hungary rating BBB-
Moody's S&P
OTP Bank
OTP Mortgage Bank
OTP Bank Russia
Baa3 (0)
Baa1
BBB- (0)
BBB- (0)
BB (0)
S&P Fitch
BBB+ (0)
DagongMoody’s
BG(0)
CR(+)CR(+)
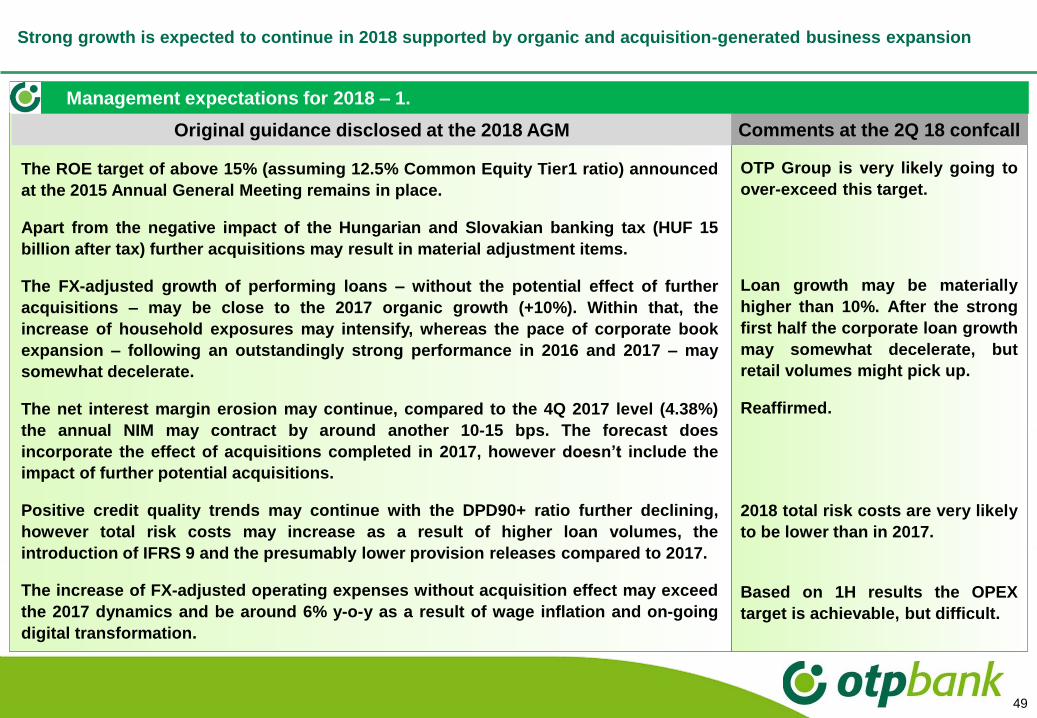
Strong growth is expected to continue in 2018 supported by organic and acquisition-generated business expansion
49
Management expectations for 2018 – 1.
The ROE target of above 15% (assuming 12.5% Common Equity Tier1 ratio) announced
at the 2015 Annual General Meeting remains in place.
Apart from the negative impact of the Hungarian and Slovakian banking tax (HUF 15
billion after tax) further acquisitions may result in material adjustment items.
The FX-adjusted growth of performing loans – without the potential effect of further
acquisitions – may be close to the 2017 organic growth (+10%). Within that, the
increase of household exposures may intensify, whereas the pace of corporate book
expansion – following an outstandingly strong performance in 2016 and 2017 – may
somewhat decelerate.
The net interest margin erosion may continue, compared to the 4Q 2017 level (4.38%)
the annual NIM may contract by around another 10-15 bps. The forecast does
incorporate the effect of acquisitions completed in 2017, however doesn’t include the
impact of further potential acquisitions.
Positive credit quality trends may continue with the DPD90+ ratio further declining,
however total risk costs may increase as a result of higher loan volumes, the
introduction of IFRS 9 and the presumably lower provision releases compared to 2017.
The increase of FX-adjusted operating expenses without acquisition effect may exceed
the 2017 dynamics and be around 6% y-o-y as a result of wage inflation and on-going
digital transformation.
Original guidance disclosed at the 2018 AGM Comments at the 2Q 18 confcall
OTP Group is very likely going to
over-exceed this target.
Loan growth may be materially
higher than 10%. After the strong
first half the corporate loan growth
may somewhat decelerate, but
retail volumes might pick up.
Reaffirmed.
2018 total risk costs are very likely
to be lower than in 2017.
Based on 1H results the OPEX
target is achievable, but difficult.

The expected amount of proposed dividend to be paid after the 2018 financial year depends on the future acquisitions.
2018 adjusted after tax profit might reach EUR 1 billion
50
Management expectations for 2018 – 2.
Beyond the capital required for organic growth the management intends to allocate significant part of the generated
excess capital for further value-creating acquisitions:
o The dividend amount to be paid from 2018 earnings depends primarily on the impact of completed future
acquisitions. Subject to these deals, the final dividend proposal will be decided at the beginning of 2019.
o As for the indicated / deducted dividend amount presented among the financial data in the quarterly Stock
Exchange Reports in 2018, the basis for the calculation will be the dividend proposal after the 2017 financial year
(HUF 61.32 billion). However, the final dividend proposal can differ from this amount.
According to the guidance provided by the Chairman-CEO in September 2018, the full-year 2018 adjusted after tax
profit might reach EUR 1 billion, assuming the current level of EURHUF rate.
51
Content
Investment Rationale 3-14
2Q 2018 Financial Performance of OTP Group 16-50
Macroeconomic overview 52-58

52
Sources: CSO, NBH; forecasts: OTP Research Centre1 Without inter-company loans2 Seasonally adjusted annualized figure
3.4%2.2%
4.0% 4.4% 4.0%
20162015 2017 2018F 2019F
7.7%5.8% 7.1% 5.8% 6.0%
7,536
2017
37,997
12,515
20152014 1H 18
37,182
2016
9,633
1.6%2.9%1.0%6.1%
2003-
2007
-7.8%
1Q 2018
57.2%114.3%
3Q 2010
22.0% 21.5%19.3%
24.7%23.5%
4.8%5.3%3.4%
4.7%4.9%
OTP Research expects 4.4% economic growth in Hungary in 2018; in 1H 2018 it reached 4.5% y-o-y.
Growth is forecasted to stay at around 4% in 2019Hungary
Real GDP growth
Export growth
Investment to GDP
Housing construction permits
GrowthBalance
Real wage growth
Current account balance
Gross external debt1 (in % of GDP)
Household consumption
4.4%
9.3%
4.5%6.1% 7.1%
Budget deficit
7.1% 2.4%1.7% 2.0% 2.0%
2018F 2019F2016 20172003-
2007
2019F2018F2016 20172015 2017 2019F2018F2016
2015 2017 2019F2018F2016
2015 2017 2019F2018F2016
2015 2017 2019F2016 2018F2

53
The government intends to spend more on investments, but the overall fiscal discipline is expected to persist.
The current account surplus moderated, while external indebtedness fell further
The budget deficit might reach 2.4%
of GDP in 2018, marginally higher
than the 2% in 2017, as temporary
revenues from the corporate tax
credit fell out. Furthermore, while
revenue growth remained strong,
expenditures were temporary
boosted by public investments
before the elections, so the four
quarters average deficit widened to
3% of GDP in 1Q. Public debt
moderated further, despite the high
financing requirement from the pre-
financing of EU-fund-related
projects.
After hitting an all-time high surplus
of 6.1% of GDP in 2016 as a whole,
the C/A balance started to shrink
slowly due to stronger domestic
demand and higher energy prices.
External debt fell further, gross
external debt fell below 60% of GDP,
very close to levels characteristic for
the CEE region, while net and
short-term debt moderated to 13%.
Sources: HCSO, MNB, Ministry for National Economy, OTP ResearchThe net financial capacity shows the amount of absorbed external funding / accumulated foreign assets in a period (equals to the sum of the current account balance + capital balance (EU funds) + Net errors and omissions)
Current account balance (as % of GDP) External debt indicators (as % of GDP)
Hungary
Budget balance (as % of GDP) Public debt (as % of GDP)
114.3
66.8
59.1
57.2
0
10
20
30
40
50
60
70
80
90
100
110
120
130
140
2002/Q
1
2003/Q
1
2004/Q
1
2005/Q
1
2006/Q
1
2007/Q
1
2008/Q
1
2009/Q
1
2010/Q
1
2011/Q
1
2012/Q
1
2013/Q
1
2014/Q
1
2015/Q
1
2016/Q
1
2017/Q
1
2018/Q
1
Gross Ext. Debt.
Net Ext. Debt
Short Ext. Debt
MAX
17Q1
Last data
%
17 Q4
-12.5
-10.0
-7.5
-5.0
-2.5
0.0
2.5
5.0
7.5
200
2/Q
1
200
3/Q
1
200
4/Q
1
200
5/Q
1
200
6/Q
1
200
7/Q
1
200
8/Q
1
200
9/Q
1
201
0/Q
1
201
1/Q
1
201
2/Q
1
201
3/Q
1
201
4/Q
1
201
5/Q
1
201
6/Q
1
201
7/Q
1
201
8/Q
1

54
The zero interest rate environment may come to an end in 2019
CPI reached 3.4% in July, due to thesharp rise in fuel prices. After hittingthe peak we expect inflation graduallyto moderate and fall below the 3%target in early autumn, as inflationcontribution of fuel prices will fallgradually from the current above 1percentage point level. Than weexpect the inflation to remain belowthe NBH 3% target both in 2018 and2019.
Even though the current phase of theeconomic cycle points to acceleratingCPI, it is still offset by a number offactors (e.g. VAT & social securitycontributions cuts, moderate food andimported inflation, unchangedadministrative prices).
However, as underlying inflation is onthe rise and could exceed 3% in 2H2019 we expect the National Bank tostart a cautious monetary tightening in2019, by phasing out unconventionalmeasures in the first half of the year,driving up BUBOR rates toward thebase rate, which could be followed bybase rate hikes in the second half of2019.
Sources: HCSO, NBH, Reuters, OTP Research
Wage growth in the economy (3M rolling y-o-y,%)
Hungary
Base rate & 3M BUBOR (%)
Inflation (y-o-y, %)
Real estate market indicators (real home price
and completed dwellings; 2000=100)
-10
-5
0
5
10
15
20
04
.03
20
04
.10
20
05
.05
20
05
.12
20
06
.07
20
07
.02
20
07
.09
20
08
.04
20
08
.11
20
09
.06
20
10
.01
20
10
.08
20
11
.03
20
11
.10
20
12
.05
20
12
.12
20
13
.07
20
14
.02
20
14
.09
20
15
.04
20
15
.11
20
16
.06
20
17
.01
20
17
.08
20
18
.03
Public sector wage Private sector wage
0%
2%
4%
6%
8%
10%
12%
14%
06
.01
06
.08
07
.03
07
.10
08
.05
08
.12
09
.07
10
.02
10
.09
11
.04
11
.11
12
.06
13
.01
13
.08
14
.03
14
.10
15
.05
15
.12
16
.07
17
.02
17
.09
18
.04
18
.11
19
.06
-2
-1
0
1
2
3
4
5
6
7
8
-2
0
2
4
6
8
20
12
.01
20
12
.05
20
12
.09
20
13
.01
20
13
.05
20
13
.09
20
14
.01
20
14
.05
20
14
.09
20
15
.01
20
15
.05
20
15
.09
20
16
.01
20
16
.05
20
16
.09
20
17
.01
20
17
.05
20
17
.09
20
18
.01
20
18
.05
20
18
.09
20
19
.01
20
19
.05
20
19
.09
Filtered inflation CPI
Forecast
target band
60
80
100
120
140
160
0
50
100
150
200
250
2000
/Q1
2000
/Q4
2001
/Q3
2002
/Q2
2003
/Q1
2003
/Q4
2004
/Q3
2005
/Q2
2006
/Q1
2006
/Q4
2007
/Q3
2008
/Q2
2009
/Q1
2009
/Q4
2010
/Q3
2011
/Q2
2012
/Q1
2012
/Q4
2013
/Q3
2014
/Q2
2015
/Q1
2015
/Q4
2016
/Q3
2017
/Q2
2018
/Q1

2018 is likely to be even more encouraging than 2017 with close to 4.5% GDP growth, moderate inflation,
low budget deficit and declining external debt
Key economic indicators OTP Research Focus Economics*
2014 2015 2016 2017 2018F 2019F 2018F 2019F
Nominal GDP (at current prices, HUF billion) 32,400 33,999 35,005 37,520 40,300 43,517 40,726 43,212
Real GDP change 4.2% 3.4% 2.2% 4.0% 4.4% 4.0% 4.0% 3.1%
Household final consumption 2.1% 3.1% 4.2% 4.1% 4.6% 4.0% 4.7% 3.6%
Household consumption expenditure 2.5% 3.4% 4.9% 4.7% 5.3% 4.8%
Collective consumption 9.2% 0.6% 0.1% -0.4% 1.1% 1.1% 2.0% 1.5%
Gross fixed capital formation 9.9% 1.9% -15.5% 16.8% 13.4% 9.8% 10.6% 5.2%
Exports 9.8% 7.7% 5.8% 7.1% 5.8% 6.0%
Imports 10.9% 6.1% 5.7% 9.7% 6.8% 6.8%
General government balance (% of GDP) -2.6% -1.9% -1.7% -2.0% -2.4% -2.0% -2.4% -2.2%
General government debt (% of GDP ESA 2010) 75.2% 74.8% 73.9% 73.6% 73.3% 71.1% 71.8% 70.4%
Current account (% of GDP)** 1.5% 3.5% 6.1% 2.9% 1.6% 1.0% 2.0% 1.8%
Gross external debt (% GDP)*** 82.4% 73.0% 67.9% 58.9%
FX reserves (in EUR billion) 34.6 30.3 24.4 23.4
Gross real wages 3.8% 4.4% 6.1% 9.3% 7.1% 4.9%
Gross real disposable income 4.4% 4.4% 2.3% 4.8% 4.5% 3.1%
Employment (annual change) 5.3% 2.7% 3.4% 1.7% 0.6% 0.3%
Unemployment rate (annual average) 7.7% 6.8% 5.1% 4.2% 3.9% 3.9% 3.9% 3.8%
Inflation (annual average) -0.2% -0.1% 0.4% 2.4% 2.6% 2.4% 2.6% 3.0%
Base rate (end of year) 2.10% 1.35% 0.90% 0.90% 0.90% 1.65% 0.90% 1.26%
1Y Treasury Bill (average) 2.28% 1.17% 0.77% 0.09% 0.41% 1.45%
Real interest rate (average. ex post)**** 2.5% 1.2% 0.4% -2.3% -2.1% -0.9%
EUR/HUF exchange rate (end of year) 314.9 313.1 311.0 310.1 325.0 325.0 320.0 318.0
Hungary
55
Source: CSO, National Bank of Hungary.
* Augustus 2018 consensus . **Official data of balance of payments (excluding net errors and omissions).
*** w/o FDI related intercompany lending. last data. **** = (1+ Yield of the 1Y Treasury Bill (average) ) / (1+ annual average inflation) – 1

56
Source: CBR, Rosstat, Ukrstat, National Bank of Ukraine, Focus Economics
*annualized q-o-q growth is OTP Research estimate
Russia: slow recovery continues, supported by higher oil prices, rate cuts on hold due to the VAT hike in 2019, geopolitical
risks rose further. Ukraine: GDP growth was 3.6% y-o-y in 2Q 2018, inflation is below 10%, IMF visit is due in September
Russia
GDP growth stood at 1.8% in 2Q 18.
Higher oil prices brought the budget into balance,
and improved the current account. Disinflation
bottomed out as the RUB weakened and
domestic demand recovered. The government
submitted the 2019-2021 budget framework
containing ambitious spending plans and tax
hikes, while kept the overall budget in surplus.
Though the exchange rate has stabilized,
government bond yields increased during the
emerging market sell-of in June. The CBR put on
hold the rate cut cycle due to the effect of
foreseeable VAT hike in 2019. Slow recovery
could continue with higher lending flows. Despite
a strong financial position, proposed new US
sanction bills hit RUB assets sharply, the
USD/RUB weakened to 69 in mid-August and
government bond yields widened.
Ukraine
In 1Q 2018 the main driver of growth was strong
consumption growth and investment activity. In
2Q 2018, GDP grew by 3.6% y-o-y, which is
equivalent of a 1% q-o-q growth. Based on
monthly indicators, consumption was the main
driver behind the good growth figure. Inflation
slowed from 13.7% in December 2017 to 8.9% in
July 2018. The NBU has increased its base rate
to 17.5% in July. Forthcoming IMF visit is
expected in September and the next tranche may
arrive after that. In that case the World Bank will
also provide USD 650 million loan guarantee.
Real GDP growth (%, SA, annualized
quarterly* and y-o-y)
USD/UAH (r.a., %), base rate (r.a.,
%), and Inflation (%)
Fiscal balance (l.a.) and
government debt (r.a.) as % of GDP
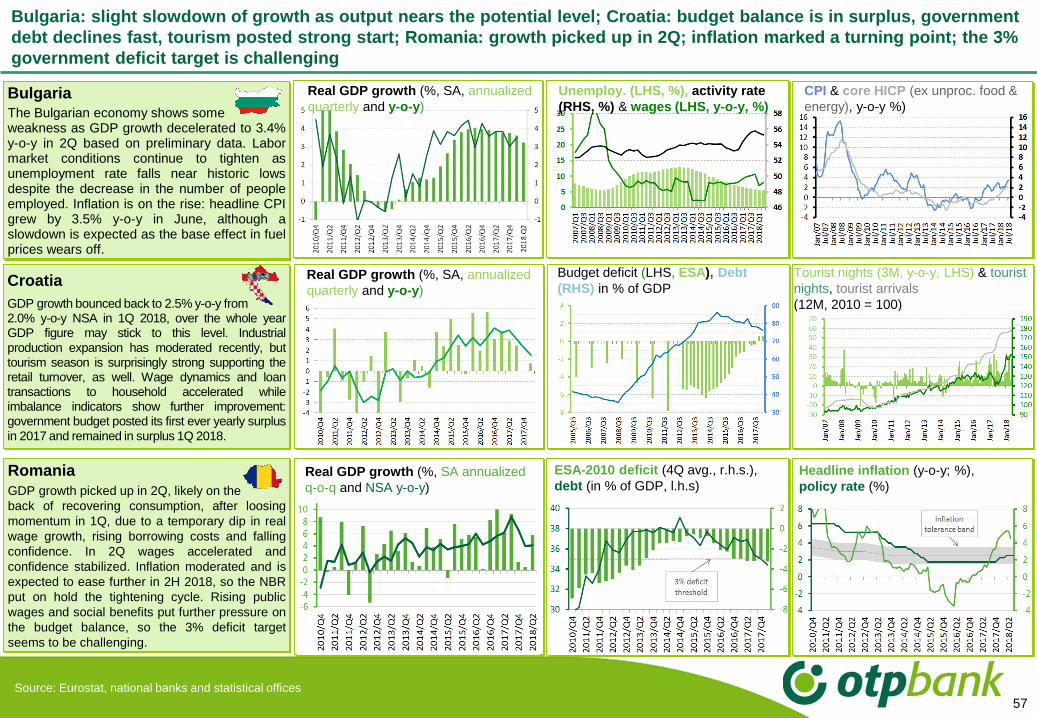
57
Source: Eurostat, national banks and statistical offices
Bulgaria: slight slowdown of growth as output nears the potential level; Croatia: budget balance is in surplus, government
debt declines fast, tourism posted strong start; Romania: growth picked up in 2Q; inflation marked a turning point; the 3%
government deficit target is challenging
Croatia
GDP growth bounced back to 2.5% y-o-y from2.0% y-o-y NSA in 1Q 2018, over the whole yearGDP figure may stick to this level. Industrial
production expansion has moderated recently, buttourism season is surprisingly strong supporting theretail turnover, as well. Wage dynamics and loantransactions to household accelerated whileimbalance indicators show further improvement:government budget posted its first ever yearly surplus
in 2017 and remained in surplus 1Q 2018.
Real GDP growth (%, SA, annualized
quarterly and y-o-y)
Budget deficit (LHS, ESA), Debt
(RHS) in % of GDP
Tourist nights (3M, y-o-y, LHS) & tourist
nights, tourist arrivals
(12M, 2010 = 100)
Bulgaria
The Bulgarian economy shows someweakness as GDP growth decelerated to 3.4%y-o-y in 2Q based on preliminary data. Labormarket conditions continue to tighten asunemployment rate falls near historic lowsdespite the decrease in the number of peopleemployed. Inflation is on the rise: headline CPIgrew by 3.5% y-o-y in June, although aslowdown is expected as the base effect in fuelprices wears off.
Real GDP growth (%, SA, annualized
quarterly and y-o-y)
Unemploy. (LHS, %), activity rate
(RHS, %) & wages (LHS, y-o-y, %)
CPI & core HICP (ex unproc. food &
energy), y-o-y %)
Romania
GDP growth picked up in 2Q, likely on the
back of recovering consumption, after loosing
momentum in 1Q, due to a temporary dip in real
wage growth, rising borrowing costs and falling
confidence. In 2Q wages accelerated and
confidence stabilized. Inflation moderated and is
expected to ease further in 2H 2018, so the NBR
put on hold the tightening cycle. Rising public
wages and social benefits put further pressure on
the budget balance, so the 3% deficit target
seems to be challenging.
Real GDP growth (%, SA annualized
q-o-q and NSA y-o-y)
ESA-2010 deficit (4Q avg., r.h.s.),
debt (in % of GDP, l.h.s)
Headline inflation (y-o-y; %),
policy rate (%)

58
REAL GDP GROWTH
2016 2017 2018F 2019F
Hungary 2.2% 4.0% 4.4% 4.0%
Ukraine 2.3% 2.5% 3.2% 3.5%
Russia -0.2% 1.5% 2.0% 1.8%
Bulgaria 3.9% 3.6% 3.6% 3.4%
Romania 4.8% 6.9% 3.9% 3.8%
Croatia 3.2% 2.8% 2.7% 2.6%
Slovakia 3.3% 3.4% 3.7% 3.9%
Serbia 2.8% 1.9% 3.4% 3.2%
Montenegro 3.0% 4.4% 3.3% 3.0%
EXPORT GROWTH
2016 2017 2018F 2019F
Hungary 5.8% 7.1% 5.8% 6.0%
Ukraine -1.6% 3.6% 9.3% 4.1%
Russia 3.2% 5.4% 3.7% 3.3%
Bulgaria 8.1% 4.0% 5.2% 4.8%
Romania 8.7% 9.7% 8.7% 7.8%
Croatia 5.6% 6.1% 4.7% 4.5%
Slovakia 6.2% 4.3% 5.8% 7.5%
Serbia 12.0% 9.8% 11.4% 12.0%
Montenegro 6.2% 4.4% 4.4% 3.0%
UNEMPLOYMENT
2016 2017 2018 2019F
Hungary 5.1% 4.2% 3.9% 3.9%
Ukraine 9.7% 9.9% 8.8% 8.4%
Russia 5.5% 5.2% 4.8% 4.5%
Bulgaria 7.6% 6.3% 5.6% 5.4%
Romania 5.9% 4.9% 4.5% 4.4%
Croatia 15.0% 12.4% 11.0% 10.0%
Slovakia 9.7% 8.1% 7.3% 7.0%
Serbia 15.9% 14.1% 11.0% 10.5%
Montenegro 17.8% 16.2% 15.5% 15.3%
BUDGET BALANCE*
2016 2017 2018F 2019F
Hungary -1.7% -2.0% -2.4% -2.0%
Ukraine -2.9% -1.4% -2.5% -2.8%
Russia -3.5% -1.5% -0.2% -0.2%
Bulgaria 0.2% 0.9% -0.4% -0.6%
Romania -3.0% -2.9% 3.0% -2.9%
Croatia -1.2% 0.6% 0.2% 0.0%
Slovakia -2.2% -1.1% -1.2% -1.3%
Serbia -1.3% 1.2% -1.0% -1.0%
Montenegro -3.3% -5.7% -4.2% -3.8%
CURRENT ACCOUNT BALANCE
2016 2017 2018F 2019F
Hungary 6.1% 2.9% 1.6% 1.0%
Ukraine -1.5% -1.9% -2.4% -2.5%
Russia 1.9% 2.2% 3.0% 1.5%
Bulgaria 2.3% 4.5% 3.2% 1.7%
Romania -2.1% -3.3% -3.9% -4.1%
Croatia 2.6% 3.9% 3.0% 2.2%
Slovakia -1.4% -2.0% -1.5% -1.0%
Serbia -3.1% -5.7% -4.7% -4.5%
Montenegro -18.1% -19% -17.4% -17.2%
INFLATION
2016 2017 2018F 2019F
Hungary 0.4% 2.4% 2.6% 2.4%
Ukraine 13.9% 13.4% 11.5% 7.6%
Russia 7.0% 3.7% 2.9% 3.8%
Bulgaria -0.8% 2.1% 2.7% 3%
Romania -1.5% 1.3% 4.6% 3.1%
Croatia -1.1% 1.2% 1.5% 2.1%
Slovakia -0.5% 1.3% 2.3% 3.0%
Serbia 1.1% 3.2% 2.0% 3.0%
Montenegro -0.2% 2.4% 2.7% 2.4%
Growth can remain strong in the next two years and macro trends are favourable in CEE countries
Source: OTP Research Centre.
* For EU members deficit under the Maastricht criteria
59
Investor Relations & Debt Capital Markets
Tel: + 36 1 473 5460; + 36 1 473 5457
Fax: + 36 1 473 5951
E-mail: [email protected]
www.otpbank.hu
Forward looking statements
This presentation contains certain forward-looking statements with respect to the financial condition, results of operations, and businesses of OTP Bank. These statements and forecasts involve risk and uncertainty because they relate to events and depend upon circumstances that will occur in the future. There are a number of factors which could cause actual results or developments to differ materially from those expressed or implied by these forward looking statements and forecasts. The statements have been made with reference to forecast price changes, economic conditions and the current regulatory environment. Nothing in this announcement should be construed as a guaranteed profit forecast.