otter tail’s air project as
TRANSCRIPT
1
EvaluationofOtterTail’sAirQualityControlSystemProjectastheLeastCostOptionComparedtoOtherAlternatives
Preparedby:
KavitaMaini,
KMEnergyConsulting,LLC
OnBehalfof
SouthDakotaCommissionStaff
DocketNo:EL12‐027
January25,2013
2
TableofContents
Page
A. Executive Summary 3
B. Study Objective 5
C. Otter Tail’s Petition 6
D. Otter Tail’s Generation Mix 6
E. Big Stone AQCS Requirement 8
F. Researchable Issues 11
G. Conclusions 23
3
H.
A. ExecutiveSummary KM Energy Consulting, LLC was retained to evaluate whether Otter Tail Power Company’s (“Otter Tail” or “Company”) decision to install Air Quality Control System (AQCS) equipment at its Big Stone generating station (“Big Stone”) is the least cost option for reliably fulfilling the utility’s long term energy and capacity requirements compared to other alternatives. Big Stone is a 475 MW coal-fired power plant that began operations in 1975. It is co-owned by NorthWestern Corporation, Montana-Dakota Utilities Co., a Division of MDU Resources Group, Inc., and Otter Tail. Otter Tail’s ownership share is 53.9%. It has a single cyclone boiler that burns low sulfur Powder River Basin (“PRB”) coal. The plant provides base load power and fulfills nearly a third of the utility’s energy and capacity needs. On March 30, 2012, Otter Tail Power Company petitioned the South Dakota Public Utilities Commission (“Commission”) for approval of an Environmental Quality Cost Recovery Tariff (“Environmental Cost Recovery Rider”). Otter Tail proposes to implement the Environmental Cost Recovery Rider for the recovery of expenses and investments associated with installing AQCS equipment. The AQCS equipment is required based on a Best Available Retrofit Technology (“BART”) determination by the South Dakota Department of Environment and Natural Resources (“DENR”) in its Regional Haze State Implementation Plan (“SIP”). The South Dakota Regional Haze SIP was approved by the Environmental Protection Agency (“EPA”) on March 29, 2012. The AQCS equipment includes flue gas desulfurization (“FGD”) for SO2 reduction, selective catalytic reduction (“SCR”) with separated over-fire air (“SOFA”) for NOX reduction, and a new baghouse for particulate matter (“PM”). Otter Tail’s total estimated cost is $264 million in 2016$. To ascertain whether the AQCS installation is the least cost option compared to other alternatives, the following issues were examined:
1. Energy and capacity needs from a load perspective 2. Alternative supply options considered and related assumptions used
In order to address the researchable issues citied above, efforts were made to evaluate Otter Tail’s 2010 Integrated Resource Plan (“IRP”) that supported the AQCS project. Furthermore, the evidentiary record in the Advance Determination of Prudence (“ADP”) proceedings related to the AQCS project in Minnesota and North Dakota was also reviewed.
4
After evaluating Otter Tail’s resource needs, the results show a significant capacity and energy deficit without taking action to either retrofit Big Stone or acquire new supply side resources, or a combination of both. There is a need for supply side resources to reliably serve native load requirements.
Otter Tail’s 2010 IRP analysis included the AQCS project and was selected as part of the least cost plan. Since the decision to install AQCS equipment was evaluated in 2010, it is appropriate to analyze the assumptions using information available at that time. The assumptions for fuel prices and spot market prices in the plan were based on forecasts procured from Wood Mackenzie. Capital cost assumptions for thermal resources were based on estimates from Black and Veatch. Since resource planning includes long range forecasts that are inherently fraught with uncertainty, it is important to not rely on a single point estimate. Rather, it is crucial to conduct robustness testing to identify if the resource selection is included in a range of sensitivities. Otter Tail ran 22 cases testing its proposed plan on a range of sensitivities including, but not limited to, load growth, fuel prices, capital costs, and externalities. With the exception of the unlimited spot market reliance case, all cases included the AQCS project as part of the least cost plan. Unlimited reliance on the wholesale market without executable long term purchase power agreements (“PPA”) poses high risk from a ratepayer perspective. Therefore, the unlimited spot market reliance case is not one that should be relied upon for recommendations. Efforts were also made to examine the Minnesota Department of Commerce’s (“DOC”) more conservative cases that included lower natural gas prices, increasing capital costs by 30%, high externality costs, limited reliance on the spot market, and retiring Big Stone. The results indicate that the Big Stone AQCS retrofit option is cost effective and part of the least cost plan. The ADP proceedings for the AQCS project in Minnesota and North Dakota included a financial evaluation comparing the AQCS project with three other alternatives:
Repowering Big Stone boiler with natural gas;
Retiring Big Stone and replacing with a combined cycle plant; and
Retiring Big Stone and replacing with a combined cycle plant and wind PPA Burns and McDonnell conducted a levelized cost analysis that consisted of comparing the generation alternatives that would provide the same amount of base load energy and dependable capacity as Big Stone in a specific time frame. Various capital cost assumptions were evaluated and found to be reasonable. Assumptions regarding fuel and other variables were consistent with Otter Tail’s IRP. The results shown in Figure 1 below indicate that the AQCS project is the least cost option compared to other alternatives.
5
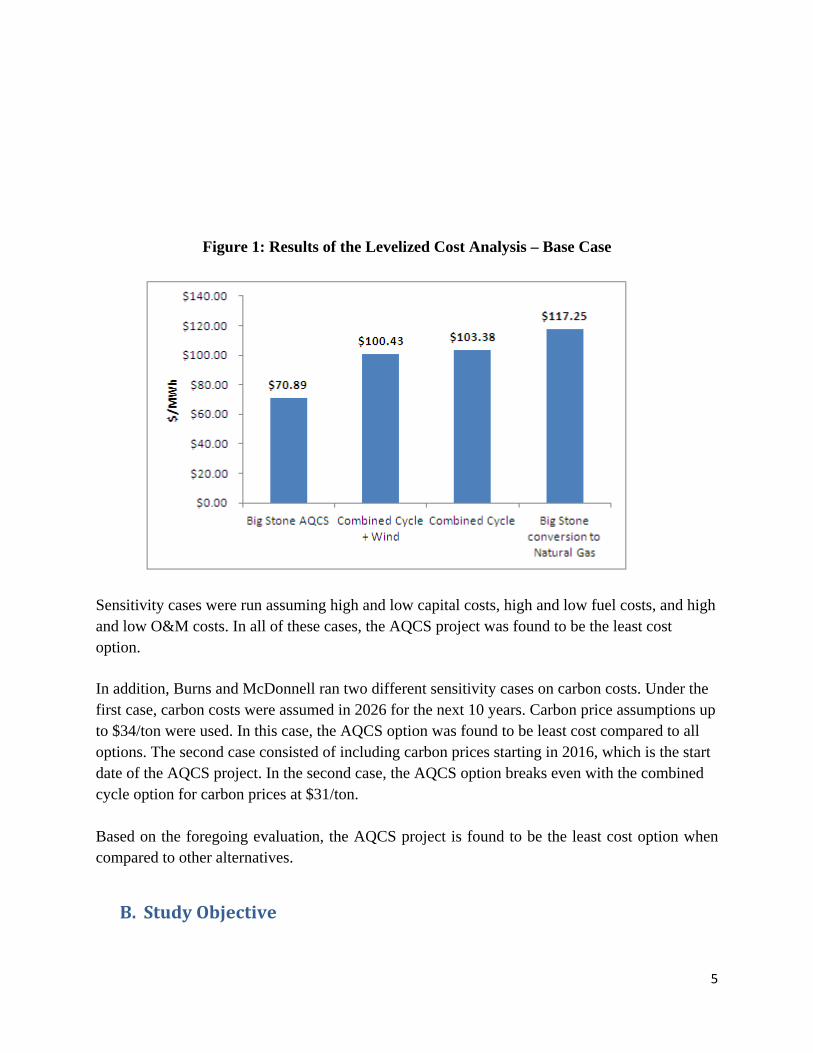
Figure 1: Results of the Levelized Cost Analysis – Base Case
Sensitivity cases were run assuming high and low capital costs, high and low fuel costs, and high and low O&M costs. In all of these cases, the AQCS project was found to be the least cost option. In addition, Burns and McDonnell ran two different sensitivity cases on carbon costs. Under the first case, carbon costs were assumed in 2026 for the next 10 years. Carbon price assumptions up to $34/ton were used. In this case, the AQCS option was found to be least cost compared to all options. The second case consisted of including carbon prices starting in 2016, which is the start date of the AQCS project. In the second case, the AQCS option breaks even with the combined cycle option for carbon prices at $31/ton. Based on the foregoing evaluation, the AQCS project is found to be the least cost option when compared to other alternatives.
B. StudyObjective
6
The objective of this study is to evaluate whether Otter Tail’s decision to install AQCS equipment at Big Stone is the least cost option for reliably fulfilling the utility’s long term energy and capacity requirements compared to other alternatives.
C. OtterTail’sPetition On March 30, 2012, Otter Tail petitioned the Commission for approval of an Environmental Cost Recovery Rider, pursuant to SDCL Chapter 49-34A, Sections 97 through 1001. Otter Tail proposes to implement the Environmental Cost Recovery Rider for the recovery of investments and expenses associated with environmental measures at Big Stone. Big Stone is a 475 MW coal-fired power plant that began operations in 1975. It is co-owned by NorthWestern Corporation, Montana-Dakota Utilities Co., a Division of MDU Resources Group, Inc., and Otter Tail. Otter Tail’s ownership share is 53.9%. It has a single cyclone boiler that burns low sulfur Powder River Basin (“PRB”) coal. In order to comply with the South Dakota DENR Regional Haze SIP, Otter Tail proposed the installation of AQCS equipment at Big Stone to reduce emissions of SO2 and NOX. Otter Tail states that the AQCS equipment is required based on a BART determination adopted by the South Dakota DENR. 2 This includes semi-dry FGD for SO2 reduction, and SCR with SOFA for NOX reduction. South Dakota DENR’s SIP was approved by the EPA on March 29, 2012. On December 11, 2011, the EPA issued the final Mercury and Air Toxics Standard Rule. The total cost estimate for the AQCS project is $490 million in 2016$, and that includes a 20% contingency allowance.3 Since Otter Tail’s ownership share in Big Stone is 53.9%, it is responsible for 53.9% of the costs or $264 million. Otter Tail’s South Dakota jurisdictional share of this cost responsibility is approximately 10% or $26.4 million.
1 SDCL 49-34A-97 - Notwithstanding any other provisions of this chapter, the commission may approve a tariff mechanism for the automatic annual adjustment of charges for the jurisdictional capital costs and operating expenses incurred by a public utility for environmental improvements to its existing electric generation facilities. For the purposes of §§49-34A-97 to 49-34A-100, inclusive, of this Act, environmental improvements include any requirements under the Clean Air Act, the Clean Water Act, or any other federal law or rule, or any state law or rule implementing a federal law or rule, or voluntary environmental measures designed to protect the environment. 2 The South Dakota DENR found that Big Stone is BART-eligible and subject to BART. 3 The non-escalated costs in late 2010 were $428,741,600.
7
Prior to approving cost recovery for this project, one necessary and important issue to address is whether environmentally retrofitting Big Stone is the least cost supply side option compared to other alternatives. The ensuing discussion seeks to address this issue.
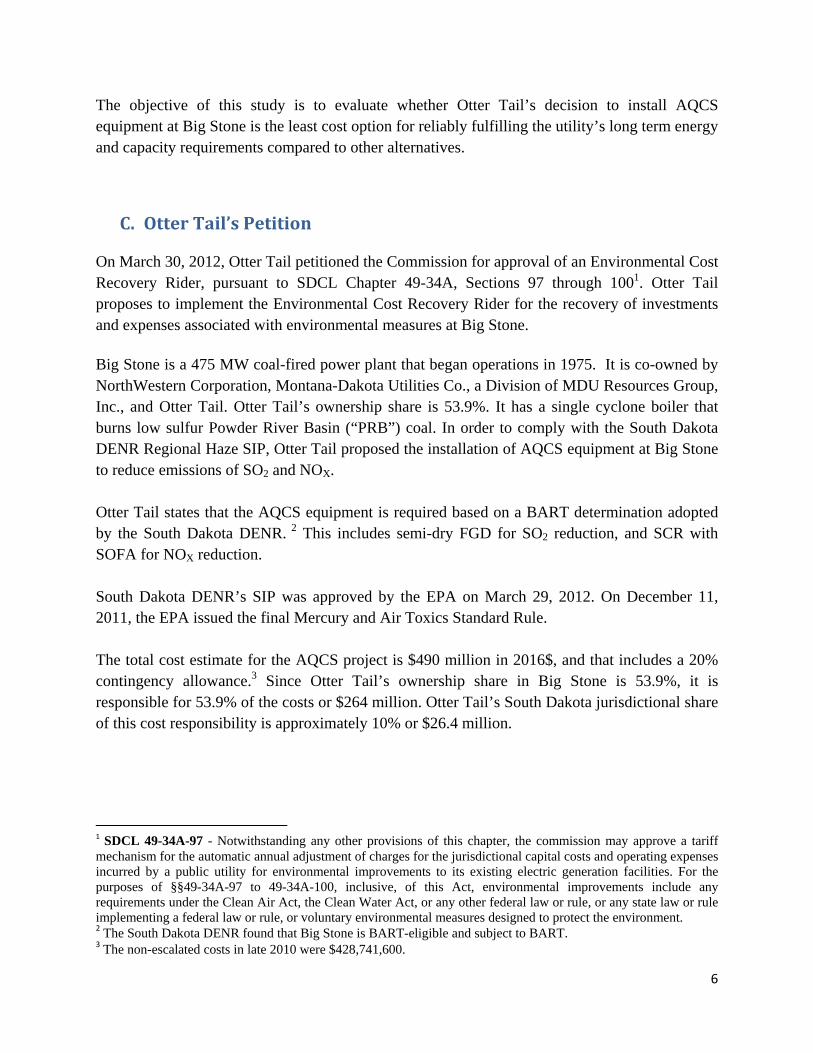
D. OtterTail’s2010GenerationMix Otter Tail is a winter peaking utility. In 2010, Otter Tail’s load peaked at 790 MW and its energy sales were 4.3 million MWhs. The accredited capacity share by fuel mix is provided in Figure 2 below. As can be observed, existing coal generation provides over 65% of capacity for the utility.
Figure 2: Accredited Capacity – by Fuel Type
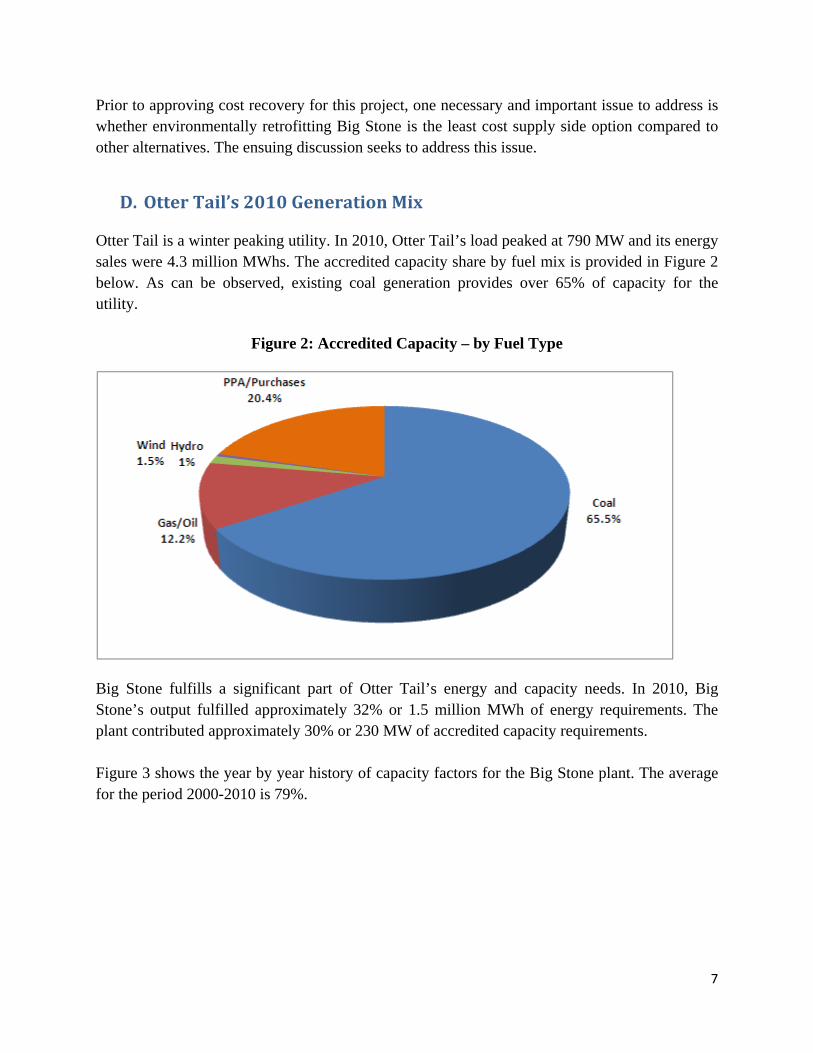
Big Stone fulfills a significant part of Otter Tail’s energy and capacity needs. In 2010, Big Stone’s output fulfilled approximately 32% or 1.5 million MWh of energy requirements. The plant contributed approximately 30% or 230 MW of accredited capacity requirements. Figure 3 shows the year by year history of capacity factors for the Big Stone plant. The average for the period 2000-2010 is 79%.
8
Figure 3: Big Stone Capacity Factor (2000-2010)
E. BigStoneAQCSRequirement The federal Clean Air Act, 42 U.S.C. § 7479, mandates a national goal of remedying and preventing visibility impairment from man-made air pollution in specified Class I areas of the United States. The EPA promulgated the Regional Haze Rule (“RHR”) in 1999 to address visibility impairment in Class I areas, and in 2005 published a revised rule that provided guidelines for control technology determinations under this rule. The South Dakota DENR is required to submit its Regional Haze SIP to the EPA to comply with the RHR. These regulations are designed to limit emissions from existing stationary sources that may reasonably be anticipated to cause or contribute to visibility impairment in any Class I areas. The South Dakota DENR defines “contribute” to visibility impairment as a change in visibility
9
impairment of 0.5 deciviews or more based on a 24-hour average above the actual visibility baseline. The rule applies to BART eligible sources and requires such sources to control NOX, SO2, and PM related emissions using BART. Big Stone is a BART eligible source. Otter Tail indicated the following in response to a discovery request:
Big Stone Plant is a BART-eligible source because it meets the three criteria given by 40 CFR § 51.301 of an existing stationary facility: (1) Big Stone Plant is a fossil-fuel steam electric plant of more than 250 mmbtu/hr, (2) Big Stone Plant entered into service between August 7, 1962 and August 7, 1977, and (3) Big Stone Plant has the potential to emit 250 tons per year of an air pollutant. Furthermore, Big Stone Plant is subject to BART because, as detailed by Sections 6.1.3 and 6.2 of the South Dakota Regional Haze SIP, the plant contributes to visibility impairment in several Class I areas.
Since BART is a case-by-case determination for each unit, the South Dakota DENR evaluated available control technology for SO2, NOX, and PM based on its technical feasibility, cost of compliance, non-air impacts, remaining useful life of the source, and projected reduction of visibility impacts. The discussion below indicates the results of the DENR’s determination.
1. Selection of the SO2 Control Technology
The South Dakota DENR determined that the following SO2 control technologies were feasible for Big Stone:
Semi-dry FGD; and
Wet FGD
Otter Tail proposed the semi-dry FGD option, which is more cost effective than the wet FGD option. Visibility modeling analysis was conducted and no discernible difference was found between the two control options. Consequently, the South Dakota DENR found the semi-dry FGD as BART.
2. Selection of the NOX Control Technology
With respect to NOX, several options were considered and the following four were ranked from first to fourth:
SCR
Rich Reagent Injection (“RRI”)
Selective Non Catalytic Reduction (“SNCR”)

10
SOFA Table 1 indicates NOX reduction and cost effectiveness by control technology.
Table 1: Capital Costs and NOX Emission Rates by Control Technology
Otter Tail proposed the fourth ranked option, SOFA, which was the cheapest and most cost effective option. The South Dakota DENR, after reviewing the visibility modeling results and the level of the NOX reductions achieved by each control technology, determined the SCR option as BART. The South Dakota DENR stated the following:
Based on the visibility modeling, the first ranked control option (selective catalytic reduction) reduces the visibility more than any other control option. The selective catalytic reduction system also reduces the visibility an additional 34 percent over the second ranked control option and an additional 65 percent over the fourth ranked control option. The selective catalytic reduction is also considered cost effective on a $ per ton basis, is represented as part of the control option #8 that is one of the most cost effective options on a $ per deciview reduction basis and one of the options that modeling demonstrates less than 0.5 deciviews of visibility impairment.4 DENR considers selective catalytic reduction and separate over-fire air system as BART. 5
3. Selection of the PM Control Technology
4 Note that this observation is based on modeling results that include the emissions of particulate matter, sulfur dioxide, and nitrogen oxide. 5 See South Dakota DENR Regional Haze SIP, pg. 102.
11
The baghouse was considered to be the top particulate control technology by the South Dakota DENR. Since Otter Tail is already operating a baghouse, the South Dakota DENR did not conduct any further analysis or make any additional recommendations. However, Otter Tail is installing a new baghouse because of limitations in current structural capabilities as stated in the following response to a discovery request:
By way of background, with the addition of the equipment required for control of SO2 and NOX, the negative pressure inside the existing baghouse would approximately double. This would greatly exceed the current structural capabilities of the existing baghouse. An engineering study was done to determine whether rebuilding the existing baghouse or building a new, replacement baghouse was the most cost effective. The study showed that it is much better to build new for many reasons. Thus the best decision for the customers of the plant’s owners is to build a new, replacement baghouse.
The South Dakota DENR submitted the Regional Haze SIP to the EPA on January 11, 2011 and proposed the following technologies for Big Stone:
SCR with SOFA for NOX control;
Semi-dry FGD for SO2 control; and
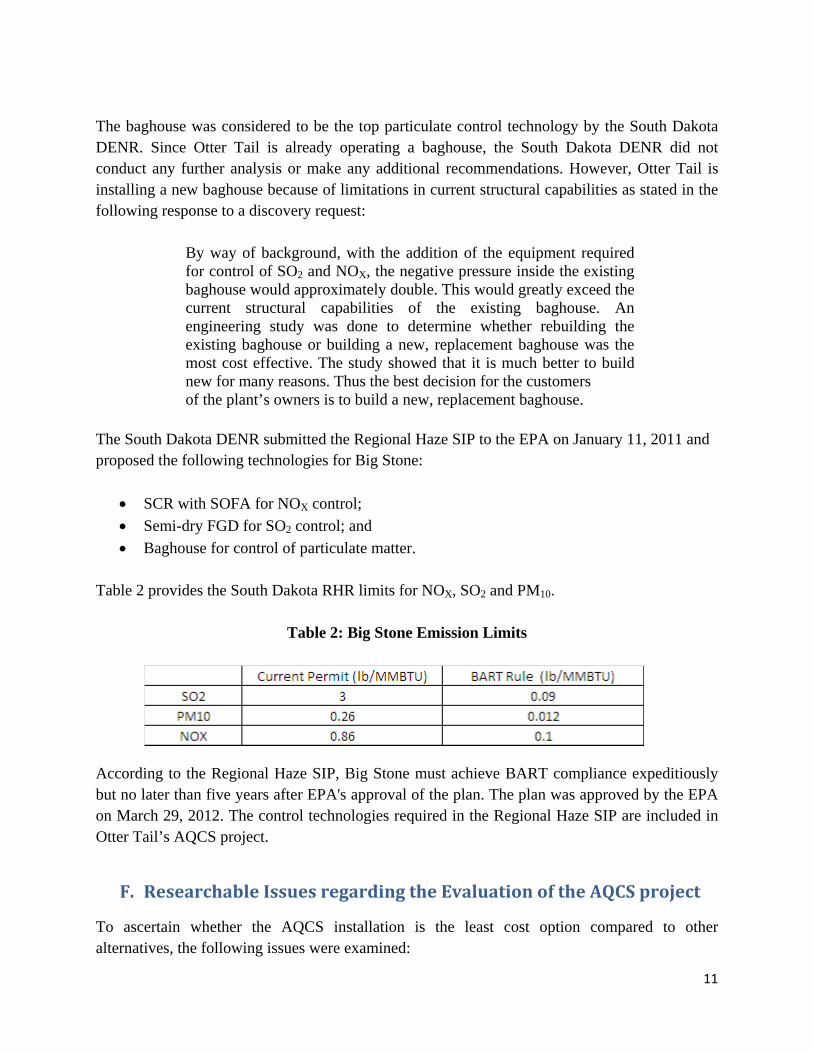
Baghouse for control of particulate matter. Table 2 provides the South Dakota RHR limits for NOX, SO2 and PM10.
Table 2: Big Stone Emission Limits
According to the Regional Haze SIP, Big Stone must achieve BART compliance expeditiously but no later than five years after EPA's approval of the plan. The plan was approved by the EPA on March 29, 2012. The control technologies required in the Regional Haze SIP are included in Otter Tail’s AQCS project.
F. ResearchableIssuesregardingtheEvaluationoftheAQCSproject To ascertain whether the AQCS installation is the least cost option compared to other alternatives, the following issues were examined:
12
1. Energy and capacity needs from a load perspective 2. Alternative supply options considered and related assumptions used
In order to address the researchable issues citied above, efforts were made to evaluate Otter Tail’s 2010 IRP that supported the AQCS project. Furthermore, the evidentiary record in the advance determination of prudence proceedings related to the AQCS project in Minnesota and North Dakota were also reviewed.
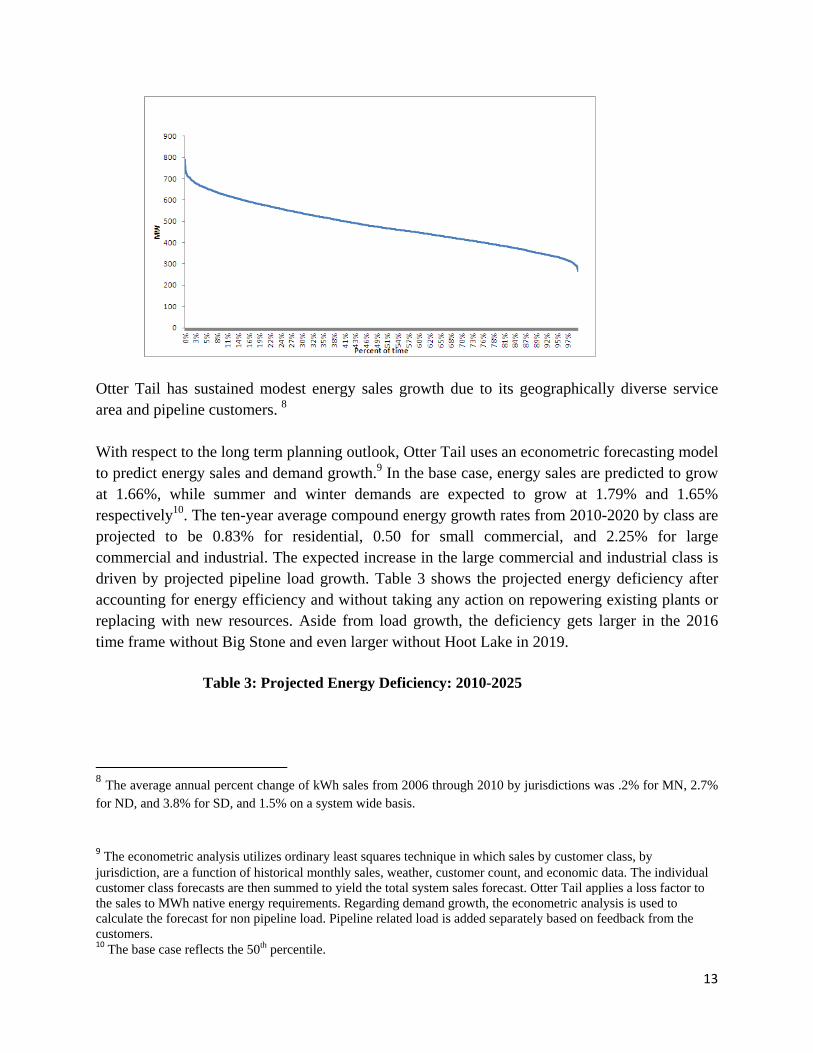
I. ENERGY AND CAPACITY NEEDS In order to ascertain the type of resource needed, it is important to establish the need deficiency from a load perspective. Since Big Stone is a coal fired plant, its output fulfills base load energy needs. In other words, barring maintenance outages, the generating equipment associated with this need normally operates to serve loads on an around-the-clock basis. In addition to fulfilling a base load need, Big Stone has load following capabilities.6 Further, as mentioned earlier, the plant also provides for nearly a third of Otter Tail’s capacity needs. Figure 4 shows the load duration curve for Otter Tail’s system using 2010 data. As can be observed, Otter Tail has a relatively flat profile. Therefore, the Company requires base load supply resources. Furthermore, Otter Tail’s 2010 IRP also indicates that it is expecting large industrial and commercial loads to increase to 60% of the Otter Tail’s retail sales, up from 40%, by 2019, which will further flatten the load duration curve and increase the need for base load resources. 7
Figure 4: Load Duration Curve – 2010
6 See Attachment 3, Joint Exhibit 1, page 1. 7 See 2010 IRP, page 3-4 Current Outlook.
13
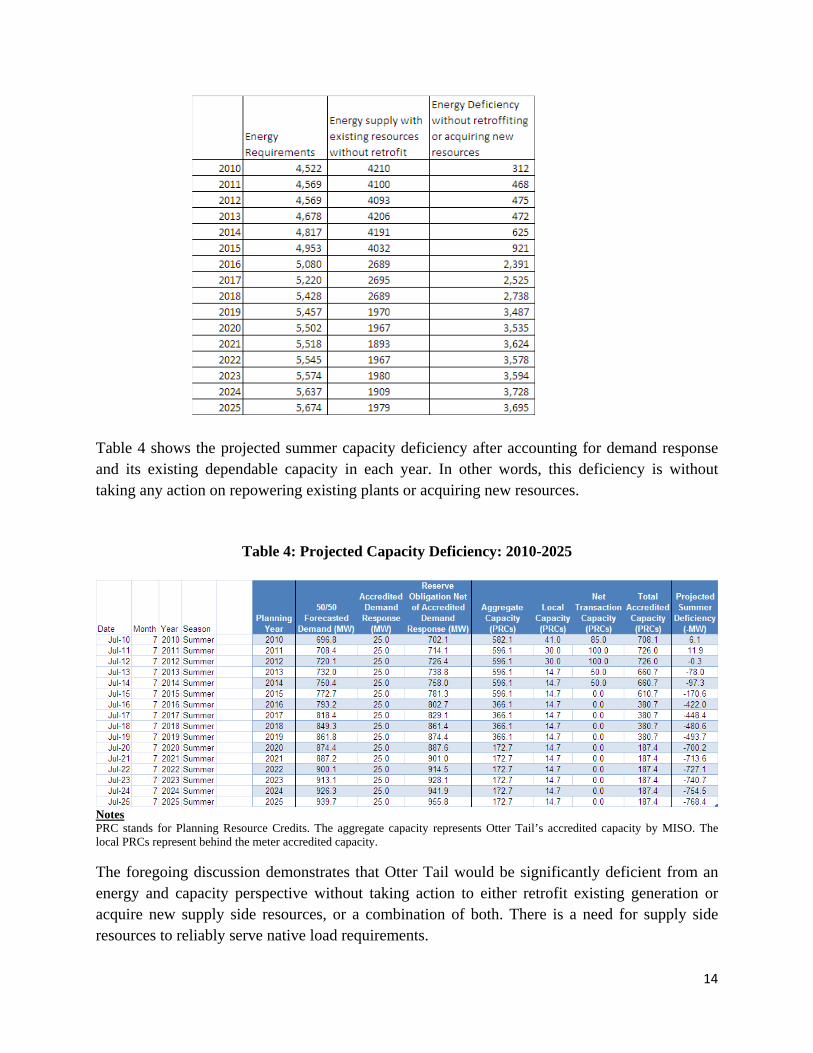
Otter Tail has sustained modest energy sales growth due to its geographically diverse service area and pipeline customers. 8 With respect to the long term planning outlook, Otter Tail uses an econometric forecasting model to predict energy sales and demand growth.9 In the base case, energy sales are predicted to grow at 1.66%, while summer and winter demands are expected to grow at 1.79% and 1.65% respectively10. The ten-year average compound energy growth rates from 2010-2020 by class are projected to be 0.83% for residential, 0.50 for small commercial, and 2.25% for large commercial and industrial. The expected increase in the large commercial and industrial class is driven by projected pipeline load growth. Table 3 shows the projected energy deficiency after accounting for energy efficiency and without taking any action on repowering existing plants or replacing with new resources. Aside from load growth, the deficiency gets larger in the 2016 time frame without Big Stone and even larger without Hoot Lake in 2019. Table 3: Projected Energy Deficiency: 2010-2025
8 The average annual percent change of kWh sales from 2006 through 2010 by jurisdictions was .2% for MN, 2.7% for ND, and 3.8% for SD, and 1.5% on a system wide basis.
9 The econometric analysis utilizes ordinary least squares technique in which sales by customer class, by jurisdiction, are a function of historical monthly sales, weather, customer count, and economic data. The individual customer class forecasts are then summed to yield the total system sales forecast. Otter Tail applies a loss factor to the sales to MWh native energy requirements. Regarding demand growth, the econometric analysis is used to calculate the forecast for non pipeline load. Pipeline related load is added separately based on feedback from the customers. 10 The base case reflects the 50th percentile.
14
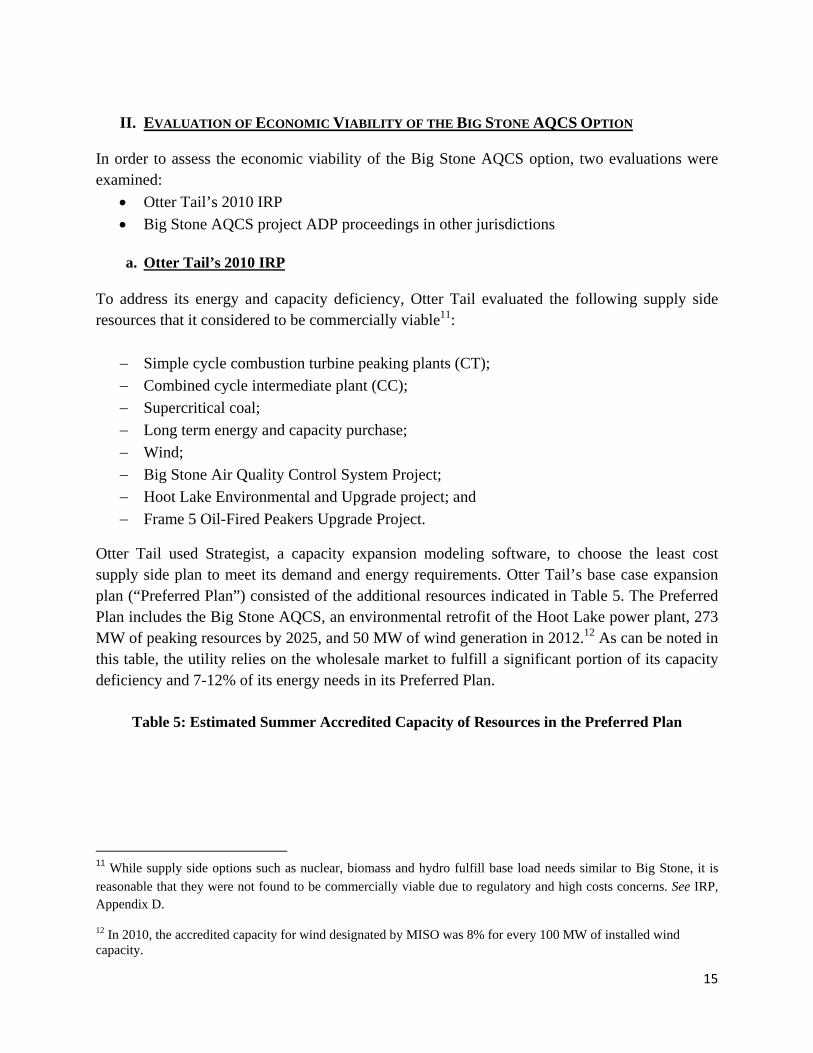
Table 4 shows the projected summer capacity deficiency after accounting for demand response and its existing dependable capacity in each year. In other words, this deficiency is without taking any action on repowering existing plants or acquiring new resources.
Table 4: Projected Capacity Deficiency: 2010-2025
Notes PRC stands for Planning Resource Credits. The aggregate capacity represents Otter Tail’s accredited capacity by MISO. The local PRCs represent behind the meter accredited capacity.
The foregoing discussion demonstrates that Otter Tail would be significantly deficient from an energy and capacity perspective without taking action to either retrofit existing generation or acquire new supply side resources, or a combination of both. There is a need for supply side resources to reliably serve native load requirements.
15
II. EVALUATION OF ECONOMIC VIABILITY OF THE BIG STONE AQCS OPTION
In order to assess the economic viability of the Big Stone AQCS option, two evaluations were examined:
Otter Tail’s 2010 IRP
Big Stone AQCS project ADP proceedings in other jurisdictions
a. Otter Tail’s 2010 IRP To address its energy and capacity deficiency, Otter Tail evaluated the following supply side resources that it considered to be commercially viable11:
Simple cycle combustion turbine peaking plants (CT);
Combined cycle intermediate plant (CC);
Supercritical coal;
Long term energy and capacity purchase;
Wind;
Big Stone Air Quality Control System Project;
Hoot Lake Environmental and Upgrade project; and
Frame 5 Oil-Fired Peakers Upgrade Project.
Otter Tail used Strategist, a capacity expansion modeling software, to choose the least cost supply side plan to meet its demand and energy requirements. Otter Tail’s base case expansion plan (“Preferred Plan”) consisted of the additional resources indicated in Table 5. The Preferred Plan includes the Big Stone AQCS, an environmental retrofit of the Hoot Lake power plant, 273 MW of peaking resources by 2025, and 50 MW of wind generation in 2012.12 As can be noted in this table, the utility relies on the wholesale market to fulfill a significant portion of its capacity deficiency and 7-12% of its energy needs in its Preferred Plan.
Table 5: Estimated Summer Accredited Capacity of Resources in the Preferred Plan
11 While supply side options such as nuclear, biomass and hydro fulfill base load needs similar to Big Stone, it is reasonable that they were not found to be commercially viable due to regulatory and high costs concerns. See IRP, Appendix D. 12 In 2010, the accredited capacity for wind designated by MISO was 8% for every 100 MW of installed wind capacity.

16
Since the decision to install AQCS equipment was evaluated in 2010, it is appropriate to analyze the assumptions using information available at that time. In order to test the prudence of Otter Tail’s decision, the basis for key assumptions and results of robustness testing were examined. It is important to not rely on single point forecasts. Sensitivity analysis is crucial due to the uncertainties associated with long term forecasting. The assumptions for fuel prices and spot market prices in the plan were based on forecasts procured from Wood Mackenzie.13 Capital cost assumptions for thermal resources were based on estimates from Black and Veatch. Otter Tail conducted a total of 22 sensitivity cases to test its Preferred Plan.14 Below are some of the scenarios Otter Tail tested along with a brief description:
Low and high coal – Coal prices are 20% less or more than in the base case.
High gas prices – Natural gas prices are 20% more than in the base case.
NYMEX natural gas price – Compared to the base case, the NYMEX gas price scenario consisted of higher natural gas prices in the first three years, followed by lower prices in the
13 Fuel price forecasts, especially for natural gas, are highly prone to forecast error due to the highly dynamic and speculative nature of the market. Further, it is challenging to assess the reasonability of fuel price forecasts from 2010 that were conducted by an outside firm that uses proprietary modeling. These reasons reinforce the importance of conducting various sensitivity runs assuming higher and lower prices of fuel to ascertain whether resources such as the AQCS project is selected in a range of sensitivities. 14 See Otter Tail’s 2010 IRP, Figure 5-4 for the NPV of revenue requirements of the various cases and Figure 5-5 for the comparison of resource additions for the various sensitivities.
17
later years. After the first three years, the year by year natural gas prices in the NYMEX case were lower by a minimum of 8.5% to a high of 16.2% compared to the base case.
Low, mid, and high externality costs – CO2 costs are $9.00, $21.50, and $34.00 per ton, respectively.
Low and high capital costs – Capital costs of thermal resource alternatives are 20% less or more than in the base case.
Low and high load growth – Procure capacity to meet the 5th and 95th percentile peak demand forecast.
Federal Renewable Energy Standard (“RES”) – A 15% federal RES by 2025.
Unlimited or No Market Reliance – Import an unlimited or no amount of energy and capacity from the market.
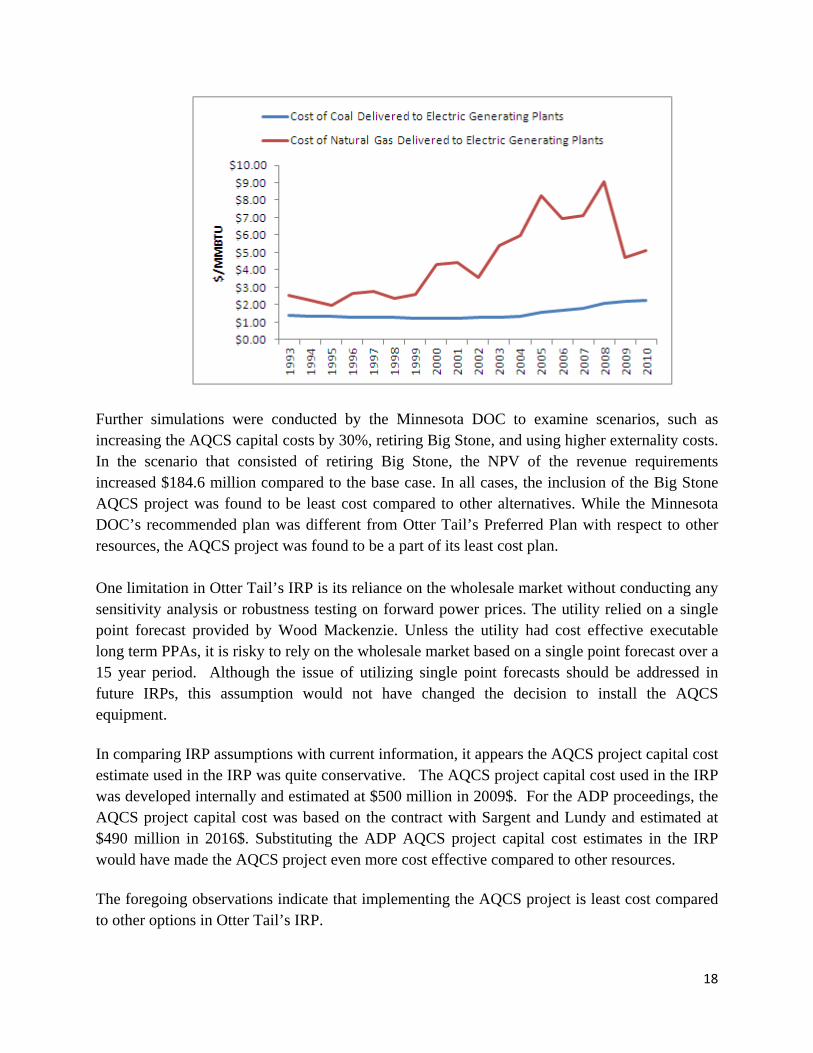
With the exception of the unlimited spot market reliance case, all cases included the AQCS project as part of the least cost plan. The unlimited spot market reliance case selected 450 MW of capacity and related energy from the wholesale market. Importing nearly half of Otter Tail’s system energy requirements would subject ratepayers to an unacceptable level of market price and reliability risk. Consequently, this plan is not considered a viable option. The Minnesota DOC conducted additional sensitivity analysis on Otter Tail’s Preferred Plan. One assumption that the Minnesota DOC focused on was fuel prices, specifically natural gas prices.15 With respect to fuel prices, natural gas has historically been more volatile than coal on a relative basis. Figure 5 shows the comparison of historical coal prices and natural gas prices delivered to electric generating plants from 1993-2010.16 Consequently, it becomes even more crucial to ensure that rigorous robustness testing is performed on natural gas price forecasts. Even under consistently lower natural gas prices, the Minnesota DOC concluded the Big Stone AQCS project was part of the least cost plan.
Figure 5: Coal and Natural Gas Costs Delivered to
Electric Generating Plants ($/MMBTU)
15 The Minnesota DOC utilized the same assumptions used by Otter Tail except that unlike the utility’s base case, externalities were included in the base case ($21.50/ton CO2) and reliance on the wholesale market was only in the near term. The Minnesota DOC’s sensitivity cases included lowering natural gas prices by $0.50/MMBTU and $1/MMBTU compared to the base forecast respectively. See Minnesota DOC Comments submitted in Docket E017/RP-10 -623 on May 16, 2011. Further, the Minnesota DOC conducted additional sensitivity analysis in the ADP proceeding for the AQCS project. Sensitivity runs included using NYMEX prices for the first three years and natural gas prices lower by $1.50/MMBTU for each year after the three year period. See Docket E017/M-10-1082. 16 Data source: EIA Annual Energy Outlook.
18
Further simulations were conducted by the Minnesota DOC to examine scenarios, such as increasing the AQCS capital costs by 30%, retiring Big Stone, and using higher externality costs. In the scenario that consisted of retiring Big Stone, the NPV of the revenue requirements increased $184.6 million compared to the base case. In all cases, the inclusion of the Big Stone AQCS project was found to be least cost compared to other alternatives. While the Minnesota DOC’s recommended plan was different from Otter Tail’s Preferred Plan with respect to other resources, the AQCS project was found to be a part of its least cost plan. One limitation in Otter Tail’s IRP is its reliance on the wholesale market without conducting any sensitivity analysis or robustness testing on forward power prices. The utility relied on a single point forecast provided by Wood Mackenzie. Unless the utility had cost effective executable long term PPAs, it is risky to rely on the wholesale market based on a single point forecast over a 15 year period. Although the issue of utilizing single point forecasts should be addressed in future IRPs, this assumption would not have changed the decision to install the AQCS equipment. In comparing IRP assumptions with current information, it appears the AQCS project capital cost estimate used in the IRP was quite conservative. The AQCS project capital cost used in the IRP was developed internally and estimated at $500 million in 2009$. For the ADP proceedings, the AQCS project capital cost was based on the contract with Sargent and Lundy and estimated at $490 million in 2016$. Substituting the ADP AQCS project capital cost estimates in the IRP would have made the AQCS project even more cost effective compared to other resources. The foregoing observations indicate that implementing the AQCS project is least cost compared to other options in Otter Tail’s IRP.
19
b. Assessment of Comparable Alternatives in ADP Proceedings in MN and ND In the ADP proceedings for the Big Stone AQCS project in Minnesota and North Dakota, Otter Tail provided levelized cost analysis comparing the following options:
Implementing the Big Stone AQCS project
Repowering Big Stone boiler with natural gas;
Retiring Big Stone and replacing with a combined cycle plant; and
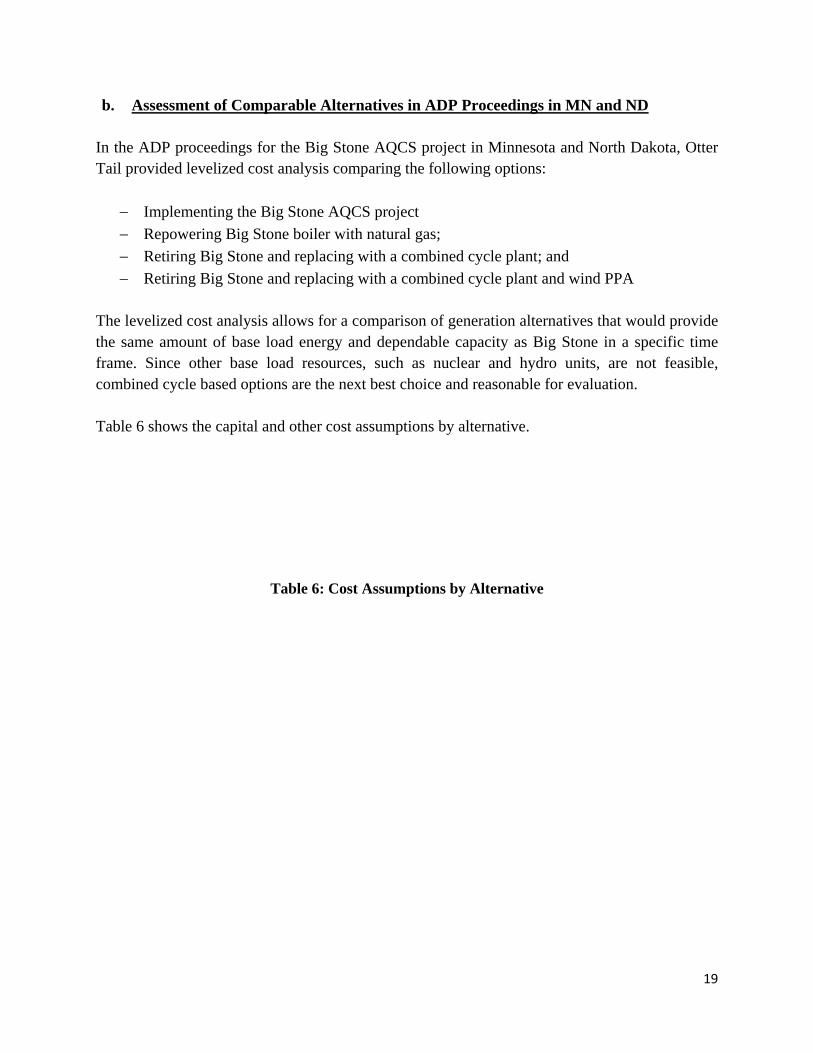
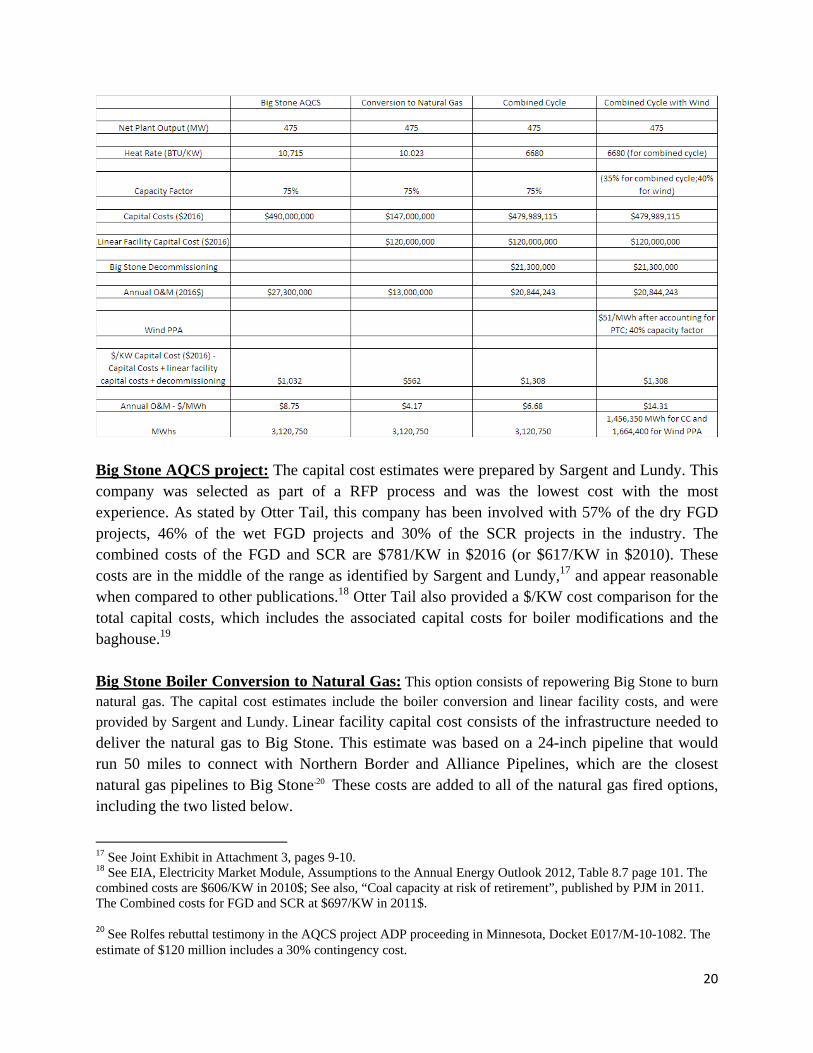
Retiring Big Stone and replacing with a combined cycle plant and wind PPA The levelized cost analysis allows for a comparison of generation alternatives that would provide the same amount of base load energy and dependable capacity as Big Stone in a specific time frame. Since other base load resources, such as nuclear and hydro units, are not feasible, combined cycle based options are the next best choice and reasonable for evaluation. Table 6 shows the capital and other cost assumptions by alternative.
Table 6: Cost Assumptions by Alternative
20
Big Stone AQCS project: The capital cost estimates were prepared by Sargent and Lundy. This company was selected as part of a RFP process and was the lowest cost with the most experience. As stated by Otter Tail, this company has been involved with 57% of the dry FGD projects, 46% of the wet FGD projects and 30% of the SCR projects in the industry. The combined costs of the FGD and SCR are $781/KW in $2016 (or $617/KW in $2010). These costs are in the middle of the range as identified by Sargent and Lundy,17 and appear reasonable when compared to other publications.18 Otter Tail also provided a $/KW cost comparison for the total capital costs, which includes the associated capital costs for boiler modifications and the baghouse.19 Big Stone Boiler Conversion to Natural Gas: This option consists of repowering Big Stone to burn natural gas. The capital cost estimates include the boiler conversion and linear facility costs, and were
provided by Sargent and Lundy. Linear facility capital cost consists of the infrastructure needed to deliver the natural gas to Big Stone. This estimate was based on a 24-inch pipeline that would run 50 miles to connect with Northern Border and Alliance Pipelines, which are the closest natural gas pipelines to Big Stone.20 These costs are added to all of the natural gas fired options, including the two listed below.
17 See Joint Exhibit in Attachment 3, pages 9-10. 18 See EIA, Electricity Market Module, Assumptions to the Annual Energy Outlook 2012, Table 8.7 page 101. The combined costs are $606/KW in 2010$; See also, “Coal capacity at risk of retirement”, published by PJM in 2011. The Combined costs for FGD and SCR at $697/KW in 2011$. 20 See Rolfes rebuttal testimony in the AQCS project ADP proceeding in Minnesota, Docket E017/M-10-1082. The estimate of $120 million includes a 30% contingency cost.

21
Combined Cycle Option: The costs of the combined cycle units, excluding the natural gas linear facility and Big Stone decommissioning costs, are $1010/KW in $2016 (or $831/KW in $2010). These cost assumptions were provided by Burns & McDonnell and appear reasonable when compared to other publications.21 With this option, the combined cycle capacity factor is assumed to be the same as Big Stone to keep the comparison consistent. Combined Cycle with Wind Option: This option assumes that a wind resource provides 40% of the energy, and the combined cycle unit provides an additional 35% of the energy to achieve a total capacity factor of 75%. Burns & McDonnell based the wind resource costs on the PPAs used in Otter Tail’s 2010 IRP. The $/MWh PPA cost was adjusted for production tax credits.22 Assumptions for fuel costs and discount rates were the same as used in Otter Tail’s IRP. Escalation rates for capital costs were 4% and based on historical data from the Handy Whitman Index.23 The results of the levelized cost analysis are indicated in Figure 6. As indicated by this chart, the AQCS project is the most cost effective as compared to other alternatives.
Figure 6: Results of the Levelized Cost Analysis – Base Case
21 EIA data from Annual Energy Outlook issued in November 2010 estimated a conventional combined cycle costs at $978/KW. Burns and McDonnell estimated the costs of Big Stone, a 475 MW unit, using the capital costs of a 615 MW as a benchmark, which results in lower costs due to economies of scale. 22 The assumed capital cost for wind in $/KW falls within the range of wind costs published by the EIA. See Otter Tail IRP, Appendix F for wind capital cost assumptions. 23 Otter Tail’s response to a verbal request.

22
Sensitivity cases were run assuming high and low capital costs, high and low fuel costs, and high and low O&M costs. Figures 7, 8, and 9 show the results of these cases. As indicated in these figures, in all cases, the AQCS project was found to be the least cost option.
Figure 7: Results of the Levelized Cost Analysis – Capital Costs Sensitivity

23
Figure 8: Results of the Levelized Cost Analysis – Fuel Cost Sensitivity
Figure 9: Results of the Levelized Cost Analysis – O&M Cost Sensitivity

24
In addition, Burns and McDonnell ran two different sensitivity cases on carbon costs. Under the first case, carbon costs were assumed in 2026 for the next 10 years. Carbon prices assumptions up to $34/ton were used. In this case, the AQCS option was found to be least cost compared to all options. The second case consisted of including carbon prices starting in 2016, which is the start date of the AQCS project. In the second case, the AQCS option breaks even with the combined cycle option for carbon prices at $31/ton. 24 With respect to future environmental regulations that would impact Big Stone, a sensitivity case was conducted that included costs related with mercury removal and handling ash. These additional costs resulted in a $3.66/MWh increase in the levelized cost of energy for the Big Stone AQCS option. However, since there is a gap of around $30/MWh between the AQCS option and the next best alternative, these additional costs do not change the result. Thus, this analysis reinforces the IRP based findings that the AQCS is the least cost option when compared to other alternatives.
G. Conclusions
Based on the evaluation of Otter Tail’s IRP and the analysis conducted in the ADP proceedings in North Dakota and Minnesota, the AQCS project is found to be the least cost option compared to other alternatives.
24 See Burns and McDonnell report filed at the Minnesota Commission in the AQCS ADP Proceeding, Exhibit 65, docket E017/M-10-1082.