ou-1 enhanced attenuation field demonstration edible oil
TRANSCRIPT

OU-1 Enhanced Attenuation Field Demonstration Edible Oil Deployment Design Mound, Ohio, Site June 2014
LMS/MND/S11608

This page intentionally left blank

LMS/MND/S11608
OU-1 Enhanced Attenuation Field Demonstration Edible Oil Deployment Design
Mound, Ohio, Site
June 2014

This page intentionally left blank

U.S. Department of Energy OU-1 Enhanced Attenuation Field Demonstration – Edible Oil Deployment Design, Mound June 2014 Doc. No. S11608 Page i
Contents Abbreviations .................................................................................................................................. ii 1.0 Introduction ............................................................................................................................1 2.0 Remedial Technology Overview ............................................................................................1 3.0 Field Demonstration Goals .....................................................................................................2 4.0 Edible Oil Deployment Design ..............................................................................................2
4.1 Neat Oil Deployment ...................................................................................................3 5.0 References ..............................................................................................................................8
Figures Figure 1. Neat Oil Deployment Locations ...................................................................................... 4 Figure 2. Emulsified Oil Deployment Locations ............................................................................ 6
Tables Table 1. Neat Oil Deployment Design Parameters ......................................................................... 3 Table 2. Emulsified Oil Deployment Design Parameters ............................................................... 7
Appendixes Appendix A Neat Oil Deployment Equipment and Materials Specifications Appendix B Neat Oil Deployment Temporary Well Point Details Appendix C Emulsified Oil and Blending Water Volumes Appendix D Emulsified Oil Deployment Equipment and Materials Specifications Appendix E Emulsified Oil Deployment Temporary Well Point Details

OU-1 Enhanced Attenuation Field Demonstration – Edible Oil Deployment Design, Mound U.S. Department of Energy Doc. No. S11608 June 2014 Page ii
Abbreviations cVOCs chlorinated volatile organic compounds
ft foot
gpm gallons per minute
lb pound
MCL maximum contaminant level
MNA monitored natural attenuation
OU-1 Operable Unit 1
P&T pump-and-treatment
PCE tetrachloroethene (perchloroethene)
TCE trichloroethene

U.S. Department of Energy OU-1 Enhanced Attenuation Field Demonstration – Edible Oil Deployment Design, Mound June 2014 Doc. No. S11608 Page 1
1.0 Introduction At the Mound, Ohio, Site, groundwater in Operable Unit 1 (OU-1) has been impacted by chlorinated volatile organic compounds (cVOCs) originating from the former solid waste landfill. Contaminated groundwater from the former landfill is currently being controlled using two extraction wells. Since the source materials have been removed from the landfill, the feasibility of switching from the active remedy of pump-and-treatment (P&T) to capture contaminated groundwater originating beneath the former landfill to a more passive attenuation remedy is being considered as a viable alternative at the Mound site. Results of a recent aquifer rebound study show that the concentrations of cVOCs increase above the U.S Environmental Protection Agency maximum contaminant levels (MCLs) when the P&T system is shut off. In the process of considering a transition to monitored natural attenuation (MNA), the U.S. Department of Energy will conduct a field demonstration to evaluate the use of edible oils to enhance natural attenuation processes. A field demonstration will be conducted to determine whether the use of edible oils can establish and stimulate discrete treatment zones that expedite the attenuation of cVOCs in the OU-1 groundwater. Edible oils (neat and emulsified) will be deployed into the subsurface to create treatment zones to reduce the concentrations of trichloroethene (TCE) and tetrachloroethene (PCE) in groundwater and enhance the ongoing attenuation of these parent compounds and degradation (daughter) products. The design criteria for implementing this approach are outlined in the Field Demonstration Work Plan for Using Edible Oils to Achieve Enhanced Attenuation of cVOCs and a Groundwater Exit Strategy for the OU-1 Area, Mound, Ohio (Field Demonstration Work Plan) (DOE 2013). This design document presents the specific material and equipment requirements necessary to deploy the neat and emulsified oils. The locations and construction specifics for the temporary wells are also included.
2.0 Remedial Technology Overview Enhanced attenuation uses active engineering solutions to alter the target site in such a way that the contaminant plume will passively stabilize and shrink. The strategy recognizes that attenuation remedies are fundamentally based on a mass balance; therefore, long-term plume behavior can be altered either by reducing the contaminant loading from the source or by increasing the rate of natural attenuation processes within all or part of the plume volume. Edible oils have emerged as an effective treatment to enhance anaerobic bioremediation and sequestration of chlorinated solvent contamination in groundwater. At sites with relatively low contaminant concentrations, use of edible oil has also proven to be a cost-effective alternative compared to traditional active approaches, such as P&T. Edible oil deployment serves to decrease chlorinated compound concentrations in two ways: (1) physical sequestration, which reduces effective aqueous concentrations and mobility; and (2) stimulation of anaerobic, cometabolic, and abiotic degradation processes that degrade the cVOCs to less toxic, non-toxic, and/or more readily biodegradable compounds. Edible oils can be deployed to form structured geochemical zones—a series of reaction zones that provide sequential anaerobic and aerobic conditions to maximize beneficial performance, constrain the amount of reagent addition, and minimize collateral impacts of the remediation.

OU-1 Enhanced Attenuation Field Demonstration – Edible Oil Deployment Design, Mound U.S. Department of Energy Doc. No. S11608 June 2014 Page 2
The combination of technologies that will be used for the enhanced attenuation field demonstration at OU-1 includes (1) neat (pure) vegetable oil deployment in the deep vadose zone in the former source area, (2) emulsified vegetable oil deployment within the footprint of the groundwater plume, and (3) monitoring of concentration trends, attenuation mechanisms, and rates in the plume. In the first part, neat oil spreads laterally and forms a thin layer on the water table beneath presumptive soil sources to intercept and reduce future cVOC loading (via partitioning) and reduce oxygen inputs to the local groundwater (via biostimulation). In the second part, emulsified oil forms active bioremediation reactor zones within the plume footprint to degrade existing groundwater contaminants (via reductive dechlorination, cometabolism, or both) and stimulates long-term attenuation capacity in the distal plume (via cometabolism). The third part consists of ongoing monitoring to ensure that groundwater quality does not degrade downgradient of these treatment zones.
3.0 Field Demonstration Goals The goal of the field demonstration is to show that structured geochemical treatment zones can be established and effectively maintained to decrease cVOC concentrations in groundwater to MCLs in a reasonable time frame. The overall objectives of the field demonstration are to:
Assess the performance and viability of attenuation using structured geochemical zones as a remediation strategy for OU-1 groundwater
Stabilize the plume and minimize/mitigate the potential for plume growth
Develop the biogeochemical conditions to accelerate progress to remedial goals and transition the strategy to MNA
Data will also be collected to evaluate the feasibility of MNA as a remedy to address cVOC contamination in the OU-1 groundwater. Factors to be evaluated include stability of the plume, degradation rates, and downgradient groundwater quality. The sampling program is presented in the OU-1 Enhanced Attenuation Field Demonstration Sampling and Analysis Plan Mound, Ohio, Site (DOE 2014).
4.0 Edible Oil Deployment Design The selection of edible oil deployment approaches is based on the current configuration of cVOCs in residual soil and groundwater. The design is derived from two mechanisms—partitioning and degradation—combined with standard hydrology and engineering calculations. Injection point construction and oil deployment methods are prepared that emphasize the strategic application of edible oils to address residual secondary cVOC sources in soil beneath the former landfill, as well as in downgradient tertiary sources. Further, the design of the injection points takes into account site lithostratigraphy and the water table surface to assist in developing deployment zones that have the correct geometry to intercept contaminants and effectively treat the groundwater plume.

U.S. Department of Energy OU-1 Enhanced Attenuation Field Demonstration – Edible Oil Deployment Design, Mound June 2014 Doc. No. S11608 Page 3
In order to address the cVOC contamination in both residual soil and groundwater, a two-part deployment has been selected: (1) neat (pure) vegetable oil at the water table beneath areas with the highest residual cVOC concentrations in soil, and (2) emulsified vegetable oil substrate in the areas of highest concentrations of cVOCs in the groundwater plume. In the first part, neat oil injected into the vadose zone spreads laterally and forms a thin layer on the water table to intercept and reduce future cVOC input from residually contaminated soils in the vadose zone. In the second part, emulsified oil injected below the water table stimulates the formation of an active bioremediation treatment zone within the active plume footprint to degrade existing groundwater contamination and any future inputs. The following sections detail the design elements of the two deployment approaches. In addition, material and equipment specifications, general system layouts, and well point designs are included in appendixes to this document. 4.1 Neat Oil Deployment The objective of neat oil deployment is to intercept and reduce future cVOC inputs to the groundwater from discrete areas of residually contaminated soil present within the footprint of the landfill. This is accomplished as the neat oil is introduced to the vadose zone immediately above the water table and spreads out, forming a thin but laterally extensive layer at the water table surface. This neat oil layer reduces cVOC loading to the groundwater through the mechanisms of sequestration and reductive dechlorination. For this design, neat oil will be used. The locations where neat oil will be deployed are based on soil cVOC concentrations greater than 1 milligram per kilogram (DOE 2013), as measured following the waste removal activities in the OU-1 landfill (Figure 1). The amount of oil to be deployed is determined by the following geometric calculation:
Voil = (target area) (approximate thickness) (volumetric oil saturation after equilibration) A zone of influence having a diameter ranging from 30 feet (ft) to 35 ft will be targeted at each deployment point. Table 1 presents the design parameters for the neat oil deployment within the OU-1 landfill footprint.
Table 1. Neat Oil Deployment Design Parameters
Oil type Food-grade soybean oil
Number of deployment point 6
Area to be treated at each point 700 sq ft–960 sq ft
Thickness of oil layer formed 1 ft
Oil saturation after equilibrium 0.1
Vadose zone porosity 0.25
Calculated volume of neat oil per deployment point 800 gal
Calculated total volume of neat oil required 4,800 gal
Abbreviations: gal = gallon sq ft = square feet

OU-1 Enhanced Attenuation Field Demonstration – Edible Oil Deployment Design, Mound U.S. Department of Energy Doc. No. S11608 June 2014 Page 4
Figure 1. Neat Oil Deployment Locations
:;:
::
( 50 25
SCALE IN FEET 50
\ .. : 0424
'" ""' .. ~~iiiiiiiiiiiiiiil'~,""",,.~~~ ', \ 0425
n (
GP-130 0
·· .. GP-131
0
.. ·· .· ... -- ... ·
./ .. --- .· .· :~: .. _
!(
-------
Gp-103 0
Work Performed by LEGEND U.S. DEPARTMENT OF ENERGY S.M. Stoller Corporation ~ Monitoring Well
0 Geoprobe Location
* Extraction Well
0 Neat Oil Deployment Location
- Boundary of cVOC Present in Soil
----- BVA Boundary
Vadose Zone Neat Oil Deployment Zones
L-...J OU-1 Boundary
c=J Building
-- Topographic Contou r (5-ft Interval)
--------- Topographic Contou r (1-ft Interval)
1\lm\ess\EnvProjects\EBM\LTS\ 111 \0061\271000\S11609\S1160900_mxd coatesc 06/06/201 4 1 :27:15 PM
GRAND JUNCTION , COLORADO Under DOE Contract No_ DE-AM01 -07LM00060
Neat Oil Deployment Locations
June 6, 2014 81160900

U.S. Department of Energy OU-1 Enhanced Attenuation Field Demonstration – Edible Oil Deployment Design, Mound June 2014 Doc. No. S11608 Page 5
The neat oil will be delivered and staged onsite in bulk tanks (e.g., Agmark tank or similar) or smaller volume totes to facilitate simultaneous injection at multiple locations. The oil will be deployed by gravity feed and the target delivery flow rate is 0.1 to 2.0 gallons per minute (gpm) at each location. It is anticipated that the deployment of the neat oil will take 5 to 10 days in the field. Equipment layout schematics, which include equipment and material specifications, are presented in Appendix A. Neat oil will be emplaced at discrete treatment zones using temporary well points screened directly above the water table in areas with elevated cVOC concentrations in the soil. The temporary wells will be constructed from 1.5-inch Schedule 40 PVC materials and have 5-ft screens. Specific construction requirements for the temporary wells are presented in Appendix B. Emulsified Oil Deployment The primary purpose of deploying emulsified oil into the subsurface is to stimulate the formation of active bioremediation treatment zones within the active plume footprint to degrade existing groundwater cVOC contamination and any future inputs. The areas below were selected to create deployment zones to achieve the following objectives:
Former landfill area—provide treatment of existing groundwater contamination and future mass discharge into the groundwater beneath the residual soil sources
Mid-plume—limit the magnitude of rebound within the plume
Downgradient contaminated zone—provide treatment of the contaminated groundwater near wells 0451, 0452, and P060
Distal zone—provide additional protection to limit plume expansion For this design, factory-prepared emulsion with amendments will be used. The undiluted emulsion will contain approximately 45 percent soybean oil, carbon substrate initiators (e.g., lactate), appropriate emulsifiers, vitamin B12, and nutrients (e.g., yeast extract). Emulsion shall have median droplet size less than or equal to 1 micrometer and be a commercially available reagent with a documented record of successful use. Injection locations (Figure 2) were determined using the recent distribution of cVOCs in groundwater and the geochemistry of the aquifer (DOE 2013). Three areas of cVOC contamination above the MCL have been identified in the OU-1 area: (1) beneath the southwest corner of the former landfill, (2) in the vicinity of wells 0410 and 0419, and (3) in the vicinity of wells 0451, 0452, and P060. Groundwater quality data from wells within the cVOC plume footprint depict lower dissolved oxygen concentrations and negative oxidation-reduction potential values, indicating that anaerobic environments occur locally.

OU-1 Enhanced Attenuation Field Demonstration – Edible Oil Deployment Design, Mound U.S. Department of Energy Doc. No. S11608 June 2014 Page 6
Figure 2. Emulsified Oil Deployment Locations
'•'·:: ::: ,, ,,,
\\\\
'·: •,:· . ··· I .. '' '
H \\\ ::· ::::'
:::
50
:: LEGEND
,J-1.
: 0416 \.\ ~
~ P043
0424 ~ ~ 0425
Emulsif ied Oil 0 Deployment Locations
~ Monitoring Well
\ ... \' .'
\\\
· .. ', \.
BVA Boundary
Structured Geochemical Zones Developed by Emusified Oil Injection
U.S. DEPARTMENT OF ENERGY GRAND JUNCTION , COLORADO
':GP-\18 0 '
eGP,,129\
Work Performed by
S.M. Stoller Corporation Under DOE Contract
No_ DE-AM01 -07LM00060
0 Geoprobe Location
* L-...J OU-1 Boundary
c=J Building Emulsified Oil Deployment Locations
Extraction Well
-- TCE Concentration -- Topographic Contou r (5-ft Interval)
- - TCE Concentration (estimated) Topographic Contou r (1-ft Interval) June 6, 2014 81161000 \llmless\EnvProjects\EBMILTS\111 \0061\271000\S11610\S1161000.mxd coatesc 06/06/2014 1:39:06 PM

U.S. Department of Energy OU-1 Enhanced Attenuation Field Demonstration – Edible Oil Deployment Design, Mound June 2014 Doc. No. S11608 Page 7
The amount of emulsified oil to be deployed is based on sediment retention and is determined by the following calculation:
Amount of Oil (lbs) = (Area)(ze)( b)( OR) Where:
Area = πr2 target deployment area assuming radial flow (ft2) ze = effective treatment height (ft) (screen length) b = sediment bulk density pounds per cubic foot (lb/ft3) (125 lb/ft3 for a silty sand) OR = oil retention (lb oil/lb sediment; based on product used and lithology, values of 0.001 to
0.002 are typical for soybean oil) (0.0015 to take into account silt and clay) (Borden 2006) The quantity of emulsion needed is then calculated by:
V (emulsion in gal) = lb Oil / 0.45 / 8.3 lb/gal Where: 0.45 = percentage (%) of oil in the standard emulsion A zone of influence with a minimum diameter of approximately 20 ft will be targeted at each deployment point. Table 2 presents the design parameters for the emulsified oil deployment within the OU-1 landfill footprint. The calculated minimum amounts of emulsified oil and volumes of emulsion and blending water for each location are presented in Appendix C.
Table 2. Emulsified Oil Deployment Design Parameters
Emulsified oil type 45% soybean oil with water balance
Amendments Lactate, yeast extract, and vitamin B12
Number of deployment point 19
Area to be treated at each point 315 sq ft (approximate)
Blending water P&T-extracted groundwater
Emulsion mixing ratio 50:1
Calculated total volume of emulsified oil required 4,442 gal

OU-1 Enhanced Attenuation Field Demonstration – Edible Oil Deployment Design, Mound U.S. Department of Energy Doc. No. S11608 June 2014 Page 8
The emulsified oil blended with nutrients will be delivered and staged onsite in either bulk tanks (e.g., Agmark tank or similar) or totes. This will facilitate simultaneous injection at multiple locations and eliminate mixing of the oil and nutrients onsite. The emulsified oil will be blended with treated groundwater from the P&T system to create an emulsion. Mixing will be performed using a mechanic proportioning system (i.e., Dostron) to deliver an emulsified oil and blending water ratio of 50:1. The emulsion will be injected in the subsurface and the target delivery flow rate is 6 to 10 gpm at each location. A distribution manifold system will be used that will allow for simultaneous deployment at multiple locations. The configuration of the deployment well groupings is presented in Appendix C. It is anticipated that the deployment of the emulsified oil mixture will take 30 to 45 days in the field. Equipment layout schematics, which include equipment and material specifications, are presented in Appendix D. Blending water will be obtained from the P&T system. Groundwater will be extracted from wells 0449, 0450, and 0452 and passed through the air stripper prior to use as blending water. Well 0452 will be converted into an extraction well for the field demonstration and connected to the P&T system in Building 300. Extracting water from well 0452 during the deployment of the emulsified oil will help mitigate the potential to spread contamination downgradient, especially during the injection operations near well P060. Operation of the P&T system using wells 0449, 0450, and 0452 will continue during the deployment of the emulsified oil and for a period of 3 to 4 months following the completion of injection. However, if emulsion is observed in any of the extraction wells during the deployment phase, the well(s) in question will be removed from service to prevent damage to the P&T system and to prevent alteration of the structure of the structured treatment zone. The emulsified oil mixture will be deployed using temporary wells screened below the water table within the outwash unit at the locations shown on Figure 2. The emulsified oil mixture will be injected under low pressures (i.e., pressure not to exceed 20 pounds per square inch). The temporary wells will be constructed from 1.5-inch Schedule 40 PVC materials. Specific construction requirements for the temporary wells are presented in Appendix E.
5.0 References DOE (U.S. Department of Energy), 2013. Field Demonstration Work Plan for Using Edible Oils to Achieve Enhanced Attenuation of cVOCs and a Groundwater Exit Strategy for the OU-1 Area, Mound, Ohio (Draft), LMS/MND/S11039, prepared for the U.S Department of Energy Office of Legacy Management, December. DOE (U.S. Department of Energy), 2014. OU-1 Enhanced Attenuation Field Demonstration Sampling and Analysis Plan, Mound, Ohio, Site (Draft), LMS/MND/S11745, prepared for the U.S Department of Energy Office of Legacy Management, April.

Appendix A
Neat Oil Deployment Equipment and Materials Specifications

This page intentionally left blank

U.S. Department of Energy OU-1 Enhanced Attenuation Field Demonstration – Edible Oil Deployment Design, Mound June 2014 Doc. No. S11608 Page A-1
Figure A-1. Neat Oil Deployment—Equipment Layout

OU-1 Enhanced Attenuation Field Demonstration – Edible Oil Deployment Design, Mound U.S. Department of Energy Doc. No. S11608 June 2014 Page A-2
This page intentionally left blank

Appendix B
Neat Oil Deployment Temporary Well Point Details

This page intentionally left blank

U.S. Department of Energy OU-1 Enhanced Attenuation Field Demonstration – Edible Oil Deployment Design, Mound June 2014 Doc. No. S11608 Page B-1
Figure B-1. Neat Oil Deployment—Temporary Well Design
Injection Hose Quick Connect
Coupler
Borehole Diameter: 3 1/4 inches
D
D 0
Riser Length: 2ft.
-+---Bentonite-Cement Annular Seal
1.5-inch Diameter Schedule 40 PVC Riser
Bentonite Pellet Seal (1-Foot Length)
5 to 35 Feet of Schedule 40 PVC 40 Slot Screen (Length dependent on depth to clay till layer)
Filter Pack containing #4 Ohio Quartz Sand or equivalent

OU-1 Enhanced Attenuation Field Demonstration – Edible Oil Deployment Design, Mound U.S. Department of Energy Doc. No. S11608 June 2014 Page B-2
Table B-1. Neat Oil Temporary Well Construction Specifics
Location ID Northing Easting Ground Elevation Total Depth
N-01 597323 1463928 712.71 35.0
N-02 597210 1463967 710.13 32.5
N-03 597214 1464006 710.74 33.0
N-04 597071 1463949 705.04 27.5
N-05 597080 1463982 706.43 28.5
N-06 597000 1464399 703.90 25.5
Notes: Total depth is based on water table being present at 678 ft Screen length = 5 ft

Appendix C
Emulsified Oil and Blending Water Volumes

This page intentionally left blank

U.S
. Departm
ent of Energy
OU
-1 Enhanced A
ttenuation Field D
emonstration – E
dible Oil D
eployment D
esign, Mound
June 2014
Doc. N
o. S11608
Page C
-1
Table C-1. Emulsified Oil Volumes
Location ID
ze
(ft) Oil (lb)
Emulsion(gal)
Volume of Treatment Area (gal)
Volume of Emulsion + Water (gal)
Volume of Water for 50:1 (gal)
Notes
E-01 9 530.14 141.26 5,287.30 7,204.19 7,062.93 Oil needed based on sediment retention: lb oil (retention based) = (Area)(ze)( b)( OR) Where: Area = πr2 target deployment area assuming radial flow (ft2) [314.16] r = 10 ft ze = effective treatment height (ft) [screen length] b = sediment bulk density (lb/ft3) [125 lb/ft3 for a silty sand] OR = oil retention (lb oil / lb sediment; based on product used and lithology, values of 0.001 to 0.002 are typical for soybean oil) [0.0015 to take into account silt and clay] (Borden, 2006) The quantity of emulsion needed is then calculated by: Volume emulsion (gal) = lb Oil / 0.45 / 8.3 lb/gal (to account for the fact that standard emulsions are approximately 45% oil) The total volume of the treatment area is calculated by simple geometry: Total volume (gal) = (Area)(ze)(e)(7.48) Where: e = effective porosity (--) [0.25] 7.48 = conversion from ft3 to gal The total volume of blending water needed for a 50:1 ratio: Total volume blending water (gal) = (emulsion)(50) If the volume of blending water + emulsion is greater than the total volume of the treatment area, then adequate coverage will be achieved.
E-02 9 530.14 141.26 5,287.30 7,204.19 7,062.93
E-03 6 353.43 94.17 3,524.87 4,802.79 4,708.62
E-04 17 1,001.38 266.82 9,987.12 13,607.92 13,341.10
E-05 7 412.33 109.87 4,112.34 5,603.26 5,493.39
E-06 6 353.43 94.17 3,524.87 4,802.79 4,708.62
E-07 17 1,001.38 266.82 9,987.12 13,607.92 13,341.10
E-08 18 1,060.29 282.52 10,574.60 14,408.38 14,125.87
E-09 21 1,237.00 329.60 12,337.03 16,809.78 16,480.18
E-10 10 589.05 156.95 5,874.78 8,004.66 7,847.70
E-11 5 294.52 78.48 2,937.39 4,002.33 3,923.85
E-12 23 1,354.81 360.99 13,511.99 18,410.71 18,049.72
E-13 30 1,767.15 470.86 17,624.33 24,013.97 23,543.11
E-14 29 1,708.24 455.17 17,036.86 23,213.51 22,758.34
E-15 25 1,472.62 392.39 14,686.95 20,011.64 19,619.26
E-16 13 765.76 204.04 7,637.21 10,406.05 10,202.01
E-17 19 1,119.19 298.21 11,162.08 15,208.85 14,910.64
E-18 12 706.86 188.34 7,049.73 9,605.59 9,417.24
E-19 7 412.33 109.87 4,112.34 5,603.26 5,493.39
TOTALS 16,670.08 4,441.80 166,256.22 226,531.81 222,090.01
OU-1 Enhanced Attenuation Field Demonstration – Edible Oil Deployment Design, Mound U.S. Department of Energy Doc. No. S11608 June 2014 Page C-2
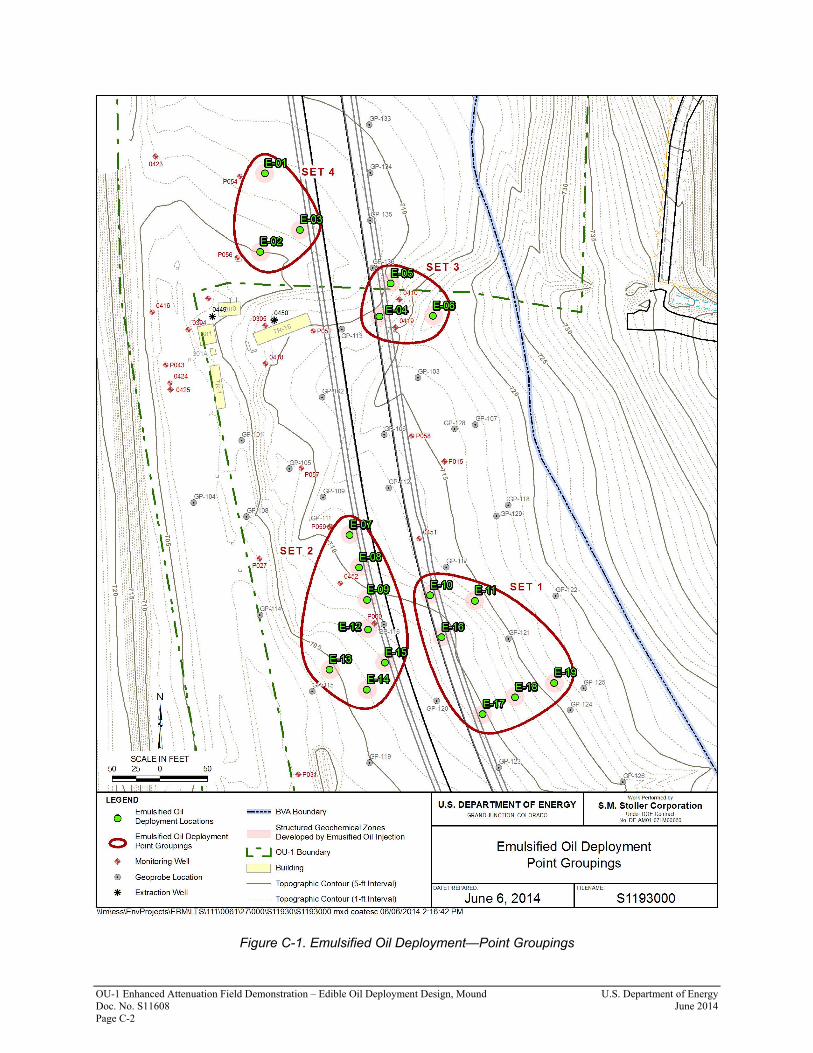
Figure C-1. Emulsified Oil Deployment—Point Groupings
SCALE IN FEET
GP-1o4 '. 0 '
(_\_ _\c3~~., --\ .... , .... ·· .. I ~f,-108
\:
··-n'
...... ,.······· ... ·- ... ____ , ',',
\ ...... ··., \
:_,
50 25 50
::
0
0
*
,, '' Emulsified Oil Deployment Locations
Emulsified Oil Deployment Point Groupings
Monitoring Well
Geoprobe Location
Extraction Well
BVA Boundary
Structured Geochemical Zones Developed by Emusified Oil Injection
L-...J OU-1 Boundary
c=J Buildi ng
-- Topographic Contou r (5-ft Interval)
--------- Topographic Contou r (1-ft Interval)
--·······------.. ::··
GP-l28 \ GP-10t\
0 ·. 0 '·
GRAND JUNCTION , COLORADO
Emulsified Oil Deployment Point Groupings
June 6, 2014 81193000 1\lm\ess\EnvProjects\EBM\LTS\ 111 \0061\271000\S11930\S1193000.mxd coatesc 06/06/201 4 2:16:42 PM

Appendix D
Emulsified Oil Deployment Equipment and Materials Specifications

This page intentionally left blank

U.S
. Departm
ent of Energy
OU
-1 Enhanced A
ttenuation Field D
emonstration – E
dible Oil D
eployment D
esign, Mound
June 2014
Doc. N
o. S11608
Page D
-1
Figure D-1. Emulsified Oil Deployment—Equipment Layout

OU-1 Enhanced Attenuation Field Demonstration – Edible Oil Deployment Design, Mound U.S. Department of Energy Doc. No. S11608 June 2014 Page D-2
This page intentionally left blank

Appendix E
Emulsified Oil Deployment Temporary Well Point Details

This page intentionally left blank

U.S. Department of Energy OU-1 Enhanced Attenuation Field Demonstration – Edible Oil Deployment Design, Mound June 2014 Doc. No. S11608 Page E-1
Figure E-1. Emulsified Oil Deployment—Temporary Well Design
Injection Hose Quick Connect
Coupler
Borehole Diameter: 3 1/4 inches
0
D 0
Riser Length: 2 ft.
:+-- -Bentonite-Cement Annular Seal
1.5-inch Diameter Schedule 40 PVC Riser
Bentonite Pellet Seal ( 1-F oot Length)
5 to 35 Feet of Schedule 40 PVC 40 Slot Screen (Length dependent on depth to clay till layer)
Filter Pack containing #4 Ohio Quartz Sand or equivalent
OU-1 Enhanced Attenuation Field Demonstration – Edible Oil Deployment Design, Mound U.S. Department of Energy Doc. No. S11608 June 2014 Page E-2
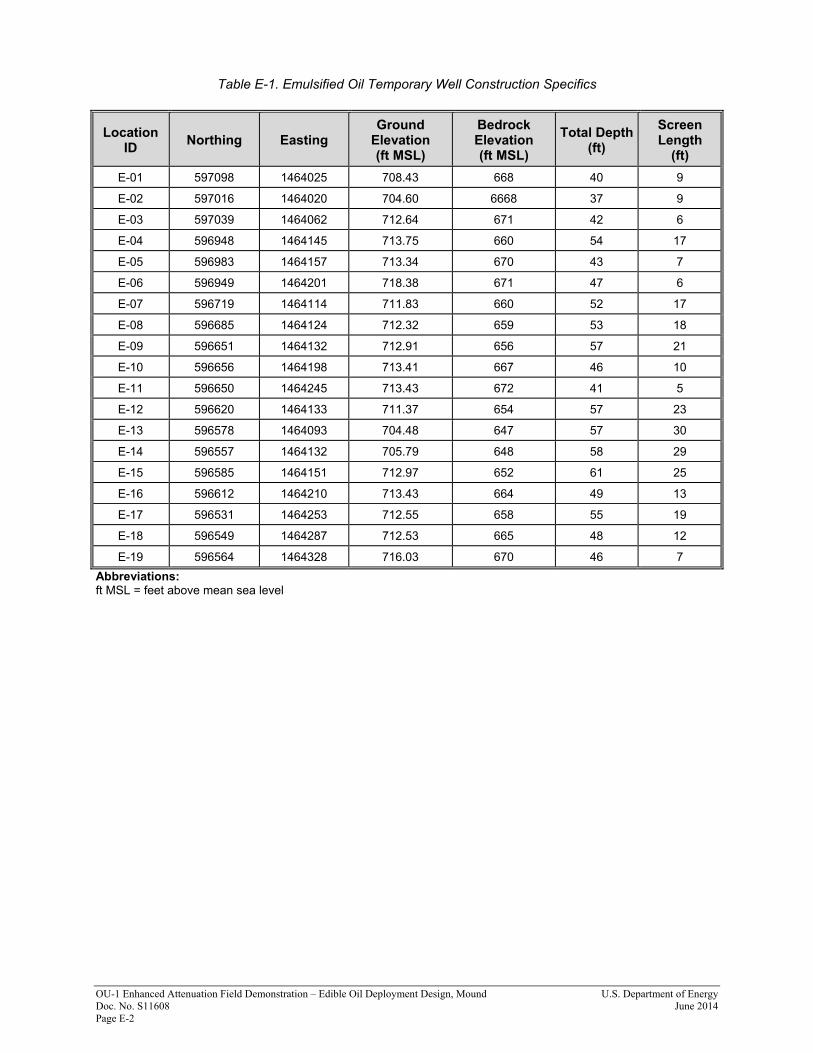
Table E-1. Emulsified Oil Temporary Well Construction Specifics
Location ID
Northing Easting Ground
Elevation (ft MSL)
Bedrock Elevation (ft MSL)
Total Depth (ft)
Screen Length
(ft)
E-01 597098 1464025 708.43 668 40 9
E-02 597016 1464020 704.60 6668 37 9
E-03 597039 1464062 712.64 671 42 6
E-04 596948 1464145 713.75 660 54 17
E-05 596983 1464157 713.34 670 43 7
E-06 596949 1464201 718.38 671 47 6
E-07 596719 1464114 711.83 660 52 17
E-08 596685 1464124 712.32 659 53 18
E-09 596651 1464132 712.91 656 57 21
E-10 596656 1464198 713.41 667 46 10
E-11 596650 1464245 713.43 672 41 5
E-12 596620 1464133 711.37 654 57 23
E-13 596578 1464093 704.48 647 57 30
E-14 596557 1464132 705.79 648 58 29
E-15 596585 1464151 712.97 652 61 25
E-16 596612 1464210 713.43 664 49 13
E-17 596531 1464253 712.55 658 55 19
E-18 596549 1464287 712.53 665 48 12
E-19 596564 1464328 716.03 670 46 7
Abbreviations: ft MSL = feet above mean sea level