our financial results - ubs · our financial results first quarter 2016 report. 1 ubs group key...
TRANSCRIPT

Our financial resultsFirst quarter 2016 report


1
UBS Group key figures
As of or for the quarter ended
CHF million, except where indicated 31.3.16 31.12.15 31.3.15
Group results
Operating income 6,833 6,775 8,841
Operating expenses 5,855 6,541 6,134
Operating profit / (loss) before tax 978 234 2,708
Net profit / (loss) attributable to UBS Group AG shareholders 707 949 1,977
Diluted earnings per share (CHF)1 0.18 0.25 0.53
Key performance indicators2
Profitability
Return on tangible equity (%) 6.0 8.1 17.8
Return on assets, gross (%) 2.9 2.8 3.4
Cost / income ratio (%) 85.7 95.7 69.2
Growth
Net profit growth (%) (25.5) (54.1) 130.4
Net new money growth for combined wealth management businesses (%) 5.9 2.9 3.8
Resources
Common equity tier 1 capital ratio (fully applied, %)3 14.0 14.5 13.7
Leverage ratio (phase-in, %)4 6.0 6.2 5.6
Additional information
Profitability
Return on equity (RoE) (%) 5.1 6.9 15.4
Return on risk-weighted assets, gross (%)5 13.0 12.9 16.4
Resources
Total assets 966,873 942,819 1,048,850
Equity attributable to UBS Group AG shareholders 54,845 55,313 52,359
Common equity tier 1 capital (fully applied)3 29,853 30,044 29,566
Common equity tier 1 capital (phase-in)3 36,580 40,378 40,779
Risk-weighted assets (fully applied)3 213,558 207,530 216,385
Common equity tier 1 capital ratio (phase-in, %)3 16.9 19.0 18.6
Total capital ratio (fully applied, %)3 22.7 22.9 20.6
Total capital ratio (phase-in, %)3 25.7 26.8 25.9
Leverage ratio (fully applied, %)4 5.4 5.3 4.6
Leverage ratio denominator (fully applied)4 905,801 897,607 976,934
Liquidity coverage ratio (%)6 134 124 116
Other
Invested assets (CHF billion)7 2,618 2,689 2,708
Personnel (full-time equivalents) 60,547 60,099 60,113
Market capitalization8 59,638 75,147 68,508
Total book value per share (CHF)8 14.74 14.75 14.33
Tangible book value per share (CHF)8 13.04 13.00 12.59
1 Refer to “Note 9 Earnings per share (EPS) and shares outstanding” in the “Consolidated financial statements” section of this report for more information. 2 Refer to the “Measurement of performance” section of our Annual Report 2015 for the definitions of our key performance indicators. 3 Based on the Basel III framework as applicable for Swiss systemically relevant banks (SRBs). Refer to the “Capital management” section of this report for more information. 4 Calculated in accordance with Swiss SRB rules. Refer to the “Capital management” section of this report for more information. From 31 December 2015 onward, the leverage ratio denominator calculation is fully aligned with the Basel III rules. Figures for periods prior to 31 December 2015 are calculated in accordance with former Swiss SRB rules and are therefore not fully comparable. 5 Based on fully applied risk-weighted assets. 6 Refer to the “Liquidity and funding management” section of this report for more information. Figures represent a 3-month average. The average first quarter 2015 liquidity coverage ratio was adjusted from 122% to 116%. 7 Includes invested assets for Personal & Corporate Banking. 8 Refer to the “UBS shares” section of this report for more information.

First quarter 2016 report
2
Contacts
Media RelationsUBS’s Media Relations team supports global media and journalists from offices in Zurich, London, New York and Hong Kong.
www.ubs.com/media
Zurich +41-44-234 8500 [email protected]
London +44-20-7567 4714 [email protected]
New York +1-212-882 5857 [email protected]
Hong Kong +852-2971 8200 [email protected]
Office of the Group Company SecretaryThe Group Company Secretary receives inquiries on compensation and related issues addressed to members of the Board of Directors.
UBS Group AG, Office of the Group Company Secretary P.O. Box, CH-8098 Zurich, Switzerland
Hotline +41-44-235 6652 Fax +41-44-235 8220
Shareholder ServicesUBS’s Shareholder Services team, a unit of the Group Company Secretary office, is responsible for the registration of the global registered shares.
UBS Group AG, Shareholder Services P.O. Box, CH-8098 Zurich, Switzerland
Hotline +41-44-235 6652 Fax +41-44-235 8220
US Transfer AgentFor global registered share-related inquiries in the US.
Computershare Trust Company NA P.O. Box 30170 College Station TX 77842–3170, USA
Shareholder online inquiries: https://www-us.computershare.com/ investor/Contact
Shareholder website: www.computershare.com/investor
Calls from the US +1-866-305-9566 Calls from outside the US +1-781-575-2623 TDD for hearing impaired +1-800-231-5469 TDD for foreign shareholders +1-201-680-6610
Beginning with the first quarter of 2016, and in line with standard industry practice, UBS will no longer publish a separate quarterly shareholder letter. UBS will continue to publish a shareholder letter as part of its annual report.
SwitchboardsFor all general inquiries. Zurich +41-44-234 1111 London +44-20-7567 8000 New York +1-212-821 3000 Hong Kong +852-2971 8888 www.ubs.com/contact
Investor RelationsUBS’s Investor Relations team supports institutional, professional and retail investors from our offices in Zurich, London, New York and Singapore.
UBS Group AG, Investor Relations P.O. Box, CH-8098 Zurich, Switzerland
www.ubs.com/investors
Hotline Zurich +41-44-234 4100 Hotline New York +1-212-882 5734 Fax (Zurich) +41-44-234 3415
Terms used in this report, unless the context requires otherwise
“UBS,” “UBS Group,” “UBS Group AG (consolidated),” “Group,” “the Group,” “we,” “us” and “our” UBS Group AG and its consolidated subsidiaries
“UBS AG (consolidated)” UBS AG and its consolidated subsidiaries
“UBS Group AG” and “UBS Group AG (standalone)” UBS Group AG on a standalone basis
“UBS AG” and “UBS AG (standalone)” UBS AG on a standalone basis
“UBS Switzerland AG” UBS Switzerland AG on a standalone basis
“UBS Limited” UBS Limited on a standalone basis

Corporate calendar UBS Group AG
Annual General Meeting 2016: Tuesday, 10 May 2016 Publication of the second quarter 2016 report: Friday, 29 July 2016 Publication of the third quarter 2016 report: Tuesday, 1 November 2016 Fourth quarter 2016 earnings release: Tuesday, 31 January 2017
1. UBS Group
6 Recent developments8 Group performance
2. UBS business divisions and Corporate Center
22 Wealth Management26 Wealth Management Americas31 Personal & Corporate Banking34 Asset Management38 Investment Bank42 Corporate Center
3. Risk, treasury and capital management
55 Risk management and control71 Balance sheet74 Liquidity and funding management78 Capital management99 UBS shares
4. Consolidated financial statements
103 UBS Group AG interim consolidated financial statements (unaudited)
150 UBS AG interim consolidated financial information (unaudited)
5. Legal entity financial and regulatory information
155 UBS Group AG 157 UBS AG 161 UBS Switzerland AG 165 UBS Limited
Appendix
168 Abbreviations frequently used in our financial reports
170
171
Information sourcesCautionary statement
Corporate calendar UBS AG*
Publication of the first quarter 2016 report: Friday, 6 May 2016
* Publication dates of further quarterly and annual reports and results will be made available as part of the corporate calendar of UBS AG at www.ubs.com/investors
Imprint
Publisher: UBS Group AG, Zurich, Switzerland | www.ubs.com Language: English | SAP-No. 80834E-1601
© UBS 2016. The key symbol and UBS are among the registered and unregistered trademarks of UBS. All rights reserved.
Printed in Switzerland on chlorine-free paper with mineral oil-reduced inks. Paper production from socially responsible and ecologically sound forestry practices.

First quarter 2016 report
4
UBS and its businesses
We provide financial advice and solutions to private, institutional and corporate clients worldwide, as well as private clients in Switzerland. The operational structure of the Group is comprised of our Corporate Center and five business divisions: Wealth Management, Wealth Management Americas, Personal & Corporate Banking, Asset Management and the Investment Bank. Our strategy builds on the strengths of all of our businesses and focuses our efforts on areas in which we excel, while seeking to capitalize on the compelling growth prospects in the businesses and regions in which we operate, in order to generate attractive and sustainable returns for our shareholders. All of our businesses are capital-efficient and benefit from a strong competitive position in their targeted markets.
Wealth Management
Wealth Management provides comprehensive advice and finan-cial services to wealthy private clients around the world, with the exception of those served by Wealth Management Americas. UBS is a global firm with global capabilities, and its clients benefit from a full spectrum of resources, including wealth planning, invest-ment management solutions and corporate finance advice, bank-ing and lending solutions, as well as a wide range of specific offer-ings. Wealth Management’s guided architecture model gives clients access to a wide range of products from the world’s lead-ing third-party institutions that complement its own products.
Wealth Management Americas
Wealth Management Americas is one of the leading wealth man-agers in the Americas in terms of financial advisor productivity and invested assets. Its business includes UBS’s domestic US and Canadian wealth management businesses, as well as interna-tional business booked in the US. It provides a fully integrated set of wealth management solutions designed to address the needs of ultra high net worth and high net worth clients.
Personal & Corporate Banking
Personal & Corporate Banking provides comprehensive financial products and services to UBS’s private, corporate and institutional clients in Switzerland, maintaining a leading position in these seg-ments and embedding its offering in a multi-channel approach. The business is a central element of UBS’s universal bank delivery model in Switzerland, supporting other business divisions by referring clients and growing the wealth of the firm’s private cli-ents so they can be transferred to Wealth Management. Personal & Corporate Banking leverages the cross-selling potential of UBS’s asset-gathering and investment bank businesses, and manages a substantial part of UBS’s Swiss infrastructure and banking prod-ucts platform.
Asset Management
Asset Management is a large-scale asset manager, with a pres-ence in 22 countries. It offers investment capabilities and invest-ment styles across all major traditional and alternative asset classes to institutions, wholesale intermediaries and wealth management clients around the world. It is a leading fund house in Europe, the largest mutual fund manager in Switzerland, the third-largest international asset manager in Asia, the second largest fund of hedge funds manager and one of the largest real estate invest-ment managers in the world.
Investment Bank
The Investment Bank provides corporate, institutional and wealth management clients with expert advice, innovative solutions, exe-cution and comprehensive access to international capital markets. It offers advisory services and provides in-depth cross-asset research, along with access to equities, foreign exchange, pre-cious metals and selected rates and credit markets, through its business units, Corporate Client Solutions and Investor Client Ser-vices. The Investment Bank is an active participant in capital mar-kets flow activities, including sales, trading and market-making across a range of securities.
Corporate Center
Corporate Center is comprised of Services, Group Asset and Lia-bility Management (Group ALM) and Non-core and Legacy Portfolio. Services includes the Group’s control functions such as finance, risk control (including compliance) and legal, and, within these, certain corporate and stewardship services and the costs associated therewith. In addition, it provides all logistics and support services, including operations, information technology, human resources, regulatory relations and strategic initiatives, communications and branding, corporate services, physical secu-rity, information security as well as outsourcing, nearshoring and offshoring. Group ALM is responsible for business division-aligned risk management, capital investment and issuance and Group structural risk management activities. Non-core and Legacy Port-folio is comprised of the non-core businesses and legacy positions that were part of the Investment Bank prior to its restructuring.
UBS GroupManagement report

Recent developments
6
Recent developments
Financial reporting and accounting changes
Own creditIn the first quarter of 2016, we adopted the own credit presenta-tion requirements of IFRS 9, Financial Instruments. Under these requirements of IFRS 9, changes in the fair value of financial liabil-ities designated at fair value through profit or loss related to own credit are recognized in Other comprehensive income directly within Retained earnings. As the Group does not hedge changes in own credit arising on financial liabilities designated at fair value, presenting own credit within Other comprehensive income does not create or increase an accounting mismatch in the income statement. The unrealized and any realized own credit recognized in Other comprehensive income will not be reclassified to the income statement in future periods. Changes in own credit pre-sented in prior periods have not been restated and remain within Net trading income. We will adopt the classification, measure-ment and impairment requirements of IFRS 9 as of the mandatory effective date of 1 January 2018.
➔ Refer to “Note 10 Fair value measurement” in the “Consolidated
financial statements” section of this report for more information
Balance sheet classification of newly purchased high-quality liquid debt securitiesStarting with the first quarter of 2016, we classify newly pur-chased debt securities held as high-quality liquid assets (HQLA), and managed by Corporate Center – Group Asset and Liability Management (Group ALM), as either financial assets designated at fair value through profit or loss or financial assets held to matu-rity. Debt securities acquired prior to the first quarter of 2016 and held for liquidity purposes remain classified as financial assets available for sale.
Classification of debt securities as financial assets designated at fair value through profit or loss is applied for most debt securi-ties purchased starting with the first quarter of 2016, and is intended to reduce accounting mismatches by ensuring that changes in the fair value of the securities are recognized in the income statement in line with the associated interest rate deriva-tives used for risk management purposes. A small portion of newly purchased debt securities are classified as financial assets held to maturity, reflecting the intended holding period for these assets.
➔ Refer to “Note 1 Basis of accounting” in the “Consolidated
financial statements” section of this report for more information
Change in disclosure of Group ALM activitiesTo further enhance the transparency of Group ALM, effective 2016, Group ALM’s results are disclosed for the three main risk management activities: (i) business division-aligned risk manage-ment, (ii) capital investment and issuance and (iii) Group structural risk management. Prior periods are presented in accordance with this new structure.
Change in Asset Management business linesAs of 1 January 2016, Asset Management was reorganized into the following business lines: (i) Equities, Multi Asset & O’Connor, (ii) Fixed Income, (iii) Global Real Estate, (iv) Infrastructure and Pri-vate Equity, (v) Solutions and (vi) Fund Services. This change is reflected throughout this report and prior-period figures are pre-sented in accordance with this new structure.
Cost reduction targetWe have identified structural cost reduction opportunities of a front-to-back nature that will result in business divisions contrib-uting to our CHF 2.1 billion net cost reduction target.
Regulatory and legal developments
Basel Committee on Banking Supervision proposes changes to the capital frameworkIn the first quarter of 2016, the Basel Committee on Banking Supervision (BCBS) published a series of consultation papers as part of the revision of the BCBS capital framework, which the BCBS expects to complete by the end of 2016.
In March 2016, the BCBS published a consultation document proposing restrictions on the use of internal model approaches for the calculation of credit risk-weighted assets (RWA). Specifically, the BCBS proposes to (i) remove the option to use the internal ratings-based approaches for certain exposure categories, such as loans to banks, other financial institutions and large corporates, (ii) adopt exposure-level, model-parameter floors, and (iii) provide greater specification of parameter estimation practices.
In a separate consultation document, also published in March 2016, the BCBS proposed to replace existing standardized and advanced measurement approaches for calculating operational risk capital with a single non-model-based method, the so-called standardized measurement approach.
We expect that if the proposals are adopted in their current form and implemented in Switzerland, the proposed changes to the capital framework would likely result in a significant increase in our overall RWA.

UBS
Gro
up
7
The BCBS has also proposed changes to Pillar 3 disclosure requirements in a consultation document published in March 2016, including a new requirement to disclose hypothetical RWA calculated on the basis of the Basel framework’s standardized approach, as a benchmark to RWA calculated using the internal ratings-based approach.
In April 2016, the BCBS published a consultation document proposing revisions to the Basel III leverage ratio framework, including changes to the treatment of derivative exposures, regu-lar-way purchases and sales of financial assets, and provisions. As part of this consultation, the BCBS also asked for views on addi-tional leverage ratio requirements applicable to global systemi-cally important banks.
Margin requirements for non-cleared over-the-counter derivatives Regulators in various jurisdictions, including Switzerland, the EU and the US, have issued rules that require the margining of non-cleared over-the-counter (OTC) derivatives. While the specifics vary from jurisdiction to jurisdiction, the rules require that coun-terparties transacting in OTC derivatives that are not cleared by an appropriate central counterparty must exchange both initial and variation margin, using the forms of permitted collateral and col-lateral haircuts specified by the rules. The requirements of the various non-cleared bilateral margin rules will be phased in begin-ning in September 2016 and are expected to have significant implications for the operations of, and collateral requirements for, our and many of our clients’ OTC derivatives activities.
US Federal Reserve re-proposes rule for single counterparty riskIn March 2016, the Federal Reserve Board proposed a rule to impose new limits on significant single-counterparty credit expo-sures of large banking organizations, including large US bank holding companies and US operations of foreign banking organi-zations. The proposal would apply single-counterparty credit lim-its to US-domiciled bank holding companies with total consoli-dated assets of USD 50 billion or more.
The proposed limits are designed to become more stringent as the systemic importance of a firm increases. Under the proposal, the exposure of our US operations to another systemically impor-tant financial firm would be limited to a maximum of 15% of our tier 1 capital, and exposure to any other single counterparty would be restricted to 25% of our tier 1 capital.
In addition, the single-counterparty credit limits would apply separately to UBS Americas Holding LLC, our US intermediate holding company (IHC), based on its capital. If adopted as pro-posed, these limits may affect how we conduct our operations in the US, including our use of other financial firms for payments and securities clearing services and as transactional counterparties.
US Department of Labor finalizes fiduciary rule In April 2016, the US Department of Labor (DOL) adopted a rule that expands the definition of “fiduciary” under the Employee Retirement Income Security Act of 1974 (ERISA). The rule becomes effective in April 2017, although certain aspects of the rule do not become effective until January 2018. The rule will require all advi-sors, including broker-dealers, to abide by an ERISA fiduciary stan-dard in dealings with qualified retirement plans and individual retirement accounts. The rule prohibits various customary transac-tions and fee arrangements in the financial services industry with respect to retirement plan investors, unless certain exemption cri-teria are fully met. We are currently determining the changes we will need to make to our business practices, policies and proce-dures, and fee structures to comply with the rule. Wealth Man-agement Americas and Asset Management will likely be required to materially change some of their business processes in response to the rule.
US Treasury proposes regulations affecting treatment of debt issued by a US entity to a foreign parentIn April 2016, the US Internal Revenue Service (IRS), in an effort to deter inversions of US corporations, issued proposed regulations that would authorize the IRS to re-characterize debt of a US sub-sidiary to an affiliated foreign corporation as equity if the US entity engages in certain types of transactions with affiliated com-panies or if documentation requirements are not met. The pro-posed regulations are effective for transactions entered into on or after 4 April 2016 and may affect debt issued by our US-domiciled subsidiaries to a non-US UBS entity. If debt issued by any US affil-iates of UBS were re-characterized under the proposed regula-tions, this could result in the partial or total loss of US interest expense deductions, and the imposition of US withholding taxes on payments on the relevant debt.

Group performance
8
Group performance
Net profit attributable to UBS Group AG shareholders was CHF 707 million in the first quarter of 2016 compared with CHF 949 million in the fourth quarter of 2015. We recorded an operating profit before tax of CHF 978 million compared with CHF 234 million. On an adjusted basis, operating profit before tax was CHF 1,366 million compared with CHF 754 million, mainly driven by CHF 629 million lower non-personnel expenses. We recorded a net tax expense of CHF 270 million compared with a net tax benefit of CHF 715 million in the prior quarter.
Income statement
For the quarter ended % change from
CHF million 31.3.16 31.12.15 31.3.15 4Q15 1Q15
Net interest income 1,712 1,759 1,637 (3) 5
Credit loss (expense) / recovery (3) (59) (16) (95) (81)
Net interest income after credit loss expense 1,709 1,700 1,621 1 5
Net fee and commission income 4,093 4,218 4,401 (3) (7)
Net trading income 1,013 898 2,135 13 (53)
of which: net trading income excluding own credit 1,013 863 1,908 17 (47)
of which: own credit on financial liabilities designated at fair value 35 226
Other income 17 (41) 685 (98)
Total operating income 6,833 6,775 8,841 1 (23)
of which: net interest and trading income 2,725 2,657 3,772 3 (28)
Personnel expenses 3,924 3,843 4,172 2 (6)
General and administrative expenses 1,664 2,413 1,713 (31) (3)
Depreciation and impairment of property, equipment and software 243 260 221 (7) 10
Amortization and impairment of intangible assets 23 24 28 (4) (18)
Total operating expenses 5,855 6,541 6,134 (10) (5)
Operating profit / (loss) before tax 978 234 2,708 318 (64)
Tax expense / (benefit) 270 (715) 670 (60)
Net profit / (loss) 708 950 2,038 (25) (65)
Net profit / (loss) attributable to non-controlling interests 0 1 61 (100) (100)
Net profit / (loss) attributable to UBS Group AG shareholders 707 949 1,977 (26) (64)
Comprehensive income
Total comprehensive income 349 1,164 1,726 (70) (80)
Total comprehensive income attributable to non-controlling interests (50) 38 (81) (38)
Total comprehensive income attributable to UBS Group AG shareholders 399 1,126 1,808 (65) (78)

UBS
Gro
up
9
Performance by business division and Corporate Center unit – reported and adjusted1, 2
For the quarter ended 31.3.16
CHF million
Wealth Manage-
ment
Wealth Manage-
ment Americas
Personal &Corporate
Banking
Asset Manage-
mentInvestment
BankCC –
Services3
CC –Group
ALM
CC – Non-core and
LegacyPortfolio UBS
Operating income as reported 1,885 1,889 963 468 1,879 (55) (150) (47) 6,833
of which: net foreign currency translation losses4 (123) (123)
Operating income (adjusted) 1,885 1,889 963 468 1,879 (55) (27) (47) 6,956
Operating expenses as reported 1,327 1,678 564 378 1,625 148 (2) 135 5,855
of which: personnel-related restructuring expenses5 2 0 0 1 17 107 0 1 128
of which: non-personnel-related restructuring expenses5 14 0 0 2 2 118 0 0 137
of which: restructuring expenses allocated from CC – Services5 62 33 23 17 97 (233) 0 1 0
Operating expenses (adjusted) 1,248 1,645 541 358 1,508 156 (2) 133 5,590
of which: expenses for provisions for litigation, regulatory and similar matters 0 18 (1) 0 (1) 0 0 23 39
Operating profit / (loss) before tax as reported 557 211 399 90 253 (203) (148) (183) 978
Operating profit / (loss) before tax (adjusted) 636 244 422 110 370 (211) (25) (181) 1,366
For the quarter ended 31.12.15
CHF million
Wealth Manage-
ment
Wealth Manage-
ment Americas
Personal &Corporate
Banking
Asset Manage-
mentInvestment
BankCC –
Services3
CC –Group
ALM
CC – Non-core and
LegacyPortfolio UBS
Operating income as reported 1,869 1,885 915 568 1,721 (54) (59) (71) 6,775
of which: own credit on financial liabilities designated at fair value6 35 35
of which: net foreign currency translation gain4 115 115
of which: gains on sales of subsidiaries and businesses (28) 56 28
of which: net losses related to the buyback of debt (257) (257)
Operating income (adjusted) 1,897 1,885 915 512 1,721 (54) 48 (71) 6,854
Operating expenses as reported 1,526 1,871 560 397 1,641 291 (3) 258 6,541
of which: personnel-related restructuring expenses5 3 0 0 3 12 144 0 1 164
of which: non-personnel-related restructuring expenses5 14 0 0 8 2 252 0 0 276
of which: restructuring expenses allocated from CC – Services5 116 50 41 27 129 (377) 0 15 0
Operating expenses (adjusted) 1,393 1,821 519 359 1,498 272 (3) 241 6,100
of which: expenses for provisions for litigation, regulatory and similar matters 79 233 0 (3) 4 1 0 51 365
Operating profit / (loss) before tax as reported 344 14 355 171 80 (345) (56) (329) 234
Operating profit / (loss) before tax (adjusted) 505 64 396 153 223 (326) 51 (312) 754

Group performance
10
Results: 1Q16 vs 4Q15
We recorded an operating profit before tax of CHF 978 million compared with CHF 234 million. Operating income increased by CHF 58 million, reflecting a CHF 68 million increase in combined net interest and trading income, CHF 58 million higher other income, as well as a CHF 56 million reduction in net credit loss expense, partly offset by CHF 125 million lower net fee and com-mission income. Operating expenses decreased by CHF 686 mil-lion, primarily due to CHF 326 million lower net expenses for pro-visions for litigation, regulatory and similar matters and as the prior quarter included an expense of CHF 166 million for the annual UK bank levy.
In addition to reporting our results in accordance with Interna-tional Financial Reporting Standards (IFRS), we report adjusted results that exclude items that management believes are not rep-resentative of the underlying performance of our businesses. Such adjusted results are non-GAAP financial measures as defined by SEC regulations. For the first quarter of 2016, we excluded net foreign currency translation losses of CHF 123 mil-lion and net restructuring expenses of CHF 265 million. For the fourth quarter of 2015, we excluded net losses of CHF 257 mil-lion related to the buyback of debt in a tender offer, a net foreign currency translation gain of CHF 115 million, an own credit gain of CHF 35 million, net gains of CHF 28 million on the sale of subsidiaries and businesses as well as net restructuring expenses of CHF 441 million.
On this adjusted basis, operating profit before tax was CHF 1,366 million in the first quarter compared with CHF 754 million in the prior quarter mainly driven by CHF 629 million lower non-personnel expenses.
Due to our ongoing efforts to optimize our legal entity struc-ture, we anticipate that further foreign currency translation gains and losses previously booked directly into equity through other comprehensive income will be released into profit and loss due to the disposal or partial disposal of foreign branches and subsidiar-ies. As a result, we currently expect to record net foreign currency translation losses of around CHF 40 million in the second quarter of 2016 and around CHF 150 million in the second half of 2016, although these net losses could be recognized in different peri-ods. Consistent with past practice, these net losses will be treated as adjusting items and recorded in Corporate Center – Group Asset and Liability Management (Group ALM). The release of for-eign currency translation losses from equity to profit and loss does not affect shareholders’ equity or regulatory capital.
Operating income: 1Q16 vs 4Q15
Total operating income was CHF 6,833 million compared with CHF 6,775 million. On an adjusted basis, total operating income increased by CHF 102 million to CHF 6,956 million, reflecting an increase of CHF 103 million in combined net interest and trading income, CHF 67 million higher other income and a CHF 56 million lower net credit loss expense, partly offset by CHF 125 million lower net fee and commission income.
Performance by business division and Corporate Center unit – reported and adjusted1, 2 (continued)
For the quarter ended 31.3.15
CHF million
Wealth Manage-
ment
Wealth Manage-
ment Americas
Personal &Corporate
Banking
Asset Manage-
mentInvestment
BankCC –
Services3
CC –Group
ALM
CC – Non-core and
LegacyPortfolio UBS
Operating income as reported 2,247 1,801 979 511 2,657 374 313 (41) 8,841
of which: own credit on financial liabilities designated at fair value6 226 226
of which: gains on sales of real estate 378 378
of which: gains on sales of subsidiaries and businesses 141 141
Operating income (adjusted) 2,106 1,801 979 511 2,657 (4) 87 (41) 8,096
Operating expenses as reported 1,296 1,548 552 343 1,891 337 (4) 171 6,134
of which: personnel-related restructuring expenses5 3 0 1 0 2 62 0 1 68
of which: non-personnel-related restructuring expenses5 5 0 0 0 2 230 0 0 237
of which: restructuring expenses allocated from CC – Services5 39 24 16 17 66 (173) 0 11 0
Operating expenses (adjusted) 1,250 1,524 536 325 1,821 218 (4) 160 5,829
of which: expenses for provisions for litigation, regulatory and similar matters 15 15 (2) 0 9 8 0 13 58
Operating profit / (loss) before tax as reported 951 253 427 168 766 37 317 (212) 2,708
Operating profit / (loss) before tax (adjusted) 856 277 443 186 836 (222) 91 (201) 2,2681 Adjusted results are non-GAAP financial measures as defined by SEC regulations. 2 Comparative figures in this table may differ from those originally published in quarterly and annual reports due to adjustments fol-lowing organizational changes, restatements due to the retrospective adoption of new accounting standards or changes in accounting policies, and events after the reporting period. 3 Corporate Center – Services operating expenses presented in this table are after service allocations to business divisions and other Corporate Center units. 4 Related to the disposal or partial disposal of foreign subsidiaries and branches. 5 Refer to “Note 18 Changes in organization and disposals” in the “Consolidated financial statements” section of this report for more information. 6 Refer to the “Recent developments” section of this report for more infor-mation on own credit.

UBS
Gro
up
11
Net interest and trading income
For the quarter ended % change from
CHF million 31.3.16 31.12.15 31.3.15 4Q15 1Q15
Net interest and trading income
Net interest income 1,712 1,759 1,637 (3) 5
Net trading income 1,013 898 2,135 13 (53)
Total net interest and trading income 2,725 2,657 3,772 3 (28)
Wealth Management 750 774 806 (3) (7)
Wealth Management Americas 439 418 357 5 23
Personal & Corporate Banking 643 666 687 (3) (6)
Asset Management (8) (2) (6) 300 33
Investment Bank 1,021 802 1,717 27 (41)
of which: Corporate Client Solutions 120 154 274 (22) (56)
of which: Investor Client Services 901 648 1,444 39 (38)
Corporate Center (120) (1) 209
of which: Services (9) (24) 26 (63)
of which: Group ALM (68) 105 268
of which: own credit on financial liabilities designated at fair value1 35 226
of which: Non-core and Legacy Portfolio (43) (83) (84) (48) (49)
Total net interest and trading income 2,725 2,657 3,772 3 (28)
1 Refer to the “Recent developments” section of this report for more information on own credit.
Net interest and trading incomeTotal combined net interest and trading income increased by CHF 68 million to CHF 2,725 million.
Excluding the own credit gain of CHF 35 million in the prior quarter, net interest and trading income increased by CHF 103 million. In Wealth Management, net interest and trading income decreased by CHF 24 million to CHF 750 million, mainly due to lower allocations from Corporate Center – Group ALM and lower lending revenues, partly offset by higher deposit revenues.
In the Investment Bank, net interest and trading income increased by CHF 219 million to CHF 1,021 million. Net interest and trading income in Foreign Exchange, Rates and Credit increased by CHF 133 million, mainly reflecting higher client activ-ity levels in Foreign Exchange and stronger trading revenues within Credit. In addition, net interest and trading income in Equi-ties increased by CHF 120 million, primarily due to higher reve-nues in Derivatives due to increased client activity and improved trading revenues.
Corporate Center – Group ALM net interest and trading income, excluding the effect of own credit in the prior quarter, decreased by CHF 138 million, mainly due to accounting asym-metries related to economic hedges, partly offset by hedge accounting ineffectiveness gains and improved risk management net income.
In Corporate Center – Non-core and Legacy Portfolio, net interest and trading income improved by CHF 40 million, mainly due to lower losses from novation and unwind activities.
➔ Refer to the “Recent developments” section of this report for
more information on own credit
➔ Refer to “Note 3 Net interest and trading income” in the
“Consolidated financial statements” section of this report for
more information
Net fee and commission incomeNet fee and commission income was CHF 4,093 million compared with CHF 4,218 million.
Mergers and acquisitions and corporate finance fees decreased by CHF 94 million to CHF 139 million, primarily due to a decline in the fee pool.
Underwriting fees decreased by CHF 60 million to CHF 221 million due to lower equity underwriting revenues from public offerings as the fee pool decreased, partly offset by higher equity underwriting revenues from private transactions.
Investment fund fees decreased by CHF 36 million to CHF 814 million, mainly in Wealth Management and primarily due to a decrease in invested assets and the ongoing effects of cross-bor-der outflows.
Net brokerage fees increased by CHF 64 million to CHF 769 million, predominantly due to improved client activity.
➔ Refer to “Note 4 Net fee and commission income” in the
“Consolidated financial statements” section of this report for
more information

Group performance
12
Credit loss expense / recoveryThe net credit loss expense was CHF 3 million compared with CHF 59 million, mainly reflecting a specific loan loss recovery of CHF 22 million and lower net credit loss expenses related to the energy sector, both within the Investment Bank. Net credit loss expense in Personal & Corporate Banking was negligible compared with CHF 11 million in the prior quarter.
➔ Refer to the “Investment Bank”, “Personal & Corporate Banking”
and “Risk management and control” sections of this report for
more information
Other incomeOther income was positive CHF 17 million compared with nega-tive CHF 41 million. The first quarter included net foreign currency translation losses of CHF 123 million, mainly related to the closure of foreign UBS AG branches, compared with a gain of CHF 115 million in the prior quarter. The prior quarter also included net gains on sales of subsidiaries and businesses of CHF 28 million and net losses of CHF 257 million related to the buyback of debt in a tender offer.
Excluding these items, adjusted other income increased by CHF 67 million to CHF 140 million, mainly as the first quarter included net gains of CHF 76 million from the sale of financial assets avail-able for sale, primarily within Corporate Center – Group ALM, and due to the re-balancing of our high-quality liquid asset (HQLA) portfolios from financial assets available for sale to financial assets designated at fair value and financial assets held to maturity.
In the second quarter of 2016, UBS sold certain real estate in Switzerland for a total sales price of approximately CHF 180 million,
resulting in a pre-tax gain on sale of approximately CHF 120 mil-lion. This gain will be recognized in the income statement within Corporate Center – Services in the second quarter of 2016 and will be treated as an adjusting item for the purpose of calculating adjusted results.
➔ Refer to the “Recent developments” section of this report for
more information on the balance sheet classification of newly
purchased high-quality liquid debt securities
➔ Refer to “Note 5 Other income” in the “Consolidated financial
statements” section of this report for more information
Recurring net fee and transaction-based income in Wealth Management, Wealth Management Americas and Personal & Corporate Banking Recurring net fee income for Wealth Management, Wealth Man-agement Americas and Personal & Corporate Banking includes fees for services provided on an ongoing basis such as portfolio management fees, asset-based investment fund fees, custody fees and account keeping fees, which are generated on the respective business divisions’ client assets. This is part of total net fee and commission income in the consolidated income state-ment. Transaction-based income includes non-recurring net fee and commission income for these business divisions, mainly con-sisting of brokerage and transaction-based investment fund fees, as well as credit card fees and fees for payment transactions, together with the respective divisional net trading income.
➔ Refer to the “Wealth Management,” “Wealth Management
Americas” and “Personal & Corporate Banking” sections of this
report for more information
Credit loss (expense) / recovery
For the quarter ended % change from
CHF million 31.3.16 31.12.15 31.3.15 4Q15 1Q15
Wealth Management 0 0 1 (100)
Wealth Management Americas (1) 0 0
Personal & Corporate Banking 0 (11) (21) (100) (100)
Investment Bank 2 (50) 2 0
Corporate Center (3) 2 2
of which: Non-core and Legacy Portfolio (3) 2 2
Total (3) (59) (16) (95) (81)
Operating income Wealth Management, Wealth Management Americas and Personal & Corporate Banking
Wealth Management Wealth Management Americas Personal & Corporate Banking
For the quarter ended
CHF million 31.3.16 31.12.15 31.3.15 31.3.16 31.12.15 31.3.15 31.3.16 31.12.15 31.3.15
Net interest income 579 598 560 349 328 263 560 576 568
Recurring net fee income 901 935 949 1,176 1,167 1,124 139 139 134
Transaction-based income 402 364 589 360 379 410 244 196 284
Other income 3 (28) 149 6 12 5 20 15 13
Income 1,885 1,869 2,246 1,891 1,885 1,801 963 926 1,000
Credit loss (expense) / recovery 0 0 1 (1) 0 0 0 (11) (21)
Total operating income 1,885 1,869 2,247 1,889 1,885 1,801 963 915 979

UBS
Gro
up
13
Operating expenses
For the quarter ended % change from
CHF million 31.3.16 31.12.15 31.3.15 4Q15 1Q15
Personnel expenses (adjusted)1
Salaries and variable compensation 2,245 2,091 2,556 7 (12)Wealth Management Americas: Financial advisor compensation2 909 917 870 (1) 4Other personnel expenses3 642 670 677 (4) (5)Total personnel expenses (adjusted)1 3,796 3,679 4,104 3 (8)Non-personnel expenses (adjusted)1
General and administrative expenses 1,528 2,137 1,487 (28) 3of which: expenses for provisions for litigation, regulatory and similar matters 39 365 58 (89) (33)of which: other general and administrative expenses 1,488 1,772 1,429 (16) 4
Depreciation and impairment of property, equipment and software 242 260 210 (7) 15Amortization and impairment of intangible assets 23 24 28 (4) (18)Total non-personnel expenses (adjusted)1 1,793 2,422 1,725 (26) 4Total operating expenses (adjusted)1 5,590 6,100 5,829 (8) (4)Adjusting items 265 441 305 (40) (13)
of which: personnel-related restructuring expenses 128 164 68 (22) 88of which: non-personnel-related restructuring expenses 137 276 237 (50) (42)
Total operating expenses as reported 5,855 6,541 6,134 (10) (5)1 Excluding adjusting items. 2 Financial advisor compensation consists of grid-based compensation based directly on compensable revenues generated by financial advisors and supplemental compensation calculated on the basis of financial advisor productivity, firm tenure, assets and other variables. It also includes expenses related to compensation commitments with financial advisors entered into at the time of recruitment which are subject to vesting requirements. 3 Consists of expenses related to contractors, social security, pension and other post-employment benefit plans and other personnel expenses. Refer to “Note 6 Personnel expenses” in the “Consolidated financial statements” section of this report for more information.
Operating expenses: 1Q16 vs 4Q15
Total operating expenses decreased by CHF 686 million to CHF 5,855 million. Net restructuring expenses were CHF 265 million compared with CHF 441 million. Personnel-related restructuring expenses declined by CHF 36 million to CHF 128 million, and non-personnel-related restructuring expenses decreased by CHF 139 mil-lion to CHF 137 million, largely due to lower expenses for outsourc-ing of IT and other services, and a reduction in professional fees.
Excluding restructuring expenses in both quarters, adjusted total operating expenses decreased by CHF 510 million to CHF 5,590 million.
➔ Refer to “Note 18 Changes in organization and disposals” in the
“Consolidated financial statements” section of this report for
more information on restructuring expenses
Personnel expensesPersonnel expenses increased by CHF 81 million to CHF 3,924 mil-lion. On an adjusted basis, excluding restructuring expenses, per-sonnel expenses increased by CHF 117 million to CHF 3,796 million.
Expenses for salaries and variable compensation, excluding the effect of restructuring, increased by CHF 154 million to CHF 2,245 million, mainly reflecting higher expenses for variable compensation.
Other personnel expenses decreased by CHF 28 million to CHF 642 million on an adjusted basis, largely due to a decrease in expenses for pension and other post-employment benefit plans.
➔ Refer to “Note 6 Personnel expenses” in the “Consolidated finan-
cial statements” section of this report for more information
General and administrative expensesGeneral and administrative expenses decreased by CHF 749 mil-lion to CHF 1,664 million. On an adjusted basis, excluding restruc-turing expenses, general and administrative expenses decreased by CHF 609 million, largely reflecting CHF 326 million lower net expenses for provisions for litigation, regulatory and similar mat-ters and as the prior quarter included an expense of CHF 166 million for the annual UK bank levy. Professional fees were CHF 91 million lower and expenses for marketing and public relations decreased by CHF 40 million.
At this point in time, we believe that the industry continues to operate in an environment in which expenses associated with liti-gation, regulatory and similar matters will remain elevated for the foreseeable future and we continue to be exposed to a number of significant claims and regulatory matters.
➔ Refer to “Note 7 General and administrative expenses” in the
“Consolidated financial statements” section of this report for
more information
➔ Refer to “Note 16 Provisions and contingent liabilities” in the
“Consolidated financial statements” section of this report for
more information
Depreciation, impairment and amortizationDepreciation and impairment of property, equipment and soft-ware was CHF 243 million compared with CHF 260 million, mainly because the prior quarter included higher depreciation expenses related to internally generated capitalized software.
Amortization and impairment of intangible assets was CHF 23 million compared with CHF 24 million.
Group performance
14
Tax: 1Q16 vs 4Q15
We recognized a net income tax expense of CHF 270 million com-pared with a net tax benefit of CHF 715 million.
The first quarter of 2016 included net tax expenses of CHF 205 million, which related primarily to current taxes payable by UBS AG and its subsidiaries, including UBS Switzerland AG. In addi-tion, it included an expense of CHF 65 million with respect to the amortization of deferred tax assets previously recognized in rela-tion to Swiss tax losses carried forward and deductible temporary differences to reflect their offset against profits for the quarter.
The net tax benefit for the fourth quarter of 2015 was primarily related to a net increase in recognized deferred tax assets, mainly related to the US.
For 2016, we currently forecast a full-year tax rate of approxi-mately 25%, excluding the effects on the tax rate from the reas-sessment of deferred tax assets.
In March 2016, the UK government announced a proposed change in law which would reduce the proportion of banks’ annual taxable profits that can be offset by UK tax losses carried forward from 50% to 25% with effect from 1 April 2016. The UK government also proposed to reduce the UK corporate income tax rate from 18% to 17% with effect from 1 April 2020. To the extent that these changes are enacted in 2016, we would expect to incur a reduction in recognized UK deferred tax assets of approximately CHF 115 million.
Total comprehensive income attributable to UBS Group AG shareholders: 1Q16 vs 4Q15
Total comprehensive income attributable to UBS Group AG share-holders was CHF 399 million compared with CHF 1,126 million. Net profit attributable to UBS Group AG shareholders was CHF 707 million compared with CHF 949 million. Other comprehensive income (OCI) attributable to UBS Group AG shareholders was neg-ative CHF 308 million compared with positive CHF 177 million.
In the first quarter of 2016, foreign currency translation OCI was negative CHF 825 million, primarily resulting from the weak-ening of the US dollar against the Swiss franc, partly offset by the reclassification of net losses totaling CHF 123 million to the income statement. OCI related to foreign currency translation in the prior quarter was CHF 452 million.
Defined benefit plan OCI was negative CHF 179 million com-pared with positive CHF 202 million. We recorded net pre-tax OCI losses of CHF 183 million related to our non-Swiss pension plans, mainly due to net increases in defined benefit obligations resulting from declines in applicable discount rates, partly offset by gains fol-lowing increases in the fair value of underlying plan assets. Net pre-tax OCI related to the Swiss pension plan was negligible, as an OCI loss of CHF 803 million related to an increase in the defined benefit obligation, primarily reflecting a decline in the applicable discount rate, and an OCI loss of CHF 105 million due to a decrease in the fair value of the underlying plan assets, were entirely offset by a gain of CHF 901 million from the partial reversal of the excess of the pension
surplus over the estimated future economic benefit. In the first quar-ter of 2016, we updated the life expectancy assumptions for our Swiss pension plan by adopting the Swiss occupational pension plan (BVG) 2015 generational mortality tables, replacing the BVG 2010 generational mortality tables. At the same time, we refined the dis-ability assumption and updated the rate of salary increase assump-tion. These changes did not have a material net effect on the DBO.
OCI related to cash flow hedges was CHF 513 million, mainly reflecting unrealized gains on hedging derivatives from decreases in long-term interest rates across all major currencies. OCI related to cash flow hedges was negative CHF 419 million in the prior quarter,
OCI associated with financial assets available for sale was CHF 131 million compared with negative CHF 59 million, and mainly related to net unrealized gains following declines in long-term interest rates, partly offset by net gains that were reclassified from OCI to the income statement upon sale of investments. At this point in time, we expect to recognize in the income statement gains of approximately CHF 110 million during the second or third quarter of 2016, cur-rently deferred in OCI, as transactions involving certain equity invest-ments classified as available for sale are closed. Approximately CHF 90 million of these expected gains will be recorded in Personal & Corporate Banking and the remainder in Wealth Management and, consistent with past practice, treated as adjusting items. The reclas-sification of gains from OCI to the income statement will not affect shareholders’ equity, but will increase CET1 capital.
➔ Refer to the “Statement of comprehensive income” in the
“Consolidated financial statements” section of this report for
more information
➔ Refer to “Note 28 Pension and other post-employment benefit
plans” in the “Consolidated financial statements” section of our
Annual Report 2015 for more information on other comprehen-
sive income related to defined benefit plans
Sensitivity to interest rate movements
As of 31 March 2016, we estimate that a parallel shift in yield curves by +100 basis points could lead to a combined increase in annual net interest income of approximately CHF 0.6 billion in Wealth Man-agement, Wealth Management Americas and Personal & Corporate Banking. Of this increase, approximately CHF 0.4 billion would result from changes in US dollar interest rates. Including the esti-mated impact related to pension fund assets and liabilities, the immediate effect of such a shift on shareholders’ equity would be an estimated decrease of at least approximately CHF 1.9 billion rec-ognized in OCI, of which approximately CHF 1.5 billion would result from changes in US dollar interest rates. Since the majority of this negative OCI impact on shareholders’ equity is related to cash flow hedges, and these are not recognized for the purposes of calculat-ing regulatory capital, the immediate impact on regulatory capital would not be significant. The above estimates are based on an immediate increase in interest rates, equal across all currencies and relative to implied forward rates applied to our banking book and available-for-sale portfolios. The estimates further assume a static balance sheet and constant foreign exchange rates.

UBS
Gro
up
15
Net profit attributable to non-controlling interests: 1Q16 vs 4Q15
Net profit attributable to non-controlling interests was zero com-pared with CHF 1 million.
We currently expect to attribute net profit to non-controlling interests related to preferred notes issued by UBS AG of approxi-mately CHF 80 million in 2016, all in the second quarter of 2016, approximately CHF 70 million in 2017 and less than CHF 10 million per year from 2018.
Key figures and personnel: 1Q16 vs 4Q15
Cost / income ratioThe cost / income ratio was 85.7% compared with 95.7%. On an adjusted basis, the cost / income ratio was 80.3% compared with 88.2%.
Return on tangible equityThe annualized return on tangible equity (RoTE) was 6.0% com-pared with 8.1%. On an adjusted basis, the annualized RoTE was 8.5% compared with 11.4%.
Common equity tier 1 capital ratioIn the first quarter of 2016, our fully applied CET1 capital ratio decreased 0.5 percentage points to 14.0%, primarily due to a CHF 6 billion increase in risk-weighted assets (RWA).
➔ Refer to the “Capital management” section of this report for
more information
Risk-weighted assets RWA increased by CHF 6 billion to CHF 214 billion on a fully applied basis, below our short- to medium-term expectation of around CHF 250 billion. Credit risk RWA increased by CHF 5 billion, mainly due to book size and other increases of CHF 4 billion and regulatory add-ons of CHF 3 billion, partly offset by foreign currency transla-tion effects of CHF 2 billion. Operational risk RWA increased by CHF 1 billion, driven by changes to the advanced measurement approach model used for the calculation of operational risk capital requirements that were approved by FINMA in the first quarter of 2016. Market risk RWA decreased by CHF 1 billion.
➔ Refer to the “Capital management” section of this report for
more information
Leverage ratio denominator The Swiss SRB leverage ratio denominator (LRD) increased by CHF 8 billion to CHF 906 billion on a fully applied basis, and was below our short- to medium-term expectation of around CHF 950 billion. The increase in the LRD was driven by an increase in book size of CHF 32 billion, partly offset by foreign currency translation effects of CHF 19 billion and incremental netting and collateral mitigation benefits of CHF 5 billion.
➔ Refer to the “Capital management” section of this report for
more information
Net new money and invested assetsManagement’s discussion and analysis on net new money and invested assets is provided in the “UBS business divisions and Cor-porate Center” section of this report.
Return on equity
As of or for the quarter ended % change from
CHF million, except where indicated 31.3.16 31.12.15 31.3.15 4Q15 1Q15
Net profit
Net profit attributable to UBS Group AG shareholders 707 949 1,977 (26) (64)
Amortization and impairment of intangible assets 23 24 28 (4) (18)
Pre-tax adjusting items1 388 520 (440) (25)
Tax effect on adjusting items2 (85) (121) 52 (30)
Adjusted net profit attributable to UBS Group AG shareholders 1,033 1,372 1,617 (25) (36)
Equity
Equity attributable to UBS Group AG shareholders 54,845 55,313 52,359 (1) 5
Less: goodwill and intangible assets3 6,326 6,568 6,342 (4) 0
Tangible equity attributable to UBS Group AG shareholders 48,519 48,745 46,017 0 5
Return on equity
Return on equity (%) 5.1 6.9 15.4
Return on tangible equity (%) 6.0 8.1 17.8
Adjusted return on tangible equity (%) 8.5 11.4 14.4
1 Refer to the “Performance by business division and Corporate Center unit – reported and adjusted” table in this section for more information. 2 Generally reflects an indicative tax rate of 22% on pre-tax adjusting items. 3 Goodwill and intangible assets used in the calculation of tangible equity attributable to UBS Group AG shareholders as of 31 March 2015 have been adjusted to reflect the non-controlling interests in UBS AG.

Group performance
16
Net new money1
For the quarter ended
CHF billion 31.3.16 31.12.15 31.3.15
Wealth Management 15.5 (3.4) 14.4
Wealth Management Americas 13.6 16.9 4.6
Asset Management (2.9) (11.0) 5.1
of which: excluding money market flows (5.9) (8.9) 7.5
of which: money market flows 3.0 (2.1) (2.4)
1 Net new money excludes interest and dividend income.
Invested assets
As of % change from
CHF billion 31.3.16 31.12.15 31.3.15 31.12.15 31.3.15
Wealth Management 925 947 970 (2) (5)
Wealth Management Americas 1,009 1,035 1,021 (3) (1)
Asset Management 628 650 661 (3) (5)
of which: excluding money market funds 568 592 601 (4) (5)
of which: money market funds 60 58 60 3 0
Personnel We employed 60,547 personnel as of 31 March 2016, an increase of 448 compared with 60,099 personnel as of 31 December 2015. Corporate Center – Services personnel increased by 225, mainly reflecting increases in Group Technol-ogy, Risk Control and in our nearshoring and offshoring loca-
tions, partly offset by decreases in Group Operations. Wealth Management personnel increased by 93, driven by an increase in non-client-facing staff.
➔ Refer to the discussions of personnel in the “UBS business
divisions and Corporate Center” section of this report for more
information
Personnel by business division and Corporate Center1
As of % change from
Full-time equivalents 31.3.16 31.12.15 31.3.15 31.12.15 31.3.15
Wealth Management 10,332 10,239 10,366 1 0
Wealth Management Americas 13,682 13,611 13,275 1 3
Personal & Corporate Banking 5,092 5,058 5,157 1 (1)
Asset Management 2,329 2,277 2,369 2 (2)
Investment Bank 5,218 5,243 5,276 0 (1)
Corporate Center 23,894 23,671 23,670 1 1
of which: Services 23,695 23,470 23,424 1 1
of which: Group ALM 127 125 122 2 4
of which: Non-core and Legacy Portfolio 73 77 125 (5) (42)
Total 60,547 60,099 60,113 1 1
1 Comparative figures in this table may differ from those originally published in quarterly and annual reports due to adjustments following organizational changes.

UBS
Gro
up
17
Personnel by region
As of % change from
Full-time equivalents 31.3.16 31.12.15 31.3.15 31.12.15 31.3.15
Americas 20,912 20,816 20,893 0 0
of which: USA 20,013 19,897 19,713 1 2
Asia Pacific 7,737 7,539 7,483 3 3
Europe, Middle East and Africa 10,703 10,505 10,247 2 4
of which: UK 5,435 5,373 5,411 1 0
of which: Rest of Europe 5,089 4,957 4,668 3 9
of which: Middle East and Africa 179 176 169 2 6
Switzerland 21,195 21,238 21,489 0 (1)
Total 60,547 60,099 60,113 1 1
Results: 1Q16 vs 1Q15
Net profit attributable to UBS Group AG shareholders was CHF 707 million in the first quarter of 2016 compared with CHF 1,977 million in the same quarter a year earlier. Operating profit before tax was CHF 978 million compared with CHF 2,708 million, largely reflecting a decrease of CHF 2,008 million in oper-ating income, driven by CHF 1,047 million lower combined net interest and trading income, a decline of CHF 668 million in other income as well as CHF 308 million lower net fee and commission income. Operating expenses decreased by CHF 279 million, largely driven by CHF 248 million lower personnel expenses.
For the first quarter of 2016, the items we excluded for the purpose of determining adjusted results were net foreign currency translation losses of CHF 123 million and net restructuring expenses of CHF 265 million. For the first quarter of 2015, the items we excluded were an own credit gain of CHF 226 million, gains on sale of real estate of CHF 378 million, gains on sales of subsidiaries and businesses of CHF 141 million and net restructur-ing expenses of CHF 305 million.
On an adjusted basis, operating profit before tax declined to CHF 1,366 million from CHF 2,268 million, primarily reflecting a decrease in operating income.
Adjusted operating income decreased by CHF 1,140 million to CHF 6,956 million, mainly reflecting CHF 821 million lower com-
bined net interest and trading income, partly as the first quarter of 2015 benefited from higher volatility and client activity levels following the Swiss National Bank’s actions in January 2015, a decrease of CHF 308 million in net fee and commission income and CHF 26 million lower adjusted other income.
Adjusted operating expenses decreased by CHF 239 million to CHF 5,590 million, mainly due to reduced expenses for salaries and variable compensation.
Outlook
Negative market performance, substantial market volatility, as well as underlying macroeconomic and geopolitical uncertainty led to more pronounced client risk aversion and abnormally low transac-tion volumes in the first quarter. Some of these factors have stabi-lized recently, but the underlying macroeconomic challenges and geopolitical risks that we have highlighted previously continue to contribute to client risk aversion and are unlikely to be resolved in the foreseeable future. Low interest rates, and the relative strength of the Swiss franc, particularly against the euro, continue to pres-ent headwinds. In addition, the proposed changes to the Swiss and international regulatory framework for banks will result in increased capital requirements and costs. UBS continues to execute its strat-egy with discipline to mitigate these effects, and is well positioned to benefit from even a moderate improvement in conditions.

Group performance
18
Regional performance
The operating regions shown in the “Regional performance” table below correspond to the regional management structure of the Group. The allocation of income and expenses to these regions reflects, and is consistent with, the basis on which the business is managed and its performance evaluated. These alloca-tions involve assumptions and judgments that management con-siders reasonable, and may be refined to reflect changes in esti-mates or management structure. The main principles of the
allocation methodology are that client revenues are attributed to the domicile of the client, and trading and portfolio management revenues are attributed to the country where the risk is managed. This revenue attribution is consistent with the mandate of our country and regional Presidents. Expenses are allocated in line with revenues. Certain revenues and expenses, such as those related to Corporate Center – Non-core and Legacy Portfolio, cer-tain litigation expenses and restructuring expenses and other items, are managed at the Group level. These revenues and expenses are included in the Global column.
Regional performance
Americas Asia Pacific Europe, Middle East and Africa Switzerland Global Total
For the quarter ended For the quarter ended
CHF billion 31.3.16 31.12.15 31.3.15 31.3.16 31.12.15 31.3.15 31.3.16 31.12.15 31.3.15 31.3.16 31.12.15 31.3.15 31.3.16 31.12.15 31.3.15 31.3.16 31.12.15 31.3.15
Operating income
Wealth Management 0.1 0.1 0.1 0.5 0.5 0.6 0.9 0.9 1.0 0.4 0.4 0.4 0.0 0.0 0.1 1.9 1.9 2.2
Wealth Management Americas 1.9 1.9 1.8 0.0 0.0 0.0 0.0 0.0 0.0 0.0 0.0 0.0 0.0 0.0 0.0 1.9 1.9 1.8
Personal & Corporate Banking 0.0 0.0 0.0 0.0 0.0 0.0 0.0 0.0 0.0 1.0 0.9 1.0 0.0 0.0 0.0 1.0 0.9 1.0
Asset Management 0.1 0.2 0.2 0.1 0.1 0.1 0.1 0.1 0.1 0.1 0.2 0.1 0.0 0.1 0.0 0.5 0.6 0.5
Investment Bank 0.7 0.6 0.8 0.5 0.4 0.7 0.5 0.5 0.8 0.2 0.2 0.4 0.0 0.0 0.0 1.9 1.7 2.7
Corporate Center 0.0 0.0 0.0 0.0 0.0 0.0 0.0 0.0 0.0 0.0 0.0 0.0 (0.3) (0.2) 0.6 (0.3) (0.2) 0.6
Total operating income 2.8 2.8 2.9 1.1 1.0 1.4 1.5 1.5 1.9 1.7 1.6 1.9 (0.3) (0.1) 0.8 6.8 6.8 8.8
Operating expenses
Wealth Management 0.1 0.1 0.1 0.4 0.4 0.4 0.7 0.8 0.6 0.2 0.2 0.2 0.0 0.0 0.0 1.3 1.5 1.3
Wealth Management Americas 1.7 1.9 1.5 0.0 0.0 0.0 0.0 0.0 0.0 0.0 0.0 0.0 0.0 0.0 0.0 1.7 1.9 1.5
Personal & Corporate Banking 0.0 0.0 0.0 0.0 0.0 0.0 0.0 0.0 0.0 0.6 0.6 0.6 0.0 0.0 0.0 0.6 0.6 0.6
Asset Management 0.1 0.1 0.1 0.1 0.1 0.0 0.1 0.1 0.1 0.1 0.1 0.1 0.0 0.0 0.0 0.4 0.4 0.3
Investment Bank 0.5 0.4 0.6 0.4 0.4 0.5 0.5 0.6 0.6 0.1 0.1 0.2 0.1 0.1 0.1 1.6 1.6 1.9
Corporate Center 0.0 0.0 0.0 0.0 0.0 0.0 0.0 0.0 0.0 0.0 0.0 0.0 0.3 0.5 0.5 0.3 0.5 0.5
Total operating expenses 2.4 2.6 2.4 0.8 0.9 0.9 1.2 1.5 1.3 1.0 1.0 1.0 0.4 0.7 0.6 5.9 6.5 6.1
Operating profit / (loss) before tax
Wealth Management 0.0 0.0 0.0 0.2 0.1 0.2 0.2 0.1 0.4 0.2 0.2 0.2 0.0 0.0 0.1 0.6 0.3 1.0
Wealth Management Americas 0.2 0.0 0.3 0.0 0.0 0.0 0.0 0.0 0.0 0.0 0.0 0.0 0.0 0.0 0.0 0.2 0.0 0.3
Personal & Corporate Banking 0.0 0.0 0.0 0.0 0.0 0.0 0.0 0.0 0.0 0.4 0.4 0.4 0.0 0.0 0.0 0.4 0.4 0.4
Asset Management 0.0 0.0 0.1 0.0 0.0 0.0 0.0 0.0 0.0 0.1 0.1 0.1 0.0 0.0 0.0 0.1 0.2 0.2
Investment Bank 0.2 0.1 0.2 0.1 0.0 0.3 0.1 0.0 0.2 0.1 0.1 0.2 (0.1) (0.1) (0.1) 0.3 0.1 0.8
Corporate Center 0.0 0.0 0.0 0.0 0.0 0.0 0.0 0.0 0.0 0.0 0.0 0.0 (0.5) (0.7) 0.1 (0.5) (0.7) 0.1
Operating profit / (loss) before tax 0.4 0.2 0.5 0.2 0.1 0.5 0.3 0.1 0.6 0.7 0.7 0.9 (0.7) (0.8) 0.2 1.0 0.2 2.7

UBS
Gro
up
19
Regional performance
Americas Asia Pacific Europe, Middle East and Africa Switzerland Global Total
For the quarter ended For the quarter ended
CHF billion 31.3.16 31.12.15 31.3.15 31.3.16 31.12.15 31.3.15 31.3.16 31.12.15 31.3.15 31.3.16 31.12.15 31.3.15 31.3.16 31.12.15 31.3.15 31.3.16 31.12.15 31.3.15
Operating income
Wealth Management 0.1 0.1 0.1 0.5 0.5 0.6 0.9 0.9 1.0 0.4 0.4 0.4 0.0 0.0 0.1 1.9 1.9 2.2
Wealth Management Americas 1.9 1.9 1.8 0.0 0.0 0.0 0.0 0.0 0.0 0.0 0.0 0.0 0.0 0.0 0.0 1.9 1.9 1.8
Personal & Corporate Banking 0.0 0.0 0.0 0.0 0.0 0.0 0.0 0.0 0.0 1.0 0.9 1.0 0.0 0.0 0.0 1.0 0.9 1.0
Asset Management 0.1 0.2 0.2 0.1 0.1 0.1 0.1 0.1 0.1 0.1 0.2 0.1 0.0 0.1 0.0 0.5 0.6 0.5
Investment Bank 0.7 0.6 0.8 0.5 0.4 0.7 0.5 0.5 0.8 0.2 0.2 0.4 0.0 0.0 0.0 1.9 1.7 2.7
Corporate Center 0.0 0.0 0.0 0.0 0.0 0.0 0.0 0.0 0.0 0.0 0.0 0.0 (0.3) (0.2) 0.6 (0.3) (0.2) 0.6
Total operating income 2.8 2.8 2.9 1.1 1.0 1.4 1.5 1.5 1.9 1.7 1.6 1.9 (0.3) (0.1) 0.8 6.8 6.8 8.8
Operating expenses
Wealth Management 0.1 0.1 0.1 0.4 0.4 0.4 0.7 0.8 0.6 0.2 0.2 0.2 0.0 0.0 0.0 1.3 1.5 1.3
Wealth Management Americas 1.7 1.9 1.5 0.0 0.0 0.0 0.0 0.0 0.0 0.0 0.0 0.0 0.0 0.0 0.0 1.7 1.9 1.5
Personal & Corporate Banking 0.0 0.0 0.0 0.0 0.0 0.0 0.0 0.0 0.0 0.6 0.6 0.6 0.0 0.0 0.0 0.6 0.6 0.6
Asset Management 0.1 0.1 0.1 0.1 0.1 0.0 0.1 0.1 0.1 0.1 0.1 0.1 0.0 0.0 0.0 0.4 0.4 0.3
Investment Bank 0.5 0.4 0.6 0.4 0.4 0.5 0.5 0.6 0.6 0.1 0.1 0.2 0.1 0.1 0.1 1.6 1.6 1.9
Corporate Center 0.0 0.0 0.0 0.0 0.0 0.0 0.0 0.0 0.0 0.0 0.0 0.0 0.3 0.5 0.5 0.3 0.5 0.5
Total operating expenses 2.4 2.6 2.4 0.8 0.9 0.9 1.2 1.5 1.3 1.0 1.0 1.0 0.4 0.7 0.6 5.9 6.5 6.1
Operating profit / (loss) before tax
Wealth Management 0.0 0.0 0.0 0.2 0.1 0.2 0.2 0.1 0.4 0.2 0.2 0.2 0.0 0.0 0.1 0.6 0.3 1.0
Wealth Management Americas 0.2 0.0 0.3 0.0 0.0 0.0 0.0 0.0 0.0 0.0 0.0 0.0 0.0 0.0 0.0 0.2 0.0 0.3
Personal & Corporate Banking 0.0 0.0 0.0 0.0 0.0 0.0 0.0 0.0 0.0 0.4 0.4 0.4 0.0 0.0 0.0 0.4 0.4 0.4
Asset Management 0.0 0.0 0.1 0.0 0.0 0.0 0.0 0.0 0.0 0.1 0.1 0.1 0.0 0.0 0.0 0.1 0.2 0.2
Investment Bank 0.2 0.1 0.2 0.1 0.0 0.3 0.1 0.0 0.2 0.1 0.1 0.2 (0.1) (0.1) (0.1) 0.3 0.1 0.8
Corporate Center 0.0 0.0 0.0 0.0 0.0 0.0 0.0 0.0 0.0 0.0 0.0 0.0 (0.5) (0.7) 0.1 (0.5) (0.7) 0.1
Operating profit / (loss) before tax 0.4 0.2 0.5 0.2 0.1 0.5 0.3 0.1 0.6 0.7 0.7 0.9 (0.7) (0.8) 0.2 1.0 0.2 2.7


UBS business divisions and Corporate Center Management report

Wealth Management
22
Wealth Management
Profit before tax was CHF 557 million in the first quarter of 2016, an increase of CHF 213 million compared with the fourth quarter of 2015. Adjusted profit before tax increased by CHF 131 million to CHF 636 million, mainly reflecting lower net expenses for provisions for litigation, regulatory and similar matters. The adjusted net margin on invested assets increased 5 basis points to 27 basis points. Net new money was CHF 15.5 billion compared with net outflows of CHF 3.4 billion.
Wealth Management1
As of or for the quarter ended % change from
CHF million, except where indicated 31.3.16 31.12.15 31.3.15 4Q15 1Q15
Net interest income 579 598 560 (3) 3
Recurring net fee income 901 935 949 (4) (5)
Transaction-based income 402 364 589 10 (32)
Other income 3 (28) 149 (98)
Income 1,885 1,869 2,246 1 (16)
Credit loss (expense) / recovery 0 0 1 (100)
Total operating income 1,885 1,869 2,247 1 (16)
Personnel expenses 615 609 661 1 (7)
General and administrative expenses 128 263 111 (51) 15
Services (to) / from other business divisions and Corporate Center 583 652 521 (11) 12
of which: services from CC – Services 562 627 508 (10) 11
Depreciation and impairment of property, equipment and software 1 1 2 0 (50)
Amortization and impairment of intangible assets 1 1 1 0 0
Total operating expenses2 1,327 1,526 1,296 (13) 2
Business division operating profit / (loss) before tax 557 344 951 62 (41)
Adjusted results3
Total operating income as reported 1,885 1,869 2,247 1 (16)
of which: gains / (losses) on sales of subsidiaries and businesses (28) 141
Total operating income (adjusted) 1,885 1,897 2,106 (1) (10)
Total operating expenses as reported 1,327 1,526 1,296 (13) 2
of which: personnel-related restructuring expenses 2 3 3
of which: non-personnel-related restructuring expenses 14 14 5
of which: restructuring expenses allocated from CC – Services 62 116 39
Total operating expenses (adjusted) 1,248 1,393 1,250 (10) 0
Business division operating profit / (loss) before tax as reported 557 344 951 62 (41)
Business division operating profit / (loss) before tax (adjusted) 636 505 856 26 (26)
Key performance indicators4
Pre-tax profit growth (%) 61.9 (46.2) 47.2
Cost / income ratio (%) 70.4 81.6 57.7
Net new money growth (%) 6.5 (1.5) 5.8
Gross margin on invested assets (bps) 81 80 92 1 (12)
Net margin on invested assets (bps) 24 15 39 60 (38)

UBS
bus
ines
s di
visi
ons
and
Cor
pora
te C
ente
r
23
Regional breakdown of key figures1, 2
As of or for the quarter ended 31.3.16 Europe Asia Pacific Switzerland Emerging marketsof which: ultrahigh net worth
of which: Global Family Office3
Net new money (CHF billion) 5.4 8.8 0.9 0.7 13.3 4.3
Net new money growth (%) 6.3 12.9 2.1 1.8 10.5 22.6
Invested assets (CHF billion) 337 266 171 150 499 87
Gross margin on invested assets (bps) 72 78 88 97 56 534
Client advisors (full-time equivalents) 1,348 1,125 773 696 7415
1 Refer to the "Measurement of performance” section of our Annual Report 2015 for the definitions of our key performance indicators. 2 Based on the Wealth Management business area structure, and excluding minor functions with 84 client advisors, CHF 1 billion of invested assets, and CHF 0.3 billion of net new money outflows in the first quarter of 2016. 3 Joint venture between Wealth Management and the Investment Bank. Global Family Office is reported as a sub-segment of ultra high net worth and is included in the ultra high net worth figures. 4 Gross margin includes income booked in the Investment Bank. Gross margin based on income booked in Wealth Management only is 30 basis points. 5 Represents client advisors who exclusively serve ultra high net worth clients. In addition to these, other client advisors may also serve certain ultra high net worth clients, but not exclusively.
Wealth Management1 (continued)
As of or for the quarter ended % change from
CHF million, except where indicated 31.3.16 31.12.15 31.3.15 4Q15 1Q15
Additional information
Recurring income5 1,480 1,533 1,509 (3) (2)
Recurring income as a percentage of income (%) 78.5 82.0 67.2
Average attributed equity (CHF billion)6 3.5 3.4 3.6 3 (3)
Return on attributed equity (%) 63.7 40.5 105.7
Risk-weighted assets (fully applied, CHF billion)7 26.1 25.3 25.7 3 2
Return on risk-weighted assets, gross (%)8 29.3 29.1 35.2
Leverage ratio denominator (fully applied, CHF billion)9 117.4 119.0 134.2 (1) (13)
Goodwill and intangible assets (CHF billion) 1.3 1.3 1.3 0 0
Net new money (CHF billion) 15.5 (3.4) 14.4
Invested assets (CHF billion) 925 947 970 (2) (5)
Client assets (CHF billion) 1,092 1,122 1,142 (3) (4)
Loans, gross (CHF billion) 102.4 105.2 110.8 (3) (8)
Due to customers (CHF billion) 181.5 172.3 188.4 5 (4)
Personnel (full-time equivalents) 10,332 10,239 10,366 1 0
Client advisors (full-time equivalents) 4,026 4,019 4,326 0 (7)
1 Comparative figures in this table may differ from those originally published in quarterly and annual reports due to adjustments following organizational changes, restatements due to the retrospective adoption of new accounting standards or changes in accounting policies, and events after the reporting period. 2 Refer to “Note 18 Changes in organization and disposals” in the “Consolidated financial statements” section of this report for information on restructuring expenses. 3 Adjusted results are non-GAAP financial measures as defined by SEC regulations. 4 Refer to the “Measurement of performance” section of our Annual Report 2015 for the definitions of our key performance indicators. 5 Recurring income consists of net interest income and recurring net fee income. 6 Refer to the “Capital management” section of this report for more information on the equity attribution framework. 7 Based on the Basel III framework as applicable for Swiss systemically relevant banks (SRBs). Refer to the “Capital management” section of this report for more informa-tion. 8 Based on fully applied risk-weighted assets. 9 Calculated in accordance with Swiss SRB rules. Refer to the “Capital management” section of this report for more information. From 31 December 2015 onward, the leverage ratio denominator calculation is fully aligned with the Basel III rules. Figures for periods prior to 31 December 2015 are calculated in accordance with former Swiss SRB rules and are therefore not fully com-parable.

Wealth Management
24
Results: 1Q16 vs 4Q15
Operating incomeTotal operating income increased by CHF 16 million to CHF 1,885 million. Excluding losses on the sale of subsidiaries and businesses of CHF 28 million in the fourth quarter of 2015, adjusted operat-ing income decreased by CHF 12 million.
Net interest income decreased by CHF 19 million to CHF 579 million, mainly due to lower allocations from Corporate Center – Group Asset and Liability Management (Group ALM) and lower lending revenues, partly offset by higher deposit revenues.
Recurring net fee income decreased by CHF 34 million to CHF 901 million, reflecting decreases in invested assets and the ongo-ing effects of cross-border outflows, partly offset by pricing mea-sures and an increase in discretionary and advisory mandate pen-etration.
Transaction-based income increased by CHF 38 million to CHF 402 million, primarily in Asia Pacific. The prior quarter included a fee of CHF 45 million received from Personal & Corporate Banking for the shift of certain clients from Wealth Management to Per-sonal & Corporate Banking as a result of a detailed client segmen-tation review.
Operating expensesTotal operating expenses decreased by CHF 199 million to CHF 1,327 million. Excluding restructuring expenses of CHF 79 million compared with CHF 133 million, adjusted operating expenses decreased by CHF 145 million to CHF 1,248 million.
Personnel expenses increased by CHF 6 million to CHF 615 mil-lion. Excluding restructuring expenses of CHF 2 million compared with CHF 3 million, adjusted personnel expenses increased by CHF 7 million.
General and administrative expenses decreased by CHF 135 million to CHF 128 million. Excluding restructuring expenses of CHF 14 million in both quarters, adjusted general and adminis-trative expenses decreased by CHF 135 million, mainly as net expenses for provisions for litigation, regulatory and similar mat-ters decreased by CHF 79 million to zero. In addition, marketing expenses, professional fees and expenses related to the Euro-pean Union’s Single Resolution Fund decreased. The prior quar-ter included an expense of CHF 13 million for the annual UK bank levy.
Net expenses for services from other business divisions and Corporate Center decreased by CHF 69 million to CHF 583 mil-lion. Excluding restructuring expenses of CHF 62 million com-pared with CHF 116 million, adjusted net expenses for services decreased by CHF 15 million to CHF 521 million.
Cost / income ratioThe cost / income ratio was 70.4% compared with 81.6%. On an adjusted basis, the cost / income ratio was 66.2% compared with 73.4%.
Net new money Net new money was CHF 15.5 billion compared with net outflows of CHF 3.4 billion. This resulted in an annualized net new money growth rate of 6.5% compared with a negative growth rate of 1.5%. Net new money was driven by net inflows from all regions, with particularly strong flows from Asia Pacific. Net new money in Europe included one large inflow which was partly offset by one large outflow. On a global basis, net new money from ultra high net worth clients was CHF 13.3 billion compared with CHF 2.2 billion in the prior quarter.
Invested assetsInvested assets decreased by CHF 22 billion to CHF 925 billion due to negative foreign currency translation effects of CHF 18 billion, negative market performance of CHF 17 billion and a further reduction of CHF 2 billion related to the sale of subsidiaries and businesses that did not affect net new money. This was partly offset by net new money of CHF 16 billion. Discretionary and advisory mandate penetration increased to 27.0% of invested assets compared with 26.4%.
Margins on invested assetsThe net margin on invested assets increased 9 basis points to 24 basis points. On an adjusted basis, the net margin increased 5 basis points to 27 basis points. The gross margin increased 1 basis point to 81 basis points and was unchanged at 81 basis points on an adjusted basis.
Personnel: 1Q16 vs 4Q15
Wealth Management employed 10,332 personnel compared with 10,239, driven by an increase of 86 in non-client-facing staff.

UBS
bus
ines
s di
visi
ons
and
Cor
pora
te C
ente
r
25
Results: 1Q16 vs 1Q15
Profit before tax decreased by CHF 394 million to CHF 557 mil-lion. Adjusted profit before tax decreased by CHF 220 million to CHF 636 million, mainly reflecting lower operating income.
Total operating income decreased by CHF 362 million to CHF 1,885 million. Excluding a gain of CHF 141 million on the sale of a subsidiary in the first quarter of 2015, adjusted operating income decreased by CHF 221 million, mainly due to lower trans-action-based income.
Net interest income increased by CHF 19 million to CHF 579 million, mainly as both deposit and lending revenues were higher, partly offset by lower allocations from Group ALM.
Recurring net fee income decreased by CHF 48 million to CHF 901 million, reflecting lower invested assets and the ongoing effects of cross-border outflows. This was partly offset by the
positive effects of the continued increase in discretionary and advisory mandate penetration and pricing measures.
Transaction-based income decreased by CHF 187 million to CHF 402 million, with declines across all regions, but most notably in Europe and Asia Pacific. The overall decrease was mainly related to investment funds, structured products and equity and fixed income cash products, driven by reduced client activity due to persistent market uncertainty.
Total operating expenses increased by CHF 31 million to CHF 1,327 million. Excluding restructuring expenses of CHF 79 million compared with CHF 46 million, adjusted operating expenses decreased by CHF 2 million to CHF 1,248 million, reflecting CHF 45 million lower personnel expenses, largely offset by CHF 39 million higher net expenses for services from other business divisions and Corporate Center, mainly due to higher expenses from Group Tech-nology and increased costs for communications and branding.

Wealth Management Americas
26
Wealth Management Americas
Profit before tax was USD 212 million in the first quarter of 2016 compared with USD 13 million in the fourth quarter of 2015. Adjusted profit before tax increased to USD 245 million from USD 63 million, mainly due to USD 215 million lower net expenses for provisions for litigation, regulatory and similar matters. Net new money was USD 13.6 billion compared with USD 16.8 billion in the prior quarter.
Wealth Management Americas – in US dollars1
As of or for the quarter ended % change from
USD million, except where indicated 31.3.16 31.12.15 31.3.15 4Q15 1Q15
Net interest income 351 326 277 8 27
Recurring net fee income 1,182 1,160 1,186 2 0
Transaction-based income 361 376 432 (4) (16)
Other income 6 12 5 (50) 20
Income 1,900 1,874 1,901 1 0
Credit loss (expense) / recovery (1) 0 0
Total operating income 1,899 1,874 1,901 1 0
Personnel expenses 1,209 1,185 1,185 2 2
Financial advisor compensation2 714 713 731 0 (2)
Compensation commitments with recruited financial advisors3 199 198 186 1 7
Salaries and other personnel costs 295 274 267 8 10
General and administrative expenses 145 348 126 (58) 15
Services (to) / from other business divisions and Corporate Center 320 313 309 2 4
of which: services from CC – Services 317 309 305 3 4
Depreciation and impairment of property, equipment and software 0 0 1 (100)
Amortization and impairment of intangible assets 13 13 13 0 0
Total operating expenses4 1,688 1,860 1,633 (9) 3
Business division operating profit / (loss) before tax 212 13 268 (21)
Adjusted results5
Total operating income as reported 1,899 1,874 1,901 1 0
Total operating income (adjusted) 1,899 1,874 1,901 1 0
Total operating expenses as reported 1,688 1,860 1,633 (9) 3
of which: personnel-related restructuring expenses 0 0 0
of which: non-personnel-related restructuring expenses 0 0 0
of which: restructuring expenses allocated from CC – Services 33 50 25
Total operating expenses (adjusted) 1,655 1,810 1,608 (9) 3
Business division operating profit / (loss) before tax as reported 212 13 268 (21)
Business division operating profit / (loss) before tax (adjusted) 245 63 293 289 (16)
Key performance indicators6
Pre-tax profit growth (%) 1,530.8 (95.1) 23.5
Cost / income ratio (%) 88.8 99.3 85.9
Net new money growth (%) 5.3 6.8 1.9
Gross margin on invested assets (bps) 73 74 73 (1) 0
Net margin on invested assets (bps) 8 1 10 700 (20)

UBS
bus
ines
s di
visi
ons
and
Cor
pora
te C
ente
r
27
Wealth Management Americas – in US dollars1 (continued)
As of or for the quarter ended % change from
USD million, except where indicated 31.3.16 31.12.15 31.3.15 4Q15 1Q15
Additional information
Recurring income7 1,533 1,486 1,463 3 5
Recurring income as a percentage of income (%) 80.7 79.3 77.0
Average attributed equity (USD billion)8 2.5 2.5 2.5 0 0
Return on attributed equity (%) 33.9 2.1 42.9
Risk-weighted assets (fully applied, USD billion)9 23.0 21.9 22.4 5 3
Return on risk-weighted assets, gross (%)10 33.9 33.5 34.4
Leverage ratio denominator (fully applied, USD billion)11 63.3 62.8 57.9 1 9
Goodwill and intangible assets (USD billion) 3.7 3.7 3.7 0 0
Net new money (USD billion) 13.6 16.8 4.8
Net new money including interest and dividend income (USD billion)12 19.1 26.2 10.3
Invested assets (USD billion) 1,050 1,033 1,050 2 0
Client assets (USD billion) 1,099 1,084 1,104 1 0
Loans, gross (USD billion) 48.7 48.7 45.5 0 7
Due to customers (USD billion) 86.5 83.1 74.5 4 16
Recruitment loans to financial advisors 3,254 3,179 2,871 2 13
Other loans to financial advisors 543 418 487 30 11
Personnel (full-time equivalents) 13,682 13,611 13,275 1 3
Financial advisors (full-time equivalents) 7,145 7,140 6,982 0 2
1 Comparative figures in this table may differ from those originally published in quarterly and annual reports due to adjustments following organizational changes, restatements due to the retrospective adoption of new accounting standards or changes in accounting policies, and events after the reporting period. 2 Financial advisor compensation consists of grid-based compensation based directly on compensable revenues generated by financial advisors and supplemental compensation calculated on the basis of financial advisor productivity, firm tenure, assets and other variables. 3 Compensation commitments with recruited financial advisors represents expenses related to compensation commitments granted to financial advisors at the time of recruitment which are subject to vesting requirements. 4 Refer to “Note 18 Changes in organization and dispos-als” in the “Consolidated financial statements” section of this report for information on restructuring expenses. 5 Adjusted results are non-GAAP financial measures as defined by SEC regulations. 6 Refer to the “Measurement of performance” section of our Annual Report 2015 for the definitions of our key performance indicators. 7 Recurring income consists of net interest income and recurring net fee income. 8 Refer to the “Capital management” section of this report for more information on the equity attribution framework. 9 Based on the Basel III framework as applicable for Swiss systemically relevant banks (SRBs). Refer to the ”Capital management” section of this report for more information. 10 Based on fully applied risk-weighted assets. 11 Calculated in accordance with Swiss SRB rules. Refer to the “Capital management” section of this report for more information. From 31 December 2015 onward, the leverage ratio denominator calculation is fully aligned with the Basel III rules. Figures for periods prior to 31 December 2015 are calculated in accor-dance with former Swiss SRB rules and are therefore not fully comparable. 12 Presented in line with historical reporting practice in the US market.

Wealth Management Americas
28
Wealth Management Americas – in Swiss francs1
As of or for the quarter ended % change from
CHF million, except where indicated 31.3.16 31.12.15 31.3.15 4Q15 1Q15
Net interest income 349 328 263 6 33
Recurring net fee income 1,176 1,167 1,124 1 5
Transaction-based income 360 379 410 (5) (12)
Other income 6 12 5 (50) 20
Income 1,891 1,885 1,801 0 5
Credit loss (expense) / recovery (1) 0 0
Total operating income 1,889 1,885 1,801 0 5
Personnel expenses 1,202 1,192 1,123 1 7
Financial advisor compensation2 711 718 693 (1) 3
Compensation commitments with recruited financial advisors3 198 199 177 (1) 12
Salaries and other personnel costs 293 275 253 7 16
General and administrative expenses 144 350 120 (59) 20
Services (to) / from other business divisions and Corporate Center 318 316 293 1 9
of which: services from CC – Services 315 311 289 1 9
Depreciation and impairment of property, equipment and software 0 0 1 (100)
Amortization and impairment of intangible assets 13 13 12 0 8
Total operating expenses4 1,678 1,871 1,548 (10) 8
Business division operating profit / (loss) before tax 211 14 253 (17)
Adjusted results5
Total operating income as reported 1,889 1,885 1,801 0 5
Total operating income (adjusted) 1,889 1,885 1,801 0 5
Total operating expenses as reported 1,678 1,871 1,548 (10) 8
of which: personnel-related restructuring expenses 0 0 0
of which: non-personnel-related restructuring expenses 0 0 0
of which: restructuring expenses allocated from CC – Services 33 50 24
Total operating expenses (adjusted) 1,645 1,821 1,524 (10) 8
Business division operating profit / (loss) before tax as reported 211 14 253 (17)
Business division operating profit / (loss) before tax (adjusted) 244 64 277 281 (12)
Key performance indicators6
Pre-tax profit growth (%) 1,407.1 (94.6) 19.9
Cost / income ratio (%) 88.7 99.3 86.0
Net new money growth (%) 5.3 7.0 1.8
Gross margin on invested assets (bps) 74 75 70 (1) 6
Net margin on invested assets (bps) 8 1 10 700 (20)

UBS
bus
ines
s di
visi
ons
and
Cor
pora
te C
ente
r
29
Wealth Management Americas – in Swiss francs1 (continued)
As of or for the quarter ended % change from
CHF million, except where indicated 31.3.16 31.12.15 31.3.15 4Q15 1Q15
Additional informationRecurring income7 1,525 1,495 1,387 2 10Recurring income as a percentage of income (%) 80.6 79.3 77.0Average attributed equity (CHF billion)8 2.5 2.5 2.4 0 4Return on attributed equity (%) 33.8 2.2 42.2Risk-weighted assets (fully applied, CHF billion)9 22.1 21.9 21.8 1 1Return on risk-weighted assets, gross (%)10 34.4 34.1 33.1Leverage ratio denominator (fully applied, CHF billion)11 60.9 62.9 56.3 (3) 8Goodwill and intangible assets (CHF billion) 3.6 3.7 3.6 (3) 0Net new money (CHF billion) 13.6 16.9 4.6Net new money including interest and dividend income (CHF billion)12 19.1 26.3 9.8Invested assets (CHF billion) 1,009 1,035 1,021 (3) (1)Client assets (CHF billion) 1,056 1,085 1,073 (3) (2)Loans, gross (CHF billion) 46.8 48.8 44.2 (4) 6Due to customers (CHF billion) 83.2 83.2 72.4 0 15Recruitment loans to financial advisors 3,128 3,184 2,791 (2) 12Other loans to financial advisors 522 418 473 25 10Personnel (full-time equivalents) 13,682 13,611 13,275 1 3Financial advisors (full-time equivalents) 7,145 7,140 6,982 0 21 Comparative figures in this table may differ from those originally published in quarterly and annual reports due to adjustments following organizational changes, restatements due to the retrospective adoption of new accounting standards or changes in accounting policies, and events after the reporting period. 2 Financial advisor compensation consists of grid-based compensation based directly on compensable revenues generated by financial advisors and supplemental compensation calculated on the basis of financial advisor productivity, firm tenure, assets and other variables. 3 Compensation commitments with recruited financial advisors represents expenses related to compensation commitments granted to financial advisors at the time of recruitment which are subject to vesting requirements. 4 Refer to “Note 18 Changes in organization and dispos-als” in the “Consolidated financial statements” section of this report for information on restructuring expenses. 5 Adjusted results are non-GAAP financial measures as defined by SEC regulations. 6 Refer to the “Measurement of performance” section of our Annual Report 2015 for the definitions of our key performance indicators. 7 Recurring income consists of net interest income and recurring net fee income. 8 Refer to the “Capital management” section of this report for more information on the equity attribution framework. 9 Based on the Basel III framework as applicable for Swiss systemically relevant banks (SRBs). Refer to the ”Capital management” section of this report for more information. 10 Based on fully applied risk-weighted assets. 11 Calculated in accordance with Swiss SRB rules. Refer to the “Capital management” section of this report for more information. From 31 December 2015 onward, the leverage ratio denominator calculation is fully aligned with the Basel III rules. Figures for periods prior to 31 December 2015 are calculated in accor-dance with former Swiss SRB rules and are therefore not fully comparable. 12 Presented in line with historical reporting practice in the US market.
Results: 1Q16 vs 4Q15
Operating incomeTotal operating income increased by USD 25 million to USD 1,899 million, reflecting higher net interest income and recurring net fee income, partly offset by lower transaction-based income.
Net interest income increased by USD 25 million to USD 351 million, mainly due to higher interest rates. The average mortgage portfolio balance increased 4% and the average securities-backed lending portfolio balance increased 1%.
Recurring net fee income increased by USD 22 million to USD 1,182 million, mainly due to higher managed account fees, which were calculated on higher invested asset levels at the end of the prior quarter.
Transaction-based income decreased by USD 15 million to USD 361 million due to lower client activity.
Other income decreased by USD 6 million to USD 6 million.
Operating expensesTotal operating expenses decreased by USD 172 million to USD 1,688 million. Excluding restructuring expenses of USD 33 million compared with USD 50 million, adjusted operating expenses decreased by USD 155 million to USD 1,655 million, mainly due to USD 215 million lower net expenses for provisions for litigation, regulatory and similar matters.
Personnel expenses increased by USD 24 million to USD 1,209 million, mainly due to initial expenses associated with the transi-tion to a new health care benefit plan and higher expenses for variable compensation.
General and administrative expenses decreased by USD 203 million to USD 145 million, mainly due to the aforementioned decrease in net expenses for provisions for litigation, regulatory and similar matters.
Excluding restructuring expenses of USD 33 million compared with USD 50 million, adjusted net expenses for services from other business divisions and Corporate Center increased by USD 24 mil-lion. The previous quarter included a cost agreement credit from Corporate Center – Services of USD 36 million, while expenses from Group Technology were lower in the current quarter.
➔ Refer to the “Corporate Center – Services” section of this report
for more information on cost allocations from Corporate Center
– Services to the business divisions and other CC units
Cost / income ratioThe cost / income ratio was 88.8% compared with 99.3%. On an adjusted basis, the cost / income ratio was 87.1% compared with 96.6%.

Wealth Management Americas
30
Net new moneyNet new money was USD 13.6 billion compared with USD 16.8 billion. The first quarter of 2016 reflected net inflows predomi-nantly from newly recruited advisors as well as from financial advi-sors employed with UBS for more than one year. The annualized net new money growth rate was 5.3% compared with 6.8%. Including interest and dividend income, net new money was USD 19.1 billion compared with USD 26.2 billion in the prior quarter, which included seasonally higher dividend income.
Invested assetsInvested assets increased by USD 17 billion to USD 1,050 billion, mainly reflecting net new money of USD 14 billion and positive market performance of USD 2 billion. Managed account assets increased by USD 10 billion to USD 361 billion and comprised 34% of total invested assets.
Margins on invested assetsThe net margin on invested assets increased 7 basis points to 8 basis points. On an adjusted basis, the net margin increased 7 basis points to 9 basis points. The gross margin decreased 1 basis point to 73 basis points, on both a reported and an adjusted basis.
Personnel: 1Q16 vs 4Q15
As of 31 March 2016, Wealth Management Americas employed 13,682 personnel, an increase of 71 compared with 31 December 2015.
Results: 1Q16 vs 1Q15
Profit before tax was USD 212 million compared with USD 268 million. Excluding restructuring expenses of USD 33 million com-pared with USD 25 million, adjusted profit before tax decreased by USD 48 million to USD 245 million, mainly reflecting higher operating expenses.
Total operating income decreased by USD 2 million to USD 1,899 million. Net interest income increased by USD 74 million to USD 351 million, reflecting higher interest rates as well as contin-ued growth in loan and deposit balances. Recurring net fee income decreased by USD 4 million to USD 1,182 million. Transac-tion-based income decreased by USD 71 million to USD 361 mil-lion due to lower client activity.
Total operating expenses increased by USD 55 million to USD 1,688 million. Excluding restructuring expenses of USD 33 million compared with USD 25 million, adjusted operating expenses increased by USD 47 million to USD 1,655 million. Personnel expenses increased by USD 24 million to USD 1,209 million, mainly due to initial expenses associated with the transition to a new health care benefit plan, partly offset by lower financial advi-sor compensation due to lower compensable revenues. Expenses for compensation commitments increased by USD 13 million, reflecting the recruitment of financial advisors. General and administrative expenses increased by USD 19 million to USD 145 million, mainly due to higher legal fees. Excluding restructuring expenses of USD 33 million compared with USD 25 million, net expenses for services from other business divisions and Corporate Center increased by USD 3 million to USD 287 million.

UBS
bus
ines
s di
visi
ons
and
Cor
pora
te C
ente
r
31
Personal & Corporate Banking
Profit before tax was CHF 399 million in the first quarter of 2016 compared with CHF 355 million in the fourth quarter of 2015. Adjusted profit before tax increased by CHF 26 million to CHF 422 million, mainly as the prior quarter included a fee of CHF 45 million paid to Wealth Management for the shift of certain clients. The annualized net new business volume growth rate for our personal banking business increased to 4.9% from 0.6%, the highest growth rate since the first quarter of 2012.
Personal & Corporate Banking1
As of or for the quarter ended % change from
CHF million, except where indicated 31.3.16 31.12.15 31.3.15 4Q15 1Q15
Net interest income 560 576 568 (3) (1)
Recurring net fee income 139 139 134 0 4
Transaction-based income 244 196 284 24 (14)
Other income 20 15 13 33 54
Income 963 926 1,000 4 (4)
Credit loss (expense) / recovery 0 (11) (21) (100) (100)
Total operating income 963 915 979 5 (2)
Personnel expenses 213 211 226 1 (6)
General and administrative expenses 61 71 53 (14) 15
Services (to) / from other business divisions and Corporate Center 287 275 268 4 7
of which: services from CC – Services 311 298 292 4 7
Depreciation and impairment of property, equipment and software 4 3 4 33 0
Amortization and impairment of intangible assets 0 0 0
Total operating expenses2 564 560 552 1 2
Business division operating profit / (loss) before tax 399 355 427 12 (7)
Adjusted results3
Total operating income as reported 963 915 979 5 (2)
Total operating income (adjusted) 963 915 979 5 (2)
Total operating expenses as reported 564 560 552 1 2
of which: personnel-related restructuring expenses 0 0 1
of which: non-personnel-related restructuring expenses 0 0 0
of which: restructuring expenses allocated from CC – Services 23 41 16
Total operating expenses (adjusted) 541 519 536 4 1
Business division operating profit / (loss) before tax as reported 399 355 427 12 (7)
Business division operating profit / (loss) before tax (adjusted) 422 396 443 7 (5)
Key performance indicators4
Pre-tax profit growth (%) 12.4 (23.8) 25.6
Cost / income ratio (%) 58.6 60.5 55.2
Net interest margin (bps) 166 170 165 (2) 1
Net new business volume growth for personal banking (%) 4.9 0.6 3.1

Personal & Corporate Banking
32
Personal & Corporate Banking1 (continued)
As of or for the quarter ended % change from
CHF million, except where indicated 31.3.16 31.12.15 31.3.15 4Q15 1Q15
Additional information
Average attributed equity (CHF billion)5 4.1 3.9 4.0 5 2
Return on attributed equity (%) 38.9 36.4 42.7
Risk-weighted assets (fully applied, CHF billion)6 36.9 34.6 34.6 7 7
Return on risk-weighted assets, gross (%)7 10.8 10.7 11.8
Leverage ratio denominator (fully applied, CHF billion)8 152.2 153.8 163.7 (1) (7)
Goodwill and intangible assets (CHF billion) 0.0 0.0 0.0
Business volume for personal banking (CHF billion) 148 148 143 0 3
Net new business volume for personal banking (CHF billion) 1.8 0.2 1.1
Client assets (CHF billion) 440 444 441 (1) 0
Due to customers (CHF billion) 133.5 132.4 131.3 1 2
Loans, gross (CHF billion) 135.0 135.6 137.3 0 (2)
Secured loan portfolio as a percentage of total loan portfolio, gross (%) 93.1 93.9 93.2
Impaired loan portfolio as a percentage of total loan portfolio, gross (%)9 0.7 0.6 0.8
Personnel (full-time equivalents) 5,092 5,058 5,157 1 (1)
1 Comparative figures in this table may differ from those originally published in quarterly and annual reports due to adjustments following organizational changes, restatements due to the retrospective adoption of new accounting standards or changes in accounting policies, and events after the reporting period. 2 Refer to “Note 18 Changes in organization and disposals” in the “Consolidated financial statements” section of this report for information on restructuring expenses. 3 Adjusted results are non-GAAP financial measures as defined by SEC regulations. 4 Refer to the “Measurement of performance” section of our Annual Report 2015 for the definitions of our key performance indicators. 5 Refer to the “Capital management” section of this report for more information on the equity attribution framework. 6 Based on the Basel III framework as appli-cable for Swiss systemically relevant banks (SRBs). Refer to the ”Capital management” section of this report for more information. 7 Based on fully applied risk-weighted assets. 8 Calculated in accordance with Swiss SRB rules. Refer to the “Capital management” section of this report for more information. From 31 December 2015 onward, the leverage ratio denominator calculation is fully aligned with the Basel III rules. Figures for periods prior to 31 December 2015 are calculated in accordance with former Swiss SRB rules and are therefore not fully comparable. 9 Refer to the “Risk management and control” section of this report for more infor-mation on impairment ratios.

UBS
bus
ines
s di
visi
ons
and
Cor
pora
te C
ente
r
33
Results: 1Q16 vs 4Q15
Operating incomeTotal operating income increased by CHF 48 million to CHF 963 million, mainly as the prior quarter included a fee of CHF 45 mil-lion paid to Wealth Management for the shift of certain clients from Wealth Management to Personal & Corporate Banking, as a result of a detailed client segmentation review.
Net interest income decreased by CHF 16 million to CHF 560 mil-lion, mainly reflecting lower allocations from Corporate Center – Group Asset and Liability Management (Group ALM), partly offset by higher income from loans and deposits.
Recurring net fee income was unchanged at CHF 139 million.Transaction-based income increased by CHF 48 million to CHF
244 million, mainly due to the aforementioned fee paid to Wealth Management in the prior quarter.
Other income increased by CHF 5 million to CHF 20 million, reflecting higher income from non-asset-based products and from investments in associates.
The net credit loss recovery was negligible compared with a CHF 11 million expense in the prior quarter. In the first quarter, expenses for allowances for newly impaired positions were offset by net recoveries related to previously impaired positions. In the prior quarter, expenses for allowances for newly impaired positions exceeded net recoveries related to previously impaired positions.
Operating expensesTotal operating expenses increased by CHF 4 million to CHF 564 million. Excluding restructuring expenses of CHF 23 million com-pared with CHF 41 million, adjusted operating expenses increased by CHF 22 million to CHF 541 million, mainly reflecting higher net expenses for services from other business divisions and Corporate Center, partly offset by lower general and administrative expenses.
Personnel expenses were broadly unchanged at CHF 213 million.
General and administrative expenses decreased by CHF 10 mil-lion to CHF 61 million, primarily reflecting lower professional fees and decreased expenses for outsourcing of information technology and other services.
Net expenses for services from other business divisions and Corporate Center increased by CHF 12 million to CHF 287 million. Excluding restructuring expenses of CHF 23 million compared with CHF 41 million in the prior quarter, adjusted net expenses increased by CHF 30 million to CHF 264 million. The previous quar-ter included a cost agreement credit from Corporate Center – Ser-vices of CHF 49 million, while expenses from Group Technology were lower in the current quarter.
➔ Refer to the “Corporate Center – Services” section of this report
for more information on cost allocations from Corporate Center –
Services to the business divisions and other CC units
Cost / income ratioThe cost / income ratio was 58.6% compared with 60.5%. On an adjusted basis, the cost / income ratio was 56.2% compared with 56.0%.
Net interest marginThe net interest margin decreased 4 basis points to 166 basis points.
Net new business volume growth for personal bankingThe annualized net new business volume growth rate for our per-sonal banking business was 4.9% compared with 0.6%, the high-est growth rate since the first quarter of 2012.
Net new client assets and, to a lesser extent, net new loans were positive, in line with our strategy to grow our high-quality loans business moderately and selectively.
Personnel: 1Q16 vs 4Q15
Personal & Corporate Banking employed 5,092 personnel as of 31 March 2016, an increase of 34 compared with 5,058 person-nel as of 31 December 2015, mainly reflecting the intake of apprentices and graduates.
Results: 1Q16 vs 1Q15
Profit before tax decreased by CHF 28 million to CHF 399 million. Excluding restructuring expenses of CHF 23 million compared with CHF 16 million, adjusted profit before tax decreased by CHF 21 million to CHF 422 million, mainly reflecting lower transaction-based income, partly offset by lower net credit loss expenses.
Total operating income decreased by CHF 16 million to CHF 963 million. Net interest income decreased by CHF 8 million to CHF 560 million, reflecting lower allocations from Group ALM and the adverse effect of persistently low interest rates on our replica-tion portfolios. This was partly offset by higher loan and deposit income. Recurring net fee income increased by CHF 5 million to CHF 139 million, mainly reflecting higher account-keeping fees. Transaction-based income decreased by CHF 40 million to CHF 244 million, partly as the first quarter of 2015 included gains as a result of hedge ineffectiveness, arising from the fair value hedge of portfolio interest rate risk related to mortgage loans, due to the reduction in Swiss franc interest rates following the Swiss National Bank’s (SNB’s) actions in January 2015. Moreover, income from for-eign exchange trading decreased as the prior year reflected higher client activity following the SNB’s actions. Other income increased by CHF 7 million to CHF 20 million, driven by higher income from non-asset-based products. The net credit loss recovery was negli-gible compared with a net expense of CHF 21 million. In the first quarter of 2016, expenses for allowances for newly impaired posi-tions were offset by net recoveries related to previously impaired positions. In the same quarter last year, credit loss expenses mainly related to expenses for allowances for newly impaired positions.
Total operating expenses increased by CHF 12 million to CHF 564 million. Excluding restructuring expenses of CHF 23 million compared with CHF 16 million, adjusted operating expenses increased by CHF 5 million to CHF 541 million.

Asset Management
34
Asset Management
Profit before tax was CHF 90 million in the first quarter of 2016 compared with CHF 171 million in the fourth quarter of 2015, which included a gain of CHF 56 million on the sale of our Alternative Fund Services business. Adjusted profit before tax was CHF 110 million compared with CHF 153 million, partly due to lower performance fees in Equities, Multi Asset & O’Connor. Excluding money market flows, net new money outflows were CHF 5.9 billion compared with CHF 8.9 billion. The first quarter of 2016 included a CHF 7.2 billion pricing-related outflow from one client and CHF 3.8 billion of outflows driven by client liquidity needs, both from lower-margin passive products.
Asset Management1
As of or for the quarter ended % change from
CHF million, except where indicated 31.3.16 31.12.15 31.3.15 4Q15 1Q15
Net management fees2 446 524 443 (15) 1Performance fees 23 44 68 (48) (66)Total operating income 468 568 511 (18) (8)Personnel expenses 183 199 167 (8) 10General and administrative expenses 57 66 55 (14) 4Services (to) / from other business divisions and Corporate Center 137 131 119 5 15
of which: services from CC – Services 142 139 123 2 15Depreciation and impairment of property, equipment and software 0 1 0 (100)Amortization and impairment of intangible assets 1 1 2 0 (50)Total operating expenses3 378 397 343 (5) 10Business division operating profit / (loss) before tax 90 171 168 (47) (46)
Adjusted results4
Total operating income as reported 468 568 511 (18) (8)of which: gains / (losses) on sales of subsidiaries and businesses 56
Total operating income (adjusted) 468 512 511 (9) (8)Total operating expenses as reported 378 397 343 (5) 10
of which: personnel-related restructuring expenses 1 3 0of which: non-personnel-related restructuring expenses 2 8 0of which: restructuring expenses allocated from CC – Services 17 27 17
Total operating expenses (adjusted) 358 359 325 0 10Business division operating profit / (loss) before tax as reported 90 171 168 (47) (46)Business division operating profit / (loss) before tax (adjusted) 110 153 186 (28) (41)
Key performance indicators5
Pre-tax profit growth (%) (47.4) 50.0 97.6
Cost / income ratio (%) 80.8 69.9 67.1
Net new money growth excluding money market flows (%) (4.0) (6.2) 5.0
Gross margin on invested assets (bps) 29 35 31 (17) (6)
Net margin on invested assets (bps) 6 11 10 (45) (40)
Information by business line Operating income Equities, Multi Asset & O’Connor 221 232 239 (5) (8)Fixed Income 72 73 72 (1) 0Global Real Estate 108 115 93 (6) 16Infrastructure and Private Equity 15 13 14 15 7Solutions 23 30 45 (23) (49)Fund Services 30 105 48 (71) (38)Total operating income 468 568 511 (18) (8)

UBS
bus
ines
s di
visi
ons
and
Cor
pora
te C
ente
r
35
Asset Management1 (continued)
As of or for the quarter ended % change from
CHF million, except where indicated 31.3.16 31.12.15 31.3.15 4Q15 1Q15
Gross margin on invested assets (bps) Equities, Multi Asset & O’Connor 28 29 28 (3) 0Fixed Income 14 14 13 0 8Global Real Estate 82 90 80 (9) 3Infrastructure and Private Equity 63 55 62 15 2Solutions 18 23 38 (22) (53)Total gross margin 29 35 31 (17) (6)
Net new money (CHF billion) Equities, Multi Asset & O’Connor (0.5) (9.1) 2.9
Fixed Income (3.8) (2.4) (1.0)
Global Real Estate 0.5 1.0 0.5
Infrastructure and Private Equity (0.2) 0.0 0.0
Solutions 1.1 (0.6) 2.8
Total net new money (2.9) (11.0) 5.1
Net new money excluding money market flows (5.9) (8.9) 7.5
of which: from third parties (4.5) (7.6) 2.5
of which: from UBS’s wealth management businesses (1.4) (1.3) 5.1
Money market flows 3.0 (2.1) (2.4)
of which: from third parties 2.2 (1.8) (1.2)
of which: from UBS’s wealth management businesses 0.8 (0.3) (1.2)
Invested assets (CHF billion) Equities, Multi Asset & O’Connor 311 327 346 (5) (10)
Fixed Income 204 208 210 (2) (3)
Global Real Estate 53 52 47 2 13
Infrastructure and Private Equity 9 10 9 (10) 0
Solutions 51 53 48 (4) 6
Total invested assets 628 650 661 (3) (5)
of which: excluding money market funds 568 592 601 (4) (5)
of which: money market funds 60 58 60 3 0
Assets under administration by Fund Services
Assets under administration (CHF billion)6 407 407 521 0 (22)
Net new assets under administration (CHF billion)7 7.8 (0.1) 5.8
Gross margin on assets under administration (bps) 3 9 4 (67) (25)
Additional information Average attributed equity (CHF billion)8 1.4 1.5 1.7 (7) (18)Return on attributed equity (%) 25.7 45.6 39.5Risk-weighted assets (fully applied, CHF billion)9 2.4 2.6 3.5 (8) (31)Return on risk-weighted assets, gross (%)10 74.9 79.7 56.0Leverage ratio denominator (fully applied, CHF billion)11 2.5 2.7 14.0 (7) (82)Goodwill and intangible assets (CHF billion) 1.4 1.4 1.4 0 0Personnel (full-time equivalents) 2,329 2,277 2,369 2 (2)1 Comparative figures in this table may differ from those originally published in quarterly and annual reports due to adjustments following organizational changes, restatements due to the retrospective adoption of new accounting standards or changes in accounting policies, and events after the reporting period. 2 Net management fees include transaction fees, fund administration revenues (including net interest and trading income from lending activities and foreign exchange hedging as part of the fund services offering), gains or losses from seed money and co-investments, funding costs, gains and losses on the sale of subsidiaries and businesses and other items that are not performance fees. 3 Refer to “Note 18 Changes in organization and disposals” in the “Consolidated financial statements” section of this report for information on restructuring expenses. 4 Adjusted results are non-GAAP financial measures as defined by SEC regulations. 5 Refer to the “Measurement of performance” section of our Annual Report 2015 for the definitions of our key performance indicators. 6 Includes UBS and third-party fund assets, for which the fund services unit provides professional services, including fund set-up, accounting and reporting for traditional investment funds and alternative funds. 7 Inflows of assets under administration from new and existing funds less outflows from existing funds or fund exits. 8 Refer to the “Capital management” section of this report for more information on the equity attribution framework. 9 Based on the Basel III framework as applicable for Swiss systemically relevant banks (SRBs). Refer to the ”Capital management” section of this report for more information. 10 Based on fully applied risk-weighted assets. 11 Calculated in accordance with Swiss SRB rules. Refer to the “Capital management” section of this report for more information. From 31 December 2015 onward, the leverage ratio denom-inator calculation is fully aligned with the Basel III rules. Figures for periods prior to 31 December 2015 are calculated in accordance with former Swiss SRB rules and are therefore not fully comparable.

Asset Management
36
Results: 1Q16 vs 4Q15
Operating incomeTotal operating income was CHF 468 million compared with CHF 568 million. Excluding a gain of CHF 56 million on the sale of our Alternative Fund Services (AFS) business in the fourth quarter of 2015, adjusted operating income decreased by CHF 44 million to CHF 468 million. Adjusted net management fees decreased by CHF 22 million to CHF 446 million, primarily reflecting the reduced size of our Fund Services business following the sale of AFS. Per-formance fees decreased by CHF 21 million to CHF 23 million, mainly in Equities, Multi Asset & O’Connor.
Approximately 1% of performance fee-eligible assets of our hedge fund businesses, which are reported within Equities, Multi Asset & O’Connor and Solutions, exceeded high-water marks as of 31 March 2016 compared with 25% as of 31 December 2015, reflecting continued challenging market conditions.
➔ Refer to the “Recent developments” section of this report for
more information on the change in Asset Management business
lines
Operating expensesTotal operating expenses were CHF 378 million compared with CHF 397 million. Excluding restructuring expenses of CHF 20 mil-lion compared with CHF 38 million, adjusted operating expenses were largely unchanged at CHF 358 million.
Personnel expenses decreased by CHF 16 million, primarily due to lower expenses for variable compensation. General and admin-istrative expenses were CHF 57 million compared with CHF 66 million. Excluding restructuring expenses of CHF 2 million com-pared with CHF 8 million, adjusted general and administrative expenses were slightly lower.
Excluding restructuring expenses of CHF 17 million compared with CHF 27 million, adjusted net expenses for services from other business divisions and Corporate Center increased by CHF 16 mil-lion, primarily as the previous quarter included a cost agreement credit from Corporate Center – Services of CHF 13 million.
➔ Refer to the “Corporate Center – Services” section of this report
for more information on cost allocations from Corporate Center –
Services to the business divisions and other CC units
Cost / income ratioThe cost / income ratio was 80.8% compared with 69.9%. On an adjusted basis, the cost / income ratio was 76.5% compared with 70.1%.
Net new moneyExcluding money market flows, net new money outflows were CHF 5.9 billion compared with CHF 8.9 billion, which resulted in an annualized net new money growth rate of negative 4.0% compared with negative 6.2%. By client segment, net outflows from third parties were CHF 4.5 billion compared with CHF 7.6 billion. The first quarter of 2016 included a CHF 7.2 billion pric-ing-related outflow from one client and CHF 3.8 billion of out-flows driven by client liquidity needs, both from lower-margin passive products. Net outflows from clients of UBS’s wealth man-agement businesses were CHF 1.4 billion compared with CHF 1.3 billion, mainly from fixed income assets serviced from Switzerland and equities assets serviced from Europe and Switzerland.
Money market net inflows were CHF 3.0 billion compared with net outflows of CHF 2.1 billion. By client segment, net inflows from third parties were CHF 2.2 billion compared with net outflows of CHF 1.8 billion, mainly from clients serviced from Asia Pacific and the Americas. Net inflows from clients of UBS’s wealth manage-ment businesses were CHF 0.8 billion compared with net outflows of CHF 0.3 billion, mainly from clients serviced from the Americas.
Invested assetsInvested assets decreased to CHF 628 billion from CHF 650 billion, due to negative foreign currency translation effects of CHF 13 bil-lion, negative market performance of CHF 7 billion and net new money outflows of CHF 3 billion.
As of 31 March 2016, CHF 183 billion, or 29%, of invested assets were managed in indexed strategies and CHF 60 billion, or 10%, were money market assets. The remaining 61% of invested assets were managed in active, non-money market strategies. On a regional basis, 34% of invested assets related to clients serviced from Switzerland, 24% from the Americas, 22% from Europe, Middle East and Africa, and 20% from Asia Pacific.
Assets under administrationTotal assets under administration were unchanged at CHF 407 billion. Net new assets under administration of CHF 8 billion were offset by negative market performance of CHF 5 billion and nega-tive foreign currency translation effects of CHF 3 billion.
Margins on invested assetsThe net margin on invested assets decreased 5 basis points to 6 basis points. On an adjusted basis, the net margin decreased 3 basis points to 7 basis points. The gross margin decreased 6 basis points to 29 basis points, and decreased 3 basis points to 29 basis points on an adjusted basis.

UBS
bus
ines
s di
visi
ons
and
Cor
pora
te C
ente
r
37
Personnel: 1Q16 vs 4Q15
Asset Management employed 2,329 personnel compared with 2,277, mainly reflecting increases within our distribution teams, Global Real Estate and, to a lesser extent, support functions.
Results: 1Q16 vs 1Q15
Profit before tax was CHF 90 million compared with CHF 168 mil-lion. Excluding restructuring expenses of CHF 20 million com-pared with CHF 18 million, adjusted profit before tax was CHF 110 million compared with CHF 186 million.
Total operating income was CHF 468 million compared with CHF 511 million, mainly due to lower performance fees in our hedge fund businesses, and lower net management fees in Fund Services, reflecting the sale of our AFS business, partly offset by higher net management fees in Global Real Estate and Equities, Multi Asset & O’Connor.
Total operating expenses were CHF 378 million compared with CHF 343 million. Excluding restructuring expenses of CHF 20 mil-lion compared with CHF 18 million, adjusted operating expenses increased by CHF 33 million to CHF 358 million, primarily due to higher expenses from Group Technology.
Investment performance as of 31 March 2016
Annualized
Active funds versus benchmark 1 year 3 years 5 years
Percentage of fund assets equaling or exceeding benchmark
Equities1 63 85 76
Fixed income1 43 54 65
Multi-asset1 23 72 45
Total traditional investments 42 69 60
Real estate2 15 23 17
Active funds versus peers
Percentage of fund assets ranking in first or second quartile / equaling or exceeding peer index
Equities1 71 83 73
Fixed income1 54 67 67
Multi-asset1 49 56 78
Total traditional investments 57 68 72
Real estate2 11 100 27
Hedge funds3 50 73 71
Passive funds tracking accuracy
Percentage of passive fund assets within applicable tracking tolerance
All asset classes4 82 93 93
1 Percentage of active fund assets above benchmark (gross of fees) / peer median. Based on the universe of European-domiciled active wholesale funds available to UBS’s wealth management businesses and other whole-sale intermediaries as of 31 March 2016. Source of comparison versus peers: ThomsonReuters LIM (Lipper Investment Management). Source of comparison versus benchmark: UBS. Universe represents approximately 70% of all active fund assets and 26% of all actively managed assets (including segregated accounts) in these asset classes globally as of 31 March 2016. 2 Percentage of real estate fund assets above benchmark (gross of fess) / peer median. Universe (versus benchmark) includes all fully discretionary real estate funds with a benchmark representing approximately 70% of real estate gross invested assets as at 31 March 2016. Source: IPD, NFI-ODCE, SXI Real Estate Funds TR. Universe (versus peers) includes all real estate funds with externally verifiable peer groups representing approximately 23% of real estate gross invested assets as of 31 December 2015. Source: ThomsonReuters LIM (Lipper Investment Management). 3 Percentage of fund assets above appropriate HFRI peer indices. Universe of key hedge funds and fund-of-fund products managed on a fully discretionary basis representing approximately 34% of total O’Connor and Hedge Fund Solutions invested assets. 4 Percentage of passive fund assets within applicable tracking tolerance on a gross of fees basis. Performance information represents a universe of European domiciled institutional and wholesale funds representing approximately 48% of total passive invested assets as of 31 March 2016. Source: UBS.

Investment Bank
38
Investment Bank
Profit before tax was CHF 253 million in the first quarter of 2016 compared with CHF 80 million in the fourth quarter of 2015. Adjusted profit before tax was CHF 370 million compared with CHF 223 million, reflecting higher revenues in Investor Client Services and a net credit loss recovery compared with a net credit loss expense, partly offset by lower revenues in Corporate Client Solutions.
Investment Bank1
As of or for the quarter ended % change from
CHF million, except where indicated 31.3.16 31.12.15 31.3.15 4Q15 1Q15
Corporate Client Solutions 474 650 779 (27) (39)
Advisory 132 227 172 (42) (23)
Equity Capital Markets 154 197 306 (22) (50)
Debt Capital Markets 145 114 143 27 1
Financing Solutions 62 109 119 (43) (48)
Risk Management (18) 2 39
Investor Client Services 1,403 1,121 1,877 25 (25)
Equities 920 733 1,156 26 (20)
Foreign Exchange, Rates and Credit 483 388 721 24 (33)
Income 1,877 1,771 2,655 6 (29)
Credit loss (expense) / recovery 2 (50) 2 0
Total operating income 1,879 1,721 2,657 9 (29)
Personnel expenses 728 574 1,008 27 (28)
General and administrative expenses 170 318 189 (47) (10)
Services (to) / from other business divisions and Corporate Center 718 740 681 (3) 5
of which: services from CC – Services 691 715 667 (3) 4
Depreciation and impairment of property, equipment and software 6 7 6 (14) 0
Amortization and impairment of intangible assets 3 3 7 0 (57)
Total operating expenses2 1,625 1,641 1,891 (1) (14)
Business division operating profit / (loss) before tax 253 80 766 216 (67)
Adjusted results3
Total operating income as reported 1,879 1,721 2,657 9 (29)
Total operating income (adjusted) 1,879 1,721 2,657 9 (29)
Total operating expenses as reported 1,625 1,641 1,891 (1) (14)
of which: personnel-related restructuring expenses 17 12 2
of which: non-personnel-related restructuring expenses 2 2 2
of which: restructuring expenses allocated from CC – Services 97 129 66
Total operating expenses (adjusted) 1,508 1,498 1,821 1 (17)
Business division operating profit / (loss) before tax as reported 253 80 766 216 (67)
Business division operating profit / (loss) before tax (adjusted) 370 223 836 66 (56)
Key performance indicators4
Pre-tax profit growth (%) 216.3 (83.9) 253.0
Cost / income ratio (%) 86.6 92.7 71.2
Return on attributed equity (%) 13.1 4.4 42.0
Return on assets, gross (%) 2.9 2.7 3.6
Average VaR (1-day, 95% confidence, 5 years of historical data) 10 12 13 (17) (23)

UBS
bus
ines
s di
visi
ons
and
Cor
pora
te C
ente
r
39
Investment Bank1 (continued)
As of or for the quarter ended % change from
CHF million, except where indicated 31.3.16 31.12.15 31.3.15 4Q15 1Q15
Additional information
Total assets (CHF billion)5 256.6 253.5 303.2 1 (15)
Average attributed equity (CHF billion)6 7.7 7.3 7.3 5 5
Risk-weighted assets (fully applied, CHF billion)7 63.4 62.9 64.1 1 (1)
Return on risk-weighted assets, gross (%)8 11.9 10.8 16.2
Leverage ratio denominator (fully applied, CHF billion)9 262.2 268.0 294.2 (2) (11)
Goodwill and intangible assets (CHF billion) 0.1 0.1 0.1 0 0
Compensation ratio (%) 38.8 32.4 38.0
Impaired loan portfolio as a percentage of total loan portfolio, gross (%)10 1.7 1.5 0.2
Personnel (full-time equivalents) 5,218 5,243 5,276 0 (1)
1 Comparative figures in this table may differ from those originally published in quarterly and annual reports due to adjustments following organizational changes, restatements due to retrospective adoption of new accounting standards or changes in accounting policies, and events after the reporting period. 2 Refer to “Note 18 Changes in organization and disposals” in the “Consolidated financial statements” section of this report for information on restructuring expenses. 3 Adjusted results are non-GAAP financial measures as defined by SEC regulations. 4 Refer to the “Measurement of performance” section of our Annual Report 2015 for the definitions of our key performance indicators. 5 Based on third-party view, i.e., without intercompany balances. 6 Refer to the “Capital management” section of this report for more information on the equity attribution framework. 7 Based on the Basel III framework as applicable for Swiss systemically relevant banks (SRBs). Refer to the “Capital management” section of this report for more information. 8 Based on fully applied risk-weighted assets. 9 Calculated in accordance with Swiss SRB rules. Refer to the “Capital management” section of this report for more information. From 31 December 2015 onward, the leverage ratio denominator calculation is fully aligned with the Basel III rules. Figures for periods prior to 31 December 2015 are calculated in accordance with former Swiss SRB rules and are therefore not fully comparable. 10 Refer to the “Risk management and control” section of this report for more information on impairment ratios.
Results: 1Q16 vs 4Q15
Operating incomeTotal operating income increased to CHF 1,879 million from CHF 1,721 million in the prior quarter. Investor Client Services rev-enues increased by CHF 282 million, reflecting improved perfor-mance in both our Equities and Foreign Exchange, Rates and Credit businesses. Corporate Client Solutions revenues were CHF 176 mil-lion lower, mainly reflecting fee pool declines. We recorded a net credit loss recovery of CHF 2 million compared with a net expense of CHF 50 million, reflecting a specific loan loss recovery of CHF 22 million and lower net credit loss expenses related to the energy sec-tor. In US dollar terms, operating income increased 10%.
Operating expensesTotal operating expenses decreased to CHF 1,625 million from CHF 1,641 million. Excluding restructuring expenses of CHF 117 million compared with CHF 143 million, adjusted operating expenses increased by CHF 10 million to CHF 1,508 million.
Personnel expenses increased to CHF 728 million from CHF 574 million. Excluding restructuring expenses of CHF 17 million com-pared with CHF 12 million, adjusted personnel expenses increased
to CHF 711 million from CHF 562 million, mainly due to higher performance-related variable compensation expenses.
General and administrative expenses decreased to CHF 170 million from CHF 318 million. Excluding restructuring expenses of CHF 2 million in both quarters, adjusted general and administra-tive expenses decreased to CHF 168 million from CHF 316 million, mainly as the prior quarter included a net expense of CHF 98 mil-lion for the annual UK bank levy. In addition, the first quarter included lower professional fees and marketing as well as travel and entertainment expenses.
Net expenses for services from other business divisions and Corporate Center decreased to CHF 718 million from CHF 740 million. Excluding restructuring expenses of CHF 97 million com-pared with CHF 129 million, adjusted net expenses for services from other business divisions and Corporate Center increased to CHF 621 million from CHF 611 million. The previous quarter included a cost agreement credit from Corporate Center – Ser-vices of CHF 45 million, while expenses from Group Technology and Group Operations were lower in the current quarter.
➔ Refer to the “Corporate Center – Services” section of this report
for more information on cost allocations from Corporate Center
– Services to the business divisions and other CC units

Investment Bank
40
Cost / income ratioThe cost / income ratio was 86.6% compared with 92.7%. On an adjusted basis, the cost / income ratio was 80.3% compared with 84.6%.
Risk-weighted assetsFully applied risk-weighted assets (RWA) were stable at CHF 63 billion as of 31 March 2016 and remained below our short- to medium-term expectation of around CHF 85 billion. CHF 2 billion higher credit risk RWA were offset by CHF 2 billion lower market risk RWA.
➔ Refer to the “Capital management” section of this report for
more information
Leverage ratio denominatorThe fully applied Swiss systemically relevant banks leverage ratio denominator (LRD) decreased by CHF 6 billion to CHF 262 billion as of 31 March 2016 and remained below our short- to medium-term expectation of around CHF 325 billion.
➔ Refer to the “Balance sheet” section of this report for more
information
➔ Refer to the “Capital management” section of this report for
more information
Return on attributed equityAnnualized return on attributed equity (RoAE) for the first quarter of 2016 was 13.1% and 19.2% on an adjusted basis. RoAE for the prior quarter was 4.4%, and 12.2% on an adjusted basis.
➔ Refer to “Equity attribution and return on attributed equity” in
the “Capital management” section of this report for more
information
Operating income by business unit: 1Q16 vs 4Q15
Corporate Client SolutionsCorporate Client Solutions revenues decreased to CHF 474 million from CHF 650 million, due to lower revenues in Advisory, Financ-ing Solutions and Equity Capital Markets, partly offset by higher Debt Capital Markets revenues. In US dollar terms, revenues decreased 26%.
Advisory revenues decreased to CHF 132 million from a strong CHF 227 million in the prior quarter, reflecting lower revenues from merger and acquisition transactions, partly due to a fee pool decline of 18%.
Equity Capital Markets revenues decreased to CHF 154 million from CHF 197 million, with lower revenues from public offerings, as the fee pool decreased 34%, partly offset by higher revenues from private transactions.
Debt Capital Markets revenues increased to CHF 145 million from CHF 114 million, mainly due to an increase in investment grade revenues. Leveraged finance revenues were broadly unchanged, as revenues in the first quarter decreased, while the prior quarter included markdowns in our lending book.
Financing Solutions revenues decreased to CHF 62 million from CHF 109 million, primarily reflecting declines in the structured financing and real estate finance businesses, mainly due to lower client activity.
Risk Management revenues were negative CHF 18 million compared with positive CHF 2 million, largely reflecting tighten-ing credit spreads in the first quarter.
Investor Client ServicesInvestor Client Services revenues increased to CHF 1,403 million from CHF 1,121 million, reflecting higher client activity levels. In US dollar terms, revenues increased 27%.
EquitiesEquities revenues increased to CHF 920 million from CHF 733 mil-lion due to higher revenues in Derivatives and Cash.
Cash revenues increased to CHF 325 million from CHF 281 mil-lion, mainly due to seasonally higher client activity.
Derivatives revenues increased to CHF 240 million from CHF 95 million, reflecting seasonally higher client activity and improved trading revenues.
Financing Services revenues were CHF 348 million, broadly in line with the prior quarter.
Foreign Exchange, Rates and CreditForeign Exchange, Rates and Credit revenues increased to CHF 483 million from CHF 388 million.
Foreign Exchange revenues increased following higher client activity levels, particularly with regard to emerging market flows in Asia Pacific in the early part of the quarter.
Rates and Credit revenues also increased, mainly due to stron-ger trading revenues within Credit despite challenging markets.
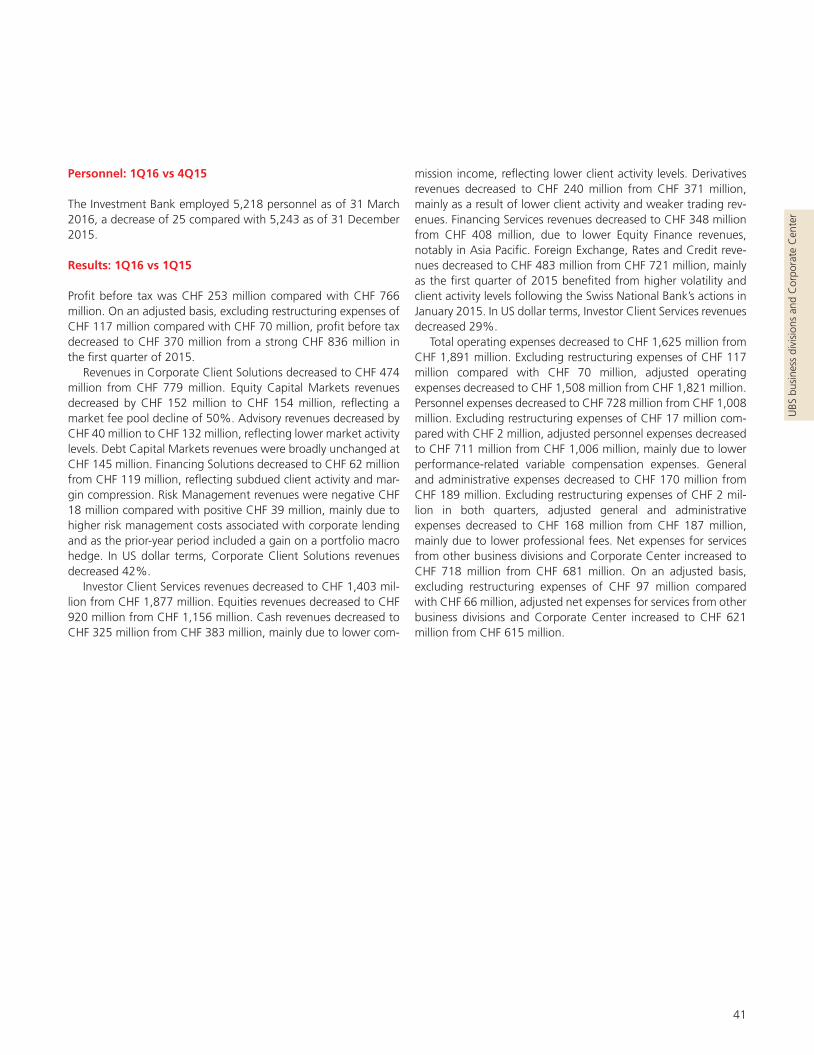
UBS
bus
ines
s di
visi
ons
and
Cor
pora
te C
ente
r
41
Personnel: 1Q16 vs 4Q15
The Investment Bank employed 5,218 personnel as of 31 March 2016, a decrease of 25 compared with 5,243 as of 31 December 2015.
Results: 1Q16 vs 1Q15
Profit before tax was CHF 253 million compared with CHF 766 million. On an adjusted basis, excluding restructuring expenses of CHF 117 million compared with CHF 70 million, profit before tax decreased to CHF 370 million from a strong CHF 836 million in the first quarter of 2015.
Revenues in Corporate Client Solutions decreased to CHF 474 million from CHF 779 million. Equity Capital Markets revenues decreased by CHF 152 million to CHF 154 million, reflecting a market fee pool decline of 50%. Advisory revenues decreased by CHF 40 million to CHF 132 million, reflecting lower market activity levels. Debt Capital Markets revenues were broadly unchanged at CHF 145 million. Financing Solutions decreased to CHF 62 million from CHF 119 million, reflecting subdued client activity and mar-gin compression. Risk Management revenues were negative CHF 18 million compared with positive CHF 39 million, mainly due to higher risk management costs associated with corporate lending and as the prior-year period included a gain on a portfolio macro hedge. In US dollar terms, Corporate Client Solutions revenues decreased 42%.
Investor Client Services revenues decreased to CHF 1,403 mil-lion from CHF 1,877 million. Equities revenues decreased to CHF 920 million from CHF 1,156 million. Cash revenues decreased to CHF 325 million from CHF 383 million, mainly due to lower com-
mission income, reflecting lower client activity levels. Derivatives revenues decreased to CHF 240 million from CHF 371 million, mainly as a result of lower client activity and weaker trading rev-enues. Financing Services revenues decreased to CHF 348 million from CHF 408 million, due to lower Equity Finance revenues, notably in Asia Pacific. Foreign Exchange, Rates and Credit reve-nues decreased to CHF 483 million from CHF 721 million, mainly as the first quarter of 2015 benefited from higher volatility and client activity levels following the Swiss National Bank’s actions in January 2015. In US dollar terms, Investor Client Services revenues decreased 29%.
Total operating expenses decreased to CHF 1,625 million from CHF 1,891 million. Excluding restructuring expenses of CHF 117 million compared with CHF 70 million, adjusted operating expenses decreased to CHF 1,508 million from CHF 1,821 million. Personnel expenses decreased to CHF 728 million from CHF 1,008 million. Excluding restructuring expenses of CHF 17 million com-pared with CHF 2 million, adjusted personnel expenses decreased to CHF 711 million from CHF 1,006 million, mainly due to lower performance-related variable compensation expenses. General and administrative expenses decreased to CHF 170 million from CHF 189 million. Excluding restructuring expenses of CHF 2 mil-lion in both quarters, adjusted general and administrative expenses decreased to CHF 168 million from CHF 187 million, mainly due to lower professional fees. Net expenses for services from other business divisions and Corporate Center increased to CHF 718 million from CHF 681 million. On an adjusted basis, excluding restructuring expenses of CHF 97 million compared with CHF 66 million, adjusted net expenses for services from other business divisions and Corporate Center increased to CHF 621 million from CHF 615 million.

Corporate Center
42
Corporate Center
Corporate Center1
As of or for the quarter ended % change from
CHF million, except where indicated 31.3.16 31.12.15 31.3.15 4Q15 1Q15
Total operating income (252) (183) 646 38
Personnel expenses 983 1,059 988 (7) (1)
General and administrative expenses 1,104 1,346 1,185 (18) (7)
Services (to) / from business divisions (2,043) (2,113) (1,882) (3) 9
Depreciation and impairment of property, equipment and software 232 248 207 (6) 12
Amortization and impairment of intangible assets 5 5 5 0 0
Total operating expenses2 282 546 504 (48) (44)
Operating profit / (loss) before tax (534) (729) 142 (27)
Adjusted results3
Total operating income as reported (252) (183) 646 38
of which: own credit4 35 226
of which: gains on sales of real estate 378
of which: net gains / (losses) related to the buyback of debt (257)
of which: net foreign currency translation gains / (losses) (123) 115
Total operating income (adjusted) (129) (76) 42 70
Total operating expenses as reported 282 546 504 (48) (44)
of which: personnel-related restructuring expenses 107 146 62
of which: non-personnel-related restructuring expenses 118 252 230
of which: restructuring expenses allocated from CC – Services (232) (362) (163)
Total operating expenses (adjusted) 288 510 374 (44) (23)
Operating profit / (loss) before tax as reported (534) (729) 142 (27)
Operating profit / (loss) before tax (adjusted) (417) (586) (332) (29) 26
Additional information
Average attributed equity (CHF billion)5 28.7 24.7 26.1 16 10
Total assets (CHF billion)6 380.8 354.5 407.2 7 (6)
Risk-weighted assets (fully applied, CHF billion)7 62.7 60.2 66.8 4 (6)
Leverage ratio denominator (fully applied, CHF billion)8 310.6 291.2 314.6 7 (1)
Personnel (full-time equivalents) 23,894 23,671 23,670 1 1
1 Comparative figures in this table may differ from those originally published in quarterly and annual reports due to adjustments following organizational changes, restatements due to the retrospective adoption of new accounting standards or changes in accounting policies, and events after the reporting period. 2 Refer to “Note 18 Changes in organization and disposals” in the “Consolidated financial statements” section of this report for information on restructuring expenses. 3 Adjusted results are non-GAAP financial measures as defined by SEC regulations. 4 Refer to the “Recent developments” section of this report for more information on own credit. 5 Refer to the “Capital management” section of this report for more information on the equity attribution framework. 6 Based on third-party view, i.e., without intercompany balances. 7 Based on the Basel III framework as applicable for Swiss systemically relevant banks (SRBs). Refer to the ”Capital management” section of this report for more information. 8 Calculated in accordance with Swiss SRB rules. Refer to the “Capital management” section of this report for more information. From 31 December 2015 onward, the leverage ratio denominator calculation is fully aligned with the Basel III rules. Figures for periods prior to 31 December 2015 are calculated in accordance with former Swiss SRB rules and are therefore not fully comparable.

UBS
bus
ines
s di
visi
ons
and
Cor
pora
te C
ente
r
43
Corporate Center – Services
Corporate Center – Services recorded a loss before tax of CHF 203 million in the first quarter of 2016 compared with a loss before tax of CHF 345 million in the prior quarter. The first quarter of 2016 included total operating expenses remaining in Corporate Center – Services after allocations to the business divisions and other Corporate Center units of CHF 148 million compared with CHF 291 million.
Corporate Center – Services1
As of or for the quarter ended % change from
CHF million, except where indicated 31.3.16 31.12.15 31.3.15 4Q15 1Q15Total operating income (55) (54) 374 2Personnel expenses 968 1,033 950 (6) 2General and administrative expenses 1,042 1,195 1,139 (13) (9)Depreciation and impairment of property, equipment and software 232 248 207 (6) 12 Amortization and impairment of intangible assets 5 5 5 0 0 Total operating expenses before allocations to BDs and other CC units 2,247 2,481 2,301 (9) (2)Services (to) / from business divisions and other CC units (2,099) (2,191) (1,964) (4) 7
of which: services to Wealth Management (562) (627) (508) (10) 11 of which: services to Wealth Management Americas (315) (311) (289) 1 9 of which: services to Personal & Corporate Banking (311) (298) (292) 4 7 of which: services to Asset Management (142) (139) (123) 2 15 of which: services to Investment Bank (691) (715) (667) (3) 4 of which: services to CC – Group ALM (29) (23) (14) 26 107 of which: services to CC – Non-core and Legacy Portfolio (56) (81) (80) (31) (30)
Total operating expenses2 148 291 337 (49) (56)Operating profit / (loss) before tax (203) (345) 37 (41)
Adjusted results3
Total operating income as reported (55) (54) 374 2 of which: gains on sales of real estate 378
Total operating income (adjusted) (55) (54) (4) 2Total operating expenses as reported before allocations 2,247 2,481 2,301 (9) (2)
of which: personnel-related restructuring expenses 107 144 62of which: non-personnel-related restructuring expenses 118 252 230
Total operating expenses (adjusted) before allocations 2,022 2,085 2,009 (3) 1Services (to) / from BDs and other CC units (2,099) (2,191) (1,964) (4) 7
of which: restructuring expenses allocated from CC – Services (233) (377) (173)Total operating expenses as reported after allocations 148 291 337 (49) (56)Total operating expenses (adjusted) after allocations 156 272 218 (43) (28)Operating profit / (loss) before tax as reported (203) (345) 37 (41)Operating profit / (loss) before tax (adjusted) (211) (326) (222) (35) (5)
Additional information Average attributed equity (CHF billion)4 22.2 18.8 19.4 18 14Total assets (CHF billion)5 22.2 22.6 19.5 (2) 14Risk-weighted assets (fully applied, CHF billion)6 24.0 23.6 23.2 2 3Leverage ratio denominator (fully applied, CHF billion)7 5.1 4.8 (1.0) 6Personnel (full-time equivalents) 23,695 23,470 23,424 1 11 Comparative figures in this table may differ from those originally published in quarterly and annual reports due to adjustments following organizational changes, restatements due to retrospective adoption of new accounting standards or changes in accounting policies, and events after the reporting period. 2 Refer to “Note 18 Changes in organization and disposals” in the “Consolidated financial statements” section of this report for information on restructuring expenses. 3 Adjusted results are non-GAAP financial measures as defined by SEC regulations. 4 Refer to the “Capital management” section of this report for more information on the equity attribution framework. 5 Based on third-party view, i.e., without intercompany balances. 6 Based on the Basel III framework as applicable for Swiss systemically relevant banks (SRBs). Refer to the ”Cap-ital management” section of this report for more information. 7 Calculated in accordance with Swiss SRB rules. Refer to the “Capital management” section of this report for more information. From 31 December 2015 onward, the leverage ratio denominator calculation is fully aligned with the Basel III rules. Figures for periods prior to 31 December 2015 are calculated in accordance with former Swiss SRB rules and are therefore not fully comparable.

Corporate Center
44
Results: 1Q16 vs 4Q15
Operating incomeOperating income was negative CHF 55 million in the first quarter of 2016 compared with negative CHF 54 million and mainly related to funding costs.
Operating expenses
Operating expenses before service allocations to business divisions and other Corporate Center unitsOn a gross basis before allocations to the business divisions and other Corporate Center units, total operating expenses decreased by CHF 234 million to CHF 2,247 million. Excluding restructuring expenses of CHF 225 million compared with CHF 396 million, adjusted operating expenses before allocations decreased by CHF 63 million to CHF 2,022 million.
Personnel expenses decreased by CHF 65 million to CHF 968 million. On an adjusted basis, excluding net restructuring expenses of CHF 107 million compared with CHF 144 million, personnel expenses decreased by CHF 28 million, mainly related to lower expenses for variable compensation. General and administrative expenses decreased by CHF 153 million to CHF 1,042 million. Excluding net restructuring expenses of CHF 118 million com-pared with CHF 252 million, adjusted general and administrative expenses decreased by CHF 19 million, primarily reflecting lower professional fees.
Services to / from business divisions and other Corporate Center unitsCorporate Center – Services allocated expenses of CHF 2,099 mil-lion to the business divisions and other Corporate Center units compared with CHF 2,191 million.
Excluding allocated restructuring expenses of CHF 233 million compared with CHF 377 million, net allocated expenses for ser-vices to business divisions and other Corporate Center units were CHF 1,866 million compared with CHF 1,814 million.
Each year, as part of the annual business planning cycle, cost allocations for services are agreed at fixed amounts, or at variable amounts based on fixed formulas, between Corporate Center – Services and the business divisions and other Corporate Center units, depending on capital and service consumption levels as well as the nature of the service performed. However, as actual costs incurred may differ from those expected, Corporate Center – Ser-vices may recognize significant under- or over-allocations depend-ing on various factors, including Corporate Center – Services’ abil-ity to manage the delivery of its services and achieve cost savings.
The increase in allocated expenses in the first quarter of 2016 compared with the fourth quarter of 2015 arose largely as the business divisions and other Corporate Center units were allo-cated a credit in the fourth quarter of 2015 to reflect the effect of aligning total 2015 cost allocations with the amounts agreed as part of the annual business planning cycle.
Operating expenses after service allocations to / from business divisions and other Corporate Center unitsIn addition to aforementioned under- or over-allocations arising from differences between actual costs incurred and those expected, Corporate Center – Services retains costs related to Group governance functions and other corporate activities, cer-tain strategic and regulatory projects and certain retained restruc-turing expenses. Total operating expenses remaining in Corporate Center – Services after allocations decreased to CHF 148 million from CHF 291 million, largely as the fourth quarter of 2015 included retained costs due to the effect of under-allocations aris-ing from differences between actual 2015 costs incurred and cost allocations agreed during the annual business planning cycle.
Personnel: 1Q16 vs 4Q15
As of 31 March 2016, Corporate Center – Services employed 23,695 personnel compared with 23,470 as of 31 December 2015, mainly reflecting increases in Group Technology, Risk Con-trol and in our nearshoring and offshoring locations, partly offset by decreases in Group Operations.
Results: 1Q16 vs 1Q15
In the first quarter of 2016, Corporate Center – Services recorded an operating loss before tax of CHF 203 million compared with an operating profit before tax of CHF 37 million in the first quarter of 2015.
Total operating income was negative CHF 55 million compared with positive CHF 374 million, mainly as the first quarter of 2015 included gains on sales of real estate of CHF 378 million. In addi-tion, income from the investment of the Group’s equity, allocated from Corporate Center – Group ALM, decreased.
On a gross basis before allocations, total operating expenses decreased by CHF 54 million to CHF 2,247 million. Excluding restructuring expenses of CHF 225 million compared with CHF 292 million, adjusted operating expenses before allocations increased by CHF 13 million to CHF 2,022 million, mainly reflect-ing an increase in depreciation expenses for internally generated capitalized software.

UBS
bus
ines
s di
visi
ons
and
Cor
pora
te C
ente
r
45
Corporate Center – Group Asset and Liability Management
Corporate Center – Group Asset and Liability Management recorded a loss before tax of CHF 148 million in the first quarter of 2016 compared with a loss before tax of CHF 56 million in the prior quarter.
Corporate Center – Group ALM1
As of or for the quarter ended % change from
CHF million, except where indicated 31.3.16 31.12.15 31.3.15 4Q15 1Q15
Business division-aligned risk management net income 218 249 241 (12) (10)
Capital investment and issuance net income 33 39 109 (15) (70)
Group structural risk management net income (101) (174) (110) (42) (8)
Total risk management net income before allocations 151 114 239 32 (37)
Allocations to business divisions and other CC units (168) (189) (289) (11) (42)
of which: Wealth Management (106) (118) (131) (10) (19)
of which: Wealth Management Americas (21) (27) (23) (22) (9)
of which: Personal & Corporate Banking (94) (111) (122) (15) (23)
of which: Asset Management (3) (3) (5) 0 (40)
of which: Investment Bank 59 69 34 (14) 74
of which: CC – Services (21) (22) (54) (5) (61)
of which: CC – Non-core and Legacy Portfolio 18 23 12 (22) 50
Total risk management net income after allocations (17) (75) (50) (77) (66)
Accounting asymmetries related to economic hedges (89) 102 (44) 102
Hedge accounting ineffectiveness2 39 (21) 166 (77)
Other 40 44 14 (9) 186
Total operating income (adjusted)3 (27) 48 87
Net foreign currency translation gains / (losses) (123) 115
Net gains / (losses) related to the buyback of debt (257)
Own credit4 35 226
Total operating income as reported (150) (59) 313 154
Personnel expenses 8 7 8 14 0
General and administrative expenses 3 9 4 (67) (25)
Depreciation and impairment of property, equipment and software 0 0 0
Amortization and impairment of intangible assets 0 0 0
Services (to) / from business divisions and other CC units (13) (20) (15) (35) (13)
Total operating expenses5 (2) (3) (4) (33) (50)
Operating profit / (loss) before tax as reported (148) (56) 317 164
Operating profit / (loss) before tax (adjusted)3 (25) 51 91
Additional information
Average attributed equity (CHF billion)6 4.2 3.2 3.4 31 24
Total assets (CHF billion)7 258.8 237.5 227.6 9 14
Risk-weighted assets (fully applied, CHF billion)8 7.1 6.0 7.9 18 (10)
Leverage ratio denominator (fully applied, CHF billion)9 264.5 240.2 231.4 10 14
Personnel (full-time equivalents) 127 125 122 2 4
1 Comparative figures in this table may differ from those originally published in quarterly and annual reports due to adjustments following organizational changes, restatements due to retrospective adoption of new accounting standards or changes in accounting policies, and events after the reporting period. 2 Does not include ineffectiveness of hedges of net investments in foreign operations. 3 Adjusted results are non-GAAP financial measures as defined by SEC regulations. 4 Refer to the “Recent developments” section of this report for more information on own credit. 5 Refer to “Note 18 Changes in organization and disposals” in the “Consolidated financial statements” section of this report for information on restructuring expenses. 6 Refer to the “Capital management” section of this report for more information on the equity attribution frame-work. 7 Based on third-party view, i.e., without intercompany balances. 8 Based on the Basel III framework as applicable for Swiss systemically relevant banks (SRBs). Refer to the ”Capital management” section of this report for more information. 9 Calculated in accordance with Swiss SRB rules. Refer to the “Capital management” section of this report for more information. From 31 December 2015 onward, the leverage ratio denominator calculation is fully aligned with the Basel III rules. Figures for periods prior to 31 December 2015 are calculated in accordance with former Swiss SRB rules and are therefore not fully comparable.

Corporate Center
46
Description of business activities
Group Asset and Liability Management (Group ALM) manages the structural risks of our balance sheet, including interest rate risk in the banking book, currency and collateral risk, as well as the risks associated with the Group’s liquidity and funding portfolios. Group ALM also seeks to optimize the Group’s financial performance by better matching assets and liabilities within the context of the Group’s liquidity, funding and capital targets. Group ALM serves all business divisions and other Corporate Center units, and its risk management is fully integrated into the Group’s risk governance framework. To further enhance the transparency of Group ALM activities, beginning in the first quarter of 2016, income from Group ALM’s activities is disclosed for the three main risk management areas: (i) business division-aligned risk management, (ii) capital investment and issuance and (iii) Group structural risk management.
Business division-aligned risk management activities performed on behalf of business divisions and other Corporate Center units include managing the interest rate risk in the banking book on behalf of Wealth Management and Personal & Corporate Banking and high-quality liquid asset (HQLA) portfolios on behalf of spe-cific business divisions. Net income generated by these activities is fully allocated to the associated business divisions and Corporate Center units.
Capital investment and issuance activities consist of managing the Group’s equity and capital instruments, including instruments that will contribute to our total loss-absorbing capacity (TLAC). Revenues from investing the Group’s equity and the incremental expenses of issuing capital and TLAC instruments at the UBS Group AG level (the holding company for the UBS Group) relative to issuing senior debt out of operating subsidiaries are fully allo-cated to the business divisions and other Corporate Center units based on their attributed portion of the Group’s equity.
Group structural risk management activities are performed to meet overall Group-wide risk management objectives. They include managing the Group’s HQLA and long-term debt portfo-lios. The net positive or negative income generated is allocated to
the business divisions and other Corporate Center units based on their consumption of the underlying risks. This consumption is determined by various liquidity and funding models and, to reduce volatility, is allocated using stable, internal benchmark rates rather than actual income earned by Group ALM. Net posi-tive or negative income not arising as a result of business division consumption is retained by Group ALM.
As part of the Group structural risk management activities, Group ALM enters into various derivative hedges to manage the economic risk of the different portfolios. Such economic hedges can increase volatility in the income statement, as hedges and the underlying assets or liabilities can be subject to different account-ing treatment, resulting in the impact from interest rate market movements being recognized in different periods. However, there should be no difference between the accounting results recog-nized through the income statement and the economics of the hedged relationships when measured over their lifetime. In any given period, gains or losses from these economic hedges are retained by Group ALM and reported separately as Accounting asymmetries related to economic hedges.
Similarly, as part of business division-aligned risk management and capital investment and issuance activities, Group ALM enters into interest rate risk hedges that qualify for cash flow and fair value hedge accounting treatment. The net income from ineffec-tiveness of these hedges is retained by Group ALM and reported separately as Hedge accounting ineffectiveness, with the excep-tion of net income from ineffectiveness related to the fair value hedge of portfolio interest rate risk related to mortgage loans, which is recorded directly in Wealth Management and Personal & Corporate Banking.
Group ALM also retains certain other net income, which includes interest income on behalf of non-controlling interests, net foreign currency translation gains and losses related to the disposal or partial disposal of foreign branches and subsidiaries, net gains and losses related to the buyback of debt in tender offers and, until the end of 2015, own credit gains and losses on financial liabilities designated at fair value.

UBS
bus
ines
s di
visi
ons
and
Cor
pora
te C
ente
r
47
Results: 1Q16 vs 4Q15
Operating incomeTotal operating income decreased to negative CHF 150 million in the first quarter of 2016 from negative CHF 59 million in the fourth quarter of 2015.
Excluding a net foreign currency translation loss of CHF 123 million, which was primarily related to the closure of a foreign branch of UBS AG, compared with a gain of CHF 115 million in the prior quarter, and a loss of CHF 257 million related to the buyback of debt in a tender offer as well as an own credit gain of CHF 35 million in the prior quarter, adjusted total operating income retained by Group ALM was negative CHF 27 million com-pared with positive CHF 48 million. The decrease in adjusted oper-ating income was primarily due to accounting asymmetries related to economic hedges, largely offset by hedge accounting ineffec-tiveness gains and improved risk management net income.
➔ Refer to the “Recent developments” section of this report for
more information on own credit
Business division-aligned risk management net incomeNet income from business division-aligned risk management activities was CHF 218 million compared with CHF 249 million, mainly reflecting reduced interest rate risk management revenues in the banking book for Wealth Management and Personal & Cor-porate Banking. This reduction was mainly due to seasonally lower penalty fees received from clients from the early termina-tion of loans and lower interest income from interest rate swaps previously designated in hedge accounting relationships.
Capital investment and issuance net incomeNet income from capital investment and issuance activities was CHF 33 million compared with CHF 39 million, mainly due to higher fees paid related to the issuance of new capital and TLAC instruments.
Group structural risk management net incomeNet income from Group structural risk management activities was negative CHF 101 million compared with negative CHF 174 mil-lion. This reflects an improvement of CHF 66 million from the management of the Group’s HQLA, mainly due to wider spreads between certain HQLA and internal funding liabilities. Further-more, negative revenues in our long-term debt portfolio reduced to CHF 221 million from CHF 228 million.
Allocations to business divisions and other Corporate Center unitsCombined allocations from risk management activities to business divisions and other Corporate Center units were CHF 168 million compared with CHF 189 million, primarily reflecting lower alloca-tions to Wealth Management and Personal & Corporate Banking following the aforementioned reduction in interest rate risk man-agement revenues.
Total risk management net income after allocationsGroup ALM retained negative CHF 17 million from its risk man-agement activities after allocations compared with negative CHF 75 million in the prior quarter due to Group structural risk man-agement activities.
Retained income in Group structural risk management can vary significantly quarter on quarter and is mainly the net result of costs from buffers that are maintained by Group ALM at levels above the total consumption of the business divisions and the revenues generated by Group ALM from the management of the Group’s HQLA portfolio relative to the benchmark rates used to allocate the costs.
Accounting asymmetries related to economic hedges Net income retained by Group ALM due to accounting asymme-tries related to economic hedges was negative CHF 89 million compared with positive CHF 102 million. This change primarily related to HQLA classified as available for sale. On a risk manage-ment basis, unrealized gains and losses on these assets are initially recognized in the income statement, together with changes in fair value of interest rate swaps that economically hedge these HQLA. However, under IFRS, these unrealized gains and losses are required to be recognized in Other comprehensive income, giving rise to an asymmetry as to timing for the accounting recognition. This asymmetry resulted in a loss of CHF 109 million in the first quarter compared with a gain of CHF 173 million in the prior quarter.
Hedge accounting ineffectivenessNet income related to hedge accounting ineffectiveness on hedge-accounted derivatives in our banking book was positive CHF 39 million compared with negative CHF 21 million. This inef-fectiveness primarily arises from changes in the spread between LIBOR and the overnight index swap rate.
OtherOther net income was CHF 40 million compared with CHF 44 mil-lion and mainly related to interest income retained by Group ALM on behalf of non-controlling interests.

Corporate Center
48
Balance sheet assets Balance sheet assets increased by CHF 21 billion to CHF 259 bil-lion, mainly reflecting an increase in the Group’s HQLA. During the first quarter of 2016, we reduced our financial assets available for sale within our HQLA portfolio and increased our holdings of financial assets designated at fair value and financial assets held to maturity in order to reduce the accounting asymmetries that result from unrealized gains and losses on available-for-sale assets.
➔ Refer to the “Balance sheet” section of this report for more
information
Risk-weighted assetsFully applied risk-weighted assets (RWA) increased by CHF 1 bil-lion to CHF 7 billion as of 31 March 2016.
➔ Refer to the “Capital management” section of this report for
more information
Leverage ratio denominatorThe Swiss SRB leverage ratio denominator increased to CHF 264 billion from CHF 240 billion, mainly reflecting the aforementioned increase in the Group’s HQLA.
➔ Refer to the “Capital management” section of this report for
more information
Results: 1Q16 vs 1Q15
Group ALM recorded a loss of CHF 148 million in the first quarter of 2016 compared with a profit of CHF 317 million during the same period in 2015. Excluding a net foreign currency translation loss of CHF 123 million in the first quarter of 2016 and an own credit gain of CHF 226 million in the first quarter of 2015, adjusted total operating income was negative CHF 27 million compared with positive CHF 87 million.
Net income from risk management activities before allocations decreased by CHF 88 million to CHF 151 million. Revenues related to business division-aligned risk management decreased by CHF 23 million to CHF 218 million, mainly due to a decrease in reve-nues generated in the banking book for Wealth Management and Personal & Corporate Banking.
Net income from capital investment and issuance activities decreased CHF 76 million to CHF 33 million due to lower revenues from the investment of the Group’s equity and higher expenses related to the issuance of capital and TLAC instruments.
Net income from Group structural risk management activities improved to negative CHF 101 million compared with negative CHF 110 million, mainly due to increased revenues from the Group’s HQLA.
Revenue allocations to business divisions and other Corporate Center units decreased by CHF 121 million, mainly due to the aforementioned reductions in capital investment and issuance net income and business division-aligned risk management net income. Net income after allocations from Group structural risk management improved by CHF 33 million to negative CHF 17 mil-lion as the aforementioned improvement in revenues from the Group’s HQLA was largely retained by Group ALM.
In the first quarter of 2016, Group ALM recorded a loss of CHF 89 million from accounting asymmetries related to eco-nomic hedges and a gain of CHF 39 million from hedge account-ing ineffectiveness compared with a loss of CHF 44 million and a gain of CHF 166 million, respectively. Net income from these two items reflects movements in the interest rate markets in the respective quarters.
Other net income was CHF 40 million compared with CHF 14 million and mainly related to interest income retained by Group ALM on behalf of non-controlling interests.

UBS
bus
ines
s di
visi
ons
and
Cor
pora
te C
ente
r
49
Corporate Center – Non-core and Legacy Portfolio
Corporate Center – Non-core and Legacy Portfolio recorded a loss before tax of CHF 183 million in the first quarter of 2016 compared with a loss of CHF 329 million in the prior quarter, largely driven by a decrease in operating expenses of CHF 123 million.
Corporate Center – Non-core and Legacy Portfolio1
As of or for the quarter ended % change from
CHF million, except where indicated 31.3.16 31.12.15 31.3.15 4Q15 1Q15
Income (44) (72) (43) (39) 2
Credit loss (expense) / recovery2 (3) 2 2
Total operating income (47) (71) (41) (34) 15
Personnel expenses 7 19 31 (63) (77)
General and administrative expenses 60 142 42 (58) 43
Services (to) / from business divisions and other CC units 69 97 97 (29) (29)
of which: services from CC – Services 56 81 80 (31) (30)
Depreciation and impairment of property, equipment and software 0 0 0
Amortization and impairment of intangible assets 0 0 0
Total operating expenses3 135 258 171 (48) (21)
Operating profit / (loss) before tax (183) (329) (212) (44) (14)
Adjusted results4
Total operating income as reported (47) (71) (41) (34) 15
Total operating income (adjusted) (47) (71) (41) (34) 15
Total operating expenses as reported 135 258 171 (48) (21)
of which: personnel-related restructuring expenses 1 1 1
of which: non-personnel-related restructuring expenses 0 0 0
of which: restructuring expenses allocated from CC – Services 1 15 11
Total operating expenses (adjusted) 133 241 160 (45) (17)
Operating profit / (loss) before tax as reported (183) (329) (212) (44) (14)
Operating profit / (loss) before tax (adjusted) (181) (312) (201) (42) (10)
Additional information
Average attributed equity (CHF billion)5 2.3 2.7 3.3 (15) (30)
Total assets (CHF billion)6 99.8 94.4 160.1 6 (38)
Risk-weighted assets (fully applied, CHF billion)7 31.6 30.7 35.7 3 (11)
Leverage ratio denominator (fully applied, CHF billion)8 41.1 46.2 84.2 (11) (51)
Personnel (full-time equivalents) 73 77 125 (5) (42)
1 Comparative figures in this table may differ from those originally published in quarterly and annual reports due to adjustments following organizational changes, restatements due to retrospective adoption of new accounting standards or changes in accounting policies, and events after the reporting period. 2 Includes credit loss (expense) / recovery on reclassified and acquired securities. 3 Refer to “Note 18 Changes in orga-nization and disposals” in the “Consolidated financial statements” section of this report for information on restructuring expenses. 4 Adjusted results are non-GAAP financial measures as defined by SEC regula-tions. 5 Refer to the “Capital management” section of this report for more information on the equity attribution framework. 6 Based on third-party view, i.e., without intercompany balances. 7 Based on the Basel III framework as applicable for Swiss systemically relevant banks (SRBs). Refer to the ”Capital management” section of this report for more information. 8 Calculated in accordance with Swiss SRB rules. Refer to the “Capital management” section of this report for more information. From 31 December 2015 onward, the leverage ratio denominator calculation is fully aligned with the Basel III rules. Figures for periods prior to 31 December 2015 are calculated in accordance with former Swiss SRB rules and are therefore not fully comparable.

Corporate Center
50
Results: 1Q16 vs 4Q15
Operating incomeIncome was negative CHF 44 million compared with negative CHF 72 million, mainly related to a decrease in losses from novation and unwind activities. In addition, the fourth quarter of 2015 included gains from certain equity positions and from the settle-ment of litigation claims.
Operating expensesTotal operating expenses decreased to CHF 135 million from CHF 258 million, predominantly as net expenses for provisions for liti-gation, regulatory and similar matters decreased by CHF 28 mil-lion to CHF 23 million and as the prior quarter included an expense of CHF 50 million for the annual UK bank levy. In addition, net expenses for services from business divisions and other Corporate Center units decreased by CHF 28 million.
Balance sheet assetsBalance sheet assets increased to CHF 100 billion from CHF 94 bil-lion. Positive replacement values (PRV) increased by CHF 5 billion, mainly related to our over-the-counter (OTC) rates derivative expo-sures, where the movement was driven by interest rate movements, partly offset by trade terminations and maturities. Within our credit portfolio, PRV were largely unchanged at approximately CHF 1 bil-lion. Collateral delivered against OTC derivatives increased by CHF 1 billion. Funded assets and PRV classified as Level 3 in the fair value hierarchy totaled CHF 2 billion as of 31 March 2016.
Risk-weighted assetsRisk-weighted assets (RWA) increased by CHF 1 billion to CHF 32 billion.
➔ Refer to the “Capital management” section of this report for
more information
Leverage ratio denominatorThe Swiss SRB leverage ratio denominator decreased to CHF 41 billion from CHF 46 billion, mainly due to lower net OTC deriva-tive exposures resulting from incremental netting and collateral mitigation benefits.
➔ Refer to the “Capital management” section of this report for
more information
Results: 1Q16 vs 1Q15
Corporate Center – Non-core and Legacy Portfolio recorded a loss before tax of CHF 183 million in the first quarter of 2016 com-pared with a loss of CHF 212 million in the first quarter of 2015. Income was negative CHF 44 million compared with negative CHF 43 million. Operating expenses decreased by CHF 36 million to CHF 135 million, mainly as net expenses for services from business divisions and other Corporate Center units decreased by CHF 28 million and personnel expenses decreased by CHF 24 million. This was partly offset by net expenses for provisions for litigation, reg-ulatory and similar matters of CHF 23 million compared with CHF 13 million.

UBS
bus
ines
s di
visi
ons
and
Cor
pora
te C
ente
r
51
Composition of Non-core and Legacy Portfolio
An overview of the composition of Non-core and Legacy Portfolio is presented in the table below.
The groupings of positions by category and the order in which these are listed are not necessarily representative of the magni-tude of the risks associated with them, nor do the metrics shown
in the tables necessarily represent the risk measures used to man-age and control these positions. The funded assets and PRV mea-sures presented are intended to provide additional transparency regarding progress in the execution of our strategy to exit these positions.
CHF billion
Exposure category Description RWA1 Funded assets2 PRV3 LRD4
31.3.16 31.12.15 31.3.16 31.12.15 31.3.16 31.12.15 31.3.16 31.12.15
Rates (linear) Consists of linear OTC products (primarily vanilla interest rate, inflation, basis and cross-currency swaps for all major currencies and some emerging markets) and non-linear OTC products (vanilla and structured options). More than 95% of gross PRV is collateralized. Uncollateralized exposures are well diversified across counterparties, of which the majority is rated investment grade. Approximately 50% of gross PRV is due to mature by end-2021.
3.4 3.6 0.6 0.9 53.4 48.8 14.5 17.8
Rates (non-linear)
0.9 0.7 0.1 0.1 21.5 20.5 2.7 2.8
Credit Consists primarily of a residual structured credit book that is largely hedged against market risk. The remaining counterparty risk is fully collateralized and diversified across multiple names. The residual structured credit book is expected to materially run off by end-2018. Also includes corporate lending and residual distressed credit positions, with a similar expected run-off profile.
0.5 0.5 0.3 0.4 1.2 1.4 6.7 7.0
Securitizations Consists primarily of a portfolio of CDS positions referencing ABS assets with related cash and synthetic hedges to mitigate the impact of directional movements. The majority of the remaining positions are expected to run off by end-2018.
1.3 1.5 1.0 1.2 0.4 0.5 1.6 1.9
Auction preferred stock (APS)and auction rate securities (ARSs)
Portfolio of long-dated APS and municipal ARSs. All APS were rated A or above and all ARS exposures were rated Ba1 or above as of 31 March 2016.
0.8 0.9 2.6 2.8 – – 2.6 2.8
Muni swaps and options Swaps and options with US state and local governments. Over 95% of the PRV is with counterparties that were rated investment grade as of 31 March 2016.
0.5 0.5 – – 3.4 3.4 2.4 2.5
Other Exposures to CVA and related hedging activity, as well as a diverse portfolio of smaller positions. 2.6 1.8 1.8 1.5 3.7 4.0 10.6 11.3
Operational risk Operational risk RWA allocated to Non-core and Legacy Portfolio. 21.5 21.1 – – – – – –
Total 31.6 30.7 6.4 7.0 83.5 78.5 41.1 46.2
1 Fully applied and phase-in RWA. 2 Funded assets are defined as total balance sheet assets less positive replacement values (PRV) and collateral delivered against over-the-counter (OTC) derivatives (CHF 9.9 billion as of 31 March 2016 and CHF 8.9 billion as of 31 December 2015). 3 Positive replacement values (gross exposure excluding the impact of any counterparty netting). 4 Swiss SRB leverage ratio denominator.


Risk, treasury and capital managementManagement report

54
Table of contents
55 Risk management and control55 Key developments56 Overview of risks arising from our business activities57 Credit risk 63 Market risk68 Country risk70 Operational risk
71 Balance sheet71 Assets72 Liabilities73 Equity73 Intra-quarter balances
74 Liquidity and funding management74 Liquidity76 Funding
78 Capital management78 Regulatory framework78 Capital requirements81 Swiss SRB capital information81 Capital ratios82 Eligible capital85 Additional capital information86 Differences between Swiss SRB and BIS capital87 Risk-weighted assets88 Credit risk88 Non-counterparty-related risk88 Market risk88 Operational risk92 Leverage ratio framework94 Leverage ratio information94 Swiss SRB leverage ratio97 BIS leverage ratio98 Equity attribution and return on attributed equity
99 UBS shares99 UBS Group AG share information

Risk
, tre
asur
y an
d ca
pita
l man
agem
ent
55
Risk management and control
Key developments
We saw increased levels of market volatility during the first quar-ter of 2016, arising from uncertainties regarding macroeconomic developments in China and emerging markets more broadly, as well as from the weakening of commodity prices, particularly oil. Nevertheless, net credit loss expenses remained low at CHF 3 mil-lion and credit risk exposures for the Group were broadly unchanged. In addition to the ongoing global macroeconomic uncertainties, we are also closely monitoring developments con-nected to the UK referendum on EU membership, which we antic-ipate may give rise to continued uncertainty in the second quarter of 2016.
Although oil prices increased from their low point in January, exposures to certain counterparties in the oil and gas sector con-tinued to carry more risk than in prior periods. As of 31 March 2016, our total funded and unfunded net banking products expo-sure to the oil and gas sector, recorded within the Investment Bank, was CHF 5.5 billion, CHF 0.6 billion lower than on 31 Decem-ber 2015, with CHF 0.4 billion of the reduction in the exploration and production and the services and supply sub-sectors. About half of the CHF 5.5 billion exposure was related to the integrated and mid-stream segments, which are generally expected to be less affected by low oil and gas prices. Exposures potentially vulnera-ble to low energy prices are closely monitored. Additional specific and collective allowances of CHF 17 million were recognized against these oil and gas exposures in the first quarter of 2016 in the Investment Bank, bringing the total allowances against these exposures to CHF 56 million. Given the depressed energy prices, credit loss expenses for this sub-segment of our portfolio may increase in future periods. Using an assumed average oil price of
USD 25 per barrel through the end of 2017, we estimate that we could incur an additional credit loss expense of approximately CHF 100 million, exclusive of any gains from our risk management activities. In arriving at this estimate we have considered, among other things, the estimated effect of the decline in the value of oil and gas reserves pledged in support of reserve-based loans in the exploration and production segment, assumed higher default rates and lower recoveries for the oilfield services segment and made other significant assumptions. We have not taken into account any broader macroeconomic effects of a prolonged period of depressed energy prices, nor have we considered indi-rect effects. All of these factors may result in actual losses being materially higher or lower than this estimate, and there can be no certainty over the timing of recognition of actual losses.
Loan underwriting activity in the Investment Bank was muted in the first quarter of 2016. Following the build-up of exposures in the fourth quarter of 2015, there remain a small number of sub-investment grade deals which have been retained beyond their original targeted distribution date, and which, under the current market conditions, we expect to largely exit during the second quarter. These exposures are classified as held for trading, with fair values reflecting the market conditions at the end of the quarter.
We continue to manage market risks at low levels, with volatil-ity in our market risk profile and value-at-risk largely driven by positions arising from client facilitation, as well as option expiries.
To sustain the operating effectiveness of our enhanced opera-tional risk framework, we continue to focus on our key regulatory commitments and to strengthen and embed our core capabilities with an ongoing emphasis on cyber defenses, culture and con-duct, and improvements to our surveillance systems.

Risk management and control
56
Overview of risks arising from our business activities
The tables below present the key drivers of tangible attributed equity by business division and Corporate Center unit, which are risk-weighted assets (RWA), Swiss SRB leverage ratio denomina-tor (LRD) and risk-based capital (RBC). In addition, we show the average tangible attributed equity, total assets and adjusted operating profit before tax. Along with the description of key risks by business division and Corporate Center unit presented in our Annual Report 2015, the table below provides an overview of how the activities in our business divisions and Corporate Center units are reflected in our risk measures, along with their respec-tive performance.
The “Risk measures and performance” tables are followed by sections providing an update for the first quarter of 2016 on developments in credit risk (comprising banking products and traded products), market risk (including interest rate risk in the banking book), country risk and operational risk.
An update on the development of capital, RWA, LRD and attributed equity during the quarter is provided in the “Capital management” section of this report.
The overall level of RBC was broadly unchanged at CHF 31 bil-lion for UBS Group as of 31 March 2016.
Risk measures and performance
31.3.16
CHF billion, as of or for the quarter ended Wealth
Management
WealthManagement
Americas
Personal &Corporate
BankingAsset
ManagementInvestment
BankCC –
Services
CC – Group
ALM
CC – Non-core
and Legacy Portfolio Group
Risk-weighted assets (fully applied)1 26.1 22.1 36.9 2.4 63.4 24.0 7.1 31.6 213.6
of which: credit risk 13.1 8.4 35.2 1.5 37.6 1.4 5.7 6.9 109.8
of which: market risk 0.0 1.0 0.0 0.0 8.7 (2.8)2 1.3 3.2 11.4
of which: operational risk 12.9 12.7 1.6 0.9 17.1 9.7 0.1 21.5 76.5
Leverage ratio denominator (fully applied)3 117.4 60.9 152.2 2.5 262.2 5.1 264.5 41.1 905.8
Risk-based capital4 1.4 1.2 2.4 0.2 5.7 13.4 3.2 3.1 30.6
Average tangible attributed equity5 2.8 1.9 4.1 0.2 7.7 18.4 4.2 2.3 41.6
Total assets 118.2 59.0 140.2 12.1 256.6 22.2 258.8 99.8 966.9
Operating profit / (loss) before tax (adjusted)6 0.6 0.2 0.4 0.1 0.4 (0.2) 0.0 (0.2) 1.4
31.12.15
CHF billion, as of or for the quarter ended Wealth
Management
WealthManagement
Americas
Personal &Corporate
BankingAsset
ManagementInvestment
BankCC –
Services
CC – Group
ALM
CC – Non-core
and Legacy Portfolio Group
Risk-weighted assets (fully applied)1 25.3 21.9 34.6 2.6 62.9 23.6 6.0 30.7 207.5
of which: credit risk 12.6 8.5 32.9 1.7 35.5 1.3 5.0 6.9 104.4
of which: market risk 0.0 1.0 0.0 0.0 10.5 (2.9)2 0.9 2.6 12.1
of which: operational risk 12.6 12.4 1.6 0.9 16.8 9.5 0.1 21.1 75.1
Leverage ratio denominator (fully applied)3 119.0 62.9 153.8 2.7 268.0 4.8 240.2 46.2 897.6
Risk-based capital4 1.0 1.3 2.9 0.3 6.1 12.6 3.6 2.7 30.3
Average tangible attributed equity5 2.7 1.9 3.9 0.4 7.2 15.1 3.2 2.7 37.1
Total assets 119.9 61.0 141.2 12.9 253.5 22.6 237.5 94.4 942.8
Operating profit / (loss) before tax (adjusted)6 0.5 0.1 0.4 0.2 0.2 (0.3) 0.1 (0.3) 0.8
1 Based on the Basel III framework as applicable for Swiss systemically relevant banks (SRBs). Refer to the “Capital management” section of this report for more information. 2 Negative market risk numbers are due to the diversification effect allocated to CC – Services. 3 Calculated in accordance with Swiss SRB rules. Refer to the “Capital management” section of this report for more information. 4 Refer to “Statistical measures” in the “Risk management and control” section of our Annual Report 2015 for more information on risk-based capital. 5 Refer to the “Capital management” section of this report for more information on our equity attribu-tion framework. 6 Adjusted results are non-GAAP financial measures as defined by SEC regulations.

Risk
, tre
asur
y an
d ca
pita
l man
agem
ent
57
Credit risk
Except where stated otherwise, the exposures detailed in this sec-tion are based on our internal management view of credit risk, which differs in certain respects from the measurement require-ments of IFRS.
Banking products Gross banking products exposures increased by CHF 7 billion to CHF 492 billion over the quarter, mainly driven by an increase in balances with central banks in Corporate Center – Group Asset and Liability Management (Group ALM), partly offset by a reduc-tion in loan commitments in the Investment Bank.
Gross banking products exposures within Wealth Management decreased by CHF 2 billion to CHF 109 billion over the quarter.
In Wealth Management Americas, gross banking products exposure decreased by CHF 2 billion to CHF 50 billion as of 31 March 2016, due to the strengthening of the Swiss franc against the US dollar. In US dollars, gross banking products expo-sure increased slightly.
Our mortgage loan portfolio secured by residential and com-mercial real estate in Switzerland remained our largest loan port-folio. These mortgage loans, totaling CHF 138 billion as of 31 March 2016, mainly originated in Personal & Corporate Bank-ing, but also included mortgage loans originated by Wealth Man-agement. As of 31 March 2016, CHF 124 billion related to resi-dential properties that the borrower was either occupying or renting out, and where there was full recourse to the borrower. Of this CHF 124 billion, approximately CHF 89 billion related to prop-erties occupied by the borrower, with an average loan-to-value (LTV) ratio of 52% as of 31 March 2016 compared with 51% as
of 31 December 2015. The average LTV for newly originated loans during the first quarter of 2016 for this portion increased to 62% from 61% in the fourth quarter of 2015. The remaining CHF 36 billion of the Swiss residential mortgage loan portfolio related to properties rented out by the borrower and the average LTV of this portfolio was 56% as of 31 March 2016, unchanged compared with 31 December 2015. The average LTV for newly originated Swiss residential mortgage loans was 58% compared with 57%.
Our Swiss corporate banking products portfolio, which totaled CHF 24.5 billion as of 31 March 2016 compared with CHF 24.4 billion as of 31 December 2015, consists of loans, guarantees and loan commitments to multinational and domestic counterparties. Although this portfolio is well diversified across industries, these Swiss counterparties are, in general, highly reliant on the domes-tic economy and the economies to which they export, in particu-lar the EU and the US. In addition, the EUR / CHF exchange rate is an important risk factor for Swiss corporates. While credit loss expense for this portfolio remained low in the first quarter of 2016, given the reliance of the Swiss economy on exports, the continuing strength of the Swiss franc may have a negative effect on the Swiss economy, which could affect some of the counter-parties within our domestic lending portfolio and lead to an increase in the level of credit loss expenses in future periods.
Gross banking products exposure in the Investment Bank decreased by CHF 3 billion to CHF 66 billion over the quarter, mainly due to a decrease in loan commitments.
In Corporate Center – Group ALM, banking products exposure increased by CHF 15 billion due to higher balances with central banks, reflecting higher surplus liquidity from increases in cus-tomer deposits combined with various debt issuances.

Risk management and control
58
Wealth Management: loan portfolio, gross
31.3.16 31.12.15
CHF million % CHF million %
Secured by residential property1 32,068 31.3 34,004 32.3Secured by commercial / industrial property1 1,920 1.9 1,998 1.9Secured by cash1 15,106 14.7 11,859 11.3Secured by securities1 46,922 45.8 50,123 47.7Secured by guarantees and other collateral 6,003 5.9 6,851 6.5Unsecured loans 415 0.4 333 0.3Total loans, gross 102,434 100.0 105,167 100.0Total loans, net of allowances 102,369 105,0781 Collateral arrangements generally incorporate a range of collateral, including cash, securities, property and other collateral. In the first quarter of 2016, we aligned our collateral allocation processes across business divisions with a risk-based approach which prioritizes collateral mainly according to its liquidity profile, resulting in an increase in loans secured by cash of CHF 1.9 billion and in loans secured by securities of CHF 0.3 billion, while loans secured by residential property decreased by CHF 2.1 billion and loans secured by commercial / industrial property decreased by CHF 0.1 billion.
Wealth Management Americas: loan portfolio, gross
31.3.16 31.12.15
CHF million % CHF million %
Secured by residential property 8,349 17.8 8,378 17.2Secured by commercial / industrial property 0 0.0 0 0.0Secured by cash 1,051 2.2 1,020 2.1Secured by securities1 36,582 78.1 37,092 76.1Secured by guarantees and other collateral1 603 1.3 1,959 4.0Unsecured loans 247 0.5 305 0.6Total loans, gross 46,832 100.0 48,754 100.0Total loans, net of allowances 46,804 48,7261 Collateral arrangements generally incorporate a range of collateral, including cash, securities, property and other collateral. In the first quarter of 2016, we aligned our collateral allocation processes across business divisions with a risk-based approach which prioritizes collateral mainly according to its liquidity profile, resulting in an increase in loans secured by securities of CHF 1.2 billion, while loans secured by guarantees decreased by CHF 1.2 billion.
Banking products exposure by business division and Corporate Center unit
31.3.16
CHF millionWealth
Management
WealthManagement
Americas
Personal &Corporate
BankingAsset
ManagementInvestment
BankCC –
Services
CC –Group
ALM
CC –Non-core
and LegacyPortfolio Group
Balances with central banks 1,744 0 0 0 146 0 102,739 0 104,629
Due from banks 1,163 1,860 1,735 380 10,205 606 3,105 34 19,087
Loans1 102,434 46,832 135,041 3 15,583 11 6,728 103 306,736
Guarantees 2,252 799 7,708 0 5,333 10 0 83 16,185
Loan commitments 1,439 348 7,912 0 34,562 1 0 1,271 45,533
Banking products exposure2 109,032 49,839 152,396 383 65,828 628 112,572 1,490 492,169
Banking products exposure, net3 108,966 49,811 151,893 383 57,932 628 112,572 981 483,167
31.12.15
CHF millionWealth
Management
WealthManagement
Americas
Personal &Corporate
BankingAsset
ManagementInvestment
BankCC –
Services
CC –Group
ALM
CC –Non-core
and LegacyPortfolio Group
Balances with central banks 1,344 0 0 0 345 0 88,087 0 89,776
Due from banks 1,107 1,899 1,493 433 9,544 576 2,210 35 17,297
Loans1 105,167 48,754 135,616 11 15,464 36 6,788 100 311,937
Guarantees 2,267 747 7,900 0 5,607 11 0 84 16,616
Loan commitments 1,270 279 8,463 0 37,867 0 0 1,472 49,352
Banking products exposure2 111,155 51,678 153,473 443 68,828 623 97,086 1,692 484,978
Banking products exposure, net3 111,065 51,650 152,943 443 61,207 623 97,086 1,180 476,196
1 Does not include reclassified securities and similar acquired securities held by CC – Non-core and Legacy Portfolio. 2 Excludes loans designated at fair value. 3 Net of allowances, provisions and hedges.

Risk
, tre
asur
y an
d ca
pita
l man
agem
ent
59
Investment Bank: banking products1
CHF million 31.3.16 31.12.15
Total exposure, before deduction of allowances, provisions and hedges 56,961 60,628
Less: allowances, provisions (69) (59)
Less: credit protection bought (credit default swaps, notional)2 (7,815) (7,555)
Net exposure after allowances, provisions and hedges 49,077 53,014
1 Internal risk view, excludes balances with central banks, internal risk adjustments and the vast majority of due from banks exposures. 2 The effects of portfolio hedges, such as index credit default swaps (CDSs), and of loss protection from the subordinated tranches of structured credit protection are not reflected in this table.
Investment Bank: distribution of net banking products exposure, across internal UBS ratings and loss given default (LGD) buckets
CHF million, except where indicated 31.3.16 31.12.15
LGD buckets WeightedaverageLGD (%)
Weightedaverage
LGD (%)Internal UBS rating1 Exposure 0–25% 26–50% 51–75% 76–100% Exposure
Investment grade 31,042 6,374 13,687 7,700 3,281 50 33,465 49
Sub-investment grade 18,035 12,818 4,065 539 614 19 19,548 22
of which: 6−9 11,675 9,056 1,762 446 410 18 13,365 20
of which: 10−12 5,914 3,415 2,211 93 194 22 5,949 27
of which: 13 and defaulted 447 346 91 0 9 14 234 14
Net banking products exposure, after application of credit hedges 49,077 19,192 17,752 8,239 3,894 39 53,014 39
1 The ratings of the major credit rating agencies, and their mapping to our internal rating scale, are shown in the “Internal UBS rating scale and mapping of external ratings” table in the “Risk, treasury and capital man-agement” section of our Annual Report 2015.
Personal & Corporate Banking: loan portfolio, gross
31.3.16 31.12.15
CHF million % CHF million %
Secured by residential property1 97,069 71.9 100,181 73.9
Secured by commercial / industrial property1 18,848 14.0 19,641 14.5
Secured by cash1 1,984 1.5 242 0.2
Secured by securities1 1,658 1.2 693 0.5
Secured by guarantees and other collateral 6,207 4.6 6,607 4.9
Unsecured loans 9,275 6.9 8,252 6.1
Total loans, gross 135,041 100.0 135,616 100.0
Total loans, net of allowances 134,572 135,120
1 Collateral arrangements generally incorporate a range of collateral, including cash, securities, property and other collateral. In the first quarter of 2016, we aligned our collateral allocation processes across business divisions with a risk-based approach which prioritizes collateral mainly according to its liquidity profile, resulting in an increase in loans secured by cash of CHF 1.7 billion and in loans secured by securities of CHF 1.0 billion, while loans secured by residential property decreased by CHF 2.6 billion and loans secured by commercial / industrial property decreased by CHF 0.2 billion.

Risk management and control
60
Allowances and provisions for credit losses
IFRS exposure, gross1 Impaired exposure, grossEstimated liquidationproceeds of collateral2
Allowancesand provisions for
credit losses3 Impairment ratio (%)
CHF million, except where indicated 31.3.16 31.12.15 31.3.16 31.12.15 31.3.16 31.12.15 31.3.16 31.12.15 31.3.16 31.12.15
Group
Balances with central banks 104,629 89,776
Due from banks 13,554 11,951 1 1 3 3 0.0 0.0
Loans 305,528 312,643 1,237 1,225 170 163 655 689 0.4 0.4
Guarantees 15,627 16,019 243 256 9 4 31 32 1.6 1.6
Loan commitments 51,913 56,067 46 36 1 4 3 0.1 0.1
Total 491,251 486,456 1,527 1,518 181 168 694 727 0.3 0.3
Wealth Management
Balances with central banks 1,744 1,344
Due from banks 1,163 1,107
Loans 102,434 105,167 88 109 20 19 66 89 0.1 0.1
Guarantees 2,252 2,267 0 1
Loan commitments 1,439 1,270
Total 109,032 111,155 88 109 20 19 66 90 0.1 0.1
Wealth Management Americas
Balances with central banks 0 0
Due from banks 1,860 1,899
Loans 46,832 48,754 27 29 28 28 0.1 0.1
Guarantees 799 747
Loan commitments 348 279
Total 49,839 51,678 27 29 0 0 29 28 0.1 0.1
Personal & Corporate Banking
Balances with central banks 0 0
Due from banks 1,735 1,493 1 1 3 3 0.1 0.1
Loans 135,041 135,616 892 870 151 144 469 496 0.7 0.6
Guarantees 7,708 7,900 240 255 9 4 31 31 3.1 3.2
Loan commitments 7,912 8,463 32 20 1 0.4 0.2
Total 152,396 153,473 1,166 1,146 161 149 503 530 0.8 0.7
Asset Management
Balances with central banks 0 0
Due from banks 380 433
Loans 3 11
Guarantees 0 0
Loan commitments 0 0
Total 383 443 0 0 0 0 0 0 0.0
Investment Bank
Balances with central banks 146 345
Due from banks 4,655 4,177 0
Loans 11,539 13,088 201 202 77 62 1.7 1.5
Guarantees 4,732 4,958 3 1 0 0.1 0.0
Loan commitments 40,874 44,648 14 15 4 3 0.0 0.0
Total 61,945 67,217 217 219 0 0 82 65 0.4 0.3

Risk
, tre
asur
y an
d ca
pita
l man
agem
ent
61
Allowances and provisions for credit losses (continued)
IFRS exposure, gross1 Impaired exposure, grossEstimated liquidationproceeds of collateral2
Allowancesand provisions for
credit losses3 Impairment ratio (%)
CHF million, except where indicated 31.3.16 31.12.15 31.3.16 31.12.15 31.3.16 31.12.15 31.3.16 31.12.15 31.3.16 31.12.15
CC – Services
Balances with central banks 0 0
Due from banks 606 576
Loans 11 36 0 0
Guarantees 10 11
Loan commitments 1 0
Total 628 623 0 0 0 0 0 0 0.0 0.0
CC – Group ALM
Balances with central banks 102,739 88,087
Due from banks 3,105 2,210
Loans 6,728 6,788
Guarantees 0 0
Loan commitments 0 0
Total 112,572 97,086 0 0 0 0 0 0 0.0 0.0
CC – Non-core and Legacy Portfolio
Balances with central banks 0 0
Due from banks 50 56 0
Loans 2,940 3,183 30 15 15 14 1.0 0.5
Guarantees 126 137
Loan commitments 1,339 1,406
Total 4,455 4,782 30 15 0 0 15 14 0.7 0.3
1 The measurement requirements of IFRS differ in certain respects from our internal management view of credit risk. 2 Does not include oil and gas reserves related to reserve-based lending. 3 Includes CHF 11 mil-lion (31 December 2015: CHF 6 million) in collective loan loss allowances for credit losses.

Risk management and control
62
Traded productsTraded products include over-the-counter (OTC) derivative expo-sures, as well as securities financing transactions (SFTs) and exchange-traded derivative (ETD) exposures. Credit risk arising from traded products, after the effects of master netting agree-ments, but excluding credit valuation adjustments and hedges, increased by CHF 2 billion to CHF 47 billion as of 31 March 2016. OTC derivatives accounted for CHF 25 billion, exposures from SFTs were CHF 14 billion, and ETD exposures amounted to CHF 7 billion.
The majority of the traded products exposures, totaling CHF 37 billion, were within the Investment Bank, Non-Core and Legacy
Portfolio and Group ALM. Of this, CHF 0.1 billion was related to counterparties in the energy sector, predominantly rated invest-ment grade. As counterparty risk for traded products is managed at counterparty level, no further split between exposures in the Investment Bank and those in Non-core and Legacy Portfolio and Group ALM is provided. The traded products exposure includes OTC derivative exposures of CHF 18 billion in the Investment Bank and Non-core and Legacy Portfolio, an increase of CHF 2 billion from the prior quarter, primarily to investment grade banks and clearing houses. The SFT exposures, which arise mainly within the Investment Bank and Group ALM, amounted to CHF 14 billion and the ETD exposures were CHF 5 billion.
Investment Bank, Non-core and Legacy Portfolio and Group ALM: traded products exposure
CHF million OTC derivatives1 SFT ETD Total Total
31.3.16 31.12.15
Total exposure, before deduction of credit valuation adjustments and hedges 17,579 14,051 5,219 36,848 35,258
Less: credit valuation adjustments and allowances (460) 0 0 (460) (470)
Less: credit protection bought (credit default swaps, notional) (864) 0 0 (864) (1,076)
Net exposure after credit valuation adjustments, allowances and hedges 16,255 14,051 5,219 35,524 33,712
1 Net replacement value includes the effect of netting agreements (including cash collateral) in accordance with Swiss federal banking law.
Investment Bank, Non-Core and Legacy Portfolio and Group ALM: distribution of net OTC derivatives and SFT exposure across internal UBS ratings and loss given default (LGD) buckets
CHF million, except where indicated 31.3.16 31.12.15
LGD buckets WeightedaverageLGD (%)
Weightedaverage
LGD (%)Internal UBS rating1 Exposure 0–25% 26–50% 51–75% 76–100% Exposure
Net OTC derivatives exposure
Investment grade 15,464 4,050 10,519 475 420 31 13,176 30
Sub-investment grade 790 438 241 15 96 38 779 36
of which: 6−9 327 44 175 14 94 55 343 48
of which: 10−12 113 54 57 1 0 27 92 30
of which: 13 and defaulted 350 340 9 0 2 25 344 26
Total net OTC exposure, after credit valuation adjustments and hedges 16,255 4,488 10,760 490 517 31 13,955 31
Net SFT exposure
Investment grade 13,882 7,532 5,486 238 626 27 13,531 27
Sub-investment grade 169 8 17 17 126 86 126 89
Total net SFT exposure 14,051 7,540 5,503 255 753 28 13,657 28
1 The ratings of the major credit rating agencies, and their mapping to our internal rating scale, are shown in the “Internal UBS rating scale and mapping of external ratings“ table in the “Risk, treasury and capital man-agement“ section of our Annual Report 2015.

Risk
, tre
asur
y an
d ca
pita
l man
agem
ent
63
Market risk
The tables on the next page show minimum, maximum, average and period-end management value-at-risk (VaR) by business divi-sion and Corporate Center and by general market risk type. This is followed by similar statistics for regulatory VaR, stressed VaR, incremental risk charge (IRC) and the comprehensive risk measure (CRM) metrics used to calculate market risk RWA.
Market risk, measured as 1-day, 95% confidence level man-agement VaR, continues to be managed at low levels.
Regulatory VaR and stressed VaR exhibit a similar pattern to management VaR, with variability reflected in the maximum levels reported being more pronounced due to the 10-day holding period used.
During the first quarter, we made a structural change to our VaR model to consistently capture residual risk of equity- and credit-related risk factors. The change had a pronounced impact on VaR for our portfolios containing non-linear equity derivatives, resulting in a material reduction in the regulatory VaR and stressed VaR measures.
There were four new Group VaR negative backtesting excep-tions during the first quarter of 2016. This brought the total num-ber of negative exceptions within a 250-business-day window to eight, increasing the FINMA VaR multiplier for the market risk RWA calculation from 3.0 to 3.75. We have investigated the cause of each of the backtesting exceptions and identified several factors which contributed to the increase in the number of occur-rences. In particular, with market risk being managed at such low levels of VaR, the impact of these factors on the backtesting results became relatively more significant, contributing to the higher frequency of exceptions. – The recent increase in market volatility relative to the volatility
in the historical 5-year time series led to daily profit and loss on some risks exceeding that predicted by the VaR model. A key contributor to this was structural basis risk exposure between the onshore (CNY) and offshore (CNH) Chinese yuan currencies resulting from our Qualified Foreign Institutional
Investor (QFII) business. We have been actively reducing this QFII-related exposure since the fourth quarter of 2015. An additional contributor to the exceptions was the impact of oil price volatility on put options taken out to hedge oil- and gas-related banking book lending in the Investment Bank.
– Adjustments to trading revenues arising from non-daily marking or valuation processes can result in the recognition of profits and losses disconnected from the previous day’s backtesting VaR. We have ongoing initiatives to reduce such adjustments.
– Profit and loss on risks accounted for in the capital underpin-ning of risks-not-in-VaR (RniV) is captured in the backtesting revenue even though the risks are not covered by the VaR model.
Given the factors outlined above, combined with a review of the VaR model to confirm that it is performing consistent with its design and expectations considering the current risk profile and the market behavior, we do not believe that the recent increase in the number of negative backtesting exceptions indicates a defi-ciency in our VaR model.
➔ Refer to “Market risk” in the “Risk, treasury and capital
management” section of our Annual Report 2015 for more
information on market risk measures and the derivation of
market risk RWA from the results of the models
Interest rate risk in the banking bookAs of 31 March 2016, the interest rate sensitivity to a +1 basis point parallel shift in yield curves was negative CHF 1.7 million compared with negative CHF 4.1 million as of 31 December 2015. The CHF 2.4 million reduction was driven by a revised client rate model for the non-maturity deposits in Wealth Management Americas, which was enhanced to represent more accurately the relationship between historical market rates and the client rates.
➔ Refer to “Interest rate risk in the banking book” in the “Risk,
treasury and capital management” section of our Annual Report
2015 for more information

Risk management and control
64
Management value-at-risk (1-day, 95% confidence, 5 years of historical data) by business division and Corporate Center unit and general market risk type1
For the quarter ended 31.3.16
CHF million EquityInterest
ratesCredit
spreadsForeign
exchangeCommod-
ities
Min. 3 9 3 3 1
Max. 10 12 5 5 2
Average 6 10 4 4 1
31.3.16 4 11 3 3 2
Total management VaR, Group 9 16 12 10 Average (per business division and risk type)
Wealth Management 0 0 0 0 0 0 0 0 0
Wealth Management Americas 0 1 0 0 0 1 1 0 0
Personal & Corporate Banking 0 0 0 0 0 0 0 0 0
Asset Management 0 0 0 0 0 0 0 0 0
Investment Bank 7 14 10 9 6 8 3 4 1
CC – Services 0 0 0 0 0 0 0 0 0
CC – Group ALM 5 8 7 7 0 6 0 1 0
CC – Non-core and Legacy Portfolio 4 5 5 4 0 4 3 1 0
Diversification effect2, 3 (10) (10) 0 (9) (3) (1) 0
For the quarter ended 31.12.15
CHF million EquityInterest
ratesCredit
spreadsForeign
exchangeCommod-
ities
Min. 6 8 4 3 0
Max. 10 11 7 11 4
Average 8 9 6 6 1
31.12.15 7 9 4 3 1
Total management VaR, Group 12 18 15 13 Average (per business division and risk type)
Wealth Management 0 0 0 0 0 0 0 0 0
Wealth Management Americas 0 1 1 0 0 1 1 0 0
Personal & Corporate Banking 0 0 0 0 0 0 0 0 0
Asset Management 0 0 0 0 0 0 0 0 0
Investment Bank 9 16 12 10 8 7 3 6 1
CC – Services 0 0 0 0 0 0 0 0 0
CC – Group ALM 5 7 6 6 0 6 0 1 0
CC – Non-core and Legacy Portfolio 5 9 6 5 0 4 5 1 0
Diversification effect2, 3 (11) (9) 0 (9) (3) (1) 0
1 Statistics at individual levels may not be summed to deduce the corresponding aggregate figures. The minima and maxima for each level may occur on different days, and likewise, the VaR for each business line or risk type, being driven by the extreme loss tail of the corresponding distribution of simulated profits and losses for that business line or risk type, may well be driven by different days in the historical time series, rendering invalid the simple summation of figures to arrive at the aggregate total. 2 Difference between the sum of the standalone VaR for the business divisions and Corporate Center units and the VaR for the Group as a whole. 3 As the minimum and maximum occur on different days for different business divisions and Corporate Center units, it is not meaningful to calculate a portfolio diversification effect.

Risk
, tre
asur
y an
d ca
pita
l man
agem
ent
65
Regulatory value-at-risk (10-day, 99% confidence, 5 years of historical data) by business division and Corporate Center unit and general market risk type1
For the quarter ended 31.3.16
CHF million EquityInterest
ratesCredit
spreadsForeign
exchangeCommod-
ities
Min. 2 15 12 8 3
Max. 35 33 25 26 8
Average 18 21 17 15 5
31.3.16 7 26 12 12 6
Total regulatory VaR, Group 6 51 25 12 Average (per business division and risk type)
Wealth Management 0 0 0 0 0 0 0 0 0
Wealth Management Americas 3 6 4 4 0 5 4 0 0
Personal & Corporate Banking 0 0 0 0 0 0 0 0 0
Asset Management 0 0 0 0 0 0 0 0 0
Investment Bank 7 49 24 12 18 20 15 15 5
CC – Services 0 0 0 0 0 0 0 0 0
CC – Group ALM 1 30 5 2 0 1 1 4 0
CC – Non-core and Legacy Portfolio 7 14 11 9 0 10 3 2 5
Diversification effect2, 3 (20) (15) 0 (15) (5) (7) (5)
For the quarter ended 31.12.15
CHF million EquityInterest
ratesCredit
spreadsForeign
exchangeCommod-
ities
Min. 26 14 14 11 4
Max. 48 32 37 69 19
Average 33 19 21 27 9
31.12.15 27 16 14 20 6
Total regulatory VaR, Group 31 77 42 32 Average (per business division and risk type)
Wealth Management 0 0 0 0 0 0 0 0 0
Wealth Management Americas 4 6 5 4 0 5 5 0 0
Personal & Corporate Banking 0 0 0 0 0 0 0 0 0
Asset Management 0 0 0 0 0 0 0 0 0
Investment Bank 32 65 43 33 33 23 15 26 8
CC – Services 0 0 0 0 0 0 0 0 0
CC – Group ALM 1 39 4 2 0 1 1 4 0
CC – Non-core and Legacy Portfolio 8 27 13 10 0 9 10 2 5
Diversification effect2, 3 (23) (16) 0 (20) (9) (5) (4)
1 Statistics at individual levels may not be summed to deduce the corresponding aggregate figures. The minima and maxima for each level may occur on different days, and likewise, the VaR for each business line or risk type, being driven by the extreme loss tail of the corresponding distribution of simulated profits and losses for that business line or risk type, may well be driven by different days in the historical time series, rendering invalid the simple summation of figures to arrive at the aggregate total. 2 Difference between the sum of the standalone VaR for the business divisions and Corporate Center units and the VaR for the Group as a whole. 3 As the minimum and maximum occur on different days for different business divisions and Corporate Center units, it is not meaningful to calculate a portfolio diversification effect.

Risk management and control
66
Stressed value-at-risk (10-day, 99% confidence, historical data from 1 January 2007 to present) by business division and Corporate Center unit and general market risk type1
For the quarter ended 31.3.16
CHF million EquityInterest
ratesCredit
spreadsForeign
exchangeCommod-
ities
Min. 8 14 10 7 3
Max. 75 86 80 77 13
Average 32 43 39 33 7
31.3.16 25 30 12 25 4
Total stressed VaR, Group 19 140 54 19 Average (per business division and risk type)
Wealth Management 0 0 0 0 0 0 0 0 0
Wealth Management Americas 2 13 6 2 0 7 9 0 0
Personal & Corporate Banking 0 0 0 0 0 0 0 0 0
Asset Management 0 0 0 0 0 0 0 0 0
Investment Bank 16 150 55 24 32 45 33 35 6
CC – Services 0 0 0 0 0 0 0 0 0
CC – Group ALM 1 35 7 2 0 2 2 6 0
CC – Non-core and Legacy Portfolio 10 35 18 12 0 18 7 3 6
Diversification effect2, 3 (33) (21) 0 (28) (11) (10) (5)
For the quarter ended 31.12.15
CHF million EquityInterest
ratesCredit
spreadsForeign
exchangeCommod-
ities
Min. 55 29 48 19 7
Max. 91 103 91 132 50
Average 66 48 69 53 23
31.12.15 57 56 48 31 16
Total stressed VaR, Group 58 152 79 58 Average (per business division and risk type)
Wealth Management 0 0 0 0 0 0 0 0 0
Wealth Management Americas 9 15 11 10 0 9 16 0 0
Personal & Corporate Banking 0 0 0 0 0 0 0 0 0
Asset Management 0 0 0 0 0 0 0 0 0
Investment Bank 62 135 82 63 66 57 49 55 20
CC – Services 0 0 0 0 0 0 0 0 0
CC – Group ALM 5 75 10 8 0 5 4 6 0
CC – Non-core and Legacy Portfolio 15 39 23 20 0 20 14 4 8
Diversification effect2, 3 (47) (41) 0 (42) (14) (12) (6)
1 Statistics at individual levels may not be summed to deduce the corresponding aggregate figures. The minima and maxima for each level may occur on different days, and likewise, the VaR for each business line or risk type, being driven by the extreme loss tail of the corresponding distribution of simulated profits and losses for that business line or risk type, may well be driven by different days in the historical time series, rendering invalid the simple summation of figures to arrive at the aggregate total. 2 Difference between the sum of the standalone VaR for the business divisions and Corporate Center units and the VaR for the Group as a whole. 3 As the minimum and maximum occur on different days for different business divisions and Corporate Center units, it is not meaningful to calculate a portfolio diversification effect.

Risk
, tre
asur
y an
d ca
pita
l man
agem
ent
67
Incremental risk charge by business division and Corporate Center unit
For the quarter ended 31.3.16 For the quarter ended 31.12.15
CHF million Min. Max. Average 31.3.16 Min. Max. Average 31.12.15
Wealth Management
Wealth Management Americas 31 40 35 32 30 67 42 30
Personal & Corporate Banking
Asset Management
Investment Bank 112 184 160 112 133 197 166 197
CC – Services
CC – Group ALM 59 89 71 73 53 73 65 60
CC – Non-core and Legacy Portfolio 26 34 30 26 15 44 26 27
Diversification effect1, 2 (100) (91) (99) (95)
Total incremental risk charge, Group 151 223 196 151 159 224 200 219
1 Difference between the sum of the standalone IRC for the business divisions and IRC for the Group as a whole. 2 As the minimum and maximum occur on different days for different business divisions and Corporate Center units, it is not meaningful to calculate a portfolio diversification effect.
Comprehensive risk measure
For the quarter ended 31.3.16 For the quarter ended 31.12.15
CHF million Min. Max. Average 31.3.16 Min. Max. Average 31.12.15
Total comprehensive risk measure, Group 4 11 7 5 4 9 7 5
Interest rate sensitivity – banking book1, 2
31.3.16
CHF million –200 bps –100 bps +1 bp +100 bps +200 bps
CHF (5.9) (5.9) 0.3 32.2 64.1
EUR (115.2) (115.2) (0.3) (24.8) (44.7)
GBP (213.4) (126.6) 0.1 0.1 (13.9)
USD 550.2 386.6 (1.9) (176.0) (363.7)
Other (6.3) (8.3) 0.0 4.7 9.6
Total effect on interest rate-sensitive banking book positions 209.5 130.7 (1.7) (163.8) (348.6)
of which: Wealth Management Americas 523.0 305.7 (1.3) (126.8) (272.5)
of which: Investment Bank 43.8 33.7 (0.4) (38.1) (75.6)
of which: CC – Group ALM (354.2) (209.1) 0.1 14.3 27.5
of which: CC – Non-core and Legacy Portfolio (3.9) (0.4) (0.1) (8.8) (19.3)
31.12.15
CHF million –200 bps –100 bps +1 bp +100 bps +200 bps
CHF (33.9) (33.9) (0.2) (15.5) (29.1)
EUR 27.0 26.2 (0.3) (29.7) (55.5)
GBP (165.5) (42.4) 0.1 (0.8) (15.6)
USD 838.7 438.8 (3.8) (380.4) (763.4)
Other (1.2) (2.1) 0.1 8.2 16.5
Total effect on interest rate-sensitive banking book positions 665.0 386.5 (4.1) (418.3) (847.0)
of which: Wealth Management Americas 806.5 440.1 (3.7) (365.3) (732.5)
of which: Investment Bank 28.9 18.0 (0.2) (18.9) (39.7)
of which: CC – Group ALM (168.6) (73.6) (0.2) (19.2) (43.7)
of which: CC – Non-core and Legacy Portfolio (2.8) 1.2 (0.1) (9.6) (20.5)
1 Does not include interest rate sensitivities for credit valuation adjustments on monoline credit protection, US and non-US reference-linked notes. 2 In the prevailing negative interest rate environment for the Swiss franc in particular, and to a lesser extent for the euro, interest rates for Wealth Management and Personal & Corporate Banking client transactions are generally being floored at non-negative levels. Accordingly, for the purposes of this disclosure table, downward moves of 100 / 200 basis points are floored to ensure that the resulting shocked interest rates do not turn negative. The flooring results in non-linear sensitivity behavior.

Risk management and control
68
Country risk
Concerns about global growth continued to develop during the quarter and China’s slowing economy remains a potential source of weakness for growth prospects in other emerging markets. The continued strength of the US dollar combined with weak com-modity prices also continued to affect emerging markets. Some countries, such as Brazil, are also struggling with growing political and governance pressures, which limit their ability to undertake fiscal and structural reforms.
As disclosed in our Annual Report 2015, with the exception of China, our exposure to emerging markets countries is generally well-diversified, and we are comfortable with our direct exposure to China.
Peripheral European countries, particularly Greece, continue to cause concerns, in the context of a weak EU economic recovery and the migration crisis. In the first quarter of 2016, our direct exposure to peripheral European countries remained limited and our direct exposure to Greece was minimal at CHF 7 million. In
Europe, we also continue to closely monitor developments con-nected to the UK’s referendum on EU membership.
We remain watchful of developments in Ukraine, including the potential effects of economic sanctions against Russian persons and entities. There was no material change in our risk profile in Russia over the first quarter, with our direct net exposure totaling CHF 0.6 billion as of 31 March 2016, approximately half of which was related to margin loans to Russian borrowers that were secured by global depository receipts issued on Russian companies.
Exposures to selected eurozone countriesThe table “Exposures to selected eurozone countries” provides an overview of our exposures to eurozone countries rated lower than AAA / Aaa by at least one of the major rating agencies as of 31 March 2016.
➔ Refer to “Country risk” in the “Risk, treasury and capital
management” section of our Annual Report 2015 for
information on our country risk framework and related
exposure measures
Exposures to selected eurozone countries
CHF million TotalBanking products
(loans, guarantees, loan commitments)
Traded products (counterparty risk from derivatives andsecurities financing) after master netting
agreements and net of collateral
Trading inventory (securities and
potential benefits/remaining exposure
from derivatives)
31.3.16Net of
hedges1
Exposurebefore
hedgesNet of
hedges1of which:unfunded
Exposurebefore hedges
Net ofhedges
Net longper issuer
Netherlands 6,659 6,009 1,451 983 225 1,055 872 4,154
Sovereign, agencies and central bank 3,979 3,979 7 7 20 20 3,952
Local governments
Banks 522 522 39 39 400 400 83
Other2 2,158 1,508 1,405 937 635 452 118
France 5,646 5,207 1,215 898 395 1,573 1,452 2,857
Sovereign, agencies and central bank 2,987 2,866 14 14 228 107 2,745
Local governments 11 11 11 11
Banks 653 653 98 98 514 514 41
Other2 1,994 1,677 1,103 785 821 821 71
Spain 1,286 1,019 660 392 300 47 47 579
Sovereign, agencies and central bank 1 1 1 1 1
Local governments 0 0 0
Banks 107 107 33 33 20 20 54
Other2 1,178 910 626 359 27 27 525
Italy 1,495 1,004 1,145 714 518 278 216 73
Sovereign, agencies and central bank 76 14 61 0 14
Local governments 94 94 92 92 2
Banks 276 276 208 208 50 50 18
Other2 1,050 620 937 506 74 74 39
Ireland3 775 775 92 92 24 613 613 70
Sovereign, agencies and central bank
Local governments
Banks 93 93 59 59 24 24 10
Other2 682 682 33 33 589 589 60

Risk
, tre
asur
y an
d ca
pita
l man
agem
ent
69
Exposures to selected eurozone countries (continued)
CHF million TotalBanking products
(loans, guarantees, loan commitments)
Traded products (counterparty risk from derivatives andsecurities financing) after master netting
agreements and net of collateral
Trading inventory (securities and
potential benefits/remaining exposure
from derivatives)
31.3.16Net of
hedges1
Exposurebefore
hedgesNet of
hedges1of which:unfunded
Exposurebefore hedges
Net ofhedges
Net longper issuer
Finland 654 622 107 74 2 35 35 512
Sovereign, agencies and central bank 276 276 276
Local governments 1 1 0 0 0
Banks 257 257 18 18 7 7 233
Other2 120 88 89 56 28 28 3
Austria 560 435 36 36 18 145 21 379
Sovereign, agencies and central bank 468 343 125 1 342
Local governments 0 0 0
Banks 72 72 20 20 17 17 35
Other2 21 21 16 16 3 3 2
Belgium 392 392 202 202 7 124 124 67
Sovereign, agencies and central bank 87 87 40 40 47
Local governments 12 12 12
Banks 186 186 181 181 3 3 2
Other2 108 108 20 20 81 81 6
Portugal 144 79 124 58 57 1 1 20
Sovereign, agencies and central bank
Local governments 0 0 0
Banks 16 16 14 14 0 0 2
Other2 127 62 109 44 1 1 17
Greece 7 7 7 7 0 0 0 0
Sovereign, agencies and central bank 0 0 0
Local governments
Banks 7 7 7 7 0 0
Other2 0 0 0 0 0
Other4 120 120 98 98 13 7 7 151 Not deducted from the “Net of hedges” exposures are total allowances and provisions for credit losses of CHF 51 million (of which: Malta CHF 37 million, Ireland CHF 6 million and France CHF 5 million). 2 Includes corporates, insurance companies and funds. 3 The majority of the Ireland exposure relates to funds and foreign bank subsidiaries. 4 Represents aggregate exposures to Andorra, Cyprus, Estonia, Latvia, Lithuania, Malta, Monaco, Montenegro, San Marino, Slovakia and Slovenia.
Exposure from single-name credit default swaps referencing Greece, Italy, Ireland, Portugal or Spain (GIIPS)
Protection bought Protection sold
Net position (after application of counterparty master
netting agreements)
CHF million
of which:counterparty domiciled
in GIIPS country
of which:counterparty domicile is
the same as the referenceentity domicile
31.3.16 Notional RV Notional RV Notional RV Notional RVBuy
notionalSell
notional PRV NRV
Greece 80 (1) 0 0 0 0 (144) (1) 0 (64) 2 (3)
Italy 14,662 174 42 0 31 0 (14,261) (267) 2,255 (1,854) 77 (171)
Ireland 876 (18) 11 0 0 0 (865) 23 412 (401) 10 (5)
Portugal 668 (4) 0 0 0 0 (690) (1) 218 (240) 12 (16)
Spain 2,507 (49) 58 (1) 10 0 (2,293) 34 971 (758) 25 (40)
Total 18,792 101 110 (1) 40 0 (18,253) (212) 3,857 (3,318) 125 (236)

Risk management and control
70
Operational risk
Following the global implementation of our monitoring and sur-veillance capabilities over the past two years, the focus in the first quarter of 2016 was to further enhance our surveillance alert sys-tems to be more efficient and effective at detecting breaches and suspicious patterns of activity. Additionally, we further refined the review, reporting and escalation processes to support the business in identifying and detecting improper client, business and employee practices in a timely fashion. Throughout 2016, we will further enhance geographical and business coverage and our analytical capabilities.
We have advanced our conduct risk framework through reporting and thematic reviews to better assess emerging conduct risk, including conflicts of interest, market conduct and suitability risks, to prevent the firm’s conduct from unfairly affecting clients or markets.
Operational resilience also remained central to the Compliance and Operational Risk Control strategy as we continued to enhance our defenses against evolving cyber threats and vendor risk, while maintaining oversight of internal change risk.
The operational risk capital advanced measurement approach (AMA), model design, methodology and calibration have been subject to an in-depth cyclical review which commenced in the fourth quarter of 2014 and was completed in the first quarter of 2016. The upgraded model introduces a litigation-specific stress component and incorporates changes to the model structure, ini-tial model calibration, the assessment of the business environ-ment and internal control factors, model diversification, and the approach for combining internal and external loss history. FINMA has approved the use of the upgraded Group AMA model for regulatory capital calculations commencing on 31 March 2016. As a result of the model development, FINMA agreed to the removal of the incremental operational risk RWA, such that all operational risk-related regulatory capital requirements are now calculated in the model, resulting in an increase of operational risk RWA to CHF 76.5 billion as of 31 March 2016 from CHF 75.1 bil-lion as of 31 December 2015. The percentages of capital alloca-tion to the business divisions for the first quarter of 2016 remained the same as in the fourth quarter of 2015, resulting in slight increases for all business divisions.
➔ Refer to the “Capital management” section of this report for
more information on the development of operational risk RWA
during the first quarter of 2016

Risk
, tre
asur
y an
d ca
pita
l man
agem
ent
71
Balance sheet
As of 31 March 2016, our balance sheet assets stood at CHF 967 billion, an increase of CHF 24 billion from 31 December 2015. Positive replacement values increased by CHF 13 billion, primarily within the Investment Bank. Funded assets, which represent total assets excluding positive replacement values and collateral delivered against over-the-counter derivatives, increased by CHF 8 billion to CHF 764 billion. Excluding currency effects, funded assets increased by CHF 24 billion, mainly reflecting increases in cash balances with central banks and collateral trading assets.
Assets
Product category viewCash and balances with central banks increased by CHF 14 billion, resulting from increases in customer deposits combined with vari-ous debt issuances, and largely reflecting a strengthening of our liquidity position in anticipation of requirements applicable to our US intermediate holding company from July 2016.
Positive replacement values (PRV) increased by CHF 13 billion, primarily resulting from an CHF 8 billion increase in the Invest-ment Bank, mainly related to foreign exchange contracts and interest rate contracts, mainly due to currency movements and shifts in yield curves, respectively. PRV within Corporate Center – Non-core and Legacy Portfolio increased by CHF 5 billion, reflect-ing fair value increases that resulted from interest rate move-ments, partly offset by trade terminations and maturities.
Collateral trading assets, which consist of reverse repurchase agreements and cash collateral on securities borrowed, increased by CHF 13 billion, primarily in the Investment Bank, resulting from
client-driven increases and an increase in externally sourced col-lateral required to service client transactions due to a lower vol-ume of available trading portfolio assets, as described below. Financial assets designated at fair value, available for sale and held to maturity increased by CHF 6 billion on a combined basis, mainly due to increases in high-quality liquid assets. Other assets increased by CHF 2 billion, primarily due to an increase in cash collateral receivables on derivative instruments corresponding to the increase in replacement values.
These increases were partly offset by a CHF 19 billion decrease in trading portfolio assets, mainly in the Equities business within the Investment Bank, reflecting client-driven and active reduc-tions, including a reduction in trading portfolio assets held for hedging purposes. Lending assets decreased by CHF 5 billion, pri-marily reflecting lower Lombard lending in Wealth Management and currency effects.
➔ Refer to the “Balance sheet” and Notes 10 through 13 in the
“Consolidated financial statements” section of this report for
more information
0
200
400
600
800
1000

Balance sheet
72
Total assets and funded assets
31.3.16 31.12.15
CHF billionInvestment
BankCC –
Group ALM
CC – Non-core and
Legacy Portfolio Other UBS
Investment Bank
CC – Group ALM
CC – Non-core and
Legacy Portfolio Other UBS
Total assets 256.6 258.8 99.8 351.7 966.9 253.5 237.5 94.4 357.4 942.8
Less: positive replacement values (91.7) 0.0 (83.5) (5.3) (180.5) (83.4) (0.1) (78.5) (5.4) (167.4)
Less: collateral delivered against OTC derivatives1 (12.4) (0.5) (9.9) 0.0 (22.7) (10.2) (0.1) (8.9) 0.0 (19.2)
Funded assets 152.5 258.4 6.4 346.4 763.7 159.9 237.3 7.0 352.0 756.21 Mainly consists of cash collateral receivables on derivative instruments and reverse repurchase agreements.
Divisional viewCorporate Center – Group Asset and Liability Management (Group ALM) total assets increased by CHF 21 billion to CHF 259 billion as of 31 March 2016, mainly reflecting the aforementioned increases in cash and balances with central banks, as well as higher other high-quality liquid assets in the form of financial assets designated at fair value, available for sale and held to maturity.
Investment Bank total assets increased by CHF 3 billion to CHF 257 billion as of 31 March 2016, primarily due to the aforemen-tioned increase in PRV. Funded assets decreased by CHF 7 billion to CHF 153 billion, mainly resulting from reductions in our Equi-ties business, primarily reflecting the aforementioned decline in trading portfolio assets, as well as currency effects, partly offset by an increase in collateral trading assets.
Corporate Center – Non-core and Legacy Portfolio total assets increased by CHF 5 billion to CHF 100 billion as of 31 March 2016, primarily due to the aforementioned increase in PRV. Funded assets were largely unchanged at CHF 6 billion.
Wealth Management, Wealth Management Americas, Per-sonal & Corporate Banking, Asset Management and Corporate Center – Services total assets were broadly unchanged at CHF 118 billion, CHF 59 billion, CHF 140 billion, CHF 12 billion and CHF 22 billion, respectively.
Liabilities
Total liabilities increased by CHF 25 billion to CHF 910 billion as of 31 March 2016. Negative replacement values increased by CHF 17 billion, broadly in line with the aforementioned increases in PRV. Customer deposits increased by CHF 11 billion, and increased by approximately CHF 19 billion excluding currency effects, mainly in Wealth Management and primarily reflecting net new money during the quarter. Short-term borrowings, which include short-term debt issued and interbank borrowing, increased by CHF 8 billion, primarily reflecting net issuances of both certificates of deposit and commercial paper.
These increases were offset by a CHF 6 billion reduction in long-term debt issued, which consists of financial liabilities desig-nated at fair value and long-term debt held at amortized cost, primarily due to lower financial liabilities designated at fair value. Long-term debt held at amortized cost was broadly unchanged, as issuances of senior unsecured debt that will contribute to our total loss-absorbing capacity (TLAC) and additional tier 1 perpet-ual capital were mostly offset by the maturity of a covered bond and a senior unsecured bond, and currency effects. Collateral trading liabilities decreased by CHF 5 billion, mainly as a result of client-driven activity in the Investment Bank. Other liabilities were broadly unchanged.
➔ Refer to the “Liquidity and funding management” section of this
report for more information
➔ Refer to the “Balance sheet” and Notes 10 through 16 in the
“Consolidated financial statements” section of this report for
more information

Risk
, tre
asur
y an
d ca
pita
l man
agem
ent
73
Equity
Equity attributable to UBS Group AG shareholders decreased by CHF 468 million to CHF 54,845 million.
Total comprehensive income attributable to UBS Group AG shareholders was CHF 399 million, reflecting the net profit attrib-utable to UBS Group AG shareholders of CHF 707 million, partly offset by negative other comprehensive income (OCI) attributable to UBS Group AG shareholders of CHF 308 million. First-quarter OCI included foreign currency translation losses of CHF 825 mil-lion and net losses on defined benefit plans of CHF 179 million, partly offset by positive OCI related to cash flow hedges and financial assets available for sale of CHF 513 million and CHF 131 million, respectively. Own credit on financial liabilities designated at fair value resulted in an OCI gain of CHF 52 million.
Employee share-based compensation decreased share pre-mium by CHF 428 million, mainly due to the settlement of deferred equity compensation awards during the quarter.
0
200
400
600
800
1000
Net treasury share activity reduced equity attributable to UBS Group AG shareholders by CHF 444 million, mainly reflecting the net acquisition of treasury shares related to employee share-based compensation awards.
➔ Refer to the “Recent developments” section of this report for
more information on own credit
➔ Refer to the “Statement of changes in equity” in the “Consoli-
dated financial statements” section and to “Total comprehensive
income attributable to UBS Group AG shareholders: 1Q16 vs
4Q15” in the “Group performance” section of this report for
more information
Intra-quarter balances
Balance sheet positions disclosed in this section represent quarter-end positions. Intra-quarter balance sheet positions fluctuate in the ordinary course of business and may differ from quarter-end positions.
38000
42750
47500
52250
57000(825) (179)
57,000
52,000
45,000
38,000
0
Equity attributable to UBS Group AG shareholders: development during the first quarter of 2016CHF million
31.12.15 Net profit Employee share and share optionsplans (within share premium)
OtherTreasury shares
Foreign currency translation(OCI)
Financial assets available for sale (OCI)
Defined benefit plans(OCI)
Own credit (OCI)
Cash flow hedges(OCI)
31.3.16
55,313 54,8455(444)
513131 52
(428)
707

Liquidity and funding management
74
Liquidity and funding management
Our liquidity and funding position remained strong during the first quarter of 2016, with an increase in the three-month average liquidity coverage ratio to 134% from 124%, largely in anticipation of requirements applicable to our US intermediate holding company from July 2016. Our pro forma net stable funding ratio increased to 112% from 105%. We issued the equivalent of CHF 1.4 billion of US dollar-denominated high-trigger additional tier 1 perpetual capital notes and the equivalent of CHF 1.3 billion of Swiss franc- and euro-denominated senior unsecured debt that will contribute to our total loss-absorbing capacity.
Liquidity
Regulatory frameworkThe LCR measures the short-term resilience of a bank’s liquidity profile by comparing whether sufficient HQLA are available to sur-vive the expected net cash outflows from a significant liquidity stress scenario, as defined by the relevant regulator.
The Basel Committee on Banking Supervision (BCBS) standards require an LCR of at least 100% by 2019, with a phase-in period starting from 2015. UBS, as a Swiss systemically relevant bank, is required to maintain a total LCR of at least 100%, as well as a Swiss franc-denominated LCR of at least 100%. In addition, both UBS AG and UBS Switzerland AG are subject to minimum LCR requirements on a standalone basis.
Consistent with BCBS standards, in a period of financial stress, the Swiss Financial Market Supervisory Authority (FINMA) may allow banks to use their HQLA and let their LCR temporarily fall below the minimum threshold of 100%.
High-quality liquid assetsHQLA are low-risk unencumbered assets under the control of the Group Treasurer that are easily and immediately convertible into cash at little or no loss of value, to meet liquidity needs in a 30-calendar-day liquidity stress scenario. Our HQLA consists pri-marily of assets that qualify as Level 1 in the LCR framework, including cash and balances with central banks and government bonds.
Group HQLA include amounts held by UBS Group subsidiaries and branches of UBS AG that are available to meet funding and collateral needs in certain jurisdictions, but are not readily avail-able for use by the Group as a whole. This may be as a result of local regulatory requirements, including LCR requirements and large exposure limitations. Funds that are effectively restricted are excluded from the calculation of HQLA.
Liquidity coverage ratioIn the first quarter of 2016, our three-month average total LCR increased 10 percentage points to 134% driven by a CHF 7 billion increase in our HQLA and a CHF 7 billion decrease in the expected net cash outflows.
The total weighted liquidity value of HQLA increased by CHF 7 billion, largely due to a strengthening of our liquidity position in anticipation of requirements applicable to our US intermediate holding company from July 2016.
Expected net cash outflows decreased by CHF 7 billion, mainly related to a decrease in expected outflows from unsecured and secured wholesale funding and committed credit and liquidity facilities, partly offset by an increase in expected outflows from other contractual funding obligations.
As of 31 March 2016, we were above the 110% Group LCR minimum communicated by FINMA.
➔ Refer to the “Treasury management” section of our Annual
Report 2015 for more information on high-quality liquid assets
and the liquidity coverage ratio

Risk
, tre
asur
y an
d ca
pita
l man
agem
ent
75
High-quality liquid assets
Average 1Q16 Average 4Q15
CHF billion
Level 1weightedliquidity
value
Level 2weightedliquidity
value1
Totalweightedliquidity
value1
Totalcarrying
value
Level 1weighted
liquidityvalue1
Level 2weighted
liquidityvalue1
Totalweighted
liquidityvalue1
Totalcarrying
value
Cash and balances with central banks2 129 0 129 129 117 0 117 117
Securities (on-balance sheet)3 50 4 54 55 50 6 55 56
Securities received as collateral (off-balance sheet) 25 6 31 32 31 4 36 36
Total high-quality liquid assets 204 11 215 216 198 10 208 210
1 Calculated after the application of haircuts. 2 Includes reverse repurchase agreements that are eligible as HQLA (total weighted liquidity value 1Q16: CHF 22 billion, total weighted liquidity value 4Q15: CHF 20 billion). 3 Includes financial assets designated at fair value, available for sale and held to maturity and trading portfolio assets.
Liquidity coverage ratio
Average 1Q16 Average 4Q15
CHF billion, except where indicated Unweighted value Weighted value1 Unweighted value Weighted value1
High-quality liquid assets
1 High-quality liquid assets 216 215 210 208
Cash outflows
2 Retail deposits and deposits from small business customers 224 25 218 24
3 of which: stable deposits 37 1 35 1
4 of which: less stable deposits 187 23 183 23
5 Unsecured wholesale funding 196 118 200 124
6 of which: operational deposits (all counterparties) 35 8 34 8
7 of which: non-operational deposits (all counterparties) 148 96 148 98
8 of which: unsecured debt 14 14 18 18
9 Secured wholesale funding 34 39
10 Additional requirements: 121 60 159 59
11 of which: outflows related to derivatives and other transactions 68 43 97 39
12 of which: outflows related to loss of funding on debt products2 1 1 0 0
13 of which: committed credit and liquidity facilities 52 16 62 20
14 Other contractual funding obligations 33 29 20 19
15 Other contingent funding obligations 210 8 222 10
16 Total cash outflows 273 275
Cash inflows
17 Secured lending 141 54 181 53
18 Inflows from fully performing exposures 61 31 59 31
19 Other cash inflows 29 29 23 23
20 Total cash inflows 231 113 263 107
Liquidity coverage ratio Average 1Q16 Average 4Q15
CHF billion, except where indicated Total adjusted value3 Total adjusted value3
21 High-quality liquid assets 215 208
22 Net cash outflows 160 167
23 Liquidity coverage ratio (%) 134 124
1 Calculated after the application of haircuts and inflow and outflow rates. 2 Includes outflows related to loss of funding on asset-backed securities, covered bonds, other structured financing instruments, asset-backed commercial papers, structured entities (conduits), securities investment vehicles and other such financing facilities. 3 Calculated after the application of haircuts and inflow and outflow rates as well as, where appli-cable, caps on Level 2 assets and cash inflows.

Liquidity and funding management
76
Funding
Changes in sources of funding during the reporting periodLong-term debt excluding structured debt, which comprises both senior and subordinated debt and is presented within Debt issued on the balance sheet, remained stable at CHF 72 billion as of 31 March 2016, as new issuances in an amount equivalent to CHF 2.7 billion were offset by maturities equivalent to CHF 2.3 billion and foreign currency translation effects.
In March 2016, we issued the equivalent of CHF 1.4 billion of US dollar-denominated high-trigger loss-absorbing, additional tier 1 perpetual capital notes with an initial 6.875% fixed-rate coupon and an optional first call date after five years. Moreover, we issued the equivalent of CHF 1.3 billion of senior unsecured debt that will contribute to our total loss-absorbing capacity. This issuance consisted of two Swiss franc-tranches in February 2016 and one euro-denominated tranche in March 2016 as follows: (i) CHF 150 million 10-year fixed rate with a coupon of 1.25%, (ii) CHF 300 million 6-year fixed rate with a coupon of 0.75% and (iii) EUR 750 million 8-year fixed rate with a coupon of 2.125%.
These issuances were partly offset by the maturity of a EUR 1.0 billion 4-year 3.125% fixed-rate senior unsecured bond and a USD 1.25 billion 3-year 0.75% fixed-rate covered bond.
During the first quarter of 2016, we continued to raise medium- and long-term funds through medium-term note pro-grams and private placements and through Swiss Pfandbriefe issuances.
➔ Refer to the “Capital management” section of this report for
more information on instruments contributing to our total
loss-absorbing capacity
Our short-term interbank deposits (presented as Due to banks on the balance sheet), together with our outstanding short-term debt, increased by CHF 8 billion, primarily reflecting net issuances of both certificates of deposit and commercial paper.
Our overall customer deposits increased by CHF 11 billion to CHF 402 billion, mainly driven by net new money, and represent 60% of our funding sources.
Net stable funding ratioIn June 2015, the BCBS issued its guidance on “Net stable fund-ing ratio (NSFR) disclosure standards,” which is intended to pro-vide a common disclosure framework for banks to disclose the calculation of the NSFR adopted by the BCBS in October 2014. Internationally active banks must comply with the NSFR and dis-closure requirements from 1 January 2018, subject to national adoption requirements.
The NSFR framework is intended to limit over-reliance on short-term wholesale funding to encourage better assessment of fund-ing risk across all on- and off-balance sheet items, and to promote funding stability. NSFR consists of two components: the available stable funding (ASF) and the required stable funding (RSF). ASF is defined as the portion of capital and liabilities expected to be available over the period of one year. RSF is a function of the maturity, encumbrance and other characteristics of assets held and off-balance sheet exposures. The BCBS NSFR regulatory framework requires a net stable funding ratio of at least 100% from 2018.
We report our estimated pro forma NSFR based on current guidance from FINMA and will adjust our reporting according to the final implementation of the BCBS NSFR disclosure standards in Switzerland. In the first quarter of 2016, our estimated pro forma NSFR increased 7 percentage points to 112%, mainly due to a decrease of CHF 24 billion in RSF, primarily driven by a decrease in the trading portfolio and net derivative exposures.
Pro forma net stable funding ratio
CHF billion, except where indicated 31.3.16 31.12.15
Available stable funding 426 426
Required stable funding 379 403
Pro forma net stable funding ratio (%) 112 105

Risk
, tre
asur
y an
d ca
pita
l man
agem
ent
77
Funding by product and currency
In CHF billion
All currencies All currencies1 CHF1 EUR1 USD1 Others1
31.3.16 31.12.15 31.3.16 31.12.15 31.3.16 31.12.15 31.3.16 31.12.15 31.3.16 31.12.15 31.3.16 31.12.15
Securities lending 6.4 8.0 1.0 1.2 0.0 0.0 0.2 0.2 0.6 0.7 0.1 0.2
Repurchase agreements 6.5 9.7 1.0 1.5 0.0 0.0 0.4 0.6 0.5 0.7 0.1 0.2
Due to banks 11.3 11.8 1.7 1.8 0.6 0.4 0.1 0.1 0.6 0.7 0.4 0.5
Short-term debt issued2 29.8 21.2 4.5 3.2 0.1 0.1 0.3 0.4 3.6 2.4 0.5 0.4
Retail savings / deposits 164.7 161.8 24.7 24.5 14.0 13.8 0.8 0.8 9.9 9.9 0.0 0.0
Demand deposits 180.4 172.8 27.1 26.2 8.3 7.8 5.6 5.2 9.6 9.7 3.6 3.5
Fiduciary deposits 5.0 6.1 0.7 0.9 0.0 0.1 0.0 0.1 0.5 0.6 0.1 0.1
Time deposits 51.5 49.4 7.7 7.5 1.6 1.8 0.1 0.1 4.4 3.8 1.7 1.8
Long-term debt issued3 129.3 134.9 19.4 20.5 2.1 2.3 5.4 5.7 10.7 10.8 1.3 1.7
Cash collateral payables on derivative instruments 36.7 38.3 5.5 5.8 0.2 0.2 2.0 2.1 2.7 2.7 0.7 0.8
Prime brokerage payables 44.0 45.3 6.6 6.9 0.1 0.1 0.7 1.0 4.3 4.4 1.5 1.3
Total 665.5 659.4 100.0 100.0 27.0 26.6 15.7 16.3 47.4 46.5 9.9 10.6
1 As a percent of total funding sources. 2 Short-term debt issued is comprised of certificates of deposit, commercial paper, acceptances and promissory notes, and other money market paper. 3 Long-term debt issued also includes debt with a remaining time to maturity of less than one year.

Capital management
78
Capital management
Fully applied common equity tier 1 (CET1) capital1 decreased by CHF 0.2 billion to CHF 29.9 billion as of 31 March 2016 and fully applied risk-weighted assets increased by CHF 6.1 billion to CHF 213.6 billion, mainly attributable to increases in regulatory add-ons and book size. Our fully applied CET1 capital ratio decreased 0.5 percentage points to 14.0%. Our Swiss SRB leverage ratio increased 0.1 percentage points to 5.4% on a fully applied basis and decreased 0.2 percentage points to 6.0% on a phase-in basis. During the first quarter of 2016, we issued the equivalent of CHF 1.4 billion of high-trigger additional tier 1 perpetual capital notes. We also issued the equivalent of CHF 1.3 billion of senior unse-cured debt that will contribute to our total loss-absorbing capacity.
1 Unless otherwise indicated, all information in this section is based on the Basel III framework as applicable for Swiss systemically relevant banks (SRB).
UBS is considered a systemically relevant bank (SRB) under Swiss banking law and both UBS Group and UBS AG are, on a consoli-dated basis, required to comply with regulations based on the Basel III framework as applicable for Swiss SRBs. In addition, both UBS AG and UBS Switzerland AG are subject to capital regulations on a standalone basis. All our capital disclosures therefore focus on Swiss SRB capital information. Differences between Swiss SRB and BIS capital information on a UBS Group level are outlined in the “Differences between Swiss SRB and BIS capital” sub-section.
➔ Refer to the “Legal entity financial and regulatory information”
section of this report, and to the documents “UBS AG first
quarter 2016 report” and “UBS Switzerland AG (standalone)
regulatory information,” which will be available from 6 May
2016 in “Quarterly reporting” at www.ubs.com/investors, for
more information
Regulatory framework
The Basel III framework came into effect in Switzerland on 1 Janu-ary 2013 and includes prudential filters for the calculation of capital. These prudential filters consist mainly of capital deduc-tions for deferred tax assets (DTAs) recognized for tax loss carry-forwards, DTAs on temporary differences that exceed a certain threshold and effects related to defined benefit plans. As these filters are being phased in between 2014 and 2018, their effects are gradually factored into our calculations of capital, risk-weighted assets (RWA) and capital ratios on a phase-in basis and are entirely reflected in our capital, RWA and capital ratios on a fully applied basis.
In 2016, we deduct from our phase-in CET1 capital 60% (in 2015: 40%) of: (i) DTAs recognized for tax loss carry-forwards, (ii) DTAs on temporary differences that exceed the threshold of 10% of CET1 capital before deductions for DTAs on temporary differ-ences and (iii) net defined benefit pension plan assets. In addition, we deduct 60% (in 2015: 40%) of our goodwill from phase-in CET1 capital and 40% (in 2015: 60%) of our goodwill from hybrid and low-trigger loss absorbing capital.
Capital instruments that were treated as hybrid tier 1 capital and as tier 2 capital under the Basel 2.5 framework are being phased out under Basel III between 2013 and 2019. On a phase-in basis, our capital and capital ratios include the applicable por-tion of these capital instruments not yet phased out. Our capital and capital ratios on a fully applied basis do not include these capital instruments.
Capital requirements
As of 31 March 2016, our total capital requirement for both UBS Group and UBS AG (consolidated) was 14.3% of RWA, an increase of 1.7 percentage points from 31 December 2015. The requirement as of 31 March 2016 consisted of: (i) base capital of 4.5%, (ii) buffer capital of 6.4%, of which 0.2% was attributable to the countercyclical buffer capital requirement, and (iii) progres-sive buffer capital of 3.4%. We satisfied the base and buffer cap-ital requirements, including the countercyclical buffer, through our CET1 capital. In addition, high-trigger loss-absorbing capital is included in the buffer capital. Low-trigger loss-absorbing capital satisfied the progressive buffer capital requirement.
Similar to the other capital component requirements, the pro-gressive buffer requirement is phased in gradually until 2019. As of 31 March 2016, the progressive buffer requirement was 3.4%, an increase of 0.6 percentage points from 31 December 2015. Our requirement for the progressive buffer is dynamic and depends on our leverage ratio denominator (LRD) and our market share in the loans and deposits business in Switzerland. The pro-gressive buffer requirement for 2019 provided by FINMA in June 2015 currently stands at 4.5%, reflecting our LRD and market share information for 2014.
National regulators can put in place a countercyclical buffer requirement of up to 2.5% of RWA for credit exposures in their jurisdiction. The current countercyclical buffer requirement is 2% of RWA for mortgage loans on residential property in Switzerland.

Risk
, tre
asur
y an
d ca
pita
l man
agem
ent
79 0
5
10
15
20
25
30
Goneconcern4
Going concern
Goneconcern4
Going concern
Goneconcern
Going concern
Goneconcern4
Going concern
Phase-in Fully applied
31.12.15 From 1.1.16(current)
20168
(proposed)31.12.19(current)
1.1.2020(proposed)
Base: CET1 capital
TLAC-eligible senior unsecured debt7
Buffer: high-trigger loss-absorbing capital5 Base: high-trigger additional tier 1 capital6Buffer: CET1 capital
Progressive buffer: low-trigger loss-absorbing capital
4.5%
3.0%
2.3%
2.8%
4.5%
3.8%
2.6%
3.4%
4.5%
3.8%
2.6%
5.5%
4.5%
3.5%
0.8%
14.3%
12.6%2
14.3%2 14.4%2
28.6%3
4.5%
5.5%
3.0%
4.5%
17.5%3
Our capital requirements1
1 In percent of risk-weighted assets (RWA). Proposed requirements for Swiss SRBs are based on the draft revised too big to fail ordinance from the Swiss Federal Department of Finance. 2 Includes the effect of the countercyclical buffer requirement. 3 Does not include a countercyclical buffer requirement as potential future requirements cannot be accurately predicted. 4 This requirement may be reduced by a resolvability rebate. 5 CET1 capital can be substituted by high-trigger loss-absorbing capital up to the stated percentage. 6 Low-trigger additional tier 1 capital instruments will continue to qualify as going concern capital until their first call date. 7 Any high- and low-trigger tier 2 capital instruments remaining after 2019 will qualify for the gone concern requirement until one year before maturity. 8 Based on the draft ordinance which proposes an effective date of 1 July 2016.
3.5%
Buffer: high-trigger additional tier 1 capital6
Proposed changes to capital and leverage ratio requirements and regulationIn December 2015, the Swiss Federal Department of Finance pub-lished for consultation a draft revised too big to fail (TBTF) ordi-nance based on the cornerstones announced by the Swiss Federal Council in October 2015. In line with the announced corner-stones, the proposal would revise the capital and leverage ratio requirements for Swiss SRBs and includes new gone concern requirements. Additionally, the BCBS and other financial regula-tors are considering changes to the Basel III capital framework. We expect that if the BCBS proposals are adopted in their current form and implemented in Switzerland, the proposed changes to the capital framework would likely result in a significant increase in our overall RWA.
The revised regulation is also expected to include additional countercyclical buffer capital requirements introduced by other BCBS member jurisdictions. The effect upon implementation of this change is expected to be insignificant.
➔ Refer to the “Regulatory and legal developments” section of our
Annual Report 2015 for more information on the new Swiss too
big to fail proposal
➔ Refer to the “Recent developments” section of this report for
more information on proposed changes to the Basel Committee
on Banking Supervision capital framework
During the first quarter of 2016, we issued the equivalent of CHF 1.3 billion of senior unsecured debt that will contribute to our total loss-absorbing capacity (TLAC) under the proposed regulations.
➔ Refer to the “Liquidity and funding management” section of this
report for more information on our debt issuances

Capital management
80
Under the current Swiss SRB framework, banks are eligible for a capital rebate on the progressive buffer if they take actions that facilitate recovery and resolvability beyond the minimum require-ments to ensure the integrity of systemically important functions in the case of an impending insolvency. FINMA has confirmed that the measures we have taken and are taking to enhance our resolvability are in principle suitable to warrant a rebate under the current Swiss capital regulation. Therefore, we expect that the
Group will qualify for a rebate on the gone concern requirements under the revised Swiss TBTF proposal, which should result in lower overall capital requirements for the Group. The amount and timing of any such rebate will depend on the execution of these measures.
➔ Refer to the “The legal structure of UBS Group” section of our
Annual Report 2015 for more information on changes to our
legal structure
Swiss SRB capital ratio requirements and information (phase-in)
Capital ratio (%) Capital
Requirement1 Actual2 Requirement Eligible2
CHF million, except where indicated 31.3.16 31.3.16 31.12.15 31.3.16 31.3.16 31.12.15
Base capital (common equity tier 1 capital) 4.5 4.5 4.5 9,742 9,742 9,554
Buffer capital (common equity tier 1 capital and high-trigger loss-absorbing capital) 6.43 15.2 16.8 13,945 32,958 35,564
of which: effect of countercyclical buffer 0.2 0.2 0.2 415 415 356
Progressive buffer capital (low-trigger loss-absorbing capital) 3.4 5.5 5.0 7,355 11,953 10,679
Phase-out capital (tier 2 capital) 0.4 0.5 947 996
Total 14.3 25.7 26.8 31,043 55,601 56,792
1 Prior to the implementation of the Swiss SRB framework, FINMA also defined a total capital ratio target for UBS Group of 14.4%, which will be effective until it is exceeded by the Swiss SRB phase-in requirement. 2 Swiss SRB CET1 capital exceeding the base capital requirement is allocated to the buffer capital. 3 CET1 capital can be substituted by high-trigger loss-absorbing capital up to 2.6% in 2016.

Risk
, tre
asur
y an
d ca
pita
l man
agem
ent
81
Swiss SRB capital information
In this section, we disclose capital information on a consolidated UBS Group basis. Capital information for UBS AG on a consoli-dated basis will be provided in the document “UBS AG first quar-ter 2016 report,” which will be available from 6 May 2016 in “Quarterly reporting” at www.ubs.com/investors.
Capital ratios
In the first quarter of 2016, our fully applied CET1 capital ratio decreased 0.5 percentage points to 14.0%, resulting from a CHF 6.1 billion increase in RWA and a CHF 0.2 billion decrease in CET1 capital. On a phase-in basis, our CET1 capital ratio decreased 2.1 percentage points to 16.9%, due to a decrease of CHF 3.8 billion in phase-in CET1 capital, mainly driven by the additional phase-in effect of capital deductions for deferred tax assets (DTAs) and goodwill, which increased from 40% to 60% effec-tive 1 January 2016.
Our tier 1 capital ratio increased 0.1 percentage points to 17.5% on a fully applied basis as the issuance of additional tier 1 (AT1) capital in March 2016 was largely offset by the aforemen-tioned increase in RWA and decrease in CET1 capital. On a phase-in basis, our tier 1 capital ratio decreased 0.9 percentage points to 20.1%.
Our total capital ratio decreased 0.2 percentage points to 22.7% on a fully applied basis and 1.1 percentage points to 25.7% on a phase-in basis as of 31 March 2016.
Post-stress CET1 capital ratioWe are committed to total capital returns to shareholders of at least 50% of net profit attributable to shareholders, provided that we maintain a fully applied CET1 capital ratio of at least 13% and consistent with our objective of maintaining a post-stress fully applied CET1 capital ratio of at least 10%. Our post-stress CET1 capital ratio exceeded the 10% objective as of 31 March 2016.

Capital management
82
Swiss SRB capital information
Phase-in Fully applied
CHF million, except where indicated 31.3.16 31.12.15 31.3.16 31.12.15
Common equity tier 1 capital
Total common equity tier 1 capital 36,580 40,378 29,853 30,044
Additional tier 1 capital
High-trigger loss-absorbing capital 5,225 3,828 5,225 3,828
Low-trigger loss-absorbing capital1 1,736 353 2,360 2,326
Total additional tier 1 capital2 6,961 4,181 7,585 6,154
Total tier 1 capital 43,541 44,559 37,438 36,198
Tier 2 capital
High-trigger loss-absorbing capital 895 912 895 912
Low-trigger loss-absorbing capital 10,217 10,325 10,217 10,325
Phase-out capital 947 996
Total tier 2 capital 12,059 12,233 11,112 11,237
Total capital 55,601 56,792 48,551 47,435
Risk-weighted assets 216,493 212,302 213,558 207,530
Common equity tier 1 capital ratio (%) 16.9 19.0 14.0 14.5
Tier 1 capital ratio (%) 20.1 21.0 17.5 17.4
Total capital ratio (%) 25.7 26.8 22.7 22.9
1 Consists on a phase-in basis of low-trigger loss-absorbing capital (31 March 2016: CHF 2,360 million, 31 December 2015: CHF 2,326 million) partly offset by required deductions for goodwill (31 March 2016: CHF 624 million, 31 December 2015: CHF 1,973 million). 2 Includes on a phase-in basis hybrid capital subject to phase-out (31 March 2016: CHF 1,904 million, 31 December 2015: CHF 1,954 million), offset by required deductions for goodwill.
Eligible capital
In order to ensure the consistency and comparability of regulatory capital instrument disclosures for all market participants, BIS and FINMA Pillar 3 rules require banks and banking groups to disclose the main features of eligible capital instruments and their terms and conditions, which we provide on our website.
➔ Refer to “Bondholder information” at www.ubs.com/investors
for more information on the capital instruments of UBS Group
and UBS AG
➔ Refer to “UBS Switzerland AG (standalone) regulatory informa-
tion,” which will be available from 6 May 2016 in “Disclosure for
subsidiaries and branches” at www.ubs.com/investors, for more
information on the capital instruments of UBS Switzerland AG
Tier 1 capitalOur tier 1 capital consists of CET1 capital and AT1 capital. During the first quarter of 2016, our fully applied CET1 capital decreased by CHF 0.2 billion to CHF 29.9 billion, mainly as the first quarter operating profit before tax was more than offset by negative for-eign currency translation effects, accruals for capital returns to shareholders and current tax effects. Our phase-in CET1 capital
decreased by CHF 3.8 billion to CHF 36.6 billion, primarily due to an increase in the phase-in effect of the deductions for DTAs and goodwill, which increased from 40% to 60%. The increase in the goodwill deduction from CET1 capital resulted in a corresponding decrease in the goodwill deduction from AT1 capital.
Our AT1 capital increased by CHF 1.4 billion to CHF 7.6 billion on a fully applied basis, and included CHF 5.2 billion of high-trigger loss-absorbing capital and CHF 2.4 billion of low-trigger loss-absorbing capital. The increase during the first quarter was driven by the issuance of AT1 capital in March 2016 in the form of US dollar-denominated high-trigger perpetual capital notes equivalent to CHF 1.4 billion, with a write-down threshold set at a 7% phase-in CET1 capital ratio.
As of 31 March 2016, our high-trigger loss-absorbing AT1 capital included CHF 1.0 billion in deferred contingent capital plan (DCCP) awards granted for the performance years 2014 and 2015.
On a phase-in basis, AT1 capital increased by CHF 2.8 billion to CHF 7.0 billion as of 31 March 2016, due to the aforementioned issuance of AT1 capital in March 2016 and the aforementioned reduction in the phase-in effect of the deduction for goodwill from 60% to 40%.

Risk
, tre
asur
y an
d ca
pita
l man
agem
ent
83
Swiss SRB capital movement
CHF million Phase-in Fully applied
Common equity tier 1 capital as of 31.12.15 40,378 30,044
Operating profit / (loss) before tax 978 978
Current tax effects1 (177) (177)
Deferred tax assets recognized for tax loss carry-forwards, additional phase-in effect as of 1.1.16 (from 40% to 60%) (1,494)
Deferred tax assets recognized for temporary differences, additional phase-in effect as of 1.1.16 (from 40% to 60%) (351)
Deferred tax assets recognized for temporary differences (295) 54
Defined benefit plans (159) (129)
Goodwill, net of tax, less hybrid capital and low-trigger loss-absorbing capital2 (1,399)
Foreign currency translation effects (481) (336)
Other3 (420) (581)
Total movement (3,797) (191)
Common equity tier 1 capital as of 31.3.16 36,580 29,853
Additional tier 1 capital as of 31.12.15 4,181 6,154
Issuance of high-trigger loss-absorbing capital 1,424 1,424
Goodwill, net of tax, offset against hybrid capital and low-trigger loss-absorbing capital2 1,399
Foreign currency translation effects and other (42) 8
Total movement 2,780 1,431
Additional tier 1 capital as of 31.3.16 6,961 7,585
Tier 2 capital as of 31.12.15 12,233 11,237
Foreign currency translation effects and other (174) (125)
Total movement (174) (125)
Tier 2 capital as of 31.3.16 12,059 11,112
Total capital as of 31.3.16 55,601 48,5511 IFRS tax expense of CHF 270 million in the first quarter of 2016 includes current taxes of CHF 177 million and deferred taxes of CHF 93 million, of which CHF 65 million relates to the amortization of deferred tax assets previously recognized and CHF 28 million relates to other deferred tax movements. 2 As of 31 March 2016, the phase-in deduction applied to CET1 capital was 60% and to AT1 capital 40%; as of 31 December 2015, the phase-in deduction applied to CET1 capital was 40% and to AT1 capital 60%. 3 Includes accruals for capital returns to shareholders.
Tier 2 capitalDuring the first quarter of 2016, our tier 2 capital decreased by CHF 0.1 billion to CHF 11.1 billion on a fully applied basis and decreased by CHF 0.2 billion to CHF 12.1 billion on a phase-in basis. As of 31 March 2016, our fully applied tier 2 capital included CHF 10.2 billion of low-trigger loss-absorbing capital in the form of one euro-denominated and four US dollar-denominated subor-
dinated notes and CHF 0.9 billion of high-trigger loss-absorbing capital in the form of DCCP awards granted for the performance years 2012 and 2013.
The remainder of tier 2 capital of CHF 0.9 billion on a phase-in basis consisted of outstanding tier 2 instruments which will be phased out by 2019.

Capital management
84
Reconciliation IFRS equity to Swiss SRB capital
Phase-in Fully applied
CHF million 31.3.16 31.12.15 31.3.16 31.12.15
Total IFRS equity 56,786 57,308 56,786 57,308
Equity attributable to non-controlling interests (1,941) (1,995) (1,941) (1,995)
Defined benefit plans (before phase-in, as applicable)1 0 (50)
Defined benefit plans, phase-in2 0 (20)
Deferred tax assets recognized for tax loss carry-forwards (before phase-in, as applicable) (7,560) (7,468)
Deferred tax assets recognized for tax loss carry-forwards, phase-in2 (4,535) (2,988)
Deferred tax assets on temporary differences, excess over threshold (927) (702) (2,101) (2,598)
Goodwill, net of tax, less hybrid capital and low-trigger loss-absorbing capital3 (3,793) (2,618) (6,322) (6,545)
Intangible assets, net of tax (290) (323) (290) (323)
Unrealized (gains) / losses from cash flow hedges, net of tax (2,151) (1,638) (2,151) (1,638)
Compensation and own shares-related capital components4 (1,255) (2,152) (1,255) (2,152)
Unrealized own credit related to financial liabilities designated at fair value and replacement values, net of tax (548) (442) (548) (442)
Unrealized gains related to financial assets available for sale, net of tax (413) (402) (413) (402)
Prudential valuation adjustments (86) (83) (86) (83)
Consolidation scope (138) (130) (138) (130)
Accruals for proposed dividends to shareholders for 2015 (3,188) (3,188) (3,188) (3,188)
Other5 (939) (249) (939) (249)
Total common equity tier 1 capital 36,580 40,378 29,853 30,044
High-trigger loss-absorbing capital 5,225 3,828 5,225 3,828
Low-trigger loss-absorbing capital 2,360 2,326 2,360 2,326
Hybrid capital subject to phase-out 1,904 1,954
Goodwill, net of tax, offset against hybrid capital and low-trigger loss-absorbing capital (2,529) (3,927)
Total additional tier 1 capital 6,961 4,181 7,585 6,154
Total tier 1 capital 43,541 44,559 37,438 36,198
Total tier 2 capital 12,059 12,233 11,112 11,237
Total capital 55,601 56,792 48,551 47,435
1 Phase-in number net of tax, fully applied number pre-tax. 2 As of 31 March 2016, the phase-in deduction applied was 60%; as of 31 December 2015, the phase-in deduction applied was 40%. 3 Includes goodwill related to significant investments in financial institutions of CHF 347 million. 4 Includes the net expense for the compensation-related increase in high-trigger loss-absorbing capital for tier 2 and additional tier 1 capital. 5 Includes accruals for dividends to shareholders for the current year and other items.
In order to fulfill BIS and FINMA Pillar 3 composition of capital disclosure requirements, we disclose a full reconciliation of all regulatory capital elements to the published IFRS balance sheet.
In addition, BIS and Swiss SRB rules require banks to disclose differences between the accounting scope of consolidation and the regulatory scope of consolidation.
The scope of consolidation for the purpose of calculating Group regulatory capital is generally the same as the scope under IFRS and includes subsidiaries directly or indirectly controlled by UBS Group AG that are active in the banking and finance sector. However, subsidiaries consolidated under IFRS that are active in
sectors other than banking and finance are excluded from the regulatory scope of consolidation.
➔ Refer to the “Pillar 3, SEC filings & other disclosures” section at
www.ubs.com/investors
➔ Refer to “Note 1 Summary of significant accounting policies”
and “Note 30 Interests in subsidiaries and other entities”
in the “Consolidated financial statements” section of our
Annual Report 2015 and to the “UBS Group AG consolidated
supplemental disclosures required under Basel III Pillar 3
regulations” in the “Additional regulatory information”
section of our Annual Report 2015 for more information

Risk
, tre
asur
y an
d ca
pita
l man
agem
ent
85
Additional capital information
Sensitivity to currency movementsCorporate Center – Group Asset and Liability Management (Group ALM) is mandated to minimize the adverse effects from changes in currency rates on our fully applied CET1 capital and CET1 capital ratio. The Group Asset and Liability Management Committee, a committee of the UBS Group Executive Board, can adjust the currency mix in capital, within limits set by the Board of Directors, to balance the effect of foreign exchange movements on the fully applied CET1 capital and capital ratio. Limits are in place for the sensitivity of both CET1 capital and the capital ratio to an appreciation or depreciation of 10% in the value of the Swiss franc against other currencies.
We estimate that a 10% depreciation of the Swiss franc against other currencies would have increased our fully applied RWA by CHF 9.2 billion and our fully applied CET1 capital by CHF 874 million as of 31 March 2016 (31 December 2015: CHF 9.1 billion and CHF 933 million, respectively) and reduced our fully applied CET1 capital ratio by 19 basis points (31 December 2015: 17 basis points). Conversely, we estimate that a 10% appreciation of the Swiss franc against other currencies would have reduced our fully applied RWA by CHF 8.4 billion and our fully applied CET1 capital by CHF 791 million (31 December 2015: CHF 8.2 billion and CHF 844 million, respectively) and increased our fully applied CET1 capital ratio by 18 basis points (31 December 2015: 17 basis points).
Our leverage ratio is also sensitive to foreign exchange move-ments due to the currency mix of our capital and LRD. When adjusting the currency mix in capital, potential effects on the leverage ratios are taken into account and the sensitivity of the leverage ratio to an appreciation or depreciation of 10% in the value of the Swiss franc against other currencies is actively moni-tored.
We estimate that a 10% depreciation of the Swiss franc against other currencies would have increased our fully applied LRD by CHF 71 billion (31 December 2015: CHF 70 billion) and reduced our fully applied Swiss SRB leverage ratio by 11 basis points (31 December 2015: 11 basis points). Conversely, we esti-mate that a 10% appreciation of the Swiss franc against other currencies would have reduced our fully applied LRD by CHF 64 billion (31 December 2015: CHF 63 billion) and increased our fully applied Swiss SRB leverage ratio by 11 basis points (31 December 2015: 12 basis points).
These sensitivities do not consider foreign currency translation effects related to defined benefit plans other than those related to the currency translation of the net equity of foreign operations.
Advanced measurement approach modelWe have estimated the loss in capital that we could incur as a result of the risks associated with the matters described in “Note 16 Provisions and contingent liabilities” to our consoli-dated financial statements. This is an estimated amount and is not related and should not be considered in addition to these provi-sions and contingent liabilities. We have utilized for this purpose the advanced measurement approach (AMA) methodology that we use when determining the capital requirements associated with operational risks, based on a 99.9% confidence level over a 12-month horizon. The methodology takes into consideration UBS and industry experience for the AMA operational risk catego-ries to which those matters correspond, as well as the external environment affecting risks of these types, in isolation from other areas. On this standalone basis, we estimate the loss in capital that we could incur over a 12-month period as a result of our risks associated with these operational risk categories at CHF 4.6 bil-lion as of 31 March 2016. This estimate does not take into account any provisions recognized for any of these matters and does not constitute a subjective assessment of UBS’s actual exposure in any of these matters.
The increase in the estimated loss of capital of CHF 0.9 billion compared with the calculation as of 31 December 2015 was due to the implementation of a revised AMA model, which has been approved by FINMA and was implemented for use in regulatory capital calculations as of 31 March 2016. Concurrently, FINMA agreed to remove the incremental operational risk charge of CHF 1.1 billion to our AMA-based operational risk-related RWA in rela-tion to known or unknown litigation, compliance and other oper-ational risk matters, which was not an element of our previous AMA model.
➔ Refer to “Operational risk” in the “Risk management and
control” section of this report for more information
➔ Refer to “Note 16 Provisions and contingent liabilities” in the
“Consolidated financial statements” section of this report for
more information
Legal entity capital informationSelected capital information for UBS AG, UBS Switzerland AG and UBS Limited on a standalone basis is disclosed in the “Legal entity financial and regulatory information” section of this report.
➔ Refer to the “Legal entity financial and regulatory information”
section of this report, and to the documents “UBS AG first
quarter 2016 report” and “UBS Switzerland AG (standalone)
regulatory information,” which will be available from 6 May
2016 in “Quarterly reporting” and in “Disclosure for subsidiaries
and branches” at www.ubs.com/investors, for more information

Capital management
86
Differences between Swiss SRB and BIS capital
Our Swiss SRB and BIS capital is the same on both a fully applied and a phase-in basis, except for two specific tier 2 capital items. First, as of 31 March 2016, the amount of our tier 2 high-trigger loss-absorbing capital, in the form of DCCP awards granted for
the performance years 2012 and 2013, was CHF 622 million higher under Swiss SRB rules than under BIS rules. Second, a por-tion of unrealized gains on financial assets available for sale, total-ing CHF 218 million as of 31 March 2016, was recognized as tier 2 capital under BIS rules, but not under Swiss SRB regulations.
Differences between Swiss SRB and BIS capital information
As of 31.3.16 Phase-in Fully applied
CHF million, except where indicated Swiss SRB BIS Differences Swiss SRB BIS Differences
Common equity tier 1 capital
Total common equity tier 1 capital 36,580 36,580 0 29,853 29,853 0
Additional tier 1 capital
High-trigger loss-absorbing capital 5,225 5,225 0 5,225 5,225 0
Low-trigger loss-absorbing capital 1,736 1,736 0 2,360 2,360 0
Total additional tier 1 capital 6,961 6,961 0 7,585 7,585 0
Total tier 1 capital 43,541 43,541 0 37,438 37,438 0
Tier 2 capital
High-trigger loss-absorbing capital 895 273 622 895 273 622
Low-trigger loss-absorbing capital 10,217 10,217 0 10,217 10,217 0
Phase-out capital and other tier 2 capital 947 1,165 (218) 218 (218)
Total tier 2 capital 12,059 11,655 404 11,112 10,708 404
Total capital 55,601 55,196 405 48,551 48,146 405
Risk-weighted assets 216,493 216,493 0 213,558 213,558 0
Common equity tier 1 capital ratio (%) 16.9 16.9 0.0 14.0 14.0 0.0
Tier 1 capital ratio (%) 20.1 20.1 0.0 17.5 17.5 0.0
Total capital ratio (%) 25.7 25.5 0.2 22.7 22.5 0.2

Risk
, tre
asur
y an
d ca
pita
l man
agem
ent
87
Risk-weighted assets
Our risk-weighted assets (RWA) are the same under Swiss SRB and BIS rules. RWA on a fully applied basis are the same as on a phase-in basis, except for differences related to defined benefit plans and deferred tax assets (DTAs) on temporary differences.
On a fully applied basis, any net defined benefit pension asset recognized in accordance with IAS 19 (revised) is fully deducted from CET1 capital. On a phase-in basis, the deduction of net defined benefit pension assets from capital is phased in, and the portion of the net defined benefit pension asset that is not yet deducted from CET1 capital is risk weighted at 100%.
On a fully applied basis, DTAs on temporary differences below the fully applied deduction threshold are risk weighted at 250%. On a phase-in basis, the amount that is risk weighted at 250% is higher due to the higher deduction threshold.
Due to the aforementioned differences, as of 31 March 2016, our phase-in RWA were CHF 2.9 billion higher than our fully applied RWA, entirely attributable to non-counterparty-related risk RWA.
RWA increased by CHF 6.1 billion to CHF 213.6 billion on a fully applied basis as of 31 March 2016, below our short- to medium-term expectation of around CHF 250 billion. On a phase-in basis, RWA increased by CHF 4.2 billion to CHF 216.5 billion as of 31 March 2016.
Fully applied risk-weighted assets CHF billion
31.3.15 30.6.15 31.12.15 31.3.1630.9.15
300
240
180
120
60
0
Credit risk Non-counterparty-related risk Market risk Operational risk
107
75
1513
210
104
75
1612
207
110
77
1611
214
108
75
1617
216
108
79
1515
216

Capital management
88
Credit risk
Credit risk RWA increased by CHF 5.4 billion to CHF 109.8 billion as of 31 March 2016, mainly due to book size and other increases of CHF 4.1 billion and regulatory add-ons of CHF 2.9 billion, partly offset by foreign currency translation effects of CHF 2.3 billion.
Book size and other increases of CHF 4.1 billion in credit risk RWA were driven by an increase in the Investment Bank of CHF 1.7 billion, mainly relating to a market-driven increase in positive replacement values of derivative exposures, as well as new securi-ties financing transactions with collateral arrangements that are ineligible under capital adequacy rules. Moreover, credit risk RWA in Personal & Corporate Banking increased by CHF 0.8 billion, largely due to a higher proportion of unsecured loans in the port-folio. Finally, an increase of CHF 0.8 billion in Corporate Center – Group ALM was largely driven by an increase in cash collateral pledged for derivative transactions.
The increase in credit risk RWA from regulatory add-ons of CHF 2.9 billion was mainly driven by an increase in the internal ratings-based (IRB) multiplier on Swiss residential mortgages of CHF 1.5 billion for Personal & Corporate Banking and CHF 0.4 billion for Wealth Management, as well as an increase in the IRB multiplier on Investment Bank exposures to corporates of CHF 0.9 billion. Since the first quarter of 2013, FINMA has required banks using the IRB approach to apply a bank-specific IRB multiplier when cal-culating RWA for owner-occupied Swiss residential mortgages, and has extended application of this approach to other exposures since the first quarter of 2015. These multipliers will continue to increase over time until phase-in implementation is complete by the end of the first quarter of 2019.
Non-counterparty-related risk
Fully applied non-counterparty-related risk RWA remained stable at CHF 15.9 billion. Phase-in non-counterparty-related risk RWA decreased by CHF 1.9 billion to CHF 18.8 billion, driven by a decrease in the RWA phase-in effect of DTAs on temporary differ-ences as the capital deduction increased from 40% to 60%.
Market risk
Market risk RWA decreased by CHF 0.7 billion to CHF 11.4 billion. The decrease was driven by methodology changes of CHF 1.2 bil-lion and book size and other reductions of CHF 1.1 billion, partly offset by the impact of a CHF 1.6 billion increase due to regula-tory add-ons.
Book size and other reductions of CHF 1.1 billion relate mainly to the Investment Bank, primarily from changes in the risk profile within Equities and Foreign Exchange, Rates and Credit.
Methodology changes led to a decrease in market risk RWA of CHF 1.2 billion due to a structural change made to the VaR model in the first quarter of 2016, resulting in a reduction in the regula-tory VaR and stressed VaR measures.
The increase in market risk RWA of CHF 1.6 billion due to reg-ulatory add-ons, primarily in the Investment Bank, Corporate Center – Group ALM and Corporate Center – Non-core and Leg-acy Portfolio, resulted from four new negative backtesting excep-tions in the quarter. This brought the total number of negative exceptions occurring within a 250-business-day window to eight, increasing the VaR multiplier used to convert regulatory VaR and stressed VaR to a capital charge from 3.0 to 3.75. The capital charge is multiplied by a fixed 1250% to obtain an RWA equiva-lent. This contributed to increases in both regulatory VaR and stressed VaR RWA, and correspondingly to an increased add-on for risks-not-in-VaR RWA, which is calculated as a percentage of regulatory VaR and stressed VaR RWA.
➔ Refer to “Market risk” in the “Risk management and control”
section of this report for more information
Operational risk
Operational risk RWA increased by CHF 1.4 billion to CHF 76.5 billion as of 31 March 2016, driven by changes to the advanced measurement approach (AMA) model used for the calculation of operational risk capital that were approved by FINMA in the first quarter of 2016. As a result of the model development, FINMA agreed to the removal of the incremental operational risk RWA, such that all operational risk-related regulatory capital require-ments are now calculated in the model.
➔ Refer to “Operational risk” in the “Risk management and
control” section of this report for more information
Risk-weighted assets movement by key driver – fully applied
CHF billionRWA as of
31.12.15Currency
effects
Methodology changes and
model updatesRegulatory
add-onsBook size and
otherRWA as of
31.3.16
Credit risk 104.4 (2.3) 0.7 2.9 4.1 109.8
Non-counterparty-related risk 15.9 (0.3) 0.3 15.9
Market risk 12.1 (1.2) 1.6 (1.1) 11.4
Operational risk 75.1 1.4 76.5
Total 207.5 (2.6) 0.9 4.5 3.3 213.6

Risk
, tre
asur
y an
d ca
pita
l man
agem
ent
89
Risk-weighted assets by exposure segment
31.3.16
CHF billionWealth
Management
WealthManagement
Americas
Personal &Corporate
Banking
AssetManage-
mentInvestment
BankCC –
Services
CC –Group
ALM
CC – Non-core and
LegacyPortfolio
TotalRWA
Total capitalrequirement1
Credit risk 13.1 8.4 35.2 1.5 37.6 1.4 5.7 6.9 109.8 15.7
Advanced IRB approach 8.9 3.2 33.0 0.9 33.7 0.2 4.2 4.6 88.6 12.7
Sovereigns 0.0 0.0 0.1 0.0 1.5 0.0 2.3 0.1 4.0 0.6
Banks 0.0 0.0 1.0 0.0 5.2 0.1 1.0 0.9 8.2 1.2
Corporates 0.6 0.0 15.2 0.0 24.1 0.0 0.9 1.5 42.3 6.1
Retail 7.7 3.0 15.1 0.0 0.0 0.0 0.0 0.0 25.8 3.7
Other2 0.7 0.1 1.6 0.9 2.9 0.1 0.1 2.0 8.3 1.2
Standardized approach 4.2 5.2 2.2 0.6 3.9 1.3 1.5 2.3 21.1 3.0
Sovereigns 0.3 0.0 0.0 0.0 0.1 0.0 0.0 0.0 0.4 0.1
Banks 0.1 0.4 0.1 0.1 0.1 0.1 0.1 0.2 1.1 0.2
Corporates 1.2 1.2 0.4 0.5 2.2 1.1 0.8 1.0 8.5 1.2
Central counterparties 0.0 0.0 0.0 0.0 1.7 0.0 0.5 0.4 2.6 0.4
Retail 2.2 3.4 0.2 0.0 0.0 0.0 0.0 0.0 5.8 0.8
Other2 0.4 0.1 1.4 0.0 (0.1) 0.0 0.1 0.8 2.7 0.4
Non-counterparty-related risk 0.1 0.0 0.1 0.0 0.0 18.6 0.0 0.0 18.8 2.7
Deferred tax assets recognized for temporary differences 0.0 0.0 0.0 0.0 0.0 10.9 0.0 0.0 10.9 1.6
Property, equipment and software 0.0 0.0 0.0 0.0 0.0 7.6 0.0 0.0 7.7 1.1
Other 0.1 0.0 0.0 0.0 0.0 0.0 0.0 0.0 0.2 0.0
Market risk 0.0 1.0 0.0 0.0 8.7 (2.8)3 1.3 3.2 11.4 1.6
Value-at-risk (VaR) 0.0 0.2 0.0 0.0 1.3 (0.9) 0.2 0.5 1.4 0.2
Stressed value-at-risk (SVaR) 0.0 0.3 0.0 0.0 2.8 (1.5) 0.3 0.9 2.8 0.4
Add-on for risks-not-in-VaR 0.0 0.0 0.0 0.0 2.9 0.0 0.1 1.0 4.0 0.6
Incremental risk charge (IRC) 0.0 0.4 0.0 0.0 1.4 (0.3) 0.7 0.3 2.4 0.4
Comprehensive risk measure (CRM) 0.0 0.0 0.0 0.0 0.0 0.0 0.0 0.1 0.1 0.0
Securitization / re-securitization in the trading book 0.0 0.0 0.0 0.0 0.2 0.0 0.0 0.5 0.7 0.1
Operational risk 12.9 12.7 1.6 0.9 17.1 9.7 0.1 21.5 76.5 11.0
Total RWA, phase-in 26.1 22.1 36.9 2.4 63.4 26.9 7.1 31.6 216.5 31.0
Phase-out items4 0.0 0.0 0.0 0.0 0.0 2.9 0.0 0.0 2.9
Total RWA, fully applied 26.1 22.1 36.9 2.4 63.4 24.0 7.1 31.6 213.6 1 Calculated on the basis of our Swiss SRB total capital requirement of 14.3% of RWA. 2 Includes securitization / re-securitization exposures in the banking book, equity exposures in the banking book according to the simple risk weight method, credit valuation adjustments, settlement risk and business transfers. 3 Corporate Center – Services market risk RWA were negative, as they included the effect of portfolio diversification across businesses. 4 Phase-out items are entirely related to non-counterparty-related risk RWA.

Capital management
90
Risk-weighted assets by exposure segment (continued)
31.12.15
CHF billionWealth
Management
WealthManagement
Americas
Personal &Corporate
Banking
AssetManage-
mentInvestment
BankCC –
Services
CC –Group
ALM
CC – Non-core and
LegacyPortfolio
TotalRWA
Total capitalrequirement1
Credit risk 12.6 8.5 32.9 1.7 35.5 1.3 5.0 6.9 104.4 13.2
Advanced IRB approach 8.5 3.4 31.2 1.0 32.0 0.2 3.9 5.0 85.2 10.8
Sovereigns 0.0 0.0 0.1 0.0 0.5 0.0 2.0 0.1 2.7 0.3
Banks 0.0 0.0 1.1 0.0 5.1 0.0 0.9 0.8 7.9 1.0
Corporates 0.5 0.0 15.1 0.0 23.5 0.0 1.0 1.7 41.8 5.3
Retail 7.4 3.3 13.6 0.0 0.0 0.0 0.0 0.0 24.2 3.1
Other2 0.6 0.1 1.4 1.0 2.9 0.1 0.1 2.3 8.6 1.1
Standardized approach 4.1 5.1 1.7 0.7 3.6 1.1 1.0 2.0 19.2 2.4
Sovereigns 0.2 0.0 0.0 0.0 0.0 0.0 0.0 0.0 0.3 0.0
Banks 0.1 0.4 0.1 0.1 0.1 0.1 0.0 0.2 1.1 0.1
Corporates 1.2 1.2 0.1 0.6 1.7 1.0 0.3 1.0 7.1 0.9
Central counterparties 0.0 0.0 0.0 0.0 1.8 0.0 0.7 0.3 2.8 0.4
Retail 2.3 3.4 0.1 0.0 0.0 0.0 0.0 0.0 5.8 0.7
Other2 0.3 0.1 1.4 0.0 (0.1) 0.0 0.0 0.4 2.1 0.3
Non-counterparty-related risk 0.1 0.0 0.1 0.0 0.1 20.5 0.0 0.0 20.7 2.6
Deferred tax assets on temporary differences 0.0 0.0 0.0 0.0 0.0 12.9 0.0 0.0 12.9 1.6
Property, equipment and software 0.0 0.0 0.0 0.0 0.0 7.5 0.0 0.0 7.6 1.0
Other 0.1 0.0 0.0 0.0 0.0 0.0 0.0 0.0 0.2 0.0
Market risk 0.0 1.0 0.0 0.0 10.5 (2.9)3 0.9 2.6 12.1 1.5
Value-at-risk (VaR) 0.0 0.2 0.0 0.0 1.6 (0.8) 0.1 0.4 1.5 0.2
Stressed value-at-risk (SVaR) 0.0 0.4 0.0 0.0 2.9 (1.4) 0.2 0.6 2.8 0.4
Add-on for risks-not-in-VaR 0.0 0.0 0.0 0.0 3.3 0.0 0.1 0.8 4.2 0.5
Incremental risk charge (IRC) 0.0 0.4 0.0 0.0 2.5 (0.8) 0.5 0.2 2.7 0.3
Comprehensive risk measure (CRM) 0.0 0.0 0.0 0.0 0.0 0.0 0.0 0.1 0.1 0.0
Securitization / re-securitization in the trading book 0.0 0.0 0.0 0.0 0.2 0.0 0.0 0.5 0.7 0.1
Operational risk 12.6 12.4 1.6 0.9 16.8 9.5 0.1 21.1 75.1 9.5
Total RWA, phase-in 25.3 21.9 34.6 2.6 62.9 28.3 6.0 30.7 212.3 26.8
Phase-out items4 0.0 0.0 0.0 0.0 0.0 4.7 0.0 0.0 4.8
Total RWA, fully applied 25.3 21.9 34.6 2.6 62.9 23.6 6.0 30.7 207.5 1 Calculated on the basis of our Swiss SRB total capital requirement of 12.6% of RWA. 2 Includes securitization / re-securitization exposures in the banking book, equity exposures in the banking book according to the simple risk weight method, credit valuation adjustments, settlement risk and business transfers. 3 Corporate Center – Services market risk RWA were negative, as they included the effect of portfolio diversification across businesses. 4 Phase-out items are entirely related to non-counterparty-related risk RWA.

Risk
, tre
asur
y an
d ca
pita
l man
agem
ent
91
Risk-weighted assets by exposure segment (continued)
31.3.16 vs 31.12.15
CHF billionWealth
Management
WealthManagement
Americas
Personal &Corporate
Banking
AssetManage-
ment
Invest-mentBank
CC –Services
CC –Group
ALM
CC – Non-core and
LegacyPortfolio
TotalRWA
Credit risk 0.5 (0.1) 2.3 (0.2) 2.1 0.1 0.7 0.0 5.4
Advanced IRB approach 0.4 (0.2) 1.8 (0.1) 1.7 0.0 0.3 (0.4) 3.4
Sovereigns 0.0 0.0 0.0 0.0 1.0 0.0 0.3 0.0 1.3
Banks 0.0 0.0 (0.1) 0.0 0.1 0.1 0.1 0.1 0.3
Corporates 0.1 0.0 0.1 0.0 0.6 0.0 (0.1) (0.2) 0.5
Retail 0.3 (0.3) 1.5 0.0 0.0 0.0 0.0 0.0 1.6
Other 0.1 0.0 0.2 (0.1) 0.0 0.0 0.0 (0.3) (0.3)
Standardized approach 0.1 0.1 0.5 (0.1) 0.3 0.2 0.5 0.3 1.9
Sovereigns 0.1 0.0 0.0 0.0 0.1 0.0 0.0 0.0 0.1
Banks 0.0 0.0 0.0 0.0 0.0 0.0 0.1 0.0 0.0
Corporates 0.0 0.0 0.3 (0.1) 0.5 0.1 0.5 0.0 1.4
Central counterparties 0.0 0.0 0.0 0.0 (0.1) 0.0 (0.2) 0.1 (0.2)
Retail (0.1) 0.0 0.1 0.0 0.0 0.0 0.0 0.0 0.0
Other 0.1 0.0 0.0 0.0 0.0 0.0 0.1 0.4 0.6
Non-counterparty-related risk 0.0 0.0 0.0 0.0 (0.1) (1.9) 0.0 0.0 (1.9)
Deferred tax assets on temporary differences 0.0 0.0 0.0 0.0 0.0 (2.0) 0.0 0.0 (2.0)
Property, equipment and software 0.0 0.0 0.0 0.0 0.0 0.1 0.0 0.0 0.1
Other 0.0 0.0 0.0 0.0 0.0 0.0 0.0 0.0 0.0
Market risk 0.0 0.0 0.0 0.0 (1.8) 0.1 0.4 0.6 (0.7)
Value-at-risk (VaR) 0.0 0.0 0.0 0.0 (0.3) (0.1) 0.1 0.1 (0.1)
Stressed value-at-risk (SVaR) 0.0 (0.1) 0.0 0.0 (0.1) (0.1) 0.1 0.3 0.0
Add-on for risks-not-in-VaR 0.0 0.0 0.0 0.0 (0.4) 0.0 0.0 0.2 (0.2)
Incremental risk charge (IRC) 0.0 0.0 0.0 0.0 (1.1) 0.5 0.2 0.1 (0.3)
Comprehensive risk measure (CRM) 0.0 0.0 0.0 0.0 0.0 0.0 0.0 0.0 0.0
Securitization / re-securitization in the trading book 0.0 0.0 0.0 0.0 0.0 0.0 0.0 0.0 0.0
Operational risk 0.3 0.3 0.0 0.0 0.3 0.2 0.0 0.4 1.4
Total RWA, phase-in 0.8 0.2 2.3 (0.2) 0.5 (1.4) 1.1 0.9 4.2
Phase-out items 0.0 0.0 0.0 0.0 0.0 (1.8) 0.0 0.0 (1.9)
Total RWA, fully applied 0.8 0.2 2.3 (0.2) 0.5 0.4 1.1 0.9 6.1

Capital management
92
Leverage ratio framework
0
2
4
6
8
10
3.4%
0.8%
0.6%
0.9%
1.1%1.5%
0.8%
0.7%
1.1%
1.3%
0.7%
1.1%1.0%
4.0% 4.2%
2.0%
1.5%
1.5%
5.0%
10.0%
1.1%
0.7%
0.5%
0.7%
3.0%
31.12.15 From 1.1.16(current)
20166
(proposed)31.12.19(current)
1.1.2020(proposed)
Our total Swiss SRB leverage ratio requirements1
1 In percent of the leverage ratio denominator (LRD). Proposed requirements for Swiss SRBs are based on the draft revised too big to fail ordinance from the Swiss Federal Department of Finance. 2 This requirement may be reduced by a resolvability rebate. 3 CET1 capital can be substituted by high-trigger loss-absorbing capital up to the stated percentage. 4 Low-trigger additional tier 1 capital instruments will continue to qualify as going concern capital until their first call date. 5 Any high- and low-trigger tier 2 capital instruments remaining after 2019 will qualify for the gone concern requirement until one year before maturity. 6 Based on the draft ordinance which proposes an effective date of 1 July 2016.
Goneconcern2
Going concern
Goneconcern
Going concern
Goneconcern2
Going concern
Goneconcern2
Going concern
Base: CET1 capital
TLAC-eligible senior unsecured debt 5Buffer: high-trigger loss-absorbing capital3Buffer: CET1 capital
Progressive buffer: low-trigger loss-absorbing capitalBase: high-trigger additional tier 1 capital4
Phase-in Fully applied
The Swiss SRB leverage ratio is calculated by dividing the sum of period-end CET1, AT1 and other loss-absorbing capital by the period-end leverage ratio denominator (LRD). Under BIS rules, only CET1 and AT1 capital are included in the numerator.
The LRD consists of IFRS on-balance sheet assets and off-bal-ance sheet items. Derivative exposures are adjusted for a number
of items, including replacement value and eligible cash variation margin netting, the current exposure method add-on and net notional amounts for written credit derivatives. The LRD further includes an additional charge for counterparty credit risk related to securities financing transactions.

Risk
, tre
asur
y an
d ca
pita
l man
agem
ent
93
The Swiss SRB leverage ratio requirement is equal to 24% of the capital ratio requirements, excluding the countercyclical buffer requirement. As of 31 March 2016, the effective total leverage ratio requirement was 3.4%, an increase of 0.4 percentage points from 31 December 2015. Our CET1 capital covered the leverage ratio requirements for the base and buffer capital components and the low-trigger loss-absorbing capital satisfied our leverage ratio requirement for the progressive buffer component. In addi-
Swiss SRB leverage ratio requirements and information (phase-in)
Swiss SRB leverage ratio (%) Swiss SRB leverage ratio capital
Requirement1 Actual2 Requirement Eligible2
CHF million, except where indicated 31.3.16 31.3.16 31.12.15 31.3.16 31.3.16 31.12.15
Base capital (common equity tier 1 capital) 1.1 1.1 1.1 9,828 9,828 9,763
Buffer capital (common equity tier 1 capital and high-trigger loss-absorbing capital) 1.53 3.6 3.9 13,650 32,872 35,354
Progressive buffer capital (low-trigger loss-absorbing capital) 0.8 1.3 1.2 7,420 11,953 10,679
Total 3.4 6.0 6.2 30,898 54,654 55,796
1 Requirements for base capital (24% of 4.5%), buffer capital (24% of 6.3%) and progressive buffer capital (24% of 3.4%). The total leverage ratio requirement of 3.4% is the current phase-in requirement according to the Swiss Capital Adequacy Ordinance. In addition, FINMA defined a total leverage ratio target of 3.5%, which will be effective until it is exceeded by the Swiss SRB phase-in requirement. 2 Swiss SRB CET1 capital exceeding the base capital requirement is allocated to the buffer capital. 3 CET1 capital can be substituted by high-trigger LAC up to 0.6% in 2016.
tion, high-trigger loss-absorbing capital is included in the buffer capital component for UBS Group.
➔ Refer to the documents “UBS AG first quarter 2016 report” and
“UBS Switzerland AG (standalone) regulatory information,”
which will be available from 6 May 2016 in “Quarterly reporting”
and “Disclosure for subsidiaries and branches” at www.ubs.com/
investors, for more information

Capital management
94
Leverage ratio information
In this section, we disclose leverage ratio information on a con-solidated UBS Group basis. Leverage ratio information for UBS AG on a consolidated basis will be provided in the document “UBS AG first quarter 2016 report,” which will be available from 6 May 2016 in “Quarterly reporting” at www.ubs.com/investors.
Swiss SRB leverage ratio
As of 31 March 2016, our Swiss SRB leverage ratio was 5.4% on a fully applied basis compared with 5.3% as of 31 December 2015. On a phase-in basis our Swiss SRB leverage ratio was 6.0% compared with 6.2%. The fully applied LRD increased by CHF 8.2 billion to CHF 905.8 billion and was below our short- to medium-term expectation of around CHF 950 billion. On a phase-in basis, the LRD increased by CHF 6.0 billion to CHF 910.0 billion. The increase in the fully applied LRD was driven by an increase in book size of CHF 32.4 billion, partly offset by currency effects of CHF 18.8 billion and incremental netting and collateral mitigation ben-efits of CHF 4.6 billion.
The book size increase was primarily due to an increase of CHF 16.8 billion in securities financing transaction (SFT) exposures, mainly in the Investment Bank, resulting from client-driven increases and an increase in externally sourced collateral required
to service client transactions due to a lower volume of available trading portfolio assets, as described below. In addition, on-bal-ance sheet exposures increased by CHF 10.0 billion, driven by an increase of CHF 25.1 billion in Corporate Center – Group ALM, mainly due to an increase in cash and balances with central banks and non-trading securities, largely due to a strengthening of our liquidity position in anticipation of requirements applicable to our US intermediate holding company from July 2016. This was partly offset by client-driven and active reductions of CHF 14.8 billion in trading portfolio assets in the Investment Bank, including a reduc-tion in trading portfolio assets held for hedging purposes. In addi-tion, derivative exposures increased by CHF 4.6 billion, also largely in the Investment Bank, mainly related to foreign exchange and interest rate contracts, primarily due to currency movements and shifts in yield curves, respectively.
The decrease related to incremental netting and collateral mit-igation benefits mainly reflected improved netting of long and short written credit derivative positions, as well as increased net-ting of eligible cash variation margin. In the aggregate, these changes reduced derivative exposures by CHF 3.6 billion.
➔ Refer to the “Balance sheet” section of this report for more
information on balance sheet movements
Leverage ratio denominator movement by key driver – fully applied
CHF billionLRD as of 31.12.15
Currency effects
Incrementalnetting and
collateral mitigation
Othermethodology
changesBook size and
otherLRD as of
31.3.16
On-balance sheet exposures (excluding derivative exposures and securities financing transactions)1 625.2 (12.1) (1.0) 10.0 622.1
Derivative exposures1 128.9 (3.1) (3.6) (0.8) 4.6 126.0
Securities financing transactions1 120.1 (3.0) 16.8 133.8
Off-balance sheet items 41.1 (1.2) 1.0 40.9
Deduction items (17.7) 0.6 0.1 (17.0)
Total 897.6 (18.8) (4.6) (0.8) 32.4 905.81 Excludes positive replacement values, cash collateral receivables on derivative instruments, cash collateral on securities borrowed, reverse repurchase agreements, margin loans and prime brokerage receivables related to securities financing transactions, which are presented separately under derivative exposures and securities financing transactions in this table.

Risk
, tre
asur
y an
d ca
pita
l man
agem
ent
95
Swiss SRB leverage ratio
CHF million, except where indicated 31.3.16 31.12.15
Total IFRS assets 966,873 942,819
Difference between IFRS and regulatory scope of consolidation1 (16,173) (16,763)
Less derivative exposures and securities financing transactions2 (328,632) (300,834)
On-balance sheet exposures (excluding derivative exposures and securities financing transactions) 622,069 625,222
Derivative exposures2 125,980 128,866
Securities financing transactions2 133,829 120,086
Off-balance sheet items 40,943 41,132
Items deducted from Swiss SRB tier 1 capital, phase-in (12,822) (11,291)
Total exposures (leverage ratio denominator), phase-in 910,000 904,014
Additional items deducted from Swiss SRB tier 1 capital, fully applied (4,199) (6,407)
Total exposures (leverage ratio denominator), fully applied 905,801 897,607
Phase-in
Common equity tier 1 capital 36,580 40,378
Loss-absorbing capital 18,073 15,418
Common equity tier 1 capital including loss-absorbing capital 54,654 55,796
Swiss SRB leverage ratio (%) 6.0 6.2
Fully applied
Common equity tier 1 capital 29,853 30,044
Loss-absorbing capital 18,698 17,391
Common equity tier 1 capital including loss-absorbing capital 48,551 47,435
Swiss SRB leverage ratio (%) 5.4 5.3
1 Represents the difference between the IFRS and the regulatory scope of consolidation, which is the applicable scope for the LRD calculation. 2 Consists of positive replacement values, cash collateral receivables on derivative instruments, cash collateral on securities borrowed, reverse repurchase agreements, margin loans and prime brokerage receivables related to securities financing transactions in accordance with the regulatory scope of consolidation, which are presented separately under derivative exposures and securities financing transactions in this table.

Capital management
96
Leverage ratio denominator by business division and Corporate Center unit
As of 31.3.16
CHF billionWealth
Management
WealthManagement
Americas
Personal &Corporate
BankingAsset
ManagementInvestment
BankCC –
Services
CC –Group
ALM
CC – Non-core and
LegacyPortfolio Total LRD
Total IFRS assets 118.2 59.0 140.2 12.1 256.6 22.2 258.8 99.8 966.9
Difference between IFRS and regulatory scope of consolidation1 (6.0) (0.2) 0.0 (9.5) (0.6) (0.1) 0.2 0.0 (16.2)
Less derivative exposures and securities financing transactions2 (2.7) (1.8) (1.9) 0.0 (161.0) 0.0 (67.2) (94.0) (328.6)
On-balance sheet exposures (excluding derivative exposures and securities financing transactions) 109.5 57.0 138.4 2.5 94.9 22.1 191.9 5.9 622.1
Derivative exposures2 4.5 1.7 2.4 0.0 83.5 0.0 2.4 31.4 126.0
Securities financing transactions2 0.0 1.1 0.0 0.0 61.7 0.0 68.0 3.0 133.8
Off-balance sheet items 3.4 1.1 11.5 0.0 22.0 0.0 2.1 0.8 40.9
Items deducted from Swiss SRB tier 1 capital, phase-in (12.8) (12.8)
Total exposures (leverage ratio denominator), phase-in 117.4 60.9 152.2 2.5 262.2 9.3 264.5 41.1 910.0
Additional items deducted from Swiss SRB tier 1 capital, fully applied (4.2) (4.2)
Total exposures (leverage ratio denominator), fully applied 117.4 60.9 152.2 2.5 262.2 5.1 264.5 41.1 905.8
As of 31.12.15
CHF billionWealth
Management
WealthManagement
Americas
Personal &Corporate
BankingAsset
ManagementInvestment
BankCC –
Services
CC –Group
ALM
CC – Non-core and
LegacyPortfolio Total LRD
Total IFRS assets 119.9 61.0 141.2 12.9 253.5 22.6 237.5 94.4 942.8
Difference between IFRS and regulatory scope of consolidation1 (6.0) (0.2) 0.0 (10.2) (0.7) 0.0 0.3 0.0 (16.8)
Less derivative exposures and securities financing transactions2 (2.0) (1.8) (2.7) 0.0 (139.4) 0.0 (67.0) (87.9) (300.8)
On-balance sheet exposures (excluding derivative exposures and securities financing transactions) 111.8 59.0 138.5 2.7 113.5 22.5 170.8 6.5 625.2
Derivative exposures2 4.0 1.7 3.5 0.0 81.8 0.0 1.5 36.3 128.9
Securities financing transactions2 0.0 1.1 0.0 0.0 48.6 0.0 67.8 2.5 120.1
Off-balance sheet items 3.2 1.0 11.9 0.0 24.1 0.0 0.0 0.8 41.1
Items deducted from Swiss SRB tier 1 capital, phase-in (11.3) (11.3)
Total exposures (leverage ratio denominator), phase-in 119.0 62.9 153.8 2.7 268.0 11.3 240.2 46.2 904.0
Additional items deducted from Swiss SRB tier 1 capital, fully applied (6.4) (6.4)
Total exposures (leverage ratio denominator), fully applied 119.0 62.9 153.8 2.7 268.0 4.8 240.2 46.2 897.61 Represents the difference between the IFRS and the regulatory scope of consolidation, which is the applicable scope for the LRD calculation. 2 Consists of positive replacement values, cash collateral receivables on derivative instruments, cash collateral on securities borrowed, reverse repurchase agreements, margin loans and prime brokerage receivables related to securities financing transactions in accordance with the regulatory scope of consolidation, which are presented separately under derivative exposures and securities financing transactions in this table.

Risk
, tre
asur
y an
d ca
pita
l man
agem
ent
97
BIS leverage ratio
BIS Basel III leverage ratio1
CHF million, except where indicated
Phase-in 31.3.16 31.12.15
Total tier 1 capital 43,541 44,559
Total exposures (leverage ratio denominator) 910,000 904,014
BIS Basel III leverage ratio (%) 4.8 4.9
Fully applied 31.3.16 31.12.15
Total tier 1 capital 37,438 36,198
Total exposures (leverage ratio denominator) 905,801 897,607
BIS Basel III leverage ratio (%) 4.1 4.0
1 Refer to the document “UBS Group AG (consolidated) regulatory information,” in the “Pillar 3, SEC filings & other disclosures” section at www.ubs.com/investors, for more information in line with FINMA disclosure requirements.

Capital management
98
Equity attribution and return on attributed equity
Average total equity attributed to the business divisions and Cor-porate Center increased by CHF 4.6 billion to CHF 47.9 billion dur-ing the first quarter of 2016. The increases in attributed equity for Corporate Center – Services, Group ALM, Wealth Management, Personal & Corporate Banking and the Investment Bank are largely due to changes in our equity attribution approach effective from the first quarter of 2016 as described in our Annual Report 2015.
➔ Refer to the “Capital management” section of our Annual Report
2015 for more information on the equity attribution framework
Average equity attributable to UBS Group AG shareholders increased to CHF 55.1 billion in the first quarter of 2016 from CHF 54.7 billion in the prior quarter. The difference between average equity attributable to UBS Group AG shareholders and average equity attributed to the business divisions and Corporate Center decreased to CHF 7.2 billion compared with CHF 11.4 billion.
Average attributed equity
For the quarter ended
CHF billion 31.3.16 31.12.15 31.3.15
Wealth Management 3.5 3.4 3.6
Wealth Management Americas 2.5 2.5 2.4
Personal & Corporate Banking 4.1 3.9 4.0
Asset Management 1.4 1.5 1.7
Investment Bank 7.7 7.3 7.3
Corporate Center 28.7 24.7 26.1
of which: Services 22.2 18.8 19.4
of which: Group items 21.0 17.3 18.2
of which: Group ALM 4.2 3.2 3.4
of which: Non-core and Legacy Portfolio 2.3 2.7 3.3
Average equity attributed to the business divisions and Corporate Center 47.9 43.3 45.1
Difference 7.2 11.4 6.4
Average equity attributable to UBS Group AG shareholders 55.1 54.7 51.5
Return on attributed equity and return on equity1
For the quarter ended
In % 31.3.16 31.12.15 31.3.15
Wealth Management 63.7 40.5 105.7
Wealth Management Americas 33.8 2.2 42.2
Personal & Corporate Banking 38.9 36.4 42.7
Asset Management 25.7 45.6 39.5
Investment Bank 13.1 4.4 42.0
UBS Group 5.1 6.9 15.4
1 Return on attributed equity shown for the business divisions and return on equity attributable to UBS Group AG shareholders shown for UBS Group. Return on attributed equity for Corporate Center is not shown, as it is not meaningful.

Risk
, tre
asur
y an
d ca
pita
l man
agem
ent
99
UBS shares
As of 31 March 2016, shares issued by UBS Group AG totaled 3,850,069,401 shares, reflecting an increase of 337,866 shares in the first quarter of 2016 due to the issuance of shares out of con-ditional share capital upon exercise of employee share options.
UBS Group AG shares are registered shares with a par value of CHF 0.10 per share. They are traded and settled as global regis-tered shares. Global registered shares provide direct and equal ownership for all shareholders, irrespective of the country and stock exchange on which they are traded. UBS Group AG shares
are listed on the SIX Swiss Exchange (SIX) and the New York Stock Exchange (NYSE).
Treasury shares, which are primarily held to hedge share deliv-ery obligations related to employee share and option participation plans, increased by 30,898,934 shares during the first quarter of 2016 and totaled 129,605,209 shares as of 31 March 2016. The increase was mainly due to the acquisition of treasury shares in relation to employee share-based compensation awards.
UBS Group share information
As of or for the quarter ended % change from
31.3.16 31.12.15 31.3.15 31.12.15
Shares issued 3,850,069,401 3,849,731,535 3,739,518,390 0
Treasury shares 129,605,209 98,706,275 85,258,884 31
Shares outstanding 3,720,464,192 3,751,025,260 3,654,259,506 (1)
Basic earnings per share (CHF)1 0.19 0.25 0.54 (24)
Diluted earnings per share (CHF)1 0.18 0.25 0.53 (28)
Equity attributable to UBS Group AG shareholders (CHF million) 54,845 55,313 52,359 (1)
Less: goodwill and intangible assets (CHF million)2 6,326 6,568 6,342 (4)
Tangible equity attributable to UBS Group AG shareholders (CHF million) 48,519 48,745 46,017 0
Total book value per share (CHF) 14.74 14.75 14.33 0
Tangible book value per share (CHF) 13.04 13.00 12.59 0
Share price (CHF) 15.49 19.52 18.32 (21)
Market capitalization (CHF million) 59,638 75,147 68,508 (21)
1 Refer to “Note 9 Earnings per share (EPS) and shares outstanding” in the “Consolidated financial statements” section of this report for more information on UBS Group AG (consolidated) EPS. 2 Goodwill and intan-gible assets used in the calculation of tangible equity attributable to UBS Group AG shareholders as of 31 March 2015 have been adjusted to reflect the non-controlling interests in UBS AG as of that date.
Ticker symbols UBS Group AG
Trading exchange SIX / NYSE Bloomberg Reuters
SIX Swiss Exchange UBSG UBSG VX UBSG.S
New York Stock Exchange UBS UBS UN UBS.N
Security identification codes
ISIN CH0244767585
Valoren 24 476 758
CUSIP CINS H42097 10 7


Consolidated
Unaudited
financial statements

Table of contents
UBS Group AG interim consolidated financial statements (unaudited)
103 Income statement104 Statement of comprehensive income106 Balance sheet108 Statement of changes in equity110 Statement of cash flows
112 1 Basis of accounting113 2 Segment reporting115 3 Net interest and trading income116 4 Net fee and commission income117 5 Other income118 6 Personnel expenses118 7 General and administrative expenses118 8 Income taxes119 9 Earnings per share (EPS) and shares outstanding120 10 Fair value measurement132 11 Derivative instruments133 12 Offsetting financial assets and financial liabilities135 13 Other assets and liabilities136 14 Financial liabilities designated at fair value136 15 Debt issued held at amortized cost137 16 Provisions and contingent liabilities147 17 Guarantees, commitments and
forward starting transactions148 18 Changes in organization and disposals149 19 Currency translation rates
UBS AG interim consolidated financial information (unaudited)
150 Comparison UBS Group AG (consolidated) vs UBS AG (consolidated)
152 Key figures

Con
solid
ated
fina
ncia
l sta
tem
ents
103
UBS Group AG interim consolidated financial statements (unaudited)
Income statement
For the quarter ended % change from
CHF million, except per share data Note 31.3.16 31.12.15 31.3.15 4Q15 1Q15
Interest income 3 3,407 3,363 3,172 1 7
Interest expense 3 (1,695) (1,604) (1,535) 6 10
Net interest income 3 1,712 1,759 1,637 (3) 5
Credit loss (expense) / recovery (3) (59) (16) (95) (81)
Net interest income after credit loss expense 1,709 1,700 1,621 1 5
Net fee and commission income 4 4,093 4,218 4,401 (3) (7)
Net trading income 3 1,013 898 2,135 13 (53)
Other income 5 17 (41) 685 (98)
Total operating income 6,833 6,775 8,841 1 (23)
Personnel expenses 6 3,924 3,843 4,172 2 (6)
General and administrative expenses 7 1,664 2,413 1,713 (31) (3)
Depreciation and impairment of property, equipment and software 243 260 221 (7) 10
Amortization and impairment of intangible assets 23 24 28 (4) (18)
Total operating expenses 5,855 6,541 6,134 (10) (5)
Operating profit / (loss) before tax 978 234 2,708 318 (64)
Tax expense / (benefit) 8 270 (715) 670 (60)
Net profit / (loss) 708 950 2,038 (25) (65)
Net profit / (loss) attributable to non-controlling interests 0 1 61 (100) (100)
Net profit / (loss) attributable to UBS Group AG shareholders 707 949 1,977 (26) (64)
Earnings per share (CHF)
Basic 9 0.19 0.25 0.54 (24) (65)
Diluted 9 0.18 0.25 0.53 (28) (66)

UBS Group AG interim consolidated financial statements (unaudited)
104
Statement of comprehensive income
For the quarter ended
CHF million 31.3.16 31.12.15 31.3.15
Comprehensive income attributable to UBS Group AG shareholders
Net profit / (loss) 707 949 1,977
Other comprehensive income that may be reclassified to the income statement
Foreign currency translation
Foreign currency translation movements, before tax (953) 571 (803)
Foreign exchange amounts reclassified to the income statement from equity 123 (115) 0
Income tax relating to foreign currency translation movements 5 (3) 3
Subtotal foreign currency translation, net of tax (825) 452 (799)
Financial assets available for sale
Net unrealized gains / (losses) on financial assets available for sale, before tax 253 (74) 216
Impairment charges reclassified to the income statement from equity 0 1 0
Realized gains reclassified to the income statement from equity (89) (23) (117)
Realized losses reclassified to the income statement from equity 13 12 15
Income tax relating to net unrealized gains / (losses) on financial assets available for sale (46) 26 (37)
Subtotal financial assets available for sale, net of tax 131 (59) 77
Cash flow hedges
Effective portion of changes in fair value of derivative instruments designated as cash flow hedges, before tax 944 (160) 256
Net (gains) / losses reclassified to the income statement from equity (303) (362) (237)
Income tax relating to cash flow hedges (127) 104 (4)
Subtotal cash flow hedges, net of tax 513 (419) 14
Total other comprehensive income that may be reclassified to the income statement, net of tax (181) (25) (708)
Other comprehensive income that will not be reclassified to the income statement
Defined benefit plans
Gains / (losses) on defined benefit plans, before tax (191) 203 720
Income tax relating to defined benefit plans 12 (1) (181)
Subtotal defined benefit plans, net of tax (179) 202 539
Own credit on financial liabilities designated at fair value
Gains / (losses) from own credit on financial liabilities designated at fair value, before tax 68
Income tax relating to own credit on financial liabilities designated at fair value (16)
Subtotal own credit on financial liabilities designated at fair value, net of tax 52
Total other comprehensive income that will not be reclassified to the income statement, net of tax (127) 202 539
Total other comprehensive income (308) 177 (169)
Total comprehensive income attributable to UBS Group AG shareholders 399 1,126 1,808

Con
solid
ated
fina
ncia
l sta
tem
ents
105
Statement of comprehensive income (continued)
For the quarter ended
CHF million 31.3.16 31.12.15 31.3.15
Comprehensive income attributable to non-controlling interests
Net profit / (loss) 0 1 61
Other comprehensive income that may be reclassified to the income statement
Other comprehensive income that may be reclassified to the income statement, before tax 0 0 5
Income tax relating to other comprehensive income that may be reclassified to the income statement 0 0 (1)
Total other comprehensive income that may be reclassified to the income statement, net of tax 0 0 3
Other comprehensive income that will not be reclassified to the income statement
Foreign currency translation movements, before tax (50) 37 (157)
Income tax relating to foreign currency translation movements 0 0 0
Subtotal foreign currency translation, net of tax (50) 37 (157)
Gains / (losses) on defined benefit plans, before tax 0 0 15
Income tax relating to defined benefit plans 0 0 (4)
Subtotal defined benefit plans, net of tax 0 0 11
Total other comprehensive income that will not be reclassified to the income statement, net of tax (50) 37 (146)
Total other comprehensive income (50) 37 (143)
Total comprehensive income attributable to non-controlling interests (50) 38 (81)
Total comprehensive income
Net profit / (loss) 708 950 2,038
Other comprehensive income (358) 214 (312)
of which: other comprehensive income that may be reclassified to the income statement (181) (25) (705)
of which: other comprehensive income that will not be reclassified to the income statement (177) 239 393
Total comprehensive income 349 1,164 1,726

UBS Group AG interim consolidated financial statements (unaudited)
106
Balance sheet
% change from
CHF million Note 31.3.16 31.12.15 31.12.15
Assets
Cash and balances with central banks 105,710 91,306 16
Due from banks 13,551 11,948 13
Loans 304,873 311,954 (2)
Cash collateral on securities borrowed 12 32,432 25,584 27
Reverse repurchase agreements 12 73,562 67,893 8
Trading portfolio assets 10 105,276 124,035 (15)
of which: assets pledged as collateral which may be sold or repledged by counterparties 32,549 51,943 (37)
Positive replacement values 10, 11, 12 180,518 167,435 8
Cash collateral receivables on derivative instruments 12 25,460 23,763 7
Financial assets designated at fair value 10, 12 40,976 6,146 567
Financial assets available for sale 10 31,266 62,543 (50)
Financial assets held to maturity 2,889
Investments in associates 953 954 0
Property, equipment and software 7,763 7,695 1
Goodwill and intangible assets 6,326 6,568 (4)
Deferred tax assets 12,192 12,835 (5)
Other assets 13 23,123 22,160 4
Total assets 966,873 942,819 3

Con
solid
ated
fina
ncia
l sta
tem
ents
107
Balance sheet (continued)
% change from
CHF million Note 31.3.16 31.12.15 31.12.15
Liabilities
Due to banks 11,350 11,836 (4)
Due to customers 401,504 390,185 3
Cash collateral on securities lent 12 6,353 8,029 (21)
Repurchase agreements 12 6,516 9,653 (32)
Trading portfolio liabilities 10 33,157 29,137 14
Negative replacement values 10, 11, 12 179,018 162,430 10
Cash collateral payables on derivative instruments 12 36,690 38,282 (4)
Financial liabilities designated at fair value 10, 12, 14 57,761 62,995 (8)
Debt issued 15 101,316 93,147 9
Provisions 16 3,961 4,164 (5)
Other liabilities 13 72,461 75,652 (4)
Total liabilities 910,088 885,511 3
Equity
Share capital 385 385 0
Share premium 30,784 31,164 (1)
Treasury shares (2,138) (1,693) 26
Retained earnings 30,041 29,504 2
Other comprehensive income recognized directly in equity, net of tax (4,228) (4,047) 4
Equity attributable to UBS Group AG shareholders 54,845 55,313 (1)
Equity attributable to non-controlling interests 1,941 1,995 (3)
Total equity 56,786 57,308 (1)
Total liabilities and equity 966,873 942,819 3

UBS Group AG interim consolidated financial statements (unaudited)
108
Statement of changes in equity
CHF millionShare
capitalShare
premiumTreasury
sharesRetainedearnings
Other comprehensiveincome recognized
directly in equity,net of tax1
of which:Foreign currency translation
of which:Financial assets
available for saleof which:
Cash flow hedges
Total equityattributable toUBS Group AG
shareholdersNon-controlling
interests Total equity
Balance as of 1 January 2015 372 32,590 (1,393) 22,134 (3,093) (5,406) 228 2,084 50,608 3,760 54,368
Issuance of share capital 0 0 0
Acquisition of treasury shares (1,056) (1,056) (1,056)
Disposal of treasury shares 930 930 930
Treasury share gains / (losses) and net premium / (discount) on own equity derivative activity (52) (52) (52)
Premium on shares issued and warrants exercised 8 8 8
Employee share and share option plans (272) (272) (272)
Tax (expense) / benefit recognized in share premium 8 8 8
Dividends 0 (5) (5)
Equity classified as obligation to purchase own shares (1) (1) (1)
Total comprehensive income for the period 2,516 (708) (799) 77 14 1,808 (81) 1,726
of which: Net profit / (loss) 1,977 1,977 61 2,038
of which: Other comprehensive income that may be reclassified to the income statement, net of tax (708) (799) 77 14 (708) 3 (705)
of which: Other comprehensive income that will not be reclassified to the income statement, net of tax – defined benefit plans 539 539 11 550
of which: Other comprehensive income that will not be reclassified to the income statement, net of tax – foreign currency translation 0 (157) (157)
Changes to legal structure / reorganization: Increase in UBS Group AG’s ownership interest in UBS AG 2 153 117 129 (25) (39) 1 12 376 (376) 0
Balance as of 31 March 2015 374 32,434 (1,402) 24,779 (3,826) (6,244) 306 2,111 52,359 3,298 55,656
Balance as of 1 January 2016 385 31,164 (1,693) 29,504 (4,047) (5,857) 172 1,638 55,313 1,995 57,308
Issuance of share capital 0 0 0
Acquisition of treasury shares (1,117) (1,117) (1,117)
Disposal of treasury shares 672 672 672
Treasury share gains / (losses) and net premium / (discount) on own equity derivative activity (12) (12) (12)
Premium on shares issued and warrants exercised 2 2 2
Employee share and share option plans (428) (428) (428)
Tax (expense) / benefit recognized in share premium 15 15 15
Dividends 0 (5) (5)
New consolidations / (deconsolidations) and other increases / (decreases) 43 (43) 0 0 0
Total comprehensive income for the period 580 (181) (825) 131 513 399 (50) 349
of which: Net profit / (loss) 707 707 0 708
of which: Other comprehensive income that may be reclassified to the income statement, net of tax (181) (825) 131 513 (181) (181)
of which: Other comprehensive income that will not be reclassified to the income statement, net of tax – defined benefit plans (179) (179) (179)
of which: Other comprehensive income that will not be reclassified to the income statement, net of tax – own credit 52 52 52
of which: Other comprehensive income that will not be reclassified to the income statement, net of tax – foreign currency translation 0 (50) (50)
Balance as of 31 March 2016 385 30,784 (2,138) 30,041 (4,228) (6,682) 303 2,151 54,845 1,941 56,7861 Excludes defined benefit plans and own credit that are recorded directly in Retained earnings.

Con
solid
ated
fina
ncia
l sta
tem
ents
109
Statement of changes in equity
CHF millionShare
capitalShare
premiumTreasury
sharesRetainedearnings
Other comprehensiveincome recognized
directly in equity,net of tax1
of which:Foreign currency translation
of which:Financial assets
available for saleof which:
Cash flow hedges
Total equityattributable toUBS Group AG
shareholdersNon-controlling
interests Total equity
Balance as of 1 January 2015 372 32,590 (1,393) 22,134 (3,093) (5,406) 228 2,084 50,608 3,760 54,368
Issuance of share capital 0 0 0
Acquisition of treasury shares (1,056) (1,056) (1,056)
Disposal of treasury shares 930 930 930
Treasury share gains / (losses) and net premium / (discount) on own equity derivative activity (52) (52) (52)
Premium on shares issued and warrants exercised 8 8 8
Employee share and share option plans (272) (272) (272)
Tax (expense) / benefit recognized in share premium 8 8 8
Dividends 0 (5) (5)
Equity classified as obligation to purchase own shares (1) (1) (1)
Total comprehensive income for the period 2,516 (708) (799) 77 14 1,808 (81) 1,726
of which: Net profit / (loss) 1,977 1,977 61 2,038
of which: Other comprehensive income that may be reclassified to the income statement, net of tax (708) (799) 77 14 (708) 3 (705)
of which: Other comprehensive income that will not be reclassified to the income statement, net of tax – defined benefit plans 539 539 11 550
of which: Other comprehensive income that will not be reclassified to the income statement, net of tax – foreign currency translation 0 (157) (157)
Changes to legal structure / reorganization: Increase in UBS Group AG’s ownership interest in UBS AG 2 153 117 129 (25) (39) 1 12 376 (376) 0
Balance as of 31 March 2015 374 32,434 (1,402) 24,779 (3,826) (6,244) 306 2,111 52,359 3,298 55,656
Balance as of 1 January 2016 385 31,164 (1,693) 29,504 (4,047) (5,857) 172 1,638 55,313 1,995 57,308
Issuance of share capital 0 0 0
Acquisition of treasury shares (1,117) (1,117) (1,117)
Disposal of treasury shares 672 672 672
Treasury share gains / (losses) and net premium / (discount) on own equity derivative activity (12) (12) (12)
Premium on shares issued and warrants exercised 2 2 2
Employee share and share option plans (428) (428) (428)
Tax (expense) / benefit recognized in share premium 15 15 15
Dividends 0 (5) (5)
New consolidations / (deconsolidations) and other increases / (decreases) 43 (43) 0 0 0
Total comprehensive income for the period 580 (181) (825) 131 513 399 (50) 349
of which: Net profit / (loss) 707 707 0 708
of which: Other comprehensive income that may be reclassified to the income statement, net of tax (181) (825) 131 513 (181) (181)
of which: Other comprehensive income that will not be reclassified to the income statement, net of tax – defined benefit plans (179) (179) (179)
of which: Other comprehensive income that will not be reclassified to the income statement, net of tax – own credit 52 52 52
of which: Other comprehensive income that will not be reclassified to the income statement, net of tax – foreign currency translation 0 (50) (50)
Balance as of 31 March 2016 385 30,784 (2,138) 30,041 (4,228) (6,682) 303 2,151 54,845 1,941 56,7861 Excludes defined benefit plans and own credit that are recorded directly in Retained earnings.

UBS Group AG interim consolidated financial statements (unaudited)
110
Statement of cash flows
Year-to-date
CHF million 31.3.16 31.3.15
Cash flow from / (used in) operating activities
Net profit / (loss) 708 2,038
Non-cash items included in net profit and other adjustments:
Depreciation and impairment of property, equipment and software 243 221
Amortization and impairment of intangible assets 23 28
Credit loss expense / (recovery) 3 16
Share of net profits of associates (18) (23)
Deferred tax expense / (benefit) 93 495
Net loss / (gain) from investing activities 779 (610)
Net loss / (gain) from financing activities 612 2,045
Other net adjustments (899) 6,353
Net change in operating assets and liabilities:
Due from / to banks (13) (93)
Cash collateral on securities borrowed and reverse repurchase agreements (16,074) (17,712)
Cash collateral on securities lent and repurchase agreements (3,941) 3,895
Trading portfolio and replacement values 22,774 521
Financial assets designated at fair value (35,242) (380)
Cash collateral on derivative instruments (2,404) 3,003
Loans 3,048 (3,461)
Due to customers 15,759 (6,188)
Other assets, provisions and other liabilities (1,268) 404
Income taxes paid, net of refunds (63) (36)
Net cash flow from / (used in) operating activities (15,880) (9,485)
Cash flow from / (used in) investing activities
Purchase of subsidiaries, associates and intangible assets 0 (38)
Disposal of subsidiaries, associates and intangible assets1 1 155
Purchase of property, equipment and software (432) (397)
Disposal of property, equipment and software 4 505
Purchase of financial assets available for sale (5,597) (46,274)
Disposal and redemption of financial assets available for sale 36,045 26,451
Net (purchase) / redemption of financial assets held to maturity (2,889)
Net cash flow from / (used in) investing activities 27,133 (19,599)
Table continues on the next page.

Con
solid
ated
fina
ncia
l sta
tem
ents
111
Statement of cash flows (continued)
Table continued from previous page.Year-to-date
CHF million 31.3.16 31.3.15
Cash flow from / (used in) financing activities
Net short-term debt issued / (repaid) 9,814 (3,584)
Net movements in treasury shares and own equity derivative activity (1,072) (673)
Issuance of long-term debt, including financial liabilities designated at fair value 15,904 16,414
Repayment of long-term debt, including financial liabilities designated at fair value (17,057) (13,592)
Net changes in non-controlling interests and preferred notes (5) (6)
Net cash flow from / (used in) financing activities 7,583 (1,441)
Effects of exchange rate differences on cash and cash equivalents (2,298) (3,813)
Net increase / (decrease) in cash and cash equivalents 16,538 (34,338)
Cash and cash equivalents at the beginning of the period 103,044 116,715
Cash and cash equivalents at the end of the period 119,582 82,377
Cash and cash equivalents comprise:
Cash and balances with central banks 105,710 68,854
Due from banks 12,805 11,712
Money market paper2 1,068 1,811
Total3 119,582 82,377
Additional information
Net cash flow from / (used in) operating activities include:
Cash received as interest 2,932 2,536
Cash paid as interest 1,488 1,364
Cash received as dividends on equity investments, investment funds and associates4 426 479
1 Includes dividends received from associates. 2 Money market paper is included in the balance sheet under Trading portfolio assets, Financial assets available for sale and Financial assets designated at fair value. 3 CHF 3,837 million and CHF 4,166 million of cash and cash equivalents (mainly reflected in Due from banks) were restricted as of 31 March 2016 and 31 March 2015. Refer to Note 25 in the Annual Report 2015 for more information. 4 Includes dividends received from associates reported within cash flow from / (used in) investing activities.

Notes to the UBS Group AG interim consolidated financial statements (unaudited)
112
Notes to the UBS Group AG interim consolidated financial statements (unaudited)
Note 1 Basis of accounting
The consolidated financial statements (the Financial Statements) of UBS Group AG and its subsidiaries (together “UBS” or “the Group”) are prepared in accordance with International Financial Reporting Standards (IFRS), as issued by the International Account-ing Standards Board (IASB), and are stated in Swiss francs (CHF), the currency of Switzerland where UBS Group AG is incorporated. These interim Financial Statements are prepared in accordance with IAS 34, Interim Financial Reporting.
In preparing these interim Financial Statements, the same accounting policies and methods of computation have been applied as in the UBS Group AG consolidated annual Financial Statements for the period ended 31 December 2015, except for the changes described below. These interim Financial Statements are unaudited and should be read in conjunction with UBS Group AG’s audited consolidated Financial Statements included in the Annual Report 2015. In the opinion of management, all necessary adjustments were made for a fair presentation of the Group’s financial position, results of operations and cash flows.
Preparation of these interim Financial Statements requires man-agement to make estimates and assumptions that affect the reported amounts of assets, liabilities, income, expenses and disclo-sures of contingent assets and liabilities. These estimates and assumptions are based on the best available information. Actual results in the future could differ from such estimates and such dif-ferences may be material to the Financial Statements. Revisions to estimates, based on regular reviews, are recognized in the period in which they occur. For more information on areas of estimation uncertainty considered to require critical judgment, refer to item 2 of “Note 1a) Significant accounting policies” in the audited “Con-solidated financial statements” section of the Annual Report 2015.
Own credit
In the first quarter of 2016, UBS adopted the own credit presenta-tion requirements of IFRS 9, Financial Instruments. Under these requirements of IFRS 9, changes in the fair value of financial liabil-ities designated at fair value through profit or loss related to own credit are recognized in Other comprehensive income directly within Retained earnings. As the Group does not hedge changes
in own credit arising on financial liabilities designated at fair value, presenting own credit within Other comprehensive income does not create or increase an accounting mismatch in the income statement. The unrealized and any realized own credit recognized in Other comprehensive income will not be reclassified to the Income statement in future periods. Changes in own credit pre-sented in prior periods have not been restated and remain within Net trading income. UBS will adopt the classification, measure-ment and impairment requirements of IFRS 9 as of the mandatory effective date of 1 January 2018.
➔ Refer to Note 10 for more information on own credit
Balance sheet classification of newly purchased high-quality liquid debt securities
Starting with the first quarter of 2016, UBS classifies newly pur-chased debt securities held as high-quality liquid assets (HQLA), and managed by Corporate Center – Group Asset and Liability Management (Group ALM), as either financial assets designated at fair value through profit or loss or financial assets held to matu-rity. Debt securities acquired prior to the first quarter of 2016 and held for liquidity purposes remain classified as financial assets available for sale.
Classification of debt securities as financial assets designated at fair value through profit or loss is applied for most debt securi-ties purchased starting with the first quarter of 2016, and is intended to reduce accounting mismatches by ensuring that changes in the fair value of the securities are recognized in the income statement in line with the associated interest rate deriva-tives used for risk management purposes. A small portion of newly purchased debt securities are classified as financial assets held to maturity, reflecting the intended holding period for these assets. These securities are non-derivative financial investments with fixed or determinable payments and fixed maturities that UBS has the positive intention and ability to hold until maturity. They are recognized on a settlement date basis and are recorded initially at fair value, together with any transaction costs directly attributable to the acquisition. Subsequently, the securities are measured at amortized cost using the effective interest method.

Con
solid
ated
fina
ncia
l sta
tem
ents
113
Note 2 Segment reporting
UBS‘s businesses are organized globally into five business divi-sions: Wealth Management, Wealth Management Americas, Per-sonal & Corporate Banking, Asset Management and the Invest-ment Bank, supported by Corporate Center. The five business divisions qualify as reportable segments for the purpose of seg-ment reporting and, together with Corporate Center and its units, reflect the management structure of the Group. The non-core activities and positions formerly in the Investment Bank are man-aged and reported in Corporate Center. Together with the Legacy Portfolio, these non-core activities and positions are reported as a separate reportable segment within Corporate Center as Non-core and Legacy Portfolio. Financial information about the five business divisions and Corporate Center (with its units) is pre-sented separately in internal management reports to the Group Executive Board, which is considered the “chief operating deci-sion maker” within the context of IFRS 8 Operating Segments.
UBS’s internal accounting policies, which include management accounting policies and service level agreements, determine the revenues and expenses directly attributable to each reportable segment. Internal charges and transfer pricing adjustments are reflected in operating results of the reportable segments. Transac-tions between the reportable segments are reflected in the oper-ating results of the reportable segments. Revenue-sharing agree-ments are used to allocate external client revenues to reportable segments where several reportable segments are providing ser-vices to the client. Commissions are credited to the reportable segments based on the corresponding client relationship. Net interest income is generally allocated to the reportable segments based on their balance sheet positions. Interest income earned from managing UBS’s consolidated equity is allocated to the reportable segments based on average attributed equity. Total
intersegment revenues for the Group are immaterial as the major-ity of the revenues are allocated across the segments by means of revenue-sharing agreements.
Assets and liabilities of the reportable segments are funded through, and invested with, Corporate Center – Group ALM and the net interest margin is reflected in the results of each report-able segment.
As part of the annual business planning cycle, Corporate Center – Services agrees with the business divisions and other Corporate Center units cost allocations for services at fixed amounts or at vari-able amounts based on fixed formulas, depending on capital and service consumption levels, as well as the nature of the services performed. Because actual costs incurred may differ from those expected, however, Corporate Center – Services may recognize sig-nificant under or over-allocations depending on various factors. Each year these cost allocations will be reset, taking account of the prior years’ experience and plans for the forthcoming period.
Segment balance sheet assets do not include intercompany balances. This view is in line with internal reporting to manage-ment. Certain assets managed centrally by Corporate Center – Services and Corporate Center – Group ALM (including property, equipment and software and certain financial assets) are allocated to the segments on a basis different to which the corresponding costs and / or revenues are allocated. Specifically, certain assets are reported in Corporate Center – Services and Corporate Center – Group ALM, whereas the corresponding costs and / or revenues are entirely or partly allocated to the segments based on various internally determined allocations. Similarly, certain assets are reported in the business divisions, whereas the corresponding costs and / or revenues are entirely or partly allocated to Corporate Center – Services.

Notes to the UBS Group AG interim consolidated financial statements (unaudited)
114
Note 2 Segment reporting (continued)
WealthManagement
WealthManagement
Americas
Personal & Corporate
BankingAsset
ManagementInvestment
Bank Corporate Center UBS
CHF million Services Group ALM
Non-core and Legacy
Portfolio
For the quarter ended 31 March 2016
Net interest income 474 327 477 (7) 312 (89) 243 (23) 1,712
Non-interest income 1,305 1,542 392 474 1,624 14 (224) (3) 5,123
Allocations from Corporate Center – Group ALM to business divisions and other CC units 106 21 94 3 (59) 21 (168) (18) 0
Income1 1,885 1,891 963 468 1,877 (55) (150) (44) 6,835
Credit loss (expense) / recovery 0 (1) 0 0 2 0 0 (3) (3)
Total operating income 1,885 1,889 963 468 1,879 (55) (150) (47) 6,833
Personnel expenses 615 1,202 213 183 728 968 8 7 3,924
General and administrative expenses 128 144 61 57 170 1,042 3 60 1,664
Services (to) / from business divisions and Corporate Center 583 318 287 137 718 (2,099) (13) 69 0
of which: services from CC – Services 562 315 311 142 691 (2,105) 29 56 0
Depreciation and impairment of property, equipment and software 1 0 4 0 6 232 0 0 243
Amortization and impairment of intangible assets 1 13 0 1 3 5 0 0 23
Total operating expenses2 1,327 1,678 564 378 1,625 148 (2)3 135 5,855
Operating profit / (loss) before tax 557 211 399 90 253 (203) (148) (183) 978
Tax expense / (benefit) 270
Net profit / (loss) 708
As of 31 March 2016
Total assets 118,179 58,987 140,242 12,059 256,585 22,191 258,809 99,821 966,873
For the quarter ended 31 March 20154
Net interest income 429 239 465 (9) 399 (80) 210 (16) 1,637Non-interest income 1,686 1,539 412 515 2,292 400 392 (15) 7,221Allocations from Corporate Center – Group ALM to business divisions and other CC units 131 23 122 5 (34) 54 (289) (12) 0Income1 2,246 1,801 1,000 511 2,655 374 313 (43) 8,858Credit loss (expense) / recovery 1 0 (21) 0 2 0 0 2 (16)Total operating income 2,247 1,801 979 511 2,657 374 313 (41) 8,841Personnel expenses 661 1,123 226 167 1,008 950 8 31 4,172General and administrative expenses 111 120 53 55 189 1,139 4 42 1,713Services (to) / from business divisions and Corporate Center 521 293 268 119 681 (1,964) (15) 97 0
of which: services from CC – Services 508 289 292 123 667 (1,973) 14 80 0Depreciation and impairment of property, equipment and software 2 1 4 0 6 207 0 0 221Amortization and impairment of intangible assets 1 12 0 2 7 5 0 0 28Total operating expenses2 1,296 1,548 552 343 1,891 337 (4)3 171 6,134Operating profit / (loss) before tax 951 253 427 168 766 37 317 (212) 2,708Tax expense / (benefit) 670Net profit / (loss) 2,038
As of 31 December 2015
Total assets 119,850 60,993 141,164 12,874 253,486 22,566 237,517 94,369 942,8191 The own credit presentation requirements of IFRS 9 were adopted as of 1 January 2016. From this date onward, changes in the fair value of financial liabilities designated at fair value through profit and loss related to own credit are recognized in other comprehensive income and no longer in net trading income in the income statement. Comparative period information was not restated. Refer to Note 1 for further information. 2 Refer to Note 18 for information on restructuring expenses. 3 Operating expenses for Corporate Center – Group ALM are presented on a net basis after allocations to business divisions and other Corporate Center units. Corporate Center – Group ALM incurred total operating expenses before allocations of CHF 11 million in the first quarter of 2016 and CHF 11 million in the first quarter of 2015, respectively. 4 Figures in this table may differ from those originally published in quarterly and annual reports due to adjustments following organizational changes, restatements due to the retrospective adoption of new accounting standards or changes in accounting policies, and events after the reporting period.

Con
solid
ated
fina
ncia
l sta
tem
ents
115
Note 3 Net interest and trading income
For the quarter ended % change from
CHF million 31.3.16 31.12.15 31.3.15 4Q15 1Q15
Net interest and trading income
Net interest income 1,712 1,759 1,637 (3) 5
Net trading income 1,013 898 2,135 13 (53)
Total net interest and trading income 2,725 2,657 3,772 3 (28)
Wealth Management 750 774 806 (3) (7)
Wealth Management Americas 439 418 357 5 23
Personal & Corporate Banking 643 666 687 (3) (6)
Asset Management (8) (2) (6) 300 33
Investment Bank 1,021 802 1,717 27 (41)
of which: Corporate Client Solutions 120 154 274 (22) (56)
of which: Investor Client Services 901 648 1,444 39 (38)
Corporate Center (120) (1) 209
of which: Services (9) (24) 26 (63)
of which: Group ALM (68) 105 268
of which: own credit on financial liabilities designated at fair value1 35 226 (100) (100)
of which: Non-core and Legacy Portfolio (43) (83) (84) (48) (49)
Total net interest and trading income 2,725 2,657 3,772 3 (28)
Net interest income
Interest income
Interest income from loans and deposits2 2,330 2,243 2,098 4 11
Interest income from securities financing transactions3 252 320 192 (21) 31
Interest income from trading portfolio4 688 645 755 7 (9)
Interest income from financial assets and liabilities designated at fair value 73 54 43 35 70
Interest income from financial assets available for sale and held to maturity4 65 101 84 (36) (23)
Total 3,407 3,363 3,172 1 7
Interest expense
Interest expense on loans and deposits5 182 118 138 54 32
Interest expense on securities financing transactions6 286 348 191 (18) 50
Interest expense on trading portfolio7 376 236 410 59 (8)
Interest expense on financial assets and liabilities designated at fair value 201 188 191 7 5
Interest expense on debt issued 651 714 605 (9) 8
Total 1,695 1,604 1,535 6 10
Net interest income 1,712 1,759 1,637 (3) 5
Net trading income
Investment Bank Corporate Client Solutions (38) (12) 114 217
Investment Bank Investor Client Services 802 449 1,236 79 (35)
Other business divisions and Corporate Center 249 460 785 (46) (68)
Net trading income 1,013 898 2,135 13 (53)
of which: net gains / (losses) from financial liabilities designated at fair value1, 8 1,059 (1,165) (988)
1 Refer to Note 1 for more information. 2 Consists of interest income from balances with central banks, amounts due from banks and loans, and negative interest on amounts due to banks and customers. 3 Includes interest income on securities borrowed and reverse repurchase agreements and negative interest, including fees, on securities lent and repurchase agreements. 4 Includes dividend income. 5 Consists of interest expense on amounts due to banks and customers, and negative interest on balances with central banks, amounts due from banks and loans. 6 Includes interest expense on securities lent and repurchase agreements and negative interest, including fees, on securities borrowed and reverse repurchase agreements. 7 Includes expense related to dividend payment obligations on trading liabilities. 8 Excludes fair value changes of hedges related to financial liabilities designated at fair value and foreign currency translation effects arising from translating foreign currency transactions into the respective functional currency, both of which are reported within net trading income.

Notes to the UBS Group AG interim consolidated financial statements (unaudited)
116
Note 4 Net fee and commission income
For the quarter ended % change from
CHF million 31.3.16 31.12.15 31.3.15 4Q15 1Q15
Underwriting fees 221 281 345 (21) (36)
of which: equity underwriting fees 113 195 229 (42) (51)
of which: debt underwriting fees 107 85 116 26 (8)
M&A and corporate finance fees 139 233 178 (40) (22)
Brokerage fees 966 908 1,077 6 (10)
Investment fund fees 814 850 923 (4) (12)
Portfolio management and advisory fees 1,966 1,978 1,940 (1) 1
Other 426 411 421 4 1
Total fee and commission income 4,533 4,660 4,884 (3) (7)
Brokerage fees paid 197 203 232 (3) (15)
Other 242 239 251 1 (4)
Total fee and commission expense 440 442 483 0 (9)
Net fee and commission income 4,093 4,218 4,401 (3) (7)
of which: net brokerage fees 769 705 845 9 (9)

Con
solid
ated
fina
ncia
l sta
tem
ents
117
Note 5 Other income
For the quarter ended % change from
CHF million 31.3.16 31.12.15 31.3.15 4Q15 1Q15
Associates and subsidiaries
Net gains / (losses) from disposals of subsidiaries1 (123) 144 141
Net gains / (losses) from disposals of investments in associates 0 0 0
Share of net profits of associates 18 10 23 80 (22)
Total (104) 154 164
Financial assets available for sale
Net gains / (losses) from disposals 76 11 105 591 (28)
Impairment charges 0 (1) 0 (100)
Total 76 10 105 660 (28)
Net income from properties (excluding net gains / (losses) from disposals)2 7 8 7 (13) 0
Net gains / (losses) from investment properties3 0 1 0 (100)
Net gains / (losses) from disposals of properties held for sale 0 0 378 (100)
Net gains / (losses) from disposals of loans and receivables (1) 0 26
Other 40 (214) 5 700
Total other income 17 (41) 685 (98)
1 Includes foreign exchange gains / (losses) reclassified from other comprehensive income related to disposed or partially disposed foreign subsidiaries and branches. 2 Includes net rent received from third parties and net operating expenses. 3 Includes unrealized and realized gains / (losses) from investment properties and foreclosed assets.

Notes to the UBS Group AG interim consolidated financial statements (unaudited)
118
Note 6 Personnel expenses
For the quarter ended % change from
CHF million 31.3.16 31.12.15 31.3.15 4Q15 1Q15
Salaries and variable compensation 2,360 2,238 2,625 5 (10)
Contractors 101 103 81 (2) 25
Social security 184 202 230 (9) (20)
Pension and other post-employment benefit plans 199 217 224 (8) (11)
Wealth Management Americas: Financial advisor compensation1 909 917 870 (1) 4
Other personnel expenses 172 167 142 3 21
Total personnel expenses2 3,924 3,843 4,172 2 (6)
1 Financial advisor compensation consists of grid-based compensation based directly on compensable revenues generated by financial advisors and supplemental compensation calculated on the basis of financial advi-sor productivity, firm tenure, assets and other variables. It also includes expenses related to compensation commitments with financial advisors entered into at the time of recruitment which are subject to vesting require-ments. 2 Includes restructuring expenses. Refer to Note 18 for more information.
Note 7 General and administrative expenses
For the quarter ended % change from
CHF million 31.3.16 31.12.15 31.3.15 4Q15 1Q15
Occupancy 234 252 227 (7) 3
Rent and maintenance of IT and other equipment 140 134 149 4 (6)
Communication and market data services 166 153 155 8 7
Administration 138 327 115 (58) 20
Marketing and public relations 99 139 79 (29) 25
Travel and entertainment 118 131 105 (10) 12
Professional fees 278 403 286 (31) (3)
Outsourcing of IT and other services 435 509 393 (15) 11
Provisions for litigation, regulatory and similar matters1 39 365 58 (89) (33)
Other 16 1 144 (89)
Total general and administrative expenses2 1,664 2,413 1,713 (31) (3)
1 Reflects the net increase in provisions for litigation, regulatory and similar matters recognized in the income statement. Refer to Note 16 for more information. Also includes recoveries from third parties (first quarter of 2016: CHF 3 million; fourth quarter of 2015: CHF 10 million; first quarter of 2015: CHF 9 million). 2 Includes net restructuring expenses. Refer to Note 18 for more information.
Note 8 Income taxes
The Group recognized a net income tax expense of CHF 270 mil-lion for the first quarter of 2016, compared with a net tax benefit of CHF 715 million for the fourth quarter of 2015. The first quar-ter included net tax expenses of CHF 205 million, which mainly related to current taxes payable by UBS AG branches and subsid-
iaries, including UBS Switzerland AG. In addition, it included an expense of CHF 65 million with respect to amortization of deferred tax assets previously recognized in relation to Swiss tax losses car-ried forward and deductible temporary differences to reflect their offset against profits for the quarter.

Con
solid
ated
fina
ncia
l sta
tem
ents
119
Note 9 Earnings per share (EPS) and shares outstanding
As of or for the quarter ended % change from
31.3.16 31.12.15 31.3.15 4Q15 1Q15
Basic earnings (CHF million)
Net profit / (loss) attributable to UBS Group AG shareholders 707 949 1,977 (26) (64)
Diluted earnings (CHF million)
Net profit / (loss) attributable to UBS Group AG shareholders 707 949 1,977 (26) (64)
Less: (profit) / loss on UBS Group AG equity derivative contracts (1) 0 0
Net profit / (loss) attributable to UBS Group AG shareholders for diluted EPS 706 949 1,977 (26) (64)
Weighted average shares outstanding
Weighted average shares outstanding for basic EPS 3,741,452,190 3,752,415,299 3,642,212,051 0 3
Effect of dilutive potential shares resulting from notional shares, in-the-money options and warrants outstanding 98,451,157 99,695,884 81,099,757 (1) 21
Weighted average shares outstanding for diluted EPS 3,839,903,347 3,852,111,183 3,723,311,808 0 3
Earnings per share (CHF)
Basic 0.19 0.25 0.54 (24) (65)
Diluted 0.18 0.25 0.53 (28) (66)
Shares outstanding
Shares issued 3,850,069,401 3,849,731,535 3,739,518,390 0 3
Treasury shares 129,605,209 98,706,275 85,258,884 31 52
Shares outstanding 3,720,464,192 3,751,025,260 3,654,259,506 (1) 2
% change from
Number of shares 31.3.16 31.12.15 31.3.15 4Q15 1Q15
Potentially dilutive instruments
Employee share-based compensation awards 54,091,948 67,766,835 79,050,200 (20) (32)
Other equity derivative contracts 10,619,640 6,341,855 7,323,773 67 45
Total 64,711,588 74,108,690 86,373,973 (13) (25)
The table below outlines the potential shares which could dilute basic earnings per share in the future, but were not dilutive for the periods presented.

Notes to the UBS Group AG interim consolidated financial statements (unaudited)
120
Note 10 Fair value measurement
This Note provides fair value measurement information for both financial and non-financial instruments and should be read in con-junction with “Note 24 Fair Value Measurement” of the Annual Report 2015 which provides more information on valuation princi-
ples, valuation governance, valuation techniques, valuation adjust-ments, fair value hierarchy classification, valuation inputs, sensitiv-ity of fair value measurements and methods applied to calculate fair values for financial instruments not measured at fair value.
a) Valuation adjustments
Day-1 reservesThe table below summarizes the changes in deferred day-1 profit or loss reserves during the respective period. Amounts deferred are
released and gains or losses are recorded in Net trading income when pricing of equivalent products or the underlying parameters become observable or when the transaction is closed out.
Deferred day-1 profit or loss
For the quarter ended
CHF million 31.3.16 31.12.15 31.3.15
Balance at the beginning of the period 421 421 480
Profit / (loss) deferred on new transactions 123 57 76
(Profit) / loss recognized in the income statement (58) (68) (81)
Foreign currency translation (13) 11 (17)
Balance at the end of the period 474 421 458
Credit valuation, funding valuation, debit valuation and other valuation adjustmentsThe effects of credit valuation, funding valuation, debit valuation and other valuation adjustments are summarized in the table below.
Valuation adjustments on financial instruments
As of
Life-to-date gain / (loss), CHF billion 31.3.16 31.12.15
Credit valuation adjustments1 (0.3) (0.3)
Funding valuation adjustments (0.2) (0.2)
Debit valuation adjustments 0.0 0.0
Other valuation adjustments (0.8) (0.8)
of which: liquidity (0.5) (0.5)
of which: model uncertainty (0.3) (0.3)
1 Amounts do not include reserves against defaulted counterparties.

Con
solid
ated
fina
ncia
l sta
tem
ents
121
Note 10 Fair value measurement (continued)
Own credit adjustments on financial liabilities designated at fair valueThe own credit presentation requirements of IFRS 9 were adopted as of 1 January 2016. From this date onward, changes in the fair value of financial liabilities designated at fair value through profit and loss related to own credit are recognized in Other compre-hensive income and presented in the Statement of comprehensive income, and no longer in Net trading income within the Income statement. Comparative period information was not restated.
The table below summarizes the effects of own credit adjust-
ments related to financial liabilities designated at fair value. The change in unrealized own credit for the period ended consists of changes in fair value that are attributable to the change in UBS’s credit spreads, as well as the effect of changes in fair values attrib-utable to factors other than credit spreads, such as redemptions, effects from time decay and changes in interest and other market rates. Realized own credit is recognized when an instrument with an associated unrealized own credit adjustment is repurchased prior to the contractual maturity date. Life-to-date amounts reflect the cumulative unrealized change since initial recognition.
Own credit adjustments on financial liabilities designated at fair value
For the quarter ended
Included in Other comprehensive
income Included in Net trading income
CHF million 31.3.16 31.12.15 31.3.15
Recognized during the period:
Realized gain / (loss) 10
Unrealized gain / (loss) 59 35 226
Total gain / (loss) 68
As of
CHF million 31.3.16 31.12.15 31.3.15
Recognized on the balance sheet as of the end of the period:
Unrealized life-to-date gain / (loss) 332 287 (52)

Notes to the UBS Group AG interim consolidated financial statements (unaudited)
122
Note 10 Fair value measurement (continued)
b) Fair value measurements and classification within the fair value hierarchy
The fair value hierarchy classification of financial and non-financial assets and liabilities measured at fair value is summarized in the table below.
Determination of fair values from quoted market prices or valuation techniques1
31.3.16 31.12.15
CHF billion Level 1 Level 2 Level 3 Total Level 1 Level 2 Level 3 Total
Assets measured at fair value on a recurring basis
Financial assets held for trading2 81.2 17.3 3.1 101.5 96.4 21.9 2.1 120.4
of which:
Government bills / bonds 13.6 2.2 0.0 15.8 12.9 3.3 0.0 16.2
Corporate bonds and municipal bonds, including bonds issued by financial institutions 0.3 7.7 1.0 9.0 0.2 8.1 0.7 9.0
Loans 0.0 1.3 1.2 2.6 0.0 1.8 0.8 2.6
Investment fund units 4.9 4.2 0.2 9.3 6.1 5.7 0.2 11.9
Asset-backed securities 0.0 0.6 0.2 0.8 0.0 1.0 0.2 1.2
Equity instruments 48.3 0.5 0.3 49.1 62.4 1.5 0.1 64.0
Financial assets for unit-linked investment contracts 14.2 0.7 0.1 14.9 14.8 0.7 0.1 15.5
Positive replacement values 0.7 177.8 2.0 180.5 0.5 164.0 2.9 167.4
of which:
Interest rate contracts 0.0 84.0 0.0 84.1 0.0 74.4 0.1 74.5
Credit derivative contracts 0.0 5.0 0.8 5.8 0.0 5.4 1.3 6.7
Foreign exchange contracts 0.4 69.5 0.4 70.3 0.3 64.9 0.5 65.7
Equity / index contracts 0.0 16.6 0.7 17.3 0.0 15.9 1.0 16.9
Commodity contracts 0.0 2.6 0.0 2.6 0.0 3.4 0.0 3.4
Financial assets designated at fair value 27.0 10.7 3.3 41.0 0.2 2.7 3.3 6.1
of which:
Government bills / bonds 26.8 2.5 0.0 29.3 0.0 0.0 0.0 0.0
Corporate bonds and municipal bonds, including bonds issued by financial institutions 0.1 5.7 0.0 5.7 0.0 0.0 0.0 0.0
Loans (including structured loans) 0.0 2.2 1.7 3.9 0.0 2.3 1.7 4.0
Structured reverse repurchase and securities borrowing agreements 0.0 0.0 1.4 1.4 0.0 0.0 1.5 1.6
Other 0.1 0.3 0.1 0.6 0.2 0.3 0.1 0.6
Financial assets available for sale 11.9 18.7 0.7 31.3 34.2 27.7 0.7 62.5
of which:
Government bills / bonds 9.4 0.9 0.0 10.3 31.1 2.0 0.0 33.1
Corporate bonds and municipal bonds, including bonds issued by financial institutions 2.5 14.5 0.0 17.0 3.0 22.2 0.0 25.2
Investment fund units 0.0 0.0 0.1 0.2 0.0 0.1 0.1 0.2
Asset-backed securities 0.0 3.2 0.0 3.2 0.0 3.4 0.0 3.4
Equity instruments 0.1 0.0 0.5 0.6 0.1 0.0 0.5 0.6
Non-financial assets
Precious metals and other physical commodities 3.8 0.0 0.0 3.8 3.7 0.0 0.0 3.7
Assets measured at fair value on a non-recurring basis
Other assets3 0.3 0.1 0.1 0.4 0.3 0.1 0.1 0.4
Total assets measured at fair value 124.8 224.6 9.0 358.5 135.2 216.4 9.0 360.6

Con
solid
ated
fina
ncia
l sta
tem
ents
123
Note 10 Fair value measurement (continued)
All financial and non-financial assets and liabilities measured or disclosed at fair value are categorized into one of three fair value hierarchy levels. In certain cases, the inputs used to measure fair value may fall within different levels of the fair value hierarchy. For disclosure purposes, the level in the hierarchy within which the instrument is classified in its entirety is based on the lowest level input that is significant to the position’s fair value measurement:
– Level 1 – quoted prices (unadjusted) in active markets for iden-tical assets and liabilities;
– Level 2 – valuation techniques for which all significant inputs are, or are based on, observable market data or
– Level 3 – valuation techniques for which significant inputs are not based on observable market data.
Determination of fair values from quoted market prices or valuation techniques1 (continued)
31.3.16 31.12.15
CHF billion Level 1 Level 2 Level 3 Total Level 1 Level 2 Level 3 Total
Liabilities measured at fair value on a recurring basis
Trading portfolio liabilities 29.0 4.0 0.1 33.2 25.5 3.5 0.2 29.1
of which:
Government bills / bonds 7.4 0.8 0.0 8.1 6.0 0.8 0.0 6.8
Corporate bonds and municipal bonds, including bonds issued by financial institutions 0.0 2.9 0.1 3.0 0.0 2.4 0.1 2.5
Investment fund units 0.5 0.1 0.0 0.6 0.7 0.1 0.0 0.7
Asset-backed securities 0.0 0.0 0.0 0.0 0.0 0.0 0.0 0.0
Equity instruments 21.1 0.3 0.1 21.4 18.8 0.2 0.0 19.1
Negative replacement values 0.8 175.1 3.1 179.0 0.6 158.5 3.3 162.4
of which:
Interest rate contracts 0.0 77.2 0.3 77.5 0.0 67.2 0.3 67.6
Credit derivative contracts 0.0 5.1 1.3 6.3 0.0 5.4 1.3 6.7
Foreign exchange contracts 0.4 71.1 0.2 71.7 0.3 63.0 0.2 63.5
Equity / index contracts 0.0 19.3 1.3 20.6 0.0 19.7 1.4 21.2
Commodity contracts 0.0 2.5 0.0 2.5 0.0 3.2 0.0 3.2
Financial liabilities designated at fair value 0.0 47.0 10.7 57.8 0.0 52.3 10.7 63.0
of which:
Non-structured fixed-rate bonds 0.0 1.0 3.0 4.0 0.0 1.5 2.6 4.1
Structured debt instruments issued 0.0 42.1 5.8 47.9 0.0 45.7 6.7 52.4
Structured over-the-counter debt instruments 0.0 3.4 1.4 4.7 0.0 4.7 0.8 5.5
Structured repurchase agreements 0.0 0.5 0.6 1.0 0.0 0.3 0.6 0.8
Loan commitments and guarantees 0.0 0.1 0.0 0.1 0.0 0.1 0.0 0.1
Other liabilities – amounts due under unit-linked investment contracts 0.0 15.1 0.0 15.1 0.0 15.7 0.0 15.7
Liabilities measured at fair value on a non-recurring basis
Other liabilities3 0.0 0.2 0.0 0.2 0.0 0.2 0.0 0.2
Total liabilities measured at fair value 29.8 241.5 13.9 285.3 26.1 230.3 14.1 270.5
1 Bifurcated embedded derivatives are presented on the same balance sheet lines as their host contracts and are excluded from this table. As of 31 March 2016, net bifurcated embedded derivative assets held at fair value totaling CHF 0.1 billion (of which CHF 0.1 billion were net Level 2 assets and CHF 0.0 billion net Level 2 liabilities) were recognized on the balance sheet within Debt issued. As of 31 December 2015, net bifurcated embedded derivative liabilities held at fair value totaling CHF 0.1 billion (of which CHF 0.1 billion were net Level 2 assets and CHF 0.2 billion net Level 2 liabilities) were recognized on the balance sheet within Debt issued. 2 Financial assets held for trading do not include precious metals and other physical commodities. 3 Other assets and other liabilities primarily consist of assets held for sale as well as assets and liabilities of a disposal group held for sale, which are measured at the lower of their net carrying amount or fair value less costs to sell. Refer to Note 18 for more information on the disposal group held for sale.

Notes to the UBS Group AG interim consolidated financial statements (unaudited)
124
Note 10 Fair value measurement (continued)
c) Transfers between Level 1 and Level 2 in the fair value hierarchy
The amounts disclosed reflect transfers between Level 1 and Level 2 for instruments which were held for the entire reporting period.
Assets totaling approximately CHF 2.3 billion, which were mainly comprised of financial assets available for sale, primarily corporate and municipal bonds as well as government bills / bonds, and liabilities totaling approximately CHF 0.2 billion were trans-ferred from Level 2 to Level 1 during the first three months of 2016, generally due to increased levels of trading activity observed within the market.
Assets totaling approximately CHF 1.0 billion, which were mainly comprised of financial assets available for sale, primarily corporate and municipal bonds as well as government bills / bonds, and liabilities totaling approximately CHF 0.1 billion were trans-ferred from Level 1 to Level 2 during the first three months of 2016, generally due to diminished levels of trading activity observed within the market.
d) Movements of Level 3 instruments
Significant changes in Level 3 instrumentsThe table on the following pages presents additional information about Level 3 assets and liabilities measured at fair value on a recurring basis. Level 3 assets and liabilities may be hedged with instruments classified as Level 1 or Level 2 in the fair value hierar-chy and, as a result, realized and unrealized gains and losses included in the table may not include the effect of related hedg-ing activity. Further, the realized and unrealized gains and losses presented within the table are not limited solely to those arising from Level 3 inputs, as valuations are generally derived from both observable and unobservable parameters.
Assets and liabilities transferred into or out of Level 3 are pre-sented as if those assets or liabilities had been transferred at the beginning of the year.
The following text describes significant movements in Level 3 instruments during the first three months of 2016.
Financial assets held for tradingFinancial assets held for trading increased to CHF 3.1 billion from CHF 2.1 billion during the first three months of 2016. Issuances of CHF 1.2 billion, mainly comprised of loans, were mostly offset by sales of CHF 1.0 billion, also primarily comprised of loans. Transfers into Level 3 amounted to CHF 0.4 billion and were mainly com-prised of equity instruments and mortgage-backed securities due to decreased observability of the respective equity market pricing and credit spread inputs. Transfers out of Level 3 during the first three months of 2016 amounted to CHF 0.2 billion and were pri-marily comprised of loans and corporate bonds, reflecting increased observability of the respective credit spread inputs.
Financial assets designated at fair valueFinancial assets designated at fair value were unchanged at CHF 3.3 billion as transfers into Level 3 totaling CHF 0.4 billion and issuances totaling CHF 0.2 billion were offset by settlements of CHF 0.2 billion, net losses of CHF 0.2 billion and transfers out of Level 3 of CHF 0.1 billion.

Con
solid
ated
fina
ncia
l sta
tem
ents
125
Note 10 Fair value measurement (continued)
Financial assets available for saleFinancial assets available for sale were unchanged at CHF 0.7 bil-lion with no significant movements during the first three months of 2016.
Positive replacement valuesPositive replacement values decreased to CHF 2.0 billion from CHF 2.9 billion during the first three months of 2016. Settlements of CHF 0.7 billion and net losses of CHF 0.5 billion included in compre-hensive income were partly offset by issuances of CHF 0.3 billion, all of which primarily related to interest rate contracts and equity / index contracts. Transfers into Level 3 amounted to CHF 0.4 billion and primarily resulted from changes in the correlation between the port-folios held and the representative market portfolio used to indepen-dently verify market data. Transfers out of Level 3 amounted to CHF 0.3 billion and mainly resulted from changes in the availability of observable inputs for equity volatility and credit spreads.
Negative replacement valuesNegative replacement values decreased to CHF 3.1 billion from CHF 3.3 billion during the first three months of 2016. Settlements of
CHF 0.9 billion and net losses of CHF 0.4 billion included in com-prehensive income, both primarily related to equity / index contracts and interest rate contracts, were partly offset by issuances of CHF 0.7 billion, mainly related to equity / index contracts. Transfers into and out of Level 3 amounted to CHF 0.5 billion and CHF 0.2 billion, respectively, and were mainly comprised of interest rate contracts and equity / index contracts resulting from changes in the availabil-ity of observable inputs for equity volatility and credit spreads.
Financial liabilities designated at fair valueFinancial liabilities designated at fair value were unchanged at CHF 10.7 billion. Issuances of CHF 1.7 billion, primarily comprised of equity-linked structured debt instruments issued and structured over-the-counter debt instruments, were partly offset by settle-ments of CHF 0.6 billion, mainly comprised of equity-linked struc-tured debt instruments issued. Transfers into and out of Level 3 amounted to CHF 0.3 billion and CHF 1.1 billion, respectively, and were primarily comprised of equity-linked structured debt instru-ments issued, resulting from changes in the availability of observ-able equity volatility and credit spread inputs used to determine the fair value of the embedded options in these structures.

Notes to the UBS Group AG interim consolidated financial statements (unaudited)
126
Note 10 Fair value measurement (continued)
Movements of Level 3 instruments
Total gains / losses included incomprehensive income
Total gains / losses included incomprehensive income
CHF billion
Balance as of 31
December 2014
Net interestincome,
net tradingincome
and otherincome
of which:related to
Level 3instruments
held at the endof the reporting
period
Othercompre-hensiveincome Purchases Sales Issuances Settlements
Transfersinto
Level 3
Transfersout of
Level 3
Foreign currency
translation
Balance as of
31 March2015
Balance as of 31 December
2015
Net interestincome,
net tradingincome
and otherincome
of which:related to
Level 3instruments
held at the endof the reporting
period
Othercompre-hensiveincome Purchases Sales Issuances Settlements
Transfersinto
Level 3
Transfersout of
Level 3
Foreign currency
translation
Balance as of
31 March 20161
Financial assets held for trading 3.5 (0.6) (0.2) 0.0 0.2 (2.1) 2.3 0.0 0.2 (0.4) (0.1) 3.0 2.1 0.2 0.2 0.5 (1.0) 1.2 0.0 0.4 (0.2) (0.1) 3.1
of which:
Corporate bonds and municipal bonds, including bonds issued by financial institutions 1.4 0.1 0.1 0.0 0.1 (0.1) 0.0 0.0 0.0 (0.1) (0.1) 1.3 0.7 0.1 0.1 0.4 (0.1) 0.0 0.0 0.0 0.0 0.0 1.0
Loans 1.1 (0.6) (0.2) 0.0 0.0 (1.8) 2.3 0.0 0.0 (0.2) 0.0 0.8 0.8 0.0 0.0 0.0 (0.7) 1.2 0.0 0.0 (0.1) (0.1) 1.2
Asset-backed securities 0.6 0.0 0.0 0.0 0.0 (0.1) 0.0 0.0 0.1 0.0 0.0 0.4 0.2 0.0 0.0 0.0 (0.1) 0.0 0.0 0.1 0.0 0.0 0.2
Other 0.5 (0.1) (0.1) 0.0 0.1 0.0 0.0 0.0 0.1 0.0 0.0 0.5 0.4 0.2 0.1 0.1 (0.2) 0.0 0.0 0.2 0.0 0.0 0.6
Financial assets designated at fair value 3.5 (0.6) (0.3) 0.0 0.0 0.0 0.0 0.0 0.3 0.0 0.0 3.2 3.3 (0.2) (0.2) 0.0 0.0 0.2 (0.2) 0.4 (0.1) (0.1) 3.3
of which:
Loans (including structured loans) 1.0 0.0 0.0 0.0 0.0 0.0 0.0 0.0 0.3 0.0 0.0 1.2 1.7 (0.2) (0.2) 0.0 0.0 0.2 (0.1) 0.4 (0.1) (0.1) 1.7
Structured reverse repurchase and securities borrowing agreements 2.4 (0.5) (0.3) 0.0 0.0 0.0 0.0 0.0 0.0 0.0 0.0 1.9 1.5 0.0 0.0 0.0 0.0 0.0 (0.1) 0.0 0.0 0.0 1.4
Other 0.1 0.0 0.0 0.0 0.0 0.0 0.0 0.0 0.0 0.0 0.0 0.1 0.1 0.0 0.0 0.0 0.0 0.0 0.0 0.0 0.0 0.0 0.1
Financial assets available for sale 0.6 0.0 0.0 0.0 0.0 0.0 0.0 0.0 0.0 0.0 0.0 0.6 0.7 0.0 0.0 0.0 0.0 0.0 0.0 0.0 0.0 0.0 0.0 0.7
Positive replacement values 4.4 0.0 0.0 0.0 0.0 0.0 0.8 (0.8) 0.3 (0.2) (0.2) 4.3 2.9 (0.5) (0.6) 0.0 0.0 0.3 (0.7) 0.4 (0.3) (0.1) 2.0
of which:
Credit derivative contracts 1.7 0.1 0.1 0.0 0.0 0.0 0.6 (0.5) 0.1 (0.1) (0.2) 1.7 1.3 0.0 0.0 0.0 0.0 0.0 (0.3) 0.1 (0.2) 0.0 0.8
Foreign exchange contracts 0.6 0.0 0.0 0.0 0.0 0.0 0.0 0.0 0.0 0.0 0.0 0.7 0.5 0.0 0.0 0.0 0.0 0.0 (0.1) 0.0 0.0 0.0 0.4
Equity / index contracts 1.9 (0.2) (0.2) 0.0 0.0 0.0 0.1 (0.2) 0.0 0.0 0.0 1.5 1.0 (0.3) (0.3) 0.0 0.0 0.1 (0.2) 0.1 (0.1) 0.0 0.7
Other 0.3 0.0 0.0 0.0 0.0 0.0 0.0 0.0 0.2 0.0 0.0 0.4 0.1 (0.3) (0.3) 0.0 0.0 0.1 (0.1) 0.2 0.0 0.0 0.1
Negative replacement values 5.0 0.2 0.1 0.0 0.0 0.0 0.5 (0.7) 0.2 (0.2) (0.2) 4.7 3.3 (0.4) (0.5) 0.0 0.0 0.7 (0.9) 0.5 (0.2) 0.0 3.1
of which:
Credit derivative contracts 1.7 0.3 0.3 0.0 0.0 0.0 0.1 (0.2) 0.1 (0.1) 0.0 1.9 1.3 0.2 0.1 0.0 0.0 0.0 (0.3) 0.1 0.0 0.0 1.3
Foreign exchange contracts 0.3 0.0 0.0 0.0 0.0 0.0 0.0 0.0 0.0 0.0 0.0 0.3 0.2 0.0 0.0 0.0 0.0 0.0 0.0 0.0 0.0 0.0 0.2
Equity / index contracts 2.4 0.1 0.1 0.0 0.0 0.0 0.3 (0.5) 0.0 0.0 (0.1) 2.3 1.4 (0.3) (0.4) 0.0 0.0 0.7 (0.4) 0.0 (0.1) 0.0 1.3
Other 0.6 (0.3) (0.3) 0.0 0.0 0.0 0.0 0.0 0.0 0.0 (0.1) 0.2 0.3 (0.2) (0.2) 0.0 0.0 0.0 (0.1) 0.4 0.0 0.0 0.3
Financial liabilities designated at fair value 11.9 0.6 0.6 0.0 0.0 0.0 1.3 (1.9) 0.2 (0.7) (0.6) 10.8 10.7 0.1 0.1 0.0 0.0 1.7 (0.6) 0.3 (1.1) (0.3) 10.7
of which:
Non-structured fixed-rate bonds 2.2 0.0 0.1 0.0 0.0 0.0 0.0 (0.1) 0.0 0.0 (0.1) 2.0 2.6 0.2 0.2 0.0 0.0 0.3 0.0 0.1 (0.1) (0.1) 3.0
Structured debt instruments issued 7.3 0.5 0.3 0.0 0.0 0.0 1.2 (1.2) 0.2 (0.7) (0.4) 6.8 6.7 (0.1) (0.1) 0.0 0.0 0.6 (0.5) 0.2 (1.1) (0.2) 5.8
Structured over-the-counter debt instruments 1.5 0.1 0.1 0.0 0.0 0.0 0.1 (0.3) 0.0 0.0 (0.1) 1.3 0.8 0.0 0.0 0.0 0.0 0.8 (0.1) 0.0 0.0 0.0 1.4
Structured repurchase agreements 0.9 (0.1) 0.0 0.0 0.0 0.0 0.0 (0.3) 0.0 0.0 0.0 0.6 0.6 0.0 0.0 0.0 0.0 0.0 0.0 0.0 0.0 0.0 0.6
1 Total Level 3 assets as of 31 March 2016 were CHF 9.0 billion (31 December 2015: CHF 9.0 billion). Total Level 3 liabilities as of 31 March 2016 were CHF 13.9 billion (31 December 2015: CHF 14.1 billion).

Con
solid
ated
fina
ncia
l sta
tem
ents
127
Note 10 Fair value measurement (continued)
Movements of Level 3 instruments
Total gains / losses included incomprehensive income
Total gains / losses included incomprehensive income
CHF billion
Balance as of 31
December 2014
Net interestincome,
net tradingincome
and otherincome
of which:related to
Level 3instruments
held at the endof the reporting
period
Othercompre-hensiveincome Purchases Sales Issuances Settlements
Transfersinto
Level 3
Transfersout of
Level 3
Foreign currency
translation
Balance as of
31 March2015
Balance as of 31 December
2015
Net interestincome,
net tradingincome
and otherincome
of which:related to
Level 3instruments
held at the endof the reporting
period
Othercompre-hensiveincome Purchases Sales Issuances Settlements
Transfersinto
Level 3
Transfersout of
Level 3
Foreign currency
translation
Balance as of
31 March 20161
Financial assets held for trading 3.5 (0.6) (0.2) 0.0 0.2 (2.1) 2.3 0.0 0.2 (0.4) (0.1) 3.0 2.1 0.2 0.2 0.5 (1.0) 1.2 0.0 0.4 (0.2) (0.1) 3.1
of which:
Corporate bonds and municipal bonds, including bonds issued by financial institutions 1.4 0.1 0.1 0.0 0.1 (0.1) 0.0 0.0 0.0 (0.1) (0.1) 1.3 0.7 0.1 0.1 0.4 (0.1) 0.0 0.0 0.0 0.0 0.0 1.0
Loans 1.1 (0.6) (0.2) 0.0 0.0 (1.8) 2.3 0.0 0.0 (0.2) 0.0 0.8 0.8 0.0 0.0 0.0 (0.7) 1.2 0.0 0.0 (0.1) (0.1) 1.2
Asset-backed securities 0.6 0.0 0.0 0.0 0.0 (0.1) 0.0 0.0 0.1 0.0 0.0 0.4 0.2 0.0 0.0 0.0 (0.1) 0.0 0.0 0.1 0.0 0.0 0.2
Other 0.5 (0.1) (0.1) 0.0 0.1 0.0 0.0 0.0 0.1 0.0 0.0 0.5 0.4 0.2 0.1 0.1 (0.2) 0.0 0.0 0.2 0.0 0.0 0.6
Financial assets designated at fair value 3.5 (0.6) (0.3) 0.0 0.0 0.0 0.0 0.0 0.3 0.0 0.0 3.2 3.3 (0.2) (0.2) 0.0 0.0 0.2 (0.2) 0.4 (0.1) (0.1) 3.3
of which:
Loans (including structured loans) 1.0 0.0 0.0 0.0 0.0 0.0 0.0 0.0 0.3 0.0 0.0 1.2 1.7 (0.2) (0.2) 0.0 0.0 0.2 (0.1) 0.4 (0.1) (0.1) 1.7
Structured reverse repurchase and securities borrowing agreements 2.4 (0.5) (0.3) 0.0 0.0 0.0 0.0 0.0 0.0 0.0 0.0 1.9 1.5 0.0 0.0 0.0 0.0 0.0 (0.1) 0.0 0.0 0.0 1.4
Other 0.1 0.0 0.0 0.0 0.0 0.0 0.0 0.0 0.0 0.0 0.0 0.1 0.1 0.0 0.0 0.0 0.0 0.0 0.0 0.0 0.0 0.0 0.1
Financial assets available for sale 0.6 0.0 0.0 0.0 0.0 0.0 0.0 0.0 0.0 0.0 0.0 0.6 0.7 0.0 0.0 0.0 0.0 0.0 0.0 0.0 0.0 0.0 0.0 0.7
Positive replacement values 4.4 0.0 0.0 0.0 0.0 0.0 0.8 (0.8) 0.3 (0.2) (0.2) 4.3 2.9 (0.5) (0.6) 0.0 0.0 0.3 (0.7) 0.4 (0.3) (0.1) 2.0
of which:
Credit derivative contracts 1.7 0.1 0.1 0.0 0.0 0.0 0.6 (0.5) 0.1 (0.1) (0.2) 1.7 1.3 0.0 0.0 0.0 0.0 0.0 (0.3) 0.1 (0.2) 0.0 0.8
Foreign exchange contracts 0.6 0.0 0.0 0.0 0.0 0.0 0.0 0.0 0.0 0.0 0.0 0.7 0.5 0.0 0.0 0.0 0.0 0.0 (0.1) 0.0 0.0 0.0 0.4
Equity / index contracts 1.9 (0.2) (0.2) 0.0 0.0 0.0 0.1 (0.2) 0.0 0.0 0.0 1.5 1.0 (0.3) (0.3) 0.0 0.0 0.1 (0.2) 0.1 (0.1) 0.0 0.7
Other 0.3 0.0 0.0 0.0 0.0 0.0 0.0 0.0 0.2 0.0 0.0 0.4 0.1 (0.3) (0.3) 0.0 0.0 0.1 (0.1) 0.2 0.0 0.0 0.1
Negative replacement values 5.0 0.2 0.1 0.0 0.0 0.0 0.5 (0.7) 0.2 (0.2) (0.2) 4.7 3.3 (0.4) (0.5) 0.0 0.0 0.7 (0.9) 0.5 (0.2) 0.0 3.1
of which:
Credit derivative contracts 1.7 0.3 0.3 0.0 0.0 0.0 0.1 (0.2) 0.1 (0.1) 0.0 1.9 1.3 0.2 0.1 0.0 0.0 0.0 (0.3) 0.1 0.0 0.0 1.3
Foreign exchange contracts 0.3 0.0 0.0 0.0 0.0 0.0 0.0 0.0 0.0 0.0 0.0 0.3 0.2 0.0 0.0 0.0 0.0 0.0 0.0 0.0 0.0 0.0 0.2
Equity / index contracts 2.4 0.1 0.1 0.0 0.0 0.0 0.3 (0.5) 0.0 0.0 (0.1) 2.3 1.4 (0.3) (0.4) 0.0 0.0 0.7 (0.4) 0.0 (0.1) 0.0 1.3
Other 0.6 (0.3) (0.3) 0.0 0.0 0.0 0.0 0.0 0.0 0.0 (0.1) 0.2 0.3 (0.2) (0.2) 0.0 0.0 0.0 (0.1) 0.4 0.0 0.0 0.3
Financial liabilities designated at fair value 11.9 0.6 0.6 0.0 0.0 0.0 1.3 (1.9) 0.2 (0.7) (0.6) 10.8 10.7 0.1 0.1 0.0 0.0 1.7 (0.6) 0.3 (1.1) (0.3) 10.7
of which:
Non-structured fixed-rate bonds 2.2 0.0 0.1 0.0 0.0 0.0 0.0 (0.1) 0.0 0.0 (0.1) 2.0 2.6 0.2 0.2 0.0 0.0 0.3 0.0 0.1 (0.1) (0.1) 3.0
Structured debt instruments issued 7.3 0.5 0.3 0.0 0.0 0.0 1.2 (1.2) 0.2 (0.7) (0.4) 6.8 6.7 (0.1) (0.1) 0.0 0.0 0.6 (0.5) 0.2 (1.1) (0.2) 5.8
Structured over-the-counter debt instruments 1.5 0.1 0.1 0.0 0.0 0.0 0.1 (0.3) 0.0 0.0 (0.1) 1.3 0.8 0.0 0.0 0.0 0.0 0.8 (0.1) 0.0 0.0 0.0 1.4
Structured repurchase agreements 0.9 (0.1) 0.0 0.0 0.0 0.0 0.0 (0.3) 0.0 0.0 0.0 0.6 0.6 0.0 0.0 0.0 0.0 0.0 0.0 0.0 0.0 0.0 0.6
1 Total Level 3 assets as of 31 March 2016 were CHF 9.0 billion (31 December 2015: CHF 9.0 billion). Total Level 3 liabilities as of 31 March 2016 were CHF 13.9 billion (31 December 2015: CHF 14.1 billion).

Notes to the UBS Group AG interim consolidated financial statements (unaudited)
128
Note 10 Fair value measurement (continued)
e) Valuation of assets and liabilities classified as Level 3
The table below presents assets and liabilities recognized at fair value and classified as Level 3, together with the valuation tech-niques used to measure fair value, the significant inputs used in the valuation technique that are considered unobservable and a range of values and respective weighted averages, where appli-cable, for those unobservable inputs.
The range of values represents the highest and lowest level input used in the valuation techniques. Therefore, the range does not reflect the level of uncertainty regarding a particular input, but rather the different underlying characteristics of the relevant assets and liabilities. The ranges and weighted averages will vary from period to period and from parameter to parameter based on
characteristics of the instruments held at each balance sheet date. Further, the ranges and weighted averages of unobservable inputs may differ across other financial institutions due to the diversity of the products in each firm’s inventory.
The significant unobservable inputs disclosed in the table below are consistent with Note 24h of the Annual Report 2015. A description of the potential effect that a change in each unob-servable input in isolation may have on a fair value measurement, including information to facilitate an understanding of factors that give rise to the input ranges shown, is also provided in Note 24h of the Annual Report 2015.
Valuation techniques and inputs used in the fair value measurement of Level 3 assets and liabilities
Fair value
Significant unobservable input(s)1
Range of inputs
Assets Liabilities
Valuation technique(s)
31.3.16 31.12.15
CHF billion 31.3.16 31.12.15 31.3.16 31.12.15 low highweighted average2 low high
weighted average2 unit1
Financial assets held for trading / Trading portfolio liabilities, Financial assets / liabilities designated at fair value and Financial assets available for sale
Corporate bonds and municipal bonds, including bonds issued by financial institutions 1.0 0.7 0.1 0.1
Relative value to market comparable Bond price equivalent 0 130 86 0 134 94 points
Traded loans, loans designated at fair value, loan commitments and guarantees 3.1 2.6 0.0 0.0
Relative value to market comparable Loan price equivalent 20 102 91 65 100 93 points
Discounted expected cash flows Credit spread 20 569 30 252
basis points
Market comparable and securitization model
Discount margin / spread 1 18 3 1 14 2 %
Investment fund units3 0.3 0.3 0.0 0.0Relative value to market comparable Net asset value
Asset-backed securities 0.2 0.2 0.0 0.0Discounted cash flow projection
Constant prepayment rate 0 18 6 0 18 5 %
Discount margin / spread 1 13 3 0 12 3 %
Relative value to market comparable Bond price equivalent 1 100 62 1 92 72 points
Equity instruments3 0.8 0.6 0.1 0.0Relative value to market comparable Price
Structured (reverse) repurchase agreements 1.4 1.5 0.6 0.6
Discounted expected cash flows Funding spread 18 172 18 183
basis points
Financial assets for unit-linked investment contracts3 0.1 0.1
Relative value to market comparable Price
Structured debt instruments and non-structured fixed-rate bonds4 10.2 10.1
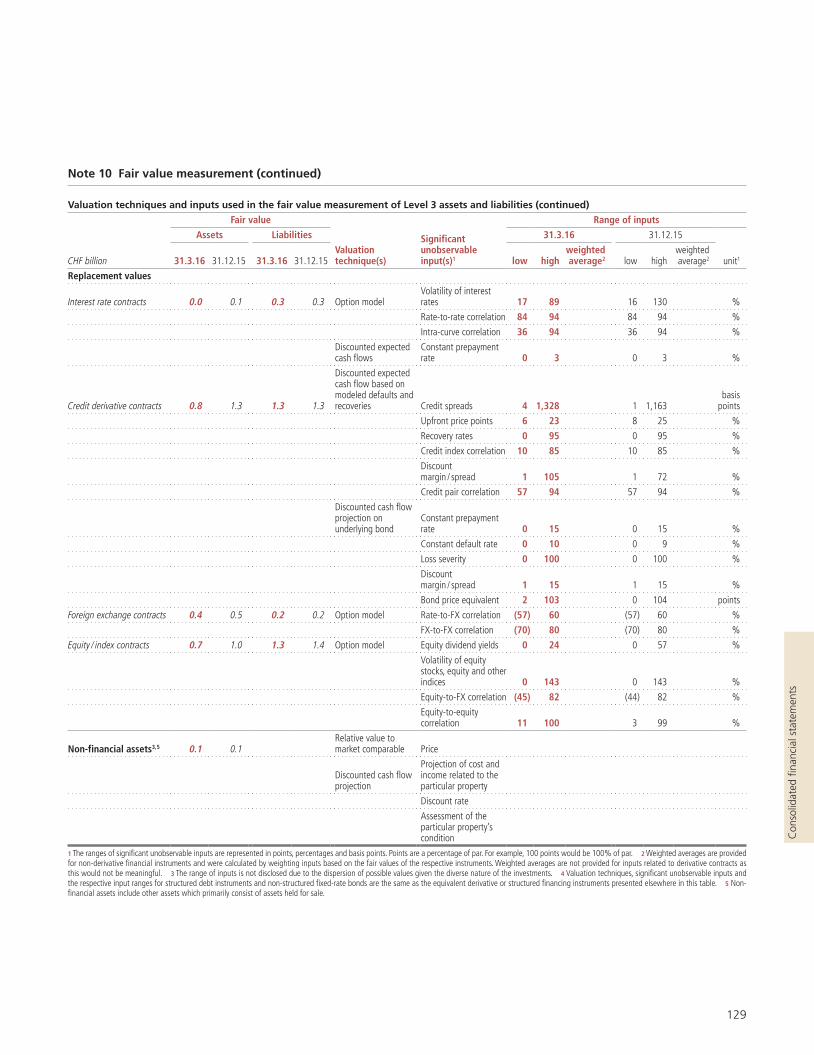
Con
solid
ated
fina
ncia
l sta
tem
ents
129
Note 10 Fair value measurement (continued)
Valuation techniques and inputs used in the fair value measurement of Level 3 assets and liabilities (continued)
Fair value
Significant unobservable input(s)1
Range of inputs
Assets Liabilities
Valuation technique(s)
31.3.16 31.12.15
CHF billion 31.3.16 31.12.15 31.3.16 31.12.15 low highweighted average2 low high
weighted average2 unit1
Replacement values
Interest rate contracts 0.0 0.1 0.3 0.3 Option modelVolatility of interest rates 17 89 16 130 %
Rate-to-rate correlation 84 94 84 94 %
Intra-curve correlation 36 94 36 94 %
Discounted expected cash flows
Constant prepayment rate 0 3 0 3 %
Credit derivative contracts 0.8 1.3 1.3 1.3
Discounted expected cash flow based on modeled defaults and recoveries Credit spreads 4 1,328 1 1,163
basis points
Upfront price points 6 23 8 25 %
Recovery rates 0 95 0 95 %
Credit index correlation 10 85 10 85 %
Discount margin / spread 1 105 1 72 %
Credit pair correlation 57 94 57 94 %
Discounted cash flow projection on underlying bond
Constant prepayment rate 0 15 0 15 %
Constant default rate 0 10 0 9 %
Loss severity 0 100 0 100 %
Discount margin / spread 1 15 1 15 %
Bond price equivalent 2 103 0 104 points
Foreign exchange contracts 0.4 0.5 0.2 0.2 Option model Rate-to-FX correlation (57) 60 (57) 60 %
FX-to-FX correlation (70) 80 (70) 80 %
Equity / index contracts 0.7 1.0 1.3 1.4 Option model Equity dividend yields 0 24 0 57 %
Volatility of equity stocks, equity and other indices 0 143 0 143 %
Equity-to-FX correlation (45) 82 (44) 82 %
Equity-to-equity correlation 11 100 3 99 %
Non-financial assets3, 5 0.1 0.1Relative value to market comparable Price
Discounted cash flow projection
Projection of cost and income related to the particular property
Discount rate
Assessment of the particular property’s condition
1 The ranges of significant unobservable inputs are represented in points, percentages and basis points. Points are a percentage of par. For example, 100 points would be 100% of par. 2 Weighted averages are provided for non-derivative financial instruments and were calculated by weighting inputs based on the fair values of the respective instruments. Weighted averages are not provided for inputs related to derivative contracts as this would not be meaningful. 3 The range of inputs is not disclosed due to the dispersion of possible values given the diverse nature of the investments. 4 Valuation techniques, significant unobservable inputs and the respective input ranges for structured debt instruments and non-structured fixed-rate bonds are the same as the equivalent derivative or structured financing instruments presented elsewhere in this table. 5 Non-financial assets include other assets which primarily consist of assets held for sale.

Notes to the UBS Group AG interim consolidated financial statements (unaudited)
130
Note 10 Fair value measurement (continued)
f) Sensitivity of fair value measurements to changes in unobservable input assumptions
The table below summarizes those financial assets and liabilities classified as Level 3 for which a change in one or more of the unobservable inputs to reflect reasonably possible alternative assumptions would change fair value significantly, and the esti-mated effect thereof. As of 31 March 2016, the total favorable and unfavorable effects of changing one or more of the unob-servable inputs to reflect reasonably possible alternative assump-tions for financial instruments classified as Level 3 were CHF 0.8 billion and CHF 0.6 billion, respectively (31 December 2015: CHF 0.8 billion and CHF 0.6 billion, respectively).
The table shown presents the favorable and unfavorable effects for each class of financial assets and liabilities for which the poten-
tial change in fair value is considered significant. The sensitivity data presented represent an estimation of valuation uncertainty based on reasonably possible alternative values for Level 3 inputs at the balance sheet date and does not represent the estimated effect of stress scenarios. Typically, these financial assets and liabil-ities are sensitive to a combination of inputs from Levels 1–3. Although well-defined interdependencies may exist between Lev-els 1–2 and Level 3 parameters (e.g., between interest rates, which are generally Level 1 or Level 2, and prepayments, which are gen-erally Level 3), these have not been incorporated in the table. Fur-ther, direct inter-relationships between the Level 3 parameters are not a significant element of the valuation uncertainty.
Sensitivity of fair value measurements to changes in unobservable input assumptions
31.3.16 31.12.15
CHF millionFavorablechanges1
Unfavorablechanges1
Favorablechanges1
Unfavorablechanges1
Government bills / bonds 0 (1) 0 (1)
Corporate bonds and municipal bonds, including bonds issued by financial institutions 40 (40) 24 (25)
Traded loans, loans designated at fair value, loan commitments and guarantees 102 (43) 88 (28)
Asset-backed securities 6 (8) 7 (6)
Equity instruments 152 (59) 166 (74)
Interest rate derivative contracts, net 76 (44) 107 (67)
Credit derivative contracts, net 155 (198) 174 (196)
Foreign exchange derivative contracts, net 21 (11) 33 (28)
Equity / index derivative contracts, net 61 (60) 61 (57)
Structured debt instruments issued and non-structured fixed-rate bonds 144 (155) 136 (146)
Other 16 (16) 14 (13)
Total 774 (634) 809 (640)
1 Of the total favorable changes, CHF 152 million as of 31 March 2016 (31 December 2015: CHF 164 million) related to financial assets available for sale. Of the total unfavorable changes, CHF 61 million as of 31 March 2016 (31 December 2015: CHF 71 million) related to financial assets available for sale.

Con
solid
ated
fina
ncia
l sta
tem
ents
131
Note 10 Fair value measurement (continued)
g) Financial instruments not measured at fair value
The table below reflects the estimated fair values of financial instruments not measured at fair value.
Financial instruments not measured at fair value
31.3.16 31.12.15
CHF billion Carrying value Fair value Carrying value Fair value
Assets
Cash and balances with central banks 105.7 105.7 91.3 91.3
Due from banks 13.6 13.6 11.9 11.9
Loans 304.9 308.0 312.0 314.1
Cash collateral on securities borrowed 32.4 32.4 25.6 25.6
Reverse repurchase agreements 73.6 73.6 67.9 67.9
Cash collateral receivables on derivative instruments 25.5 25.5 23.8 23.8
Financial assets held to maturity 2.9 2.9
Other assets 21.0 21.0 20.0 20.0
Liabilities
Due to banks 11.3 11.3 11.8 11.8
Due to customers 401.5 401.6 390.2 390.2
Cash collateral on securities lent 6.4 6.4 8.0 8.0
Repurchase agreements 6.5 6.5 9.7 9.7
Cash collateral payables on derivative instruments 36.7 36.7 38.3 38.3
Debt issued 101.4 103.0 93.0 95.5
Other liabilities 50.6 50.6 51.4 51.4
Guarantees / Loan commitments
Guarantees1 0.0 (0.1) 0.0 (0.1)
Loan commitments 0.0 0.1 0.0 0.0
1 The carrying value of guarantees represented a liability of CHF 0.0 billion as of 31 March 2016 (31 December 2015: CHF 0.0 billion). The estimated fair value of guarantees represented an asset of CHF 0.1 billion as of 31 March 2016 (31 December 2015: CHF 0.1 billion).
The fair values included in the table above were calculated for disclosure purposes only. The fair value valuation techniques and assumptions relate only to the fair value of UBS’s financial instru-ments not measured at fair value. Other institutions may use dif-
ferent methods and assumptions for their fair value estimation, and therefore such fair value disclosures cannot necessarily be compared from one financial institution to another.

Notes to the UBS Group AG interim consolidated financial statements (unaudited)
132
Note 11 Derivative instruments1
31.3.16
CHF billion
Positivereplacement
values
Notional valuesrelated to
positivereplacement
values2
Negativereplacement
values
Notional valuesrelated tonegative
replacementvalues2
Othernotionalvalues3
Derivative instruments
Interest rate contracts 84 1,388 78 1,226 9,591
Credit derivative contracts 6 175 6 186
Foreign exchange contracts 70 2,603 72 2,489 8
Equity / index contracts 17 234 21 306 41
Commodity contracts 3 37 2 32 8
Unsettled purchases of non-derivative financial investments4 0 30 0 21
Unsettled sales of non-derivative financial investments4 0 29 0 24
Total derivative instruments, based on IFRS netting5 181 4,496 179 4,284 9,647
31.12.15
CHF billion
Positivereplacement
values
Notional valuesrelated to
positivereplacement
values2
Negativereplacement
values
Notional valuesrelated tonegative
replacementvalues2
Othernotionalvalues3
Derivative instruments
Interest rate contracts 75 1,493 68 1,399 8,771
Credit derivative contracts 7 162 7 170
Foreign exchange contracts 66 2,658 63 2,487 8
Equity / index contracts 17 230 21 306 43
Commodity contracts 3 30 3 25 8
Unsettled purchases of non-derivative financial investments4 0 10 0 17
Unsettled sales of non-derivative financial investments4 0 20 0 6
Total derivative instruments, based on IFRS netting5 167 4,603 162 4,409 8,831
1 Bifurcated embedded derivatives are presented on the same balance sheet lines as their host contracts and are excluded from this table. As of 31 March 2016, these derivatives amounted to a PRV of CHF 0.1 billion (related notional values of CHF 4.4 billion) and an NRV of CHF 0.0 billion (related notional values of CHF 3.8 billion). As of 31 December 2015, bifurcated embedded derivatives amounted to a PRV of CHF 0.1 billion (related notional values of CHF 0.6 billion) and an NRV of CHF 0.2 billion (related notional values of CHF 3.4 billion). 2 In cases where replacement values are presented on a net basis on the balance sheet, the respec-tive notional values of the netted replacement values are still presented on a gross basis. 3 Other notional values relate to derivatives which are cleared through either a central clearing counterparty or an exchange. The fair value of these derivatives is presented on the balance sheet net of the corresponding cash margin under Cash collateral receivables on derivative instruments and Cash collateral payables on derivative instru-ments and was not material for all periods presented. 4 Changes in the fair value of purchased and sold non-derivative financial investments between trade date and settlement date are recognized as replacement values. 5 Includes exchange-traded agency transactions and OTC cleared transactions entered into on behalf of clients with a combined PRV of CHF 8.1 billion as of 31 March 2016 (31 December 2015: CHF 6.8 bil-lion), and a combined NRV of CHF 7.9 billion as of 31 March 2016 (31 December 2015: CHF 6.8 billion), for which notional values were not included in the table above due to their significantly different risk profile. Refer to Note 12 for more information on netting arrangements.

Con
solid
ated
fina
ncia
l sta
tem
ents
133
Note 12 Offsetting financial assets and financial liabilities
UBS enters into netting agreements with counterparties to man-age the credit risks associated primarily with repurchase and reverse repurchase transactions, securities borrowing and lending and over-the-counter and exchange-traded derivatives. These netting agreements and similar arrangements generally enable the counterparties to set-off liabilities against available assets received in the ordinary course of business and / or in the event that either counterparty to the transaction is unable to fulfill its contractual obligations. The right of set-off is a legal right to settle or otherwise eliminate all or a portion of an amount due by apply-ing an amount receivable from the same counterparty against it, thus reducing credit exposure.
Financial assets
The table below provides a summary of financial assets subject to offsetting, enforceable master netting arrangements and
similar agreements, as well as financial collateral received to mitigate credit exposures for these financial assets. The gross financial assets that are subject to offsetting, enforceable net-ting arrangements and similar agreements are reconciled to the net amounts presented within the associated balance sheet line, after giving effect to financial liabilities with the same counter-parties that have been offset on the balance sheet and other financial assets not subject to an enforceable netting arrange-ment or similar agreement. Further, related amounts for finan-cial liabilities and collateral received that are not offset on the balance sheet are shown to arrive at financial assets after con-sideration of netting potential.
UBS engages in a variety of counterparty credit mitigation strategies in addition to netting and collateral arrangements. Therefore, the net amounts presented in the tables on this and on the next page do not purport to represent actual credit exposure.
Financial assets subject to offsetting, enforceable master netting arrangements and similar agreements
31.3.16
Assets subject to netting arrangements
Netting recognized on the balance sheetNetting potential not recognized
on the balance sheet3
Assets notsubject to netting
arrangements4 Total assets
CHF billion
Gross assetsbefore
nettingNetting with
gross liabilities2
Net assetsrecognized
on thebalance
sheetFinancialliabilities
Collater-al
received
Assets afterconsid-
eration ofnetting
potential
Assetsrecognized
on thebalance
sheet
Total assetsafter consid-
eration of netting
potential
Total assetsrecognized
on the balance
sheetCash collateral on securities borrowed 30.2 0.0 30.2 (2.5) (27.7) 0.0 2.2 2.2 32.4Reverse repurchase agreements 114.9 (54.6) 60.3 (1.7) (58.6) 0.0 13.3 13.3 73.6Positive replacement values 174.0 (2.4) 171.5 (135.1) (25.6) 10.8 9.0 19.8 180.5Cash collateral receivables onderivative instruments1 126.5 (104.7) 21.8 (13.0) (0.9) 7.9 3.7 11.6 25.5Financial assets designated at fair value 2.5 0.0 2.5 0.0 (1.6) 0.9 38.5 39.3 41.0Total assets 448.0 (161.7) 286.3 (152.2) (114.5) 19.6 66.6 86.2 352.9
31.12.15
Assets subject to netting arrangements
Netting recognized on the balance sheetNetting potential not recognized
on the balance sheet3
Assets notsubject to netting
arrangements4 Total assets
CHF billion
Gross assetsbefore
nettingNetting with
gross liabilities2
Net assetsrecognized
on thebalance
sheetFinancialliabilities
Collater-al
received
Assets afterconsid-
eration ofnetting
potential
Assetsrecognized
on thebalance
sheet
Total assetsafter consid-
eration of netting
potential
Total assetsrecognized
on the balance
sheetCash collateral on securities borrowed 23.9 0.0 23.9 (3.1) (20.9) 0.0 1.6 1.6 25.6Reverse repurchase agreements 117.9 (62.1) 55.8 (4.4) (51.4) 0.0 12.1 12.1 67.9Positive replacement values 161.9 (2.5) 159.3 (123.0) (25.5) 10.8 8.1 18.9 167.4Cash collateral receivables onderivative instruments1 85.9 (66.3) 19.6 (10.9) (1.5) 7.2 4.1 11.3 23.8Financial assets designated at fair value 2.4 0.0 2.4 0.0 (1.8) 0.6 3.7 4.4 6.1Total assets 392.1 (131.0) 261.1 (141.3) (101.1) 18.7 29.7 48.4 290.81 The net amount of Cash collateral receivables on derivative instruments recognized on the balance sheet includes certain OTC derivatives which are in substance net settled on a daily basis under IAS 32, and ETD which are economically settled on a daily basis. In addition, this balance includes OTC and ETD cash collateral balances which correspond with the cash portion of collateral pledged, reflected on the Negative replacement val-ues line in the table presented on the following page. 2 The logic of the table results in amounts presented in the “Netting with gross liabilities” column corresponding directly to the amounts presented in the “Netting with gross assets”column in the liabilities table presented on the following page. 3 For the purpose of this disclosure, the amounts of financial instruments and cash collateral presented have been capped by the rel-evant netting agreement so as not to exceed the net amount of financial assets presented on the balance sheet; i.e., over-collateralization, where it exists, is not reflected in the table. 4 Includes assets not subject to enforceable netting arrangements and other out-of-scope items.

Notes to the UBS Group AG interim consolidated financial statements (unaudited)
134
Note 12 Offsetting financial assets and financial liabilities (continued)
Financial liabilities
The table below provides a summary of financial liabilities subject to offsetting, enforceable master netting arrangements and simi-lar agreements, as well as financial collateral pledged to mitigate credit exposures for these financial liabilities. The gross financial liabilities that are subject to offsetting, enforceable netting arrangements and similar agreements are reconciled to the net
amounts presented within the associated balance sheet line, after giving effect to financial assets with the same counterpar-ties that have been offset on the balance sheet and other finan-cial liabilities not subject to an enforceable netting arrangement or similar agreement. Further, related amounts for financial assets and collateral pledged that are not offset on the balance sheet are shown to arrive at financial liabilities after consideration of netting potential.
Financial liabilities subject to offsetting, enforceable master netting arrangements and similar agreements
31.3.16
Liabilities subject to netting arrangements
Netting recognized on the balance sheetNetting potential not recognized
on the balance sheet3
Liabilities notsubject to
netting arrangements4 Total liabilities
CHF billion
Grossliabilities
beforenetting
Netting with gross assets2
Net liabilities
recognizedon the
balancesheet
Financialassets
Collateralpledged
Liabilitiesafter consid-
eration of netting
potential
Liabilitiesrecognized
on thebalance
sheet
Total liabilities
after consid-eration of
nettingpotential
Total liabilities
recognizedon the
balance sheet
Cash collateral on securities lent 6.3 0.0 6.3 (2.5) (3.8) 0.0 0.1 0.1 6.4
Repurchase agreements 59.9 (54.6) 5.3 (1.7) (3.7) 0.0 1.2 1.2 6.5
Negative replacement values 169.3 (2.4) 166.9 (135.1) (17.3) 14.5 12.1 26.6 179.0
Cash collateral payables onderivative instruments1 137.1 (104.7) 32.4 (19.3) (1.6) 11.5 4.3 15.8 36.7
Financial liabilities designated at fair value 3.0 0.0 3.0 0.0 (0.8) 2.2 54.7 56.9 57.8
Total liabilities 375.7 (161.7) 213.9 (158.5) (27.2) 28.2 72.4 100.6 286.3
31.12.15
Liabilities subject to netting arrangements
Netting recognized on the balance sheetNetting potential not recognized
on the balance sheet3
Liabilities notsubject to
netting arrangements4 Total liabilities
CHF billion
Grossliabilities
beforenetting
Netting with gross assets2
Net liabilities
recognizedon the
balancesheet
Financialassets
Collateralpledged
Liabilitiesafter consid-
eration of netting
potential
Liabilitiesrecognized
on thebalance
sheet
Total liabilities
after consid-eration of
nettingpotential
Total liabilities
recognizedon the
balance sheet
Cash collateral on securities lent 7.9 0.0 7.9 (3.1) (4.8) 0.0 0.1 0.1 8.0
Repurchase agreements 69.0 (62.1) 6.9 (4.4) (2.5) 0.0 2.8 2.8 9.7
Negative replacement values 154.2 (2.5) 151.7 (123.0) (17.4) 11.3 10.7 22.1 162.4
Cash collateral payables onderivative instruments1 99.9 (66.3) 33.6 (19.0) (2.5) 12.1 4.7 16.8 38.3
Financial liabilities designated at fair value 3.9 0.0 3.9 0.0 (0.7) 3.1 59.1 62.3 63.0
Total liabilities 334.9 (131.0) 203.9 (149.4) (28.0) 26.5 77.4 104.0 281.41 The net amount of Cash collateral payables on derivative instruments recognized on the balance sheet includes certain OTC derivatives which are in substance net settled on a daily basis under IAS 32, and ETD which are economically settled on a daily basis. In addition, this balance includes OTC and ETD cash collateral balances which correspond with the cash portion of collateral received, reflected on the Positive replacement val-ues line in the table presented on the previous page. 2 The logic of the table results in amounts presented in the “Netting with gross assets” column corresponding directly to the amounts presented in the “Netting with gross liabilities” column in the assets table presented on the previous page. 3 For the purpose of this disclosure, the amounts of financial instruments and cash collateral presented have been capped by the rel-evant netting agreement so as not to exceed the net amount of financial liabilities presented on the balance sheet; i.e., over-collateralization, where it exists, is not reflected in the table. 4 Includes liabilities not subject to enforceable netting arrangements and other out-of-scope items.

Con
solid
ated
fina
ncia
l sta
tem
ents
135
Note 13 Other assets and liabilities
CHF million 31.3.16 31.12.15
Other assets
Prime brokerage receivables1 11,754 11,341
Recruitment loans to financial advisors 3,128 3,184
Other loans to financial advisors 522 418
Bail deposit2 1,229 1,221
Accrued interest income 547 462
Accrued income – other 915 844
Prepaid expenses 1,068 1,033
Net defined benefit pension and post-employment assets 0 50
Settlement and clearing accounts 499 402
VAT and other tax receivables 410 398
Properties and other non-current assets held for sale 135 134
Assets of disposal group held for sale3 264 279
Other 2,651 2,393
Total other assets 23,123 22,160
Other liabilities
Prime brokerage payables1 44,011 45,306
Amounts due under unit-linked investment contracts 15,100 15,718
Compensation-related liabilities 4,917 6,839
of which: accrued expenses 990 2,885
of which: deferred contingent capital plans 1,198 1,181
of which: other deferred compensation plans 1,870 2,038
of which: net defined benefit pension and post-employment liabilities 859 736
Third-party interest in consolidated investment funds 518 536
Settlement and clearing accounts 1,408 894
Current and deferred tax liabilities 945 819
VAT and other tax payables 469 447
Deferred income 198 210
Accrued interest expenses 1,275 1,431
Other accrued expenses 2,753 2,500
Liabilities of disposal group held for sale3 217 235
Other 650 718
Total other liabilities 72,461 75,652
1 Prime brokerage services include clearance, settlement, custody, financing and portfolio reporting services for corporate clients trading across multiple asset classes. Prime brokerage receivables are mainly comprised of margin lending receivables. Prime brokerage payables are mainly comprised of client securities financing and deposits. 2 Refer to item 1 in Note 16b for more information. 3 Refer to Note 18 for more information.

Notes to the UBS Group AG interim consolidated financial statements (unaudited)
136
Note 14 Financial liabilities designated at fair value
CHF million 31.3.16 31.12.15
Non-structured fixed-rate bonds 4,008 4,098
of which: issued by UBS AG with original maturity greater than one year1, 2 3,433 3,542
Structured debt instruments issued3 47,899 52,436
of which: issued by UBS AG with original maturity greater than one year1, 4 33,478 36,539
Structured over-the-counter debt instruments 4,728 5,493
of which: issued by UBS AG with original maturity greater than one year1, 5 3,760 4,497
Repurchase agreements 1,036 849
Loan commitments and guarantees6 90 119
Total 57,761 62,995
of which: life-to-date own credit (gain) / loss (332) (287)
1 Issued by UBS AG (standalone). Based on original contractual maturity without considering any early redemption features. 2 100% of the balance as of 31 March 2016 was unsecured (31 December 2015: 100% of the balance was unsecured). 3 Includes non-structured rates-linked debt instruments issued. 4 More than 98% of the balance as of 31 March 2016 was unsecured (31 December 2015: more than 98% of the bal-ance was unsecured). 5 More than 45% of the balance as of 31 March 2016 was unsecured (31 December 2015: more than 35% of the balance was unsecured). 6 Loan commitments recognized as “Financial lia-bilities designated at fair value” until drawn and recognized as loans.
Note 15 Debt issued held at amortized cost
CHF million 31.3.16 31.12.15
Certificates of deposit 17,689 11,967
Commercial paper 5,835 3,824
Other short-term debt 6,282 5,424
Short-term debt1 29,806 21,215
Non-structured fixed-rate bonds 29,566 31,240
of which: issued by UBS AG with original maturity greater than one year2 29,403 31,078
Senior unsecured debt that will contribute to total loss-absorbing capacity3 6,904 5,633
Covered bonds 7,289 8,490
Subordinated debt 19,019 17,763
of which: high-trigger loss-absorbing additional tier 1 perpetual capital notes 4,264 2,837
of which: low-trigger loss-absorbing additional tier 1 perpetual capital notes 2,360 2,326
of which: low-trigger loss-absorbing tier 2 capital 10,239 10,346
of which: phase-out tier 2 capital 2,156 2,254
Debt issued through the central bond institutions of the Swiss regional or cantonal banks 8,196 8,237
Other long-term debt 536 570
of which: issued by UBS AG with original maturity greater than one year2 257 278
Long-term debt4 71,510 71,932
Total debt issued held at amortized cost5 101,316 93,147
1 Debt with an original maturity of less than one year. 2 Issued by UBS AG (standalone). Based on original contractual maturity without considering any early redemption features. 100% of the balance as of 31 March 2016 was unsecured (31 December 2015: 100% of the balance was unsecured). 3 Issued by UBS Group Funding (Jersey) Ltd., a funding subsidiary directly held and guaranteed by UBS Group AG. 4 Debt with origi-nal maturity greater than or equal to one year. 5 Net of bifurcated embedded derivatives with a net positive fair value of CHF 55 million as of 31 March 2016 (31 December 2015: net negative fair value of CHF 130 million).

Con
solid
ated
fina
ncia
l sta
tem
ents
137
Note 16 Provisions and contingent liabilities
a) Provisions
CHF millionOperational
risks1
Litigation, regulatory
and similar matters2
Restruc-turing
Loan com-mitments
and guarantees
Real estate
Employee benefits5 Other
Totalprovisions
Balance as of 31 December 2015 47 2,983 624 35 157 198 120 4,164
Increase in provisions recognized in the income statement 7 49 40 3 0 1 14 114
Release of provisions recognized in the income statement (1) (7) (27) (2) 0 (1) (1) (39)
Provisions used in conformity with designated purpose (12) (50) (81) 0 (5) 0 0 (149)
Capitalized reinstatement costs 0 0 0 0 1 0 0 1
Reclassifications 0 0 0 (1) 0 0 0 (1)
Foreign currency translation / unwind of discount (1) (99) (19) 0 (4) (6) (1) (130)
Balance as of 31 March 2016 41 2,876 5363 36 1494 192 131 3,9611 Comprises provisions for losses resulting from security risks and transaction processing risks. 2 Comprises provisions for losses resulting from legal, liability and compliance risks. 3 Includes personnel related restruc-turing provisions of CHF 92 million as of 31 March 2016 (31 December 2015: CHF 110 million) and provisions for onerous lease contracts of CHF 444 million as of 31 March 2016 (31 December 2015: CHF 514 mil-lion). 4 Includes reinstatement costs for leasehold improvements of CHF 94 million as of 31 March 2016 (31 December 2015: CHF 95 million) and provisions for onerous lease contracts of CHF 55 million as of 31 March 2016 (31 December 2015: CHF 62 million). 5 Includes provisions for sabbatical and anniversary awards as well as provisions for severance which are not part of restructuring provisions.
Restructuring provisions primarily relate to onerous lease con-tracts and severance payments. The utilization of onerous lease provisions is driven by the maturities of the underlying lease con-tracts. Severance-related provisions are utilized within a short time period, usually within six months, but potential changes in amount may be triggered when natural staff attrition reduces the
number of people affected by a restructuring and therefore the estimated costs.
Information on provisions and contingent liabilities in respect of Litigation, regulatory and similar matters, as a class, is included in Note 16b. There are no material contingent liabilities associated with the other classes of provisions.
b) Litigation, regulatory and similar matters
The Group operates in a legal and regulatory environment that exposes it to significant litigation and similar risks arising from disputes and regulatory proceedings. As a result, UBS (which for purposes of this Note may refer to UBS Group AG and / or one or more of its subsidiaries, as applicable) is involved in various dis-putes and legal proceedings, including litigation, arbitration, and regulatory and criminal investigations.
Such matters are subject to many uncertainties and the out-come is often difficult to predict, particularly in the earlier stages of a case. There are also situations where the Group may enter into a settlement agreement. This may occur in order to avoid the expense, management distraction or reputational implications of continuing to contest liability, even for those matters for which the Group believes it should be exonerated. The uncertainties inherent in all such matters affect the amount and timing of any potential outflows for both matters with respect to which provi-sions have been established and other contingent liabilities. The Group makes provisions for such matters brought against it when, in the opinion of management after seeking legal advice, it is more likely than not that the Group has a present legal or con-
structive obligation as a result of past events, it is probable that an outflow of resources will be required, and the amount can be reliably estimated. Where these factors are otherwise satisfied, a provision may be established for claims that have not yet been asserted against the Group, but are nevertheless expected to be, based on the Group’s experience with similar asserted claims. If any of those conditions is not met, such matters result in contin-gent liabilities. If the amount of an obligation cannot be reliably estimated, a liability exists that is not recognized even if an out-flow of resources is probable. Accordingly, no provision is estab-lished even if the potential outflow of resources with respect to select matters could be significant.
Specific litigation, regulatory and other matters are described below, including all such matters that management considers to be material and others that management believes to be of signifi-cance due to potential financial, reputational and other effects. The amount of damages claimed, the size of a transaction or other information is provided where available and appropriate in order to assist users in considering the magnitude of potential exposures.

Notes to the UBS Group AG interim consolidated financial statements (unaudited)
138
Note 16 Provisions and contingent liabilities (continued)
In the case of certain matters below, we state that we have established a provision, and for the other matters we make no such statement. When we make this statement and we expect disclosure of the amount of a provision to prejudice seriously our position with other parties in the matter, because it would reveal what UBS believes to be the probable and reliably estimable out-flow, we do not disclose that amount. In some cases we are sub-ject to confidentiality obligations that preclude such disclosure. With respect to the matters for which we do not state whether we have established a provision, either (a) we have not estab-lished a provision, in which case the matter is treated as a contin-gent liability under the applicable accounting standard or (b) we have established a provision but expect disclosure of that fact to prejudice seriously our position with other parties in the matter because it would reveal the fact that UBS believes an outflow of resources to be probable and reliably estimable.
With respect to certain litigation, regulatory and similar matters for which we have established provisions, we are able to estimate the expected timing of outflows. However, the aggregate amount of the expected outflows for those matters for which we are able to estimate expected timing is immaterial relative to our current and expected levels of liquidity over the relevant time periods.
The aggregate amount provisioned for litigation, regulatory and similar matters as a class is disclosed in Note 16a above. It is not practicable to provide an aggregate estimate of liability for our litigation, regulatory and similar matters as a class of contin-gent liabilities. Doing so would require us to provide speculative legal assessments as to claims and proceedings that involve unique fact patterns or novel legal theories, which have not yet been initiated or are at early stages of adjudication, or as to which alleged damages have not been quantified by the claimants. Although we therefore cannot provide a numerical estimate of
the future losses that could arise from litigation, regulatory and similar matters, we believe that the aggregate amount of possible future losses from this class that are more than remote substan-tially exceeds the level of current provisions. Litigation, regulatory and similar matters may also result in non-monetary penalties and consequences. For example, the Non-Prosecution Agreement (NPA) described in paragraph 5 of this Note, which we entered into with the US Department of Justice (DOJ), Criminal Division, Fraud Section in connection with our submissions of benchmark interest rates, including, among others, the British Bankers’ Asso-ciation London Interbank Offered Rate (LIBOR), was terminated by the DOJ based on its determination that we had committed a US crime in relation to foreign exchange matters. As a consequence, UBS AG has pleaded guilty to one count of wire fraud for conduct in the LIBOR matter, and has agreed to pay a USD 203 million fine and accept a three-year term of probation. A guilty plea to, or conviction of, a crime (including as a result of termination of the NPA) could have material consequences for UBS. Resolution of regulatory proceedings may require us to obtain waivers of regu-latory disqualifications to maintain certain operations, may entitle regulatory authorities to limit, suspend or terminate licenses and regulatory authorizations and may permit financial market utilities to limit, suspend or terminate our participation in such utilities. Failure to obtain such waivers, or any limitation, suspension or termination of licenses, authorizations or participations, could have material consequences for UBS.
The risk of loss associated with litigation, regulatory and similar matters is a component of operational risk for purposes of deter-mining our capital requirements. Information concerning our capital requirements and the calculation of operational risk for this purpose is included in the “Capital management” section of this report.
Provisions for litigation, regulatory and similar matters by business division and Corporate Center unit1
CHF millionWealth
Management
WealthManagement
Americas
Personal &Corporate
BankingAsset
ManagementInvestment
BankCC –
ServicesCC –
Group ALM
CC –Non-core
and LegacyPortfolio UBS
Balance as of 31 December 2015 245 459 83 16 585 310 0 1,284 2,983
Increase in provisions recognized in the income statement 1 20 0 0 1 0 0 27 49
Release of provisions recognized in the income statement (1) (2) (1) 0 (2) 0 0 (1) (7)
Provisions used in conformity with designated purpose (1) (31) (2) (2) (4) 0 0 (10) (50)
Foreign currency translation / unwind of discount (1) (19) 0 (1) (23) (3) 0 (52) (99)
Balance as of 31 March 2016 242 427 81 13 557 307 0 1,248 2,8761 Provisions, if any, for the matters described in this Note are recorded in Wealth Management (item 3), Wealth Management Americas (item 4), Corporate Center – Services (item 7) and Corporate Center – Non-core and Legacy Portfolio (items 2 and 8). Provisions, if any, for the matters described in this Note in items 1 and 6 are allocated between Wealth Management and Personal & Corporate Banking, and provisions, if any, for the matters described in this Note in item 5 are allocated between the Investment Bank, Corporate Center – Services and Corporate Center – Non-core and Legacy Portfolio.

Con
solid
ated
fina
ncia
l sta
tem
ents
139
Note 16 Provisions and contingent liabilities (continued)
1. Inquiries regarding cross-border wealth management businesses Tax and regulatory authorities in a number of countries have made inquiries, served requests for information or examined employees located in their respective jurisdictions relating to the cross-border wealth management services provided by UBS and other financial institutions. It is possible that implementation of automatic tax information exchange and other measures relating to cross-border provision of financial services could give rise to further inquiries in the future.
As a result of investigations in France, in 2013, UBS (France) S.A. and UBS AG were put under formal examination (“mise en examen”) for complicity in having illicitly solicited clients on French territory, and were declared witness with legal assistance (“témoin assisté”) regarding the laundering of proceeds of tax fraud and of banking and financial solicitation by unauthorized persons. In 2014, UBS AG was placed under formal examination with respect to the potential charges of laundering of proceeds of tax fraud, and the investigating judges ordered UBS to provide bail (“caution”) of EUR 1.1 billion. UBS AG appealed the determi-nation of the bail amount, but both the appeal court (“Cour d’Appel”) and the French Supreme Court (“Cour de Cassation”) upheld the bail amount and rejected the appeal in full in late 2014. UBS AG has filed and has had formally registered an appli-cation to the European Court of Human Rights to challenge vari-ous aspects of the French court’s decision. In September 2015, the former CEO of UBS Wealth Management was placed under for-mal examination in connection with these proceedings. In addi-tion, the investigating judges have sought to issue arrest warrants against three Swiss-based former employees of UBS AG who did not appear when summoned by the investigating judge. In Febru-ary 2016, the investigating judge notified UBS that he has closed his investigation. This notification commences a period during which the National Financial Prosecutor will make a recommenda-tion (“réquisitoire”) whether UBS will be charged.
In 2015, UBS (France) S.A. was placed under formal examina-tion for complicity regarding the laundering of proceeds of tax fraud and of banking and financial solicitation by unauthorized persons for the years 2004 until 2008 and declared witness with legal assistance for the years 2009 to 2012. A bail of EUR 40 mil-lion was imposed, and was subsequently reduced by the Court of Appeals to EUR 10 million.
UBS has been notified by the Belgian investigating judge that it is under formal investigation (“inculpé”) regarding the launder-ing of proceeds of tax fraud and of banking, financial solicitation by unauthorized persons and serious tax fraud.
In 2015, UBS received inquiries from the US Attorney’s Office for the Eastern District of New York and from the US Securities and Exchange Commission (SEC), which are investigating poten-tial sales to US persons of bearer bonds and other unregistered securities in possible violation of the Tax Equity and Fiscal Respon-sibility Act of 1982 (TEFRA) and the registration requirements of the US securities laws. UBS is cooperating with the authorities in these investigations.
UBS has, and reportedly numerous other financial institutions have, received inquiries from authorities concerning accounts relating to the Fédération Internationale de Football Association (FIFA) and other constituent soccer associations and related per-sons and entities. UBS is cooperating with authorities in these inquiries.
Our balance sheet at 31 March 2016 reflected provisions with respect to matters described in this item 1 in an amount that UBS believes to be appropriate under the applicable accounting stan-dard. As in the case of other matters for which we have estab-lished provisions, the future outflow of resources in respect of such matters cannot be determined with certainty based on cur-rently available information, and accordingly may ultimately prove to be substantially greater (or may be less) than the provision that we have recognized.
2. Claims related to sales of residential mortgage-backed securities and mortgagesFrom 2002 through 2007, prior to the crisis in the US residential loan market, UBS was a substantial issuer and underwriter of US residential mortgage-backed securities (RMBS) and was a pur-chaser and seller of US residential mortgages. A subsidiary of UBS, UBS Real Estate Securities Inc. (UBS RESI), acquired pools of resi-dential mortgage loans from originators and (through an affiliate) deposited them into securitization trusts. In this manner, from 2004 through 2007, UBS RESI sponsored approximately USD 80 billion in RMBS, based on the original principal balances of the securities issued.
UBS RESI also sold pools of loans acquired from originators to third-party purchasers. These whole loan sales during the period 2004 through 2007 totaled approximately USD 19 billion in origi-nal principal balance.
We were not a significant originator of US residential loans. A subsidiary of UBS originated approximately USD 1.5 billion in US residential mortgage loans during the period in which it was active from 2006 to 2008, and securitized less than half of these loans.

Notes to the UBS Group AG interim consolidated financial statements (unaudited)
140
Note 16 Provisions and contingent liabilities (continued)
RMBS-related lawsuits concerning disclosures: UBS is named as a defendant relating to its role as underwriter and issuer of RMBS in lawsuits related to approximately USD 3.7 billion in original face amount of RMBS underwritten or issued by UBS. Of the USD 3.7 billion in original face amount of RMBS that remains at issue in these cases, approximately USD 1.3 billion was issued in offerings in which a UBS subsidiary transferred underlying loans (the major-ity of which were purchased from third-party originators) into a securitization trust and made representations and warranties about those loans (UBS-sponsored RMBS). The remaining USD 2.4 billion of RMBS to which these cases relate was issued by third parties in securitizations in which UBS acted as underwriter (third-party RMBS). The original face amounts noted above reflect set-tlement of a matter in April 2016 involving USD 1.9 billion of UBS-sponsored RMBS and USD 623 million of third-party RMBS for which the settlement amount will be reflected as a use of provision in the second quarter of 2016.
In connection with certain of these lawsuits, UBS has indemni-fication rights against surviving third-party issuers or originators for losses or liabilities incurred by UBS, but UBS cannot predict the extent to which it will succeed in enforcing those rights.
UBS is a defendant in two lawsuits brought by the National Credit Union Administration (NCUA), as conservator for certain failed credit unions, asserting misstatements and omissions in the offering documents for RMBS purchased by the credit unions. Both lawsuits were filed in US District Courts, one in the District of Kansas and the other in the Southern District of New York (SDNY). The original principal balance at issue in the Kansas case is approx-imately USD 1.15 billion and the original principal balance at issue in the SDNY case is approximately USD 400 million. In February 2016, UBS made an offer of judgment to NCUA in the SDNY case, which NCUA accepted, pursuant to which UBS agreed to pay to NCUA approximately USD 33 million plus approximately USD 36.8 million in prejudgment interest, for a total of approximately USD 69.8 million, in addition to reasonable attorneys’ fees incurred by NCUA. Judgment was entered by the Court on April 25, 2016.
Lawsuits related to contractual representations and warranties concerning mortgages and RMBS: When UBS acted as an RMBS sponsor or mortgage seller, we generally made certain representa-tions relating to the characteristics of the underlying loans. In the event of a material breach of these representations, we were in certain circumstances contractually obligated to repurchase the loans to which the representations related or to indemnify certain parties against losses. UBS has received demands to repurchase US residential mortgage loans as to which UBS made certain rep-resentations at the time the loans were transferred to the securi-tization trust aggregating approximately USD 4.1 billion in origi-nal principal balance. Of this amount, UBS considers claims relating to approximately USD 2 billion in original principal bal-
ance to be resolved, including claims barred by the statute of limitations. Substantially all of the remaining claims are in litiga-tion, including the matters described in the next paragraph. UBS believes that new demands to repurchase US residential mort-gage loans are time-barred under a decision rendered by the New York Court of Appeals.
In 2012, certain RMBS trusts filed an action (Trustee Suit) in the SDNY seeking to enforce UBS RESI’s obligation to repurchase loans in the collateral pools for three RMBS securitizations (Trans-actions) with an original principal balance of approximately USD 2 billion, for which Assured Guaranty Municipal Corp. (Assured Guaranty), a financial guaranty insurance company, had previ-ously demanded repurchase. In January 2015, the court rejected plaintiffs’ efforts to seek damages for all loans purportedly in breach of representations and warranties in any of the three Transactions and limited plaintiffs to pursuing claims based solely on alleged breaches for loans identified in the complaint or other breaches that plaintiffs can establish were independently discov-ered by UBS. In February 2015, the court denied plaintiffs’ motion seeking reconsideration of its ruling. However, in April 2016, the Court ruled that, based on an intervening decision of an intermediate New York appellate court, it would allow plain-tiffs to proceed with their claims at trial as to all loans purport-edly in breach. With respect to the loans subject to the Trustee Suit that were originated by institutions still in existence, UBS intends to enforce its indemnity rights against those institutions. Trial is currently underway.
We also have tolling agreements with certain institutional pur-chasers of RMBS concerning their potential claims related to sub-stantial purchases of UBS-sponsored or third-party RMBS.
Mortgage-related regulatory matters: In 2014, UBS received a subpoena from the US Attorney’s Office for the Eastern District of New York issued pursuant to the Financial Institutions Reform, Recovery and Enforcement Act of 1989 (FIRREA), which seeks documents and information related to UBS’s RMBS business from 2005 through 2007. In 2015, the Eastern District of New York identified a number of transactions that are currently the focus of their inquiry, as to which we are providing additional information. UBS continues to respond to the FIRREA subpoena and to subpoe-nas from the New York State Attorney General (NYAG) relating to its RMBS business. In addition, UBS has also been responding to inquiries from both the Special Inspector General for the Troubled Asset Relief Program (SIGTARP) (who is working in conjunction with the US Attorney’s Office for Connecticut and the DOJ) and the SEC relating to trading practices in connection with purchases and sales of mortgage-backed securities in the secondary market from 2009 through the present. We are cooperating with the authorities in these matters. Numerous other banks reportedly are responding to similar inquiries from these authorities.

Con
solid
ated
fina
ncia
l sta
tem
ents
141
Note 16 Provisions and contingent liabilities (continued)
Provision for claims related to sales of residential mortgage-backed securities and mortgages
USD million
Balance as of 31 December 2015 1,218
Increase in provision recognized in the income statement 28
Release of provision recognized in the income statement 0
Provision used in conformity with designated purpose (4)
Balance as of 31 March 2016 1,242
As reflected in the table “Provision for claims related to sales of residential mortgage-backed securities and mortgages,” our bal-ance sheet at 31 March 2016 reflected a provision of USD 1,242 million with respect to matters described in this item 2. As in the case of other matters for which we have established provisions, the future outflow of resources in respect of this matter cannot be determined with certainty based on currently available information, and accordingly may ultimately prove to be substantially greater (or may be less) than the provision that we have recognized.
3. MadoffIn relation to the Bernard L. Madoff Investment Securities LLC (BMIS) investment fraud, UBS AG, UBS (Luxembourg) SA and cer-tain other UBS subsidiaries have been subject to inquiries by a number of regulators, including the Swiss Financial Market Super-visory Authority (FINMA) and the Luxembourg Commission de Surveillance du Secteur Financier (CSSF). Those inquiries con-cerned two third-party funds established under Luxembourg law, substantially all assets of which were with BMIS, as well as certain funds established in offshore jurisdictions with either direct or indirect exposure to BMIS. These funds now face severe losses, and the Luxembourg funds are in liquidation. The last reported net asset value of the two Luxembourg funds before revelation of the Madoff scheme was approximately USD 1.7 billion in the aggregate, although that figure likely includes fictitious profit reported by BMIS. The documentation establishing both funds identifies UBS entities in various roles, including custodian, admin-istrator, manager, distributor and promoter, and indicates that UBS employees serve as board members. UBS (Luxembourg) SA and certain other UBS subsidiaries are responding to inquiries by Luxembourg investigating authorities, without, however, being named as parties in those investigations. In 2009 and 2010, the liquidators of the two Luxembourg funds filed claims on behalf of the funds against UBS entities, non-UBS entities and certain indi-viduals, including current and former UBS employees. The amounts claimed are approximately EUR 890 million and EUR 305 million, respectively. The liquidators have filed supplementary claims for amounts that the funds may possibly be held liable to pay the BMIS Trustee. These amounts claimed by the liquidator
are approximately EUR 564 million and EUR 370 million, respec-tively. In addition, a large number of alleged beneficiaries have filed claims against UBS entities (and non-UBS entities) for pur-ported losses relating to the Madoff scheme. The majority of these cases are pending in Luxembourg, where appeals were filed by the claimants against the 2010 decisions of the court in which the claims in a number of test cases were held to be inadmissible. In 2014, the Luxembourg Court of Appeal dismissed one test appeal in its entirety, which decision was appealed by the investor. In 2015, the Luxembourg Supreme Court found in favor of UBS and dismissed the investor’s appeal. In the US, the BMIS Trustee filed claims in 2010 against UBS entities, among others, in relation to the two Luxembourg funds and one of the offshore funds. The total amount claimed against all defendants in these actions was not less than USD 2 billion. Following a motion by UBS, in 2011, the SDNY dismissed all of the BMIS Trustee’s claims other than claims for recovery of fraudulent conveyances and preference payments that were allegedly transferred to UBS on the ground that the BMIS Trustee lacks standing to bring such claims. In 2013, the Second Circuit affirmed the District Court’s decision and, in 2014, the US Supreme Court denied the BMIS Trustee’s petition seeking review of the Second Circuit ruling. In 2014, several claims, including a purported class action, were filed in the US by BMIS customers against UBS entities, asserting claims similar to the ones made by the BMIS Trustee, seeking unspecified dam-ages. One claim was voluntarily withdrawn by the plaintiff. In 2015, following a motion by UBS, the SDNY dismissed the two remaining claims on the basis that the New York courts did not have jurisdiction to hear the claims against the UBS entities. In Germany, certain clients of UBS are exposed to Madoff-managed positions through third-party funds and funds administered by UBS entities in Germany. A small number of claims have been filed with respect to such funds. In 2015, a court of appeal reversed a lower court decision in favor of UBS in one such case and ordered UBS to pay EUR 49 million, plus interest (approxi-mately EUR 15.3 million). UBS filed an application for leave to appeal the decision. That application was rejected by the German Federal Supreme Court in 2015, meaning that the Court of Appeal’s decision is final.

Notes to the UBS Group AG interim consolidated financial statements (unaudited)
142
Note 16 Provisions and contingent liabilities (continued)
4. Puerto RicoDeclines since August 2013 in the market prices of Puerto Rico municipal bonds and of closed-end funds (the funds) that are sole-managed and co-managed by UBS Trust Company of Puerto Rico and distributed by UBS Financial Services Incorporated of Puerto Rico (UBS PR) have led to multiple regulatory inquiries, as well as customer complaints and arbitrations with aggregate claimed damages of approximately USD 1.6 billion, of which claims with aggregate claimed damages of approximately USD 430 million have been resolved through settlements or arbitra-tion. The claims are filed by clients in Puerto Rico who own the funds or Puerto Rico municipal bonds and / or who used their UBS account assets as collateral for UBS non-purpose loans; customer complaint and arbitration allegations include fraud, misrepresen-tation and unsuitability of the funds and of the loans. A share-holder derivative action was filed in 2014 against various UBS entities and current and certain former directors of the funds, alleging hundreds of millions of US dollars in losses in the funds. In 2015, defendants’ motion to dismiss was denied. Defendants are seeking leave to appeal that ruling to the Puerto Rico Supreme Court. In 2014, a federal class action complaint also was filed against various UBS entities, certain members of UBS PR senior management, and the co-manager of certain of the funds seek-ing damages for investor losses in the funds during the period from May 2008 through May 2014. Defendants have moved to dismiss that complaint. In 2015, a class action was filed in Puerto Rico state court against UBS PR seeking equitable relief in the form of a stay of any effort by UBS PR to collect on non-purpose loans it acquired from UBS Bank USA in December 2013 based on plaintiffs’ allegation that the loans are not valid. The trial court denied defendants’ motion to dismiss the action based on a forum selection clause in the loan agreements; the Puerto Rico Supreme Court has stayed the action pending its review of defen-dants’ appeal from that ruling.
In 2014, UBS reached a settlement with the Office of the Com-missioner of Financial Institutions for the Commonwealth of Puerto Rico (OCFI) in connection with OCFI’s examination of UBS’s operations from January 2006 through September 2013, pursu-ant to which UBS is paying up to an aggregate of USD 7.7 million in investor education contributions and restitution.
In 2015, the SEC and the Financial Industry Regulatory Authority (FINRA) announced settlements with UBS PR of their
separate investigations stemming from the 2013 market events. Without admitting or denying the findings in either matter, UBS PR agreed in the SEC settlement to pay USD 15 million and USD 18.5 million in the FINRA matter (which includes up to USD 11 million in restitution to 165 UBS PR customers and a civil penalty of USD 7.5 million). We also understand that the DOJ is conduct-ing a criminal inquiry into the impermissible reinvestment of non-purpose loan proceeds. We are cooperating with the authorities in this inquiry.
In 2011, a purported derivative action was filed on behalf of the Employee Retirement System of the Commonwealth of Puerto Rico (System) against over 40 defendants, including UBS PR, which was named in connection with its underwriting and consulting services. Plaintiffs alleged that defendants violated their purported fiduciary duties and contractual obligations in connection with the issuance and underwriting of approximately USD 3 billion of bonds by the System in 2008 and sought damages of over USD 800 mil-lion. Defendants’ motion to dismiss is pending.
Also, in 2013, an SEC Administrative Law Judge dismissed a case brought by the SEC against two UBS executives, finding no violations. The charges had stemmed from the SEC’s investiga-tion of UBS’s sale of closed-end funds in 2008 and 2009, which UBS settled in 2012. Beginning in 2012, two federal class action complaints, which were subsequently consolidated, were filed against various UBS entities, certain of the funds, and certain members of UBS PR senior management, seeking damages for investor losses in the funds during the period from January 2008 through May 2012 based on allegations similar to those in the SEC action. The Magistrate Judge for the consolidated case has recommended that plaintiffs’ motion to certify the proposed class be denied.
In 2015 Puerto Rico’s Governor stated that the Commonwealth was unable to meet its obligations. Certain agencies and public corporations of the Commonwealth have defaulted on certain interest payments beginning in August 2015 and additional pay-ment defaults are expected to occur. These events, further defaults, any legislative action to create a legal means of restruc-turing Commonwealth obligations or to impose oversight on the Commonwealth’s finances, or any restructuring of the Common-wealth’s obligations, may increase the number of claims against UBS concerning Puerto Rico securities, as well as potential dam-ages sought.

Con
solid
ated
fina
ncia
l sta
tem
ents
143
Note 16 Provisions and contingent liabilities (continued)
Our balance sheet at 31 March 2016 reflected provisions with respect to matters described in this item 4 in amounts that UBS believes to be appropriate under the applicable accounting stan-dard. As in the case of other matters for which we have estab-lished provisions, the future outflow of resources in respect of such matters cannot be determined with certainty based on cur-rently available information, and accordingly may ultimately prove to be substantially greater (or may be less) than the provisions that we have recognized.
5. Foreign exchange, LIBOR, and benchmark rates, and other trading practicesForeign exchange-related regulatory matters: Following an initial media report in 2013 of widespread irregularities in the foreign exchange markets, UBS immediately commenced an internal review of its foreign exchange business, which includes our pre-cious metals and related structured products businesses. Since then, various authorities have commenced investigations con-cerning possible manipulation of foreign exchange markets, including FINMA, the Swiss Competition Commission (WEKO), the DOJ, the SEC, the US Commodity Futures Trading Commis-sion (CFTC), the Board of Governors of the Federal Reserve Sys-tem (Federal Reserve Board), the UK Financial Conduct Authority (FCA) (to which certain responsibilities of the UK Financial Services Authority (FSA) have passed), the UK Serious Fraud Office (SFO), the Australian Securities and Investments Commission (ASIC), the Hong Kong Monetary Authority (HKMA), the Korea Fair Trade Commission (KFTC) and the Brazil Competition Authority (CADE). In addition, WEKO is, and a number of other authorities report-edly are, investigating potential manipulation of precious metals prices. UBS has taken and will take appropriate action with respect to certain personnel as a result of its ongoing review.
In 2014, UBS reached settlements with the FCA and the CFTC in connection with their foreign exchange investigations, and FINMA issued an order concluding its formal proceedings with
respect to UBS relating to its foreign exchange and precious met-als businesses. UBS has paid a total of approximately CHF 774 million to these authorities, including GBP 234 million in fines to the FCA, USD 290 million in fines to the CFTC, and CHF 134 million to FINMA representing confiscation of costs avoided and profits. In 2015, the Federal Reserve Board and the Connecticut Department of Banking issued an Order to Cease and Desist and Order of Assessment of a Civil Monetary Penalty Issued upon Consent (Federal Reserve Order) to UBS AG. As part of the Fed-eral Reserve Order, UBS AG paid a USD 342 million civil mone-tary penalty.
In 2015, the DOJ’s Criminal Division (Criminal Division) termi-nated the December 2012 Non-Prosecution Agreement (NPA) with UBS AG related to UBS’s submissions of benchmark interest rates. As a result, UBS AG entered into a plea agreement with the Criminal Division pursuant to which UBS AG agreed to and did plead guilty to a one-count criminal information filed in the US District Court for the District of Connecticut charging UBS AG with one count of wire fraud in violation of 18 USC Sections 1343 and 2. Under the plea agreement, UBS AG agreed to a sentence that includes a USD 203 million fine and a three-year term of probation. The criminal information charges that between approximately 2001 and 2010, UBS AG engaged in a scheme to defraud counterparties to interest rate derivatives transactions by manipulating benchmark interest rates, including Yen LIBOR. Sen-tencing is currently scheduled for 29 November 2016. The Crimi-nal Division terminated the NPA based on its determination, in its sole discretion, that certain UBS AG employees committed crimi-nal conduct that violated the NPA, including fraudulent and deceptive currency trading and sales practices in conducting cer-tain foreign exchange market transactions with clients and collu-sion with other participants in certain foreign exchange markets.
We have ongoing obligations to cooperate with these authori-ties and to undertake certain remediation, including actions to improve UBS’s processes and controls.

Notes to the UBS Group AG interim consolidated financial statements (unaudited)
144
Note 16 Provisions and contingent liabilities (continued)
UBS has been granted conditional immunity by the Antitrust Division of the DOJ (Antitrust Division) from prosecution for EUR / USD collusion and entered into a non-prosecution agree-ment covering other currency pairs. As a result, UBS AG will not be subject to prosecutions, fines or other sanctions for antitrust law violations by the Antitrust Division, subject to UBS AG’s con-tinuing cooperation. However, the conditional immunity grant does not bar government agencies from asserting other claims and imposing sanctions against UBS AG, as evidenced by the set-tlements and ongoing investigations referred to above. UBS has also been granted conditional leniency by authorities in certain jurisdictions, including WEKO, in connection with potential com-petition law violations relating to precious metals, and as a result, will not be subject to prosecutions, fines or other sanctions for antitrust or competition law violations in those jurisdictions, sub-ject to UBS AG’s continuing cooperation.
In 2015, UBS AG settled charges with the SEC relating to struc-tured notes issued by UBS AG that were linked to the UBS V10 Currency Index with Volatility Cap.
Investigations relating to foreign exchange and precious metals matters by numerous authorities, including the CFTC, remain ongoing notwithstanding these resolutions.
Foreign exchange-related civil litigation: Putative class actions have been filed since November 2013 in US federal courts and in other jurisdictions against UBS and other banks on behalf of putative classes of persons who engaged in foreign currency transactions with any of the defendant banks. They allege collu-sion by the defendants and assert claims under the antitrust laws and for unjust enrichment. In 2015, additional putative class actions were filed in federal court in New York against UBS and other banks on behalf of a putative class of persons who entered into or held any foreign exchange futures contracts and options on foreign exchange futures contracts since 1 January 2003. The complaints assert claims under the Commodity Exchange Act (CEA) and the US antitrust laws. In 2015, a consolidated com-plaint was filed on behalf of both putative classes of persons covered by the US federal court class actions described above. UBS has entered into a settlement agreement that would resolve
all of these US federal court class actions. The agreement, which has been preliminarily approved by the court and is subject to final court approval, requires, among other things, that UBS pay an aggregate of USD 141 million and provide cooperation to the settlement classes.
A putative class action has been filed in federal court in New York against UBS and other banks on behalf of participants, ben-eficiaries, and named fiduciaries of plans qualified under the Employee Retirement Income Security Act of 1974 (ERISA) for whom a defendant bank provided foreign currency exchange transactional services, exercised discretionary authority or discre-tionary control over management of such ERISA plan, or autho-rized or permitted the execution of any foreign currency exchange transactional services involving such plan’s assets. The complaint asserts claims under ERISA.
In 2015, a putative class action was filed in federal court against UBS and numerous other banks on behalf of a putative class of persons and businesses in the US who directly purchased foreign currency from the defendants and their co-conspirators for their own end use. That action has been transferred to federal court in New York.
In 2015, UBS was added to putative class actions pending against other banks in federal court in New York and other juris-dictions on behalf of putative classes of persons who bought or sold physical precious metals and various precious metal products and derivatives. The complaints in these lawsuits assert claims under the antitrust laws and the CEA, and other claims.
LIBOR and other benchmark-related regulatory matters: Numerous government agencies, including the SEC, the CFTC, the DOJ, the FCA, the SFO, the Monetary Authority of Singapore (MAS), the HKMA, FINMA, the various state attorneys general in the US, and competition authorities in various jurisdictions have conducted or are continuing to conduct investigations regarding submissions with respect to LIBOR and other benchmark rates. These investigations focus on whether there were improper attempts by UBS, among others, either acting on our own or together with others, to manipulate LIBOR and other benchmark rates at certain times.

Con
solid
ated
fina
ncia
l sta
tem
ents
145
Note 16 Provisions and contingent liabilities (continued)
In 2012, UBS reached settlements with the FSA, the CFTC and the Criminal Division of the DOJ in connection with their investi-gations of benchmark interest rates. At the same time, FINMA issued an order concluding its formal proceedings with respect to UBS relating to benchmark interest rates. UBS has paid a total of approximately CHF 1.4 billion in fines and disgorgement – includ-ing GBP 160 million in fines to the FSA, USD 700 million in fines to the CFTC, USD 500 million in fines to the DOJ, and CHF 59 million in disgorgement to FINMA. UBS Securities Japan Co. Ltd. (UBSSJ) entered into a plea agreement with the DOJ under which it entered a plea to one count of wire fraud relating to the manip-ulation of certain benchmark interest rates, including Yen LIBOR. UBS entered into an NPA with the DOJ, which (along with the plea agreement) covered conduct beyond the scope of the conditional leniency / immunity grants described below, required UBS to pay the USD 500 million fine to the DOJ after the sentencing of UBSSJ, and provided that any criminal penalties imposed on UBSSJ at sentencing be deducted from the USD 500 million fine. Under the NPA, we agreed, among other things, that for two years from 18 December 2012 UBS would not commit any US crime, and we would advise DOJ of any potentially criminal conduct by UBS or any of its employees relating to violations of US laws concerning fraud or securities and commodities markets. The term of the NPA was extended by one year to 18 December 2015. In 2015, the Criminal Division terminated the NPA based on its determination, in its sole discretion, that certain UBS AG employees committed criminal conduct that violated the NPA. As a result, UBS entered into a plea agreement with the DOJ under which it entered a guilty plea to one count of wire fraud relating to the manipulation of certain benchmark interest rates, including Yen LIBOR, and agreed to pay a fine of USD 203 million and accept a three-year term of probation. Sentencing is currently scheduled for 29 November 2016.
In 2014, UBS reached a settlement with the European Com-mission (EC) regarding its investigation of bid-ask spreads in con-nection with Swiss franc interest rate derivatives and paid a EUR
12.7 million fine, which was reduced to this level based in part on UBS’s cooperation with the EC. The MAS, HKMA and the Japan Financial Services Agency have also resolved investigations of UBS (and in some cases, other banks). We have ongoing obligations to cooperate with the authorities with whom we have reached reso-lutions and to undertake certain remediation with respect to benchmark interest rate submissions.
Investigations by the CFTC, ASIC and other governmental authorities remain ongoing notwithstanding these resolutions.
UBS has been granted conditional leniency or conditional immunity from authorities in certain jurisdictions, including the Antitrust Division of the DOJ, WEKO and the EC, in connection with potential antitrust or competition law violations related to submissions for Yen LIBOR and Euroyen TIBOR. WEKO has also granted UBS conditional immunity in connection with potential competition law violations related to submissions for CHF LIBOR and certain transactions related to CHF LIBOR. As a result of these conditional grants, we will not be subject to prosecutions, fines or other sanctions for antitrust or competition law violations in the jurisdictions where we have conditional immunity or leniency in connection with the matters covered by the conditional grants, subject to our continuing cooperation. However, the conditional leniency and conditional immunity grants we have received do not bar government agencies from asserting other claims and imposing sanctions against us, as evidenced by the settlements and ongoing investigations referred to above. In addition, as a result of the conditional leniency agreement with the DOJ, we are eligible for a limit on liability to actual rather than treble damages were damages to be awarded in any civil antitrust action under US law based on conduct covered by the agreement and for relief from potential joint and several liability in connection with such civil antitrust action, subject to our satisfying the DOJ and the court presiding over the civil litigation of our cooperation. The conditional leniency and conditional immunity grants do not oth-erwise affect the ability of private parties to assert civil claims against us.

Notes to the UBS Group AG interim consolidated financial statements (unaudited)
146
Note 16 Provisions and contingent liabilities (continued)
LIBOR and other benchmark-related civil litigation: A number of putative class actions and other actions are pending in, or expected to be transferred to, the federal courts in New York against UBS and numerous other banks on behalf of parties who transacted in certain interest rate benchmark-based derivatives. Also pending are actions asserting losses related to various prod-ucts whose interest rate was linked to USD LIBOR, including adjustable rate mortgages, preferred and debt securities, bonds pledged as collateral, loans, depository accounts, investments and other interest-bearing instruments. All of the complaints allege manipulation, through various means, of various benchmark interest rates, including USD LIBOR, Euroyen TIBOR, Yen LIBOR, EURIBOR, CHF LIBOR, GBP LIBOR or USD ISDAFIX rates, and seek unspecified compensatory and other damages under varying legal theories. In 2013, the court in the USD action dismissed the fed-eral antitrust and racketeering claims of certain USD LIBOR plain-tiffs and a portion of their claims brought under the CEA and state common law. Plaintiffs have appealed the dismissal, and the appeal remains pending. In 2014, the court in one of the Euroyen TIBOR lawsuits dismissed certain of the plaintiff’s claims, including federal antitrust claims. In 2015, the same court dismissed plain-tiff’s federal racketeering claims and affirmed its previous dis-missal of plaintiff’s antitrust claims. UBS and other defendants in other lawsuits including those related to EURIBOR, CHF LIBOR and GBP LIBOR have filed motions to dismiss.
Since September 2014, putative class actions have been filed in federal court in New York and New Jersey against UBS and other financial institutions, among others, on behalf of parties who entered into interest rate derivative transactions linked to ISDAFIX. The complaints, which have since been consolidated into an amended complaint, allege that the defendants conspired to manipulate ISDAFIX rates from 1 January 2006 through January 2014, in violation of US antitrust laws and certain state laws, and seek unspecified compensatory damages, including treble dam-ages. In March 2016, the court in the ISDAFIX action denied in substantial part defendants’ motion to dismiss, holding that plain-tiffs have stated Sherman Act, breach-of-contract, and unjust-enrichment claims against defendants, including UBS AG.
Government bonds: Putative class actions have been filed in US federal courts against UBS and other banks on behalf of persons who participated in markets for US Treasury securities since 2007. The complaints generally allege that the banks colluded with respect to, and manipulated prices of, US Treasury securities sold at auction. They assert claims under the antitrust laws and the CEA and for unjust enrichment. The cases have been consolidated in the SDNY. Following filing of these complaints, UBS and report-
edly other banks have received requests for information from various authorities regarding US Treasury securities and other gov-ernment bond trading practices.
With respect to additional matters and jurisdictions not encom-passed by the settlements and order referred to above, our bal-ance sheet at 31 March 2016 reflected a provision in an amount that UBS believes to be appropriate under the applicable account-ing standard. As in the case of other matters for which we have established provisions, the future outflow of resources in respect of such matters cannot be determined with certainty based on currently available information, and accordingly may ultimately prove to be substantially greater (or may be less) than the provi-sion that we have recognized.
6. Swiss retrocessionsThe Federal Supreme Court of Switzerland ruled in 2012, in a test case against UBS, that distribution fees paid to a firm for distribut-ing third-party and intra-group investment funds and structured products must be disclosed and surrendered to clients who have entered into a discretionary mandate agreement with the firm, absent a valid waiver.
FINMA has issued a supervisory note to all Swiss banks in response to the Supreme Court decision. The note sets forth the measures Swiss banks are to adopt, which include informing all affected clients about the Supreme Court decision and directing them to an internal bank contact for further details. UBS has met the FINMA requirements and has notified all potentially affected clients.
The Supreme Court decision has resulted, and may continue to result, in a number of client requests for UBS to disclose and potentially surrender retrocessions. Client requests are assessed on a case-by-case basis. Considerations taken into account when assessing these cases include, among others, the existence of a discretionary mandate and whether or not the client documenta-tion contained a valid waiver with respect to distribution fees.
Our balance sheet at 31 March 2016 reflected a provision with respect to matters described in this item 6 in an amount that UBS believes to be appropriate under the applicable accounting stan-dard. The ultimate exposure will depend on client requests and the resolution thereof, factors that are difficult to predict and assess. Hence, as in the case of other matters for which we have established provisions, the future outflow of resources in respect of such matters cannot be determined with certainty based on currently available information, and accordingly may ultimately prove to be substantially greater (or may be less) than the provi-sion that we have recognized.

Con
solid
ated
fina
ncia
l sta
tem
ents
147
Note 16 Provisions and contingent liabilities (continued)
7. Banco UBS Pactual tax indemnityPursuant to the 2009 sale of Banco UBS Pactual S.A. (Pactual) by UBS to BTG Investments, LP (BTG), BTG has submitted contractual indemnification claims that UBS estimates amount to approxi-mately BRL 2.5 billion, including interest and penalties, which is net of liabilities retained by BTG. The claims pertain principally to several tax assessments issued by the Brazilian tax authorities against Pactual relating to the period from December 2006 through March 2009, when UBS owned Pactual. The majority of these assessments relate to the deductibility of goodwill amortiza-tion in connection with UBS’s 2006 acquisition of Pactual and payments made to Pactual employees through various profit-shar-ing plans. These assessments are being challenged in administra-tive and judicial proceedings. In 2015, the administrative court issued a decision that was largely in favor of the tax authority with respect to the goodwill amortization assessment. This decision has been appealed.
8. Matters relating to the CDS marketIn 2013, the EC issued a Statement of Objections against 13 credit default swap (CDS) dealers including UBS, as well as data service provider Markit and the International Swaps and Derivatives Asso-
ciation (ISDA). The Statement of Objections broadly alleges that the dealers infringed European Union antitrust rules by colluding to prevent exchanges from entering the credit derivatives market between 2006 and 2009. In 2015, the EC issued a statement that it had decided to close its investigation against all 13 dealers, including UBS. The EC’s investigation regarding Markit and ISDA is ongoing. Since mid-2009, the Antitrust Division of the DOJ has also been investigating whether multiple dealers, including UBS, conspired with each other and with Markit to restrain competition in the markets for CDS trading, clearing and other services. In 2014, putative class action plaintiffs filed consolidated amended complaints in the SDNY against 12 dealers, including UBS, as well as Markit and ISDA, alleging violations of the US Sherman Anti-trust Act and common law. Plaintiffs allege that the defendants unlawfully conspired to restrain competition in and / or monopo-lize the market for CDS trading in the US in order to protect the dealers’ profits from trading CDS in the over-the-counter market. In 2015, UBS and the other defendants entered into settlement agreements to resolve the litigation, pursuant to which UBS has paid USD 75 million out of a total settlement amount paid by all defendants of approximately USD 1.865 billion. The agreements have received final court approval.
Note 17 Guarantees, commitments and forward starting transactions
The table below shows the maximum irrevocable amount of guarantees, commitments and forward starting transactions.
31.3.16 31.12.15
CHF million Gross Sub-participations Net Gross Sub-participations Net
Guarantees
Credit guarantees and similar instruments 6,525 (439) 6,086 6,708 (315) 6,393
Performance guarantees and similar instruments 3,029 (643) 2,386 3,035 (699) 2,336
Documentary credits 6,073 (1,602) 4,471 6,276 (1,707) 4,569
Total guarantees 15,627 (2,684) 12,942 16,019 (2,721) 13,298
Loan commitments 51,913 (1,480) 50,433 56,067 (1,559) 54,508
Forward starting transactions1
Reverse repurchase agreements 18,695 6,577
Securities borrowing agreements 43 6
Repurchase agreements 13,098 6,323
1 Cash to be paid in the future by either UBS or the counterparty.

Notes to the UBS Group AG interim consolidated financial statements (unaudited)
148
Note 18 Changes in organization and disposals
Restructuring expenses
Restructuring expenses arise from programs that materially change either the scope of business undertaken by the Group or the manner in which such business is conducted. Restructuring expenses are temporary costs that are necessary to effect such programs and include items such as severance and other person-nel-related expenses, duplicate headcount costs, impairment and
accelerated depreciation of assets, contract termination costs, consulting fees, and related infrastructure and system costs. These costs are presented in the income statement according to the underlying nature of the expense. As the costs associated with restructuring programs are temporary in nature, and in order to provide a more thorough understanding of business performance, such costs are separately presented below.
Net restructuring expenses by business division and Corporate Center unit
For the quarter ended % change from
CHF million 31.3.16 31.12.15 31.3.15 4Q15 1Q15
Wealth Management 79 133 46 (41) 72
Wealth Management Americas 33 50 24 (34) 38
Personal & Corporate Banking 23 41 16 (44) 44
Asset Management 20 38 18 (47) 11
Investment Bank 117 143 70 (18) 67
Corporate Center (6) 36 130
of which: Services (8) 19 119
of which: Non-core and Legacy Portfolio 2 17 11 (88) (82)
Total net restructuring expenses 265 441 305 (40) (13)
of which: personnel expenses 128 164 68 (22) 88
of which: general and administrative expenses 136 276 226 (51) (40)
of which: depreciation and impairment of property, equipment and software 1 0 11 (91)
of which: amortization and impairment of intangible assets 0 0 0
Net restructuring expenses by personnel expense category
For the quarter ended % change from
CHF million 31.3.16 31.12.15 31.3.15 4Q15 1Q15
Salaries and variable compensation 115 146 68 (21) 69
Contractors 11 16 5 (31) 120
Social security 2 1 1 100 100
Pension and other post-employment benefit plans (4) (6) (8) (33) (50)
Other personnel expenses 4 6 2 (33) 100
Total net restructuring expenses: personnel expenses 128 164 68 (22) 88
Net restructuring expenses by general and administrative expense category
For the quarter ended % change from
CHF million 31.3.16 31.12.15 31.3.15 4Q15 1Q15
Occupancy 29 34 10 (15) 190
Rent and maintenance of IT and other equipment 10 7 31 43 (68)
Administration 3 1 2 200 50
Travel and entertainment 3 6 2 (50) 50
Professional fees 34 68 31 (50) 10
Outsourcing of IT and other services 74 175 22 (58) 236
Other1 (17) (14) 127 21
Total net restructuring expenses: general and administrative expenses 136 276 226 (51) (40)
1 Mainly comprised of onerous real estate lease contracts.

Con
solid
ated
fina
ncia
l sta
tem
ents
149
Note 18 Changes in organization and disposals (continued)
Disposal group held for sale
In 2015, UBS agreed to sell certain businesses within Wealth Man-agement. These sales are expected to close in 2016 subject to customary closing conditions. As of 31 March 2016, the assets
and liabilities of these subsidiaries and businesses are presented as a disposal group held for sale within Other assets and Other liabil-ities and amounted to CHF 264 million and CHF 217 million, respectively (31 December 2015: CHF 279 million and CHF 235 million, respectively).
Note 19 Currency translation rates
The following table shows the rates of the main currencies used to translate the financial information of UBS’s foreign operations into Swiss francs.
Spot rate Average rate1
As of For the quarter ended
31.3.16 31.12.15 31.3.15 31.3.16 31.12.15 31.3.15
1 USD 0.96 1.00 0.97 0.99 1.01 0.95
1 EUR 1.09 1.09 1.04 1.10 1.09 1.05
1 GBP 1.38 1.48 1.44 1.42 1.52 1.43
100 JPY 0.85 0.83 0.81 0.86 0.83 0.80
1 Monthly income statement items of foreign operations with a functional currency other than Swiss franc are translated with month-end rates into Swiss francs. Disclosed average rates for a quarter represent an aver-age of three month-end rates, weighted according to the income and expense volumes of all foreign operations of the Group with the same functional currency for each month. Weighted average rates for individual business divisions may deviate from the weighted average rates for the Group.

UBS AG interim consolidated financial information (unaudited)
150
UBS AG interim consolidated financial information (unaudited)
This section contains a comparison of selected financial and capi-tal information between UBS Group AG (consolidated) and UBS AG (consolidated), as well as key figures for UBS AG (consoli-dated). Refer to www.ubs.com/investors for the interim consoli-dated financial statements of UBS AG, which will be published on 6 May 2016.
Comparison UBS Group AG (consolidated) vs UBS AG (consolidated)
The accounting policies applied under International Financial Reporting Standards (IFRS) to both UBS Group AG and UBS AG consolidated financial statements are identical. However, there are certain scope and presentation differences which relate to:
– Assets, liabilities, operating income, operating expenses and operating profit before tax relating to UBS Group AG and its directly held subsidiaries, including UBS Business Solutions AG, are reflected in the consolidated financial statements of UBS Group AG but not of UBS AG. UBS AG’s assets, liabilities, oper-ating income, and operating expenses related to transactions with UBS Group AG and its directly held subsidiaries are not subject to elimination in the UBS AG consolidated financial statements, but are eliminated in the UBS Group AG consoli-dated financial statements.
– Total equity of UBS Group AG (consolidated) was lower than total equity of UBS AG (consolidated) as of 31 March 2016, primarily related to employee share-based compensation awards.
– Preferred notes issued by UBS AG are presented in the consoli-dated UBS Group AG balance sheet as equity attributable to NCI, while in the consolidated UBS AG balance sheet, these preferred notes are required to be presented as equity attribut-able to preferred noteholders.
– Fully applied total capital of UBS AG (consolidated) was lower than fully applied total capital of UBS Group AG (consolidated) as of 31 March 2016, reflecting lower AT1 capital and lower tier 2 capital, partly offset by higher CET1 capital. The differ-ence in CET1 capital was primarily due to compensation-related regulatory capital accruals, liabilities and capital instru-ments which are reflected on the level of UBS Group AG. The difference in AT1 capital relates to the issuances of AT1 capital notes by UBS Group AG, as well as deferred contingent capital plan (DCCP) awards granted for the performance years 2014 and 2015. The difference in tier 2 capital relates to high-trigger loss-absorbing capital, in the form of 2012 and 2013 DCCP awards, held at the UBS Group AG level.

Con
solid
ated
fina
ncia
l sta
tem
ents
151
Comparison UBS Group AG (consolidated) versus UBS AG (consolidated)
As of or for the quarter ended 31.3.16 As of or for the quarter ended 31.12.15
CHF million, except where indicatedUBS Group AG (consolidated)
UBS AG(consolidated)
Difference (absolute)
Difference(%)
UBS Group AG (consolidated)
UBS AG(consolidated)
Difference (absolute)
Difference(%)
Income statement
Operating income 6,833 6,855 (22) 0 6,775 6,771 4 0
Operating expenses 5,855 5,876 (21) 0 6,541 6,543 (2) 0
Operating profit / (loss) before tax 978 979 (1) 0 234 228 6 3
of which: Wealth Management 557 552 5 1 344 342 2 1
of which: Wealth Management Americas 211 204 7 3 14 8 6 75
of which: Personal & Corporate Banking 399 399 0 0 355 356 (1) 0
of which: Asset Management 90 90 0 0 171 171 0 0
of which: Investment Bank 253 236 17 7 80 83 (3) (4)
of which: Corporate Center (534) (502) (32) 6 (729) (732) 3 0
of which: Services (203) (193) (10) 5 (345) (349) 4 (1)
of which: Group ALM (148) (127) (21) 17 (56) (54) (2) 4
of which: Non-core and Legacy Portfolio (183) (182) (1) 1 (329) (329) 0 0
Net profit / (loss) 708 713 (5) (1) 950 951 (1) 0
of which: net profit / (loss) attributable to shareholders 707 713 (6) (1) 949 950 (1) 0
of which: net profit / (loss) attributable to preferred noteholders 0 0 0 0
of which: net profit / (loss) attributable to non-controlling interests 0 0 0 1 1 0 0
Statement of comprehensive income
Other comprehensive income (358) (358) 0 0 214 214 0 0
of which: attributable to shareholders (308) (308) 0 0 177 177 0 0
of which: attributable to preferred noteholders (50) 50 35 (35) (100)
of which: attributable to non-controlling interests (50) (1) (49) 37 2 35
Total comprehensive income 349 355 (6) (2) 1,164 1,165 (1) 0
of which: attributable to shareholders 399 405 (6) (1) 1,126 1,126 0 0
of which: attributable to preferred noteholders (50) 50 35 (35) (100)
of which: attributable to non-controlling interests (50) (1) (49) 38 3 35
Balance sheet
Total assets 966,873 968,158 (1,285) 0 942,819 943,256 (437) 0
Total liabilities 910,088 910,557 (469) 0 885,511 886,013 (502) 0
Total equity 56,786 57,601 (815) (1) 57,308 57,243 65 0
of which: equity attributable to shareholders 54,845 55,660 (815) (1) 55,313 55,248 65 0
of which: equity attributable to preferred noteholders 1,905 (1,905) 1,954 (1,954) (100)
of which: equity attributable to non-controlling interests 1,941 36 1,905 1,995 41 1,954
Capital information
Common equity tier 1 capital (fully applied) 29,853 32,118 (2,265) (7) 30,044 32,042 (1,998) (6)
Common equity tier 1 capital (phase-in) 36,580 38,762 (2,182) (6) 40,378 41,516 (1,138) (3)
Additional tier 1 capital (fully applied) 7,585 2,643 4,942 6,154 1,252 4,902
Tier 2 capital (fully applied) 11,112 10,217 895 9 11,237 10,325 912 9
Total capital (fully applied) 48,551 44,978 3,573 8 47,435 43,619 3,816 9
Risk-weighted assets (fully applied) 213,558 214,973 (1,415) (1) 207,530 208,186 (656) 0
Common equity tier 1 capital ratio (fully applied, %) 14.0 14.9 (0.9) 14.5 15.4 (0.9)
Common equity tier 1 capital ratio (phase-in, %) 16.9 17.8 (0.9) 19.0 19.5 (0.5)
Total capital ratio (fully applied, %) 22.7 20.9 1.8 22.9 21.0 1.9
Leverage ratio denominator (fully applied) 905,801 907,277 (1,476) 0 897,607 898,251 (644) 0
Leverage ratio (fully applied, %) 5.4 5.0 0.4 5.3 4.9 0.4

UBS AG interim consolidated financial information (unaudited)
152
UBS AG (consolidated) key figures
As of or for the quarter ended
CHF million, except where indicated 31.3.16 31.12.15 31.3.15
Results
Operating income 6,855 6,771 8,860
Operating expenses 5,876 6,543 6,167
Operating profit / (loss) before tax 979 228 2,693
Net profit / (loss) attributable to UBS AG shareholders 713 950 2,023
Key performance indicators1
Profitability
Return on tangible equity (%) 6.0 8.1 17.7
Return on assets, gross (%) 2.9 2.8 3.4
Cost / income ratio (%) 85.7 95.8 69.5
Growth
Net profit growth (%) (24.9) (54.4) 126.5
Net new money growth for combined wealth management businesses (%) 5.9 2.9 3.8
Resources
Common equity tier 1 capital ratio (fully applied, %)2 14.9 15.4 14.6
Leverage ratio (phase-in, %)3 5.6 5.7 5.3
Additional information
Profitability
Return on equity (RoE) (%) 5.1 6.9 15.3
Return on risk-weighted assets, gross (%)4 13.0 12.8 16.4
Resources
Total assets 968,158 943,256 1,050,122
Equity attributable to UBS AG shareholders 55,660 55,248 53,815
Common equity tier 1 capital (fully applied)2 32,118 32,042 31,725
Common equity tier 1 capital (phase-in)2 38,762 41,516 41,808
Risk-weighted assets (fully applied)2 214,973 208,186 216,893
Common equity tier 1 capital ratio (phase-in, %)2 17.8 19.5 19.1
Total capital ratio (fully applied, %)2 20.9 21.0 19.3
Total capital ratio (phase-in, %)2 23.9 24.9 24.5
Leverage ratio (fully applied, %)3 5.0 4.9 4.3
Leverage ratio denominator (fully applied)3 907,277 898,251 978,709
Other
Invested assets (CHF billion)5 2,618 2,689 2,708
Personnel (full-time equivalents) 58,053 58,131 60,113
1 Refer to the “Measurement of performance” section of our Annual Report 2015 for the definitions of our key performance indicators. 2 Based on the Basel III framework as applicable for systemically relevant banks (SRBs). Refer to the “Capital management” section of this report for more information. 3 Calculated in accordance with Swiss SRB rules. Refer to the “Capital management” section of this report for more information. From 31 December 2015 onward, the leverage ratio denominator calculation is fully aligned with the Basel III rules. Figures for periods prior to 31 December 2015 are calculated in accordance with former Swiss SRB rules and are therefore not fully comparable. 4 Based on fully applied risk-weighted assets. 5 Includes invested assets for Personal & Corporate Banking.

Legal entity financial and regulatory informationUnaudited

Table of contents
UBS Group AG (standalone) 155 Income statement155 Balance sheet156 Basis of accounting
UBS AG (standalone) 157 Income statement158 Balance sheet159 Basis of accounting159 Joint and several liability160 Reconciliation of Swiss federal banking law equity to
Swiss SRB capital160 Regulatory key figures
UBS Switzerland AG (standalone)161 Income statement162 Balance sheet163 Basis of accounting163 Joint and several liability164 Reconciliation of Swiss federal banking law equity to
Swiss SRB capital164 Regulatory key figures
UBS Limited (standalone) 165 Income statement165 Statement of comprehensive income166 Balance sheet167 Basis of accounting167 Capital information

Lega
l ent
ity fi
nanc
ial a
nd
regu
lato
ry in
form
atio
n
155
UBS Group AG (standalone)
Income statement
For the quarter ended % change from
CHF million 31.3.16 31.12.15 31.3.15 4Q15 1Q15
Operating income 128 121 48 6 170
Operating expenses 148 118 144 26 2
Operating profit / (loss) before tax (19) 3 (97) (80)
Tax expense / (benefit) 5 7 0 (30)
Net profit / (loss) for the period (24) (3) (97) 630 (75)
Balance sheet
% change from
CHF million 31.3.16 31.12.15 31.12.15
Current assets 2,448 2,422 1
Non-current assets 47,188 45,959 3
of which: investment in UBS AG 40,376 40,376 0
Total assets 49,636 48,381 3
Short-term liabilities 2,592 1,741 49
Long-term liabilities 9,083 8,225 10
of which: additional tier 1 capital 6,453 5,106 26
Total liabilities 11,675 9,966 17
of which: deferred contingent capital plan 1,198 1,173 2
of which: other deferred compensation plans 2,174 2,654 (18)
Share capital1 385 385 0
General reserves 37,011 37,006 0
Voluntary earnings reserve (10) (10) 0
Treasury shares (2,158) (1,724) 25
Reserve for own shares held by subsidiaries 0 1 (97)
Retained earnings 2,756 0
Net profit / (loss) for the period (24) 2,756
Equity attributable to shareholders 37,961 38,415 (1)
Total liabilities and equity 49,636 48,381 3
1 Refer to the “UBS shares” section of this report for information on UBS Group AG shares.

Legal entity financial and regulatory information
156
Basis of accounting
In preparing the interim financial information for UBS Group AG, the same accounting policies and methods of computation have been applied as in the annual financial statements as of 31 December 2015. This interim financial information is unau-dited and should be read in conjunction with the audited financial statements of UBS Group AG included in the Annual Report 2015.
The UBS Group AG standalone financial statements are prepared in accordance with the principles of the Swiss Law on Accounting and Financial Reporting (32nd title of the Swiss Code of Obliga-tions). More information on the accounting policies applied for the standalone financial statements of UBS Group AG is provided in Note 2 to the UBS Group AG standalone financial statements in the Annual Report 2015.

Lega
l ent
ity fi
nanc
ial a
nd
regu
lato
ry in
form
atio
n
157
UBS AG (standalone)
Income statement
For the quarter ended % change from
CHF million 31.3.16 31.12.15 31.3.151 4Q15 1Q15
Interest and discount income 1,405 1,258 2,109 12 (33)
Interest and dividend income from trading portfolio 574 529 649 9 (12)
Interest and dividend income from financial investments 38 47 53 (19) (28)
Interest expense (1,485) (1,238) (1,463) 20 2
Gross interest income 532 597 1,348 (11) (61)
Credit loss (expense) / recovery (23) (68) (30) (66) (23)
Net interest income 509 529 1,318 (4) (61)
Fee and commission income from securities and investment business 546 546 1,619 0 (66)
Credit-related fees and commissions 50 57 105 (12) (52)
Other fee and commission income (5) (26) 127 (81)
Fee and commission expense (198) (200) (289) (1) (31)
Net fee and commission income 393 377 1,563 4 (75)
Net trading income 999 (42) 2,197 (55)
Net income from disposal of financial investments 52 2 94 (45)
Dividend income from investments in subsidiaries and other participations 36 563 278 (94) (87)
Income from real estate holdings 119 143 172 (17) (31)
Sundry ordinary income 1,353 1,387 724 (2) 87
Sundry ordinary expenses (94) (451) (139) (79) (32)
Other income from ordinary activities 1,466 1,645 1,129 (11) 30
Total operating income 3,368 2,509 6,207 34 (46)
Personnel expenses 1,553 1,275 2,349 22 (34)
General and administrative expenses 1,294 1,664 1,369 (22) (5)
Subtotal operating expenses 2,847 2,940 3,718 (3) (23)
Impairment of investments in subsidiaries and other participations 373 (58) 986 (62)
Depreciation and impairment of property, equipment and software 178 193 165 (8) 8
Amortization and impairment of goodwill and other intangible assets 6 6 6 0 0
Changes in provisions and other allowances and losses (3) (44) 50 (93)
Total operating expenses 3,401 3,036 4,924 12 (31)
Operating profit (33) (527) 1,282 (94)
Extraordinary income 65 219 537 (70) (88)
of which: reversal of impairments of investments in subsidiaries and other participations 65 67 17 (3) 282
Extraordinary expenses 0 129 0 (100)
Tax expense / (benefit) 49 (5) 122 (60)
Net profit / (loss) for the period (18) (432) 1,696 (96)
1 Comparative amounts presented for 31 March 2015 include the results of the Personal & Corporate Banking and Wealth Management businesses booked in Switzerland, which were transferred from UBS AG to UBS Switzerland AG in the second quarter of 2015. Refer to “Establishment of UBS Switzerland AG” in the “Legal entity financial and regulatory information” section of our Annual Report 2015 for more information.

Legal entity financial and regulatory information
158
Balance sheet
% change from
CHF million 31.3.16 31.12.15 31.12.15
Assets
Cash and balances with central banks 48,770 45,125 8
Due from banks 49,059 40,611 21
Receivables from securities financing transactions 101,796 90,479 13
of which: cash collateral on securities borrowed 33,363 27,925 19
of which: reverse repurchase agreements 68,433 62,553 9
Due from customers 93,749 97,401 (4)
Mortgage loans 4,563 4,679 (2)
Trading portfolio assets 76,436 94,210 (19)
Positive replacement values 20,136 20,987 (4)
Financial investments 34,242 27,528 24
Accrued income and prepaid expenses 1,730 1,708 1
Investments in subsidiaries and other participations 43,399 43,791 (1)
Property, equipment and software 6,579 6,503 1
Goodwill and other intangible assets 30 36 (17)
Other assets 3,808 3,986 (4)
Total assets 484,296 477,045 2
of which: subordinated assets 6,555 5,752 14
of which: subject to mandatory conversion and / or debt waiver 4,500 4,020 12
Liabilities
Due to banks 39,092 36,669 7
Payables from securities financing transactions 59,322 55,457 7
of which: cash collateral on securities lent 28,961 34,094 (15)
of which: repurchase agreements 30,361 21,363 42
Due to customers 145,607 144,842 1
Trading portfolio liabilities 23,405 21,179 11
Negative replacement values 25,463 24,669 3
Financial liabilities designated at fair value 52,754 58,104 (9)
Bonds issued and loans from central mortgage institutions 75,655 72,750 4
Accrued expenses and deferred income 3,414 4,356 (22)
Other liabilities 6,266 5,505 14
Provisions 1,608 1,786 (10)
Total liabilities 432,585 425,316 2
Equity
Share capital 386 386 0
General reserve 33,669 33,669 0
of which: statutory capital reserve 38,149 38,149 0
of which: capital contribution reserve 38,149 38,149 0
of which: statutory earnings reserve (4,480) (4,480) 0
Voluntary earnings reserve 5,689 5,689 0
Retained earnings / (loss) carried forward 11,984 0
Net profit / (loss) for the period (18) 11,984
Total equity 51,711 51,728 0
Total liabilities and equity 484,296 477,045 2
of which: subordinated liabilities 16,840 16,139 4
of which: subject to mandatory conversion and / or debt waiver 12,689 11,858 7

Lega
l ent
ity fi
nanc
ial a
nd
regu
lato
ry in
form
atio
n
159
Basis of accounting
UBS AG standalone financial statements are prepared in accor-dance with Swiss GAAP (FINMA Circular 2015 / 1 and the Banking Ordinance).
The accounting policies are principally the same as the IFRS-based accounting policies for the consolidated financial state-ments outlined in Note 1 to the consolidated financial statements of UBS AG in the Annual Report 2015. Major differences between the Swiss GAAP requirements and IFRS are described in Note 38 to the consolidated financial statements of UBS AG in the Annual Report 2015. Further information on the accounting policies
applied for the standalone financial statements of UBS AG is pro-vided in Note 2 to the UBS AG standalone financial statements in the Annual Report 2015.
In preparing the interim financial information for UBS AG, the same accounting policies and methods of computation have been applied as in the annual financial statements as of 31 December 2015. This interim financial information is unaudited and should be read in conjunction with the audited financial statements of UBS AG included in the Annual Report 2015.
Joint and several liability
In June 2015, the Personal & Corporate Banking and Wealth Management businesses booked in Switzerland were transferred from UBS AG to UBS Switzerland AG through an asset transfer in accordance with the Swiss Merger Act. Under the Swiss Merger Act, UBS AG assumed joint liability for obligations existing on the asset transfer date, 14 June 2015, that were transferred to UBS Switzerland AG.
As of the asset transfer date, UBS AG assumed joint liability for approximately CHF 260 billion of obligations of UBS Switzerland AG, excluding the collateralized portion of secured contractual
obligations. UBS AG has no liability for new obligations incurred by UBS Switzerland AG after the asset transfer date.
➔ Refer to “Establishment of UBS Switzerland AG” in the “Legal
entity financial and regulatory information” section of our
Annual Report 2015 for more information
The joint liability amount declines as obligations mature, termi-nate or are novated following the asset transfer date. As of 31 March 2016, the joint liability amounted to approximately CHF 1 billion.

Legal entity financial and regulatory information
160
Reconciliation of Swiss federal banking law equity to Swiss SRB capital (phase-in)
CHF billion 31.3.16 31.12.15
Equity – Swiss federal banking law1 51.7 51.7
Deferred tax assets 1.5 1.9
Investments in the finance sector (14.5) (16.6)
Goodwill and intangible assets (0.4) (0.4)
Other2 (4.6) (4.0)
Common equity tier 1 capital 33.7 32.7
Additional tier 1 capital 0.0 0.0
Tier 2 capital 0.0 0.0
Total capital 33.7 32.7
1 Equity under Swiss federal banking law is adjusted to derive equity in accordance with IFRS and then further adjusted to derive common equity tier 1 (CET1) capital in accordance with Swiss SRB requirements. 2 Includes accruals for dividends to shareholders and other items.
Regulatory key figures
Requirement Actual
CHF million, except where indicated 31.3.16 31.3.16 31.12.15
Capital ratios – Swiss SRB (phase-in)
Common equity tier 1 capital 23,527 33,678 32,656
Tier 2 capital 0 0
Total capital 32,938 33,678 32,656
Risk-weighted assets 235,271 227,170
Common equity tier 1 capital ratio (%) 10.0 14.3 14.4
Total capital ratio (%) 14.0 14.3 14.4
Leverage ratio – Swiss SRB (phase-in)
Total capital 33,678 32,656
Leverage ratio denominator 636,514 633,985
Leverage ratio (%) 3.4 5.3 5.2
Leverage ratio – BIS (phase-in)
Tier 1 capital 33,678 32,656
Leverage ratio denominator 636,514 633,985
Leverage ratio (%) 5.3 5.2
Liquidity coverage ratio1
High-quality liquid assets (CHF billion) 116 108
Net cash outflows (CHF billion) 88 93
Liquidity coverage ratio (%) 132 116
1 Figures represent a 3-month average.
Information concerning the capital requirements applicable to UBS AG (standalone) under Swiss SRB regulations, as revised by the FINMA decree dated 20 December 2013, is provided in the document “UBS AG First quarter 2016 report,” which will be available from 6 May 2016 in “Quarterly reporting” at www.ubs.com/investors.
The same document contains supplemental Swiss SRB capital information and information on the leverage ratio and the liquid-ity coverage ratio.

Lega
l ent
ity fi
nanc
ial a
nd
regu
lato
ry in
form
atio
n
161
UBS Switzerland AG (standalone)
Income statement
For the quarter ended1 % change from
CHF million 31.3.16 31.12.15 4Q15
Interest and discount income2 962 931 3
Interest and dividend income from trading portfolio 1 0
Interest and dividend income from financial investments 20 20 0
Interest expense (116) (125) (7)
Gross interest income 866 826 5
Credit loss (expense) / recovery 6 (8)
Net interest income 872 819 6
Fee and commission income from securities and investment business 838 845 (1)
Credit-related fees and commissions 35 36 (3)
Other fee and commission income 171 180 (5)
Fee and commission expense (87) (93) (6)
Net fee and commission income 956 968 (1)
Net trading income2 155 264 (41)
Net income from disposal of financial investments 18 6 200
Dividend income from investments in subsidiaries and other participations 0 0
Income from real estate holdings 0 0
Sundry ordinary income 57 42 36
Sundry ordinary expenses (5) (36) (86)
Other income from ordinary activities 69 12 475
Total operating income 2,053 2,063 0
Personnel expenses 539 525 3
General and administrative expenses 861 925 (7)
Subtotal operating expenses 1,401 1,450 (3)
Depreciation and impairment of property, equipment and software 3 3 0
Amortization and impairment of goodwill and other intangible assets 263 263 0
Changes in provisions and other allowances and losses 2 3 (33)
Total operating expenses 1,668 1,719 (3)
Operating profit 385 344 12
Extraordinary income 0 0
Extraordinary expenses 0 0
Tax expense / (benefit) 90 81 11
Net profit / (loss) for the period 295 263 12
1 Comparative results are not presented for the first quarter of 2015, as UBS Switzerland AG had no operations and recorded therefore virtually no profit or loss during that period. 2 From the first quarter of 2016, the difference between forward rates and spot rates on certain short duration foreign exchange derivative contracts which are part of economic hedge relationships (CHF 68 million) is presented in Interest and discount income. For the fourth quarter of 2015, the comparative amount of CHF 66 million is presented in Net trading income.

Legal entity financial and regulatory information
162
Balance sheet
% change from
CHF million 31.3.16 31.12.15 31.12.15
Assets
Cash and balances with central banks 47,385 38,701 22
Due from banks 4,976 3,477 43
Receivables from securities financing transactions 25,396 23,672 7
of which: cash collateral on securities borrowed 4,645 7,414 (37)
of which: reverse repurchase agreements 20,752 16,258 28
Due from customers 38,779 38,373 1
Mortgage loans 147,621 148,492 (1)
Trading portfolio assets 1,719 1,736 (1)
Positive replacement values 2,632 2,274 16
Financial investments 22,957 22,878 0
Accrued income and prepaid expenses 225 237 (5)
Investments in subsidiaries and other participations 42 42 0
Property, equipment and software 18 15 20
Goodwill and other intangible assets 4,200 4,463 (6)
Other assets 812 817 (1)
Total assets 296,764 285,176 4
of which: subordinated assets 0 0
of which: subject to mandatory conversion and / or debt waiver 0 0
Liabilities
Due to banks 19,178 19,280 (1)
Payables from securities financing transactions 11,664 8,997 30
of which: cash collateral on securities lent 2,485 2,493 0
of which: repurchase agreements 9,179 6,505 41
Due to customers 238,974 231,294 3
Trading portfolio liabilities 255 128 99
Negative replacement values 1,532 1,092 40
Medium-term notes 0 0
Bonds issued and loans from central mortgage institutions 8,229 8,274 (1)
Accrued expenses and deferred income 662 822 (19)
Other liabilities 1,654 963 72
Provisions 171 179 (4)
Total liabilities 282,319 271,027 4
Equity
Share capital 10 10 0
General reserve 13,072 13,072 0
of which: statutory capital reserve 13,072 13,072 0
of which: capital contribution reserve 13,072 13,072 0
Retained earnings / (loss) carried forward 1,068 0
Net profit / (loss) for the period 295 1,068 (72)
Total equity 14,444 14,149 2
Total liabilities and equity 296,764 285,176 4
of which: subordinated liabilities 4,540 4,020 13
of which: subject to mandatory conversion and / or debt waiver 4,540 4,020 13

Lega
l ent
ity fi
nanc
ial a
nd
regu
lato
ry in
form
atio
n
163
Basis of accounting
The UBS Switzerland AG standalone financial statements are pre-pared in accordance with Swiss GAAP (FINMA Circular 2015 / 1 and the Banking Ordinance).
The accounting policies are principally the same as the IFRS-based accounting policies for the consolidated financial state-ments of UBS Group AG outlined in Note 1 to the consolidated financial statements of UBS Group AG in the Annual Report 2015. Major differences between the Swiss GAAP requirements and IFRS are described in Note 38 to the consolidated financial state-ments of UBS Group AG in the Annual Report 2015. Further infor-
mation on the accounting policies applied for the standalone financial information of UBS Switzerland AG is provided in Note 2 to the UBS Switzerland AG standalone financial statements in the Annual Report 2015.
In preparing the interim financial information for UBS Switzer-land AG, the same accounting policies and methods of computa-tion have been applied as in the annual financial statements as of 31 December 2015. This interim financial information is unau-dited and should be read in conjunction with the audited financial statements included in the Annual Report 2015.
Joint and several liability
In June 2015, the Personal & Corporate Banking and Wealth Management businesses booked in Switzerland were transferred from UBS AG to UBS Switzerland AG through an asset transfer in accordance with the Swiss Merger Act. Under the Swiss Merger Act, UBS AG assumed joint liability for obligations existing on the asset transfer date, 14 June 2015, which were transferred to UBS Switzerland AG. Under the terms of the asset transfer agreement, UBS Switzerland AG assumed joint liability for approximately CHF 325 billion of contractual obligations of UBS AG existing on the asset transfer date, excluding the collateralized portion of secured contractual obligations and covered bonds.
UBS Switzerland AG has no liability for new obligations incurred by UBS AG after the asset transfer date.
➔ Refer to “Establishment of UBS Switzerland AG” in the “Legal
entity financial and regulatory information” section of our
Annual Report 2015 for more information
The joint liability amount declines as obligations mature, termi-nate or are novated following the asset transfer date. As of 31 March 2016, the joint liability of UBS Switzerland AG amounted to approximately CHF 121 billion.

Legal entity financial and regulatory information
164
Reconciliation of Swiss federal banking law equity to Swiss SRB capital (phase-in)
CHF billion 31.3.16 31.12.15
Equity – Swiss federal banking law1 14.4 14.1
Deferred tax assets 0.9 0.9
Goodwill and intangible assets (4.2) (4.5)
Other2 (0.6) (0.1)
Common equity tier 1 capital 10.5 10.5
Additional tier 1 capital 2.0 1.5
Tier 2 capital 2.5 2.5
Total capital 15.0 14.5
1 Equity under Swiss federal banking law is adjusted to derive equity in accordance with IFRS and then further adjusted to derive common equity tier 1 (CET1) capital in accordance with Swiss SRB requirements. 2 Includes accruals for dividends to shareholders and other items.
Regulatory key figures
Requirement1 Actual
CHF million, except where indicated 31.3.16 31.3.16 31.12.15
Capital ratios – Swiss SRB (phase-in)
Common equity tier 1 capital 10,495 10,468
Additional tier 1 capital 2,000 1,500
Tier 2 capital 2,500 2,500
Total capital 13,574 14,995 14,468
Risk-weighted assets 93,018 95,765
Common equity tier 1 capital ratio (%) 8.6 11.3 10.9
Total capital ratio (%) 14.6 16.1 15.1
Leverage ratio – Swiss SRB (phase-in)
Total capital 14,995 14,468
Leverage ratio denominator 309,001 296,865
Leverage ratio (%) 3.4 4.9 4.9
Leverage ratio – BIS (phase-in)
Tier 1 capital 12,495 11,968
Leverage ratio denominator 309,001 296,865
Leverage ratio (%) 4.0 4.0
Liquidity coverage ratio2
High-quality liquid assets (CHF billion) 77 75
Net cash outflows (CHF billion) 69 65
Liquidity coverage ratio (%) 113 115
1 The CET1 capital ratio requirement of 8.6%, the total capital ratio requirement of 14.6% and the total leverage ratio requirement of 3.4% are the current phase-in requirements according to the Swiss Capital Adequacy Ordinance. In addition, FINMA defined a) a total capital ratio requirement for UBS Switzerland AG which is the sum of 14.4% and the current effect of the countercyclical buffer requirement of 0.4%, of which 10.0% plus the effect of the countercyclical buffer requirement must be satisfied with CET1 capital and b) a total leverage ratio requirement of 3.5%. These requirements will be effective until they are exceeded by the Swiss SRB phase-in requirements. 2 Figures represent a 3-month average.
Additional information concerning the capital requirements appli-cable to UBS Switzerland AG (standalone) is provided in the docu-ment “UBS Switzerland AG (standalone) regulatory information,” which will be available from 6 May 2016 in “Disclosure for subsid-iaries and branches” at www.ubs.com/investors.
The same document contains supplemental Swiss SRB capital information, as well as information on the leverage ratio and the liquidity coverage ratio.

Lega
l ent
ity fi
nanc
ial a
nd
regu
lato
ry in
form
atio
n
165
UBS Limited (standalone)
Income statement
For the quarter ended % change from
GBP million 31.3.16 31.12.15 31.3.15 4Q15 1Q15
Interest income 84 54 52 56 62
Interest expense (81) (58) (56) 40 45
Net interest income 2 (4) (3)
Credit loss (expense) / recovery (2) 0 2
Net fee and commission income 191 208 231 (8) (17)
Net trading income 0 9 (14) (100)
Other income (20) (7) (37) 186 (46)
Total operating income 170 206 179 (17) (5)
Total operating expenses 137 142 149 (4) (8)
Operating profit before tax 33 64 29 (48) 14
Tax expense / (benefit) 6 (29) 10 (40)
Net profit 27 93 20 (71) 35
Statement of comprehensive income
For the quarter ended
GBP million 31.3.16 31.12.15 31.3.15
Net profit 27 93 20
Other comprehensive income
Other comprehensive income that may be reclassified to the income statement
Financial assets available for sale
Net unrealized gains / (losses) on financial assets available for sale 2 (6) 6
Total other comprehensive income that may be reclassified to the income statement 2 (6) 6
Total comprehensive income 29 87 26

Legal entity financial and regulatory information
166
Balance sheet
% change from
GBP million 31.3.16 31.12.15 31.12.15
Assets
Cash and balances with central banks 10 5 100
Due from banks 1,012 841 20
Loans 752 791 (5)
Cash collateral on securities borrowed 4,777 3,711 29
Reverse repurchase agreements 3,777 2,973 27
Trading portfolio assets 5,172 3,770 37
Positive replacement values 20,237 17,668 15
Cash collateral receivables on derivative instruments 5,258 6,027 (13)
Financial assets designated at fair value 3,190 666 379
Financial assets available for sale 699 3,163 (78)
Deferred tax assets 172 172 0
Other assets 366 319 15
Total assets 45,422 40,105 13
Liabilities
Due to banks 3,362 2,309 46
Due to customers 484 230 111
Cash collateral on securities lent 853 668 28
Repurchase agreements 4,537 4,021 13
Trading portfolio liabilities 5,743 4,787 20
Negative replacement values 20,981 18,040 16
Cash collateral payables on derivative instruments 5,034 5,966 (16)
Financial liabilities designated at fair value 807 728 11
Other liabilities 535 316 69
Total liabilities 42,337 37,064 14
Equity
Share capital 227 227 0
Share premium 2,184 2,184 0
Retained earnings 436 396 10
Cumulative net income recognized directly in equity, net of tax 4 1 300
Other equity instruments 235 235 0
Total equity 3,085 3,042 1
Total liabilities and equity 45,422 40,106 13

Lega
l ent
ity fi
nanc
ial a
nd
regu
lato
ry in
form
atio
n
167
Basis of accounting
The financial statements of UBS Limited are prepared in accor-dance with International Financial Reporting Standards (IFRS), as endorsed by the European Union (EU), and are stated in British pounds (GBP), the functional currency of the entity. UBS Group AG is the ultimate parent of UBS Limited, which is 100% owned by UBS AG. This interim financial information does not comply with IAS 34, Interim Financial Reporting, as it includes only the income statement, the statement of comprehensive income and the balance sheet of UBS Limited.
In preparing this interim financial information, the same accounting policies and methods of computation have been applied as in the audited financial statements included in the Annual Report and Financial Statements of UBS Limited for the
year ended 31 December 2015, which is available in “Disclosure for subsidiaries and branches” at www.ubs.com/investors. This interim financial information is unaudited and should be read in conjunction with the audited financial statements of UBS Limited.
In March 2016, the UK Government announced a proposed change in law which would reduce the proportion of banks’ annual taxable profits that can be offset by UK tax losses carried forward from 50% to 25% with effect from 1 April 2016. The UK Government also proposed to reduce the UK corporate income tax rate from 18% to 17% with effect from 1 April 2020. To the extent that these changes are enacted in 2016, UBS Limited would expect to incur a reduction in recognized UK deferred tax assets of approximately GBP 83 million.
Capital information1, 2
GBP million, except where indicated 31.3.16 31.12.15 31.3.15
Tier 1 capital 2,794 2,629 3,958
of which: common equity tier 1 capital 2,559 2,394 3,343
Tier 2 capital 621 587 975
Total capital 3,415 3,216 4,933
Common equity tier 1 capital ratio (%) 20.6 19.4 24.7
Tier 1 capital ratio (%) 22.5 21.3 29.2
Total capital ratio (%) 27.5 26.1 36.4
Risk-weighted assets 12,404 12,316 13,551
1 Capital information for UBS Limited has been prepared in accordance with Regulation (EU) No 575 / 2013 (as amended by Regulation (EU) 2015 / 62 in respect of the leverage ratio). 2 There is no local disclosure requirement for the liquidity coverage ratio or leverage ratio for UBS Limited as of 31 March 2016.

Appendix
168
Abbreviations frequently used in our financial reports
AABS asset-backed securityAGM annual general meeting of
shareholdersAIV alternative investment
vehicleAMA advanced measurement
approachAT1 additional tier 1
BBCBS Basel Committee on
Banking SupervisionBD business divisionBIS Bank for International
SettlementsBoD Board of DirectorsBVG Swiss occupational
pension plan
CCC Corporate CenterCCAR Comprehensive Capital
Analysis and ReviewCCF credit conversion factorsCCP central counterpartyCDO collateralized debt
obligationCDR constant default rateCDS credit default swapCEA Commodity Exchange ActCEO Chief Executive OfficerCET1 common equity tier 1CFO Chief Financial OfficerCHF Swiss francCLN credit-linked noteCLO collateralized loan
obligationCMBS commercial mortgage-
backed securityCVA credit valuation
adjustment
DDBO defined benefit obligationDCCP Deferred Contingent
Capital Plan DOJ Department of JusticeDTA deferred tax assetDVA debit valuation adjustment
EEAD exposure at defaultEC European CommissionECB European Central BankEIR effective interest rateEMEA Europe, Middle East and
AfricaEOP Equity Ownership PlanEPS earnings per shareETD exchange-traded derivativesETF exchange-traded fundEU European UnionEUR euroEURIBOR Euro Interbank Offered Rate
FFCA UK Financial Conduct
AuthorityFCT foreign currency translationFDIC Federal Deposit Insurance
CorporationFINMA Swiss Financial Market
Supervisory AuthorityFRA forward rate agreementFSA UK Financial Services
AuthorityFSB Financial Stability BoardFTD first to defaultFTP funds transfer priceFVA funding valuation
adjustmentFX foreign exchange
GGAAP generally accepted
accounting principlesGBP British poundGEB Group Executive BoardGIIPS Greece, Italy, Ireland,
Portugal and Spain Group ALM Group Asset and Liability
Management
HHQLA high-quality liquid assets
IIAS International Accounting
StandardsIASB International Accounting
Standards BoardIFRS International Financial
Reporting StandardsIRB internal ratings-basedIRC incremental risk chargeISDA International Swaps and
Derivatives Association
KKPI key performance indicator
LLAC loss-absorbing capitalLAS liquidity-adjusted stressLCR liquidity coverage ratioLGD loss given defaultLIBOR London Interbank
Offered RateLRD leverage ratio denominatorLTV loan-to-value
MMTN medium-term note

169
Abbreviations frequently used in our financial reports (continued)
NNAV net asset valueNRV negative replacement valueNPA non-prosecution agreementNSFR net stable funding ratio
OOCI other comprehensive
incomeOTC over-the-counter
PPRA UK Prudential
Regulation AuthorityPRV positive replacement value
RRLN reference-linked noteRMBS residential mortgage-
backed securityRoAE return on attributed equityRoE return on equityRoTE return on tangible equityRV replacement valueRWA risk-weighted assets
SSE structured entitySEC US Securities and
Exchange CommissionSEEOP Senior Executive Equity
Ownership PlanSFT securities financing
transactionSNB Swiss National BankSRB systemically relevant bankSRM Single Resolution
MechanismSVaR stressed value-at-risk
TTBTF too big to failTLAC total loss-absorbing capacityTRS total return swap
UUSD US dollar
VVaR value-at-risk
Appendix
170
Information sources
Reporting publications
Annual publications: Annual publications: Annual report (SAP no. 80531): Published in both English and German, this single volume report provides a description of our Group strategy and performance; the strategy and performance of the business divi-sions and Corporate Center; a description of risk, treasury, capital management, corporate governance, responsibility and senior management compensation, including compensation for the Board of Directors and the Group Executive Board members; and financial information, including the financial statements. Review (SAP no. 80530): The booklet contains key information on our strategy and financials. It is published in English, German, French and Italian. Compensation Report (SAP no. 82307): The report discusses our compensation framework and provides information on compensation for the Board of Directors and the Group Execu-tive Board members. It is published in English and German.
Quarterly publications: Financial report (SAP no. 80834) and results materials: The quarterly financial report, published for the first, second and third quarter, and the fourth-quarter earnings release and financial supplement provide an update on our strat-egy and performance for the respective quarter. They are mainly available in English.
How to order reports: The annual and quarterly publications are available in PDF on the internet at www.ubs.com/investors in the “Financial information” section. Printed copies can be ordered from the same website in the “Investor services” section, which can be accessed via the link on the left-hand side of the screen. Alternatively, they can be ordered by quoting the SAP number and the language preference, where applicable, from UBS AG, F4UK–AUL, P.O. Box, CH-8098 Zurich, Switzerland.
Other information
Website: The “Investor Relations” website at www.ubs.com/investors provides the following information on UBS: news releases, financial information, including results-related filings with the US Securities and Exchange Commission, corporate information, including UBS share price charts and data and divi-dend information, the UBS corporate calendar and presentations by management for investors and financial analysts. Information on the internet is available in English and German.
Result presentations: Our quarterly results presentations are webcast live. A playback of most presentations is downloadable at www.ubs.com/presentations.
Messaging service / UBS news alert: On the www.ubs.com/newsalerts website, it is possible to subscribe to receive news alerts about UBS via SMS or email. Messages are sent in English, German, French or Italian and it is possible to state theme prefer-ences for the alerts received.
Form 20-F and other submissions to the US Securities and Exchange Commission: We file periodic reports and submit other information about UBS to the US Securities and Exchange Commission (SEC). Principal among these filings is the annual report on Form 20-F, filed pursuant to the US Securities Exchange Act of 1934. The filing of Form 20-F is structured as a “wrap-around” document. Most sections of the filing can be satisfied by referring to parts of the annual report. However, there is a small amount of additional information in Form 20-F which is not pre-sented elsewhere, and is particularly targeted at readers in the US. Readers are encouraged to refer to this additional disclosure. Any document that we file with the SEC is available to read and copy on the SEC’s website, www.sec.gov, or at the SEC’s public refer-ence room at 100 F Street, N.E., Room 1580, Washington, DC, 20549. Please call the SEC on +1800-SEC-0330 for further infor-mation on the operation of its public reference room. Refer to www.ubs.com/investors for more information.

171
Cautionary Statement Regarding Forward-Looking Statements | This report contains statements that constitute “forward-looking statements,” including but not limited to management’s outlook for UBS’s financial performance and statements relating to the anticipated effect of transactions and strategic initiatives on UBS’s business and future development. While these forward-looking statements represent UBS’s judgments and expectations concerning the matters de-scribed, a number of risks, uncertainties and other important factors could cause actual developments and results to differ materially from UBS’s expectations. These factors include, but are not limited to: (i) the degree to which UBS is successful in executing its announced strategic plans, including its cost reduction and efficiency initiatives and its targets for risk-weighted assets (RWA) and leverage ratio denominator (LRD), and the degree to which UBS is successful in implement-ing changes to its wealth management businesses to meet changing market, regulatory and other conditions; (ii) the continuing low or negative interest rate environment, developments in the macroeconomic climate and in the markets in which UBS operates or to which it is exposed, including movements in securities prices or liquidity, credit spreads, and currency exchange rates, and the effect of economic conditions and market developments on the financial position or creditworthiness of UBS’s clients and counterparties; (iii) changes in the availability of capital and funding, including any changes in UBS’s credit spreads and rat-ings, as well as availability and cost of funding to meet requirements for debt that will be eligible for total loss-absorbing capacity (TLAC) requirements, or loss-absorbing capital; (iv) changes in or the implementation of financial legislation and regulation in Switzerland, the US, the UK and other financial centers that may impose, or result in, more stringent capital, TLAC, leverage ratio, liquidity and funding requirements, incremental tax requirements, additional levies, limitations on permitted activities, constraints on remuneration or other measures, and the effect this would have on UBS’s business activities; (v) uncertainty as to when and to what degree the Swiss Financial Market Supervisory Authority (FINMA) will approve a limited reduction of capital or gone concern requirements due to mea-sures to reduce resolvability risk; (vi) the degree to which UBS is successful in implementing further changes to its legal structure to improve its resolvability and meet related regulatory requirements, including changes in legal structure and reporting required to implement US enhanced prudential standards, implementing a service company model, the transfer of the Asset Management business to a holding company, and the potential need to make further changes to the legal structure or booking model of UBS Group in response to legal and regulatory requirements relating to capital requirements, resolvability requirements and propos-als in Switzerland and other countries for mandatory structural reform of banks and the extent to which such changes have the intended effects; (vii) changes in UBS’s competitive position, including whether differences in regulatory capital and other requirements among the major financial centers will adversely affect UBS’s ability to compete in certain lines of business; (viii) changes in the standards of conduct applicable to our businesses that may result from new regulation or new enforcement of existing standards, including proposed measures to impose new and enhanced duties when interacting with customers and in the execution and handling of customer transactions; (ix) the liability to which UBS may be exposed, or possible constraints or sanctions that regulatory authorities might impose on UBS, due to litigation, contractual claims and regulatory investigations, including the potential for disqualification from certain businesses or loss of licenses or privileges as a result of regulatory or other governmental sanctions, as well as the effect that litigation, regulatory and similar matters have on the operational component of our RWA; (x) the effects on UBS’s cross-border banking business of tax or regulatory developments and of possible changes in UBS’s policies and practices relating to this business; (xi) UBS’s ability to retain and attract the employees necessary to generate revenues and to manage, support and control its businesses, which may be affected by competitive factors including differences in compensation practices; (xii) changes in accounting or tax standards or policies, and determinations or interpretations affecting the recognition of gain or loss, the valuation of goodwill, the recognition of deferred tax assets and other matters; (xiii) limitations on the effectiveness of UBS’s internal processes for risk management, risk control, measurement and modeling, and of financial models generally; (xiv) whether UBS will be successful in keeping pace with competitors in updating its technology, particularly in trading businesses; (xv) the occurrence of opera-tional failures, such as fraud, misconduct, unauthorized trading, financial crime, cyber-attacks, and systems failures; (xvi) restrictions on the ability of UBS Group AG to make payments or distributions, including due to restrictions on the ability of its subsidiaries to make loans or distributions, directly or indirectly, or, in the case of financial difficulties, due to the exercise by FINMA of its broad statutory powers in relation to protective measures, restructuring and liquidation proceed-ings; (xvii) the degree to which changes in regulation, capital or legal structure, financial results or other factors, including methodology, assumptions and stress scenarios, may affect UBS’s ability to maintain its stated capital return objective; and (xviii) the effect that these or other factors or unanticipated events may have on our reputation and the additional consequences that this may have on our business and performance. The sequence in which the factors above are presented is not indicative of their likelihood of occurrence or the potential magnitude of their consequences. Our business and financial performance could be affected by other factors identified in our past and future filings and reports, including those filed with the SEC. More detailed information about those factors is set forth in documents furnished by UBS and filings made by UBS with the SEC, including UBS’s Annual Report on Form 20-F for the year ended 31 December 2015. UBS is not under any obligation to (and expressly disclaims any obligation to) update or alter its forward-looking statements, whether as a result of new information, future events, or otherwise.
Rounding | Numbers presented throughout this report may not add up precisely to the totals provided in the tables and text. Percentages, percent changes and absolute variances are calculated on the basis of rounded figures displayed in the tables and text and may not precisely reflect the percentages, percent changes and absolute variances that would be calculated on the basis of figures that are not rounded.
Tables | Within tables, blank fields generally indicate that the field is not applicable or not meaningful, or that information is not available as of the relevant date or for the relevant period. Zero values generally indicate that the respective figure is zero on an actual or rounded basis. Percentage changes are presented as a mathematical calculation of the change between periods.


UBS Group AGP.O. BoxCH-8098 Zurich
www.ubs.com