our products are - jsp global presence is now firmly established and strengthened by our recent...
TRANSCRIPT


OUR PRODUCTS ARE...
STRONG
ANTI-STATIC
SOUND-PROOF
WATER-RESISTANT
RECYCLABLEENERGY-ABSORBING
INSULATINGCHEMICALLY INERT
LIGHT
WE DELIVER INNOVATIVE, VALUE-ADDED PRODUCTS TO THE MARKET, C R E AT I N G G R O W T H A N D N E W O P P O R T U N I T I E S F O R O U R C U S TO M E R S
CONTENTS
Financial Highlights . . . . . . . . . . . . . . . . . . . . . . 2
Message from the President . . . . . . . . . . . . . . . 3
Review of Operations . . . . . . . . . . . . . . . . . . . . 4
Special Reports
Regional Reports . . . . . . . . . . . . . . . . . . . . 6
Global Reach . . . . . . . . . . . . . . . . . . . . . . 10
New Products . . . . . . . . . . . . . . . . . . . . . . 11
JSP Exhibits at IPF . . . . . . . . . . . . . . . . . . 12
The ARPRO® Adventure. . . . . . . . . . . . . . 13
Corporate Governance . . . . . . . . . . . . . . . . . . 14
Global Network . . . . . . . . . . . . . . . . . . . . . . . . 15
Financial Section . . . . . . . . . . . . . . . . . . . . . . . 16
Corporate Data/Major Shareholders . . . . . . . . 32
Copyright 2012, JSP Corporation.
All rights reserved.
Forward-Looking Statements.
This annual report includes forward-looking
statements related to JSP Corporation plans,
strategies, and business results. These statements
represent judgments of JSP Corporation based on
information available at the time.
As such, these statements are subject to risks
and uncertainties. Please understand that actual
performance may differ from these forward-looking
statements.
1 JSP ANNUAL REPORT 2012

0
20,000
40,000
60,000
80,000
100,000
(Millions of yen)
0
1,000
2,000
3,000
4,000
5,000
6,000
7,000
8,000
(Millions of yen)
0
50
100
150
200(Yen)
1208 09 10 11 1208 09 10 11 1208 09 10 11
91,971
81,597
96,53499,407 93,397 7,874
5,540
2,778
4,735
5,536
161.25
103.35
43.74
82.74
103.98
Millions of yenThousands of U.S. dollars
(Note 1)
Years ended March 31 2012 2011 2010 2009 2008 2012 (US$)
For the Year:
Net Sales ¥93,397 ¥91,971 ¥81,597 ¥96,534 ¥99,407 $1,136,364
Operating Income 5,296 7,552 5,685 2,701 5,046 64,437
Ordinary Income 5,536 7,874 5,540 2,778 4,735 67,356
Income before Income Taxes 5,176 7,470 5,096 2,605 4,431 62,986
Net Income 3,100 4,881 3,209 1,366 2,589 37,721
at Year-eND:
Total Assets 89,072 89,152 86,197 84,316 94,993 1,083,737
Total Net Assets 47,362 46,481 45,912 42,001 48,057 576,258
Capital Stock 10,128 10,128 10,128 10,128 10,113 123,234
amoUNtS per Share oF Capital StoCk: Yen U.S. dollars
(Note 1)
Net Income per Share ¥103.98 ¥161.25 ¥103.35 ¥43.74 ¥82.74 $1.27
Cash Dividends 30.00 30.00 19.00 14.00 14.00 0.37
Total Net Assets 1,499.89 1,470.44 1,391.92 1,278.38 1,425.83 18.25
Notes: 1. U.S. dollar amounts are translated from yen, for convenience only, at the rate of ¥82.19=U.S.$1. 2. Net income per share is computed based on the weighted average number of shares of common stock
outstanding during each year.
JSP CORPORATION 2012 FINANCIAL HIGHLIGHTS
+1.6%net sales
–35.5%net income per share
–29.7%ordinary income
Net Sales ordinary income Net income per Share
DeepeN & GrowMeSSAGe FROM THe PReSIdeNT
The direction of the global economy remained
uncertain throughout the fiscal year ended March 2012.
The Euro crisis and high crude oil prices, resulting from
the change situation in the Middle East and Northern
Africa, were the major causes of uncertainty. The
Japanese economy was heavily impacted by electricity
shortages following the natural disaster which also
resulted in the accident at the nuclear power plant. In
addition, the strength of the Yen has been a further
brake on the Japanese economy.
In the face of these challenges, we set about
improving revenues by focusing on value-added
products that utilize our exclusive technologies and
thereby expanding globally.
We believe that protecting our irreplaceable global
environment requires us to create a balance
between nature and production activity. We aim
to further reduce our impact on the environment.
As well as benefiting the environment, this should
further validate the continuing public trust we enjoy
and be a long-term competitive advantage.
Deepen and Grow is the current medium-term
(2012 to 2014) management plan for our business.
We aim to deepen and grow through:
1 Strengthening our current business activities 2 Expanding business activities globally 3 Creating entirely new business activities
To strengthen our current business, we will selectively
and intelligently reduce costs, drive for increased
penetration and achieve more diversification through
new applications and indeed new value-added grades
of materials.
Our global presence is now firmly established and
strengthened by our recent investments in Brazil. Our
business in China will benefit from a four-base operating
structure (North, East, Southwest and South). We are
also accelerating our reach in the Southeast Asia,
South America, and Africa to expand our business more
quickly. Our existing global operations will even further
deliver on co-operation and co-ordination as well as
building on our technological capabilities in order that
we deliver value to our clients.
We have committed significant attention and
resources to creating entirely new business activities.
Some of the projects we have in hand are very
exciting and have the potential to deliver profitable
global businesses of scale.
Our deepen and grow plans are underpinned by
specific achievement targets. No later than March
2014 we target to achieve Sales of ¥110,000 million
and an operating margin of 8.0%. We are confident
that we will continue to work as one global JSP,
developing new ideas to achieve further growth and
delivering value to our clients.
kozo tsukamoto
President
2 3 JSP ANNUAL REPORT 2012

Bead Business
Sales in the Bead segment increased 5.3% year-
on-year to 52,869 million yen and operating income
fell 29.5% to 3,212 million yen. The major reason of
profit decline in this segment was that the demand
for STYRODIA® (expandable polystyrene beads) has
been rapidly decreasing in the disaster area.
ARPRO®/P-BLOCK™ (expanded polypropylene),
manufactured and sold globally, is used in automotive
parts such as bumper cores, interior parts, and seat
cores, packaging for consumer electronic equipment,
containers for medical applications and food, and
for materials for construction and civil engineering.
Global sales of ARPRO®/P-BLOCK™ increased
compared with the previous year. In North America,
demand for ARPRO®/P-BLOCK™ has continued to be
sheet) were about the same as the previous year.
In home insulation material, sales of MIRAFOAM™
(extruded board made of expanded polystyrene) were
at the same level as the previous year, supported by
Government subsidies for environmentally friendly
housing and the increased demand for temporary
housing in the disaster area. Sales of MIRAPLANK™
(extruded board made of expanded polyethylene),
used as a cushioning material for cargo in trucks
and in returnable containers for transporting home
appliances and automotive parts, decreased due to
a general decline in transportation volume.
other Business
Our trading and special fabrication of general
packaging materials businesses had lower sales
because of the natural disaster and the strength of
the Yen serving to inhibit demand.
As a result, sales in this segment declined 6.0% to
5,942 million yen and there was an operating loss
of 214 million yen (compared to operating income of
7 million yen a year earlier).
natural disaster and the accident at the nuclear power
plant, both of which led to serious electric power
shortages. Sales of ARPRO®/P-BLOCK™ used in
automotive and packaging applications temporarily
decreased, but the demand subsequently recovered
to the same level as the previous fiscal year. Sales
of STYRODIA® decreased as there still has not been
a full recovery in demand for fish boxes, which is
the primary application for the product, in the areas
damaged by the natural disaster. The demand for
packaging for home appliances also declined, due
the shift of production outside of Japan as a counter
to the strength of the Yen. FOAMCORE™, (a hybrid
molded product used as a ceiling material for
prefabricated bathroom units) and SUPERFOAM™,
(used in automotive air conditioning ducts) were
included in the Bead segment from fiscal year 2011.
Sales of FOAMCORE™ increased as a consequence
of tighter thermal insulation standards, while sales of
SUPERFOAM™ were lower because of the decline in
automotive production.
extrusion Business
Sales in the Extrusion segment decreased 2.4% year-
on-year to 34,585 million yen and operating income
decreased 17.3% to 2,557 million yen. The major
reason of decreasing profit was the delay of selling
price increase for some products in this segment in
the face of surge of raw material price.
MIRAMAT® (expanded polyethylene sheet) and
P-BOARD™ (expanded polypropylene sheet) are
used as industrial packaging materials, mainly for
the transport of substrates for LCD TVs and other
digital home appliances. Sales of these two products
decreased due to the contraction of the production of
home appliances resulting from the natural disaster
as well as reduced demand from export markets
resulting from the strength of the Yen. Sales of
STYRENE PAPER™ (expanded polystyrene sheet
used in food packaging) were sluggish for the same
reasons. In advertising displays and folding boxes,
sales of MIRABOARD™ (expanded polystyrene
RevIew OF OPeRATIONS
strong driven by an increase in automotive builds. In
South America, the current plant has been operating
at full capacity, and further expansion of production
capacity has been in progress to meet the increasing
demand in this region. In Europe, despite the Euro
crisis, strong business performance has been
sustained this fiscal year thanks to the increasing
penetration of ARPRO®/P-BLOCK™ in automotive
applications and the diversification of applications
such as heating, ventilation, air-conditioning and
refrigeration (HVAC-R) and reusable industrial
packaging (dunnage). In Asia, there was growing
demand for automotive applications. Indeed, demand
was so strong in China that we supplemented supply
from our factory in Singapore. Production capacity
in China is being increased and will be on-stream
later in 2012. In Japan, the business environment
remained difficult, primarily due to the effects of the
2012 Performance
¥93,397 million
Net Sales
Up 1.6% from 2011
4 5 JSP ANNUAL REPORT 2012

Shinji Yamada — asia/China
The automotive market in China, the World’s largest,
reached sales of 18.5 million units in 2011. In
addition, further steady growth in the passenger car
sector is expected. This is driven by the expanding
middle-class, particularly in the wealth growth cities
of the inland area.
We have enhanced our local design and development
resources in order to further promote new automotive
applications, such as ARPRO®/P-BLOCK™ pedestrian
protection bumper systems and seat cores. This will
provide growth in the period from 2012 to 2014.
The high demand for plant-to-plant transportation
packaging of digital home electronics, especially
smart phones and tablet PC’s is expected to continue.
We are completing the 2nd phase capacity extension
at our Dongguan plant, which will be operational from
the 2nd half of this year, with capacity of 14,000 t /y.
We expect that demand will grow sufficiently to
require the 3rd and 4th manufacturing locations.
koichi teranishi — asia/Japan
Following the natural disaster, the Japanese
economy is now on a gradual recovery trend. The
Japanese domestic market, however, is contracting;
as companies accelerate and prioritize investment
outside of Japan. Under these economic circum-
stances, we will act to reduce costs and concentrate
on products with high added value.
There are two major business segments in Japan,
Extrusion and Bead.
In the Extrusion business, one of our core products,
MIRAMAT® ACE, used as surface protection material
for glass substrates and panels of LCD TVs, has
now been adopted as a protection material for
organic EL TVs and tablet computer parts. We are
also planning to cultivate a new market by providing
high value-added products with excellent properties
such as permanent antistatic or static dissipation for
packaging materials for IT related products.
In the food packaging sector we are working to create
new markets by using innovative materials that are
alternatives to solid sheet or high density sheet.
In the Bead business, on top of the existing major
applications for fish and vegetable boxes, STYRODIA®
has been expanding in application for insulation material
for construction, heat resistant application for boilers
and tanks, and structural parts for air conditioning
equipment. We will further drive for the application
development by introducing our new functional grades
such as ELEMPOR NEO™ (expandable polyethylene
and Polystyrene copolymer bead) and HEATPOR®
(expandable heat-resistant bead).
We do not expect any significant increase of automotive
production in Japan. Nevertheless, we strive to increase
the penetration of ARPRO®/P-BLOCK™ in automotive
applications.
Due to the delay of the Japanese Government action
for recovery in the disaster area, strong demand for the
necessary construction and civil engineering materials
will be expected only in 2013. Consequently, demand
will increase for MIRAFOAM™ which has the world
leading level of insulation performance, as well as for
WALLBLOCK™ which is a construction method using our
STYRODIA® that serves to shorten construction time.
inwon Chang — asia/korea
The World economy, which had been recovering from
the financial crisis, is now exposed to the effects of
the sovereign debt and currency crisis in Europe.
In addition, the rate of growth in Brazil and China
has slowed. All of these global influences impact
the demand for ARPRO®/P-BLOCK™. However, the
drivers of the short-term demand issues also present
opportunities. The high performance at reduced
ReGIONAL RePORTS
weight provided by ARPRO®/P-BLOCK™ is a unique
opportunity to expand utilization over the medium-term.
The range of applications continues to diversify;
incorporating automotive seat parts, as well as new
concepts in returnable/re-usable packaging for refrig-
erator and other domestic goods.
Despite the uncertain economic environment, we are
optimistic about the future.
Sachio Suzuki — asia/Southeast & South asia and oceania
Our ARPRO®/P-BLOCK™ activities cover a
wide geographic area; South-East & South Asia
to Oceania. The market demand in Thailand, a
significant market, was badly damaged by the
flooding in late 2011. However, this has recovered
much faster than we expected initially. In addition,
other ASEAN demand from Malaysia and the
Philippines has seen continuous modest growth.
These factors resulted in satisfactory returns in 2012.
Demand from India is expected to represent a
significant growth opportunity in the near future. We
intend to build an ARPRO®/P-BLOCK™ factory at
Mahindra World City in Chennai.
Indonesia, with a population of some 240 million
people, is also expected to be an important
automotive market growth opportunity. The capacity
of automotive production in Indonesia has been
increasing. It is anticipated to increase from 1 million
passenger cars per year in 2011 to 1.7 million
passenger cars by 2014. Total automotive builds
in Thailand, India and Indonesia are expected to
reach 7.5 million cars per year in 2012 and climb to
9.2 million cars per year by 2014.
We are enhancing our technical development support
and commercial services at warp speed, to best
serve the dynamic, growing and ever-changing market
we serve. These efforts underpin the next stages of
our growth strategy.
Shinji Yamada — Asia/China
Sachio Suzuki — Asia/Southeast & South Asia and Oceania
Koichi Teranishi — Asia/Japan
Inwon Chang — Asia/Korea
6 7 JSP ANNUAL REPORT 2012

toru Yamaguchi — asia/taiwan
The prospects for the Taiwan economy are inevitably
influenced by the world economic situation. However, it
is expected that the production and sales of flat-panel
TVs in Taiwan will show steady growth, due to the
demand in China. In addition, the ever increasing
demand for smart-phones and tablet PC’s also present
opportunities for us. ARPRO®/P-BLOCK™ delivers
excellent quality, is available to short lead times and
provides clients with class leading value.
We are planning for investment in increased production
capacity to meet the forecast demand growth.
paul Compton — emea (europe, middle-east & africa)
Our strong business performance reflects the strong
value proposition of ARPRO®/P-BLOCK™ and
results in our leading market position. The growth in
ARPRO®/P-BLOCK™ sales serves to demonstrate
the benefit of a large loyal client base and also how
a strong value offering attracts significant new clients
and end-users. The continuing high cost and volatility
of propylene, driven both by the cost of crude oil
and specific demand dynamics, does however make
holding price levels difficult.
The continuing value offered by ARPRO®/P-BLOCK™
is underpinned by; our focus on speed of delivery, a
culture of client service, a focus on constant innovation
and relentless attention to and improvement in all
elements of quality and consistency.
Whilst the economic outlook is uncertain, our
business model is strong and the financial position
is robust. The strategy of driving and capturing
growth through innovation has worked well and will
continue. This is targeted to achieve double-digit
growth over the coming years. Our efforts have
and will continue to fuel growth through increased
penetration and diversification. The increasing
penetration of ARPRO®/P-BLOCK™ in automotive
applications has and is designed to continue to
insulate our business from sector demand shocks.
Whilst future demand shocks may occur, as a result
of weakening consumer demand for cars due to the
impacts of both the continuing Euro crisis and the
austerity measures to deal with problematic Sovereign
debt in many countries in Western Europe, success
in application spread (penetration) reduces the
impact. We also look to continued success through
diversification of application sectors and geography.
ARPRO®/P-BLOCK™ is increasingly used in
heating, ventilation, air-conditioning and refrigeration
applications (HVAC-R) and also continues its strong
presence in reusable industrial packaging (dunnage).
Particular areas of new geographic growth within the
EMEA area are; Russia, the Middle-East and Africa.
We also underpin growth through constant efforts to
improve process and product development.
The growth opportunities are exciting and are fuelled
by the rigor of our penetration and diversification
efforts. Even if the near-term economic situation is
not encouraging, this approach can, at least, in part
insulate our business. The medium-term view remains
very encouraging and a growth trend is anticipated.
rich. C. alloway — North america
For North America, the period from 2012 through
2014 is expected to be one of significant growth
and opportunity. Our core automotive business will
continue to flourish. Automotive builds are scheduled
to extend their rebound from a low of 9,000,000 units
in 2009 to 14,500,000 units in 2012 and eventually up
to the 16,000,000 unit mark by 2014. In addition to
the increase in vehicle builds, we forecast continued
penetration for ARPRO®/P-BLOCK™ into the automotive
market via new applications, most notably seat cores.
Growth is also projected in our other markets. Plank
sales, which have been averaging 10% annual
increases, should accelerate as a result of new capacity
and product offerings. Our underlayment business
will increase significantly as the field market rebounds
with the economy and our landscaping product line
is introduced on a national basis. We also anticipate
ReGIONAL RePORTS
growth in our new product lines with recent investment
in the integxion™ high performance sheet foam business
and in a molding plant for returnable packaging. We
have the capacity and flexibility to pursue numerous new
markets and applications.
This growth will be challenging. We have a
substantial capital plan in place to ensure that we
meet these demands in a safe, environmentally
responsible and profitable manner. As always, we will
undergo this challenge with an unrelenting focus on
customer satisfaction.
raul Sanchez — South america
The period of 2012 through 2014 for South
America is expected to be one of consolidation and
continued growth. In 2012 we are starting up our
“SAP” (Santo Antonio de Posse) Plant. The new
ARPRO®/P-BLOCK™ capacity comes on-stream in
the summer of 2012; with additional molding capacity
coming in the second half of the year. Our Campinas
Plant is completely full so the new capacity from
SAP is awaited with eagerness by the markets in
Argentina and Brazil.
The automotive sector in Brazil is expected to
continue to grow. The Brazilian economy is now the
5th largest in the World and the Brazilian automotive
industry will soon be 4th in the world, surpassing
Germany and smaller only than China, the US, and
Japan. Automotive builds are expected to surpass the
4 million/year mark in 2013/14 and continue with over
5% growth beyond that.
In addition to the core automotive growth, we are
promoting other automotive applications such as
seat and trunk components. We are also actively
working to diversify into other markets such as the
mattress and packaging industries. Other business
opportunities and indeed business areas are
constantly under evaluation. The management of the
exciting organic growth and new areas of opportunity
demand significant resource; thus our focus during
the period from 2012 to 2014 will be to manage
growth efficiently and effectively, plant the seed to
diversify our book of business and consolidate our
presence in the region.
Toru Yamaguchi — Asia/Taiwan
Rich. C. Alloway — North America
Paul Compton — eMeA (europe, Middle-east & Africa)
Raul Sanchez — South America
8 9 JSP ANNUAL REPORT 2012

GLObAL ReACH New PROduCTS
p-ShiNe™ SD Charge-Free, Protects Products from Static electricity
Sales have commenced of our newly developed P-SHINE™ SD, a non-cross linked high-density polypropylene foam sheet for molding, featuring static dissipative properties making it ideal for use in shipping trays used in the transport of electronic components and equipment.
New technology has made it possible to incorporate charge-free properties into this product, allowing it to protect packaged items from static electricity buildup. This new product overcomes a long-time weakness in other anti-static products, namely that they allow the additives to transfer to the packaged product during shipping. P-SHINE™ SD delivers high-value to clients.
JSP first created a series of permanent anti-static cushioning and packaging materials for commercial applications in 2001. In recent years we have extended the range of permanent anti-static products we offer.
The introduction of P-SHINE™ SD sheets to the market represents an evolution in the JSP lineup of permanent anti-static products. This new non-charge technology not only protects products from static electricity, but also reduces the risk of dielectric breakdown in electronics components due to electrostatic discharge by maintaining the optimum surface resistance of the sheet. The new technology also reduces the risk of the additives being transferred to the packaged product.
Barrier tankNew Fuel Tank
“Barr ier Tank” (trademark in progress) ut i l izes MX Nylon resin layers impregnated with high-density polyethylene (HDPE) to of fer barr ier capabil i t ies that restr ic t gasoline permeation.
The product was a co-development utilizing JSP’s blow-moulding technology and MX Nylon from Mitsubishi Gas Chemical. The Barrier Tank is targeted at engines of 1.0 to 1.5 litre capacity, and represents exceptionally high value for the price.
The Barrier utilizes existing high-density polyethylene tank blow molding investments and offers advantages versus tanks produced by fluorine coating or multilayer blow molding. Additionally process waste is easily recycled.
Already adopted by Suzuki for use in outboard motors, Barrier Tank has global market potential and is particularly suited to the demands of the North American market, where regulations on fuel permeation are already in effect.
Barrier Tank is also ideal for chain saws, power generators, lawn mowers, golf cars, tractors, and dune buggies.
The annual global demand for this type of solution is estimated at four to five million units.
the country’s incredible economic growth. We completed the construction work in July 2012. In addition to our current Wuxi and Dongguan plants, we are planning to gain ground in the North and Southwest parts of China to establish a four-base operating structure.
North americaIn August 2011, we purchased an ARPRO®/P-BLOCK™ molding plant located west of Detroit, Michigan. This facility positions us to respond to the increasing auto production. The need for energy-saving, safe vehicles have led to continuously increasing demand for ARPRO®/P-BLOCK™ which is light-weight and has energy management properties. We now have six stra-tegically positioned production plants in North America, with all locations running at high operating rate. There remains scope for further significant growth.
BrazilIn February 2011, we made a strategic acquisition in Brazil. We are now running close to capacity and are in the final stages of construction of a new factory outside Sao Paulo that will start production in July 2012. This will triple our production capacity in the country. We expect the Brazilian economy will grow rapidly with the benefit from the soccer World Cup and 2016 Olympic Games. At present, Brazil produces 3.5 million automobiles annually, with that number expected to reach 5 million soon.
indiaWe have established a presence in India and expect to build a manufacturing plant in the near future.
ChinaIn China, we are adding production capacity at our Dongguan plant to meet the growing demand sparked by
New molding facility in Michigan, US.
New production site in BrazilPlant expansion in Dongguan Plant
we now have operations in all of the major global markets and are adding to our production capacity to meet growing demand. we have continuously improved our production and sales structure and capability to meet the wide range of needs of global markets.
10 11 JSP ANNUAL REPORT 2012
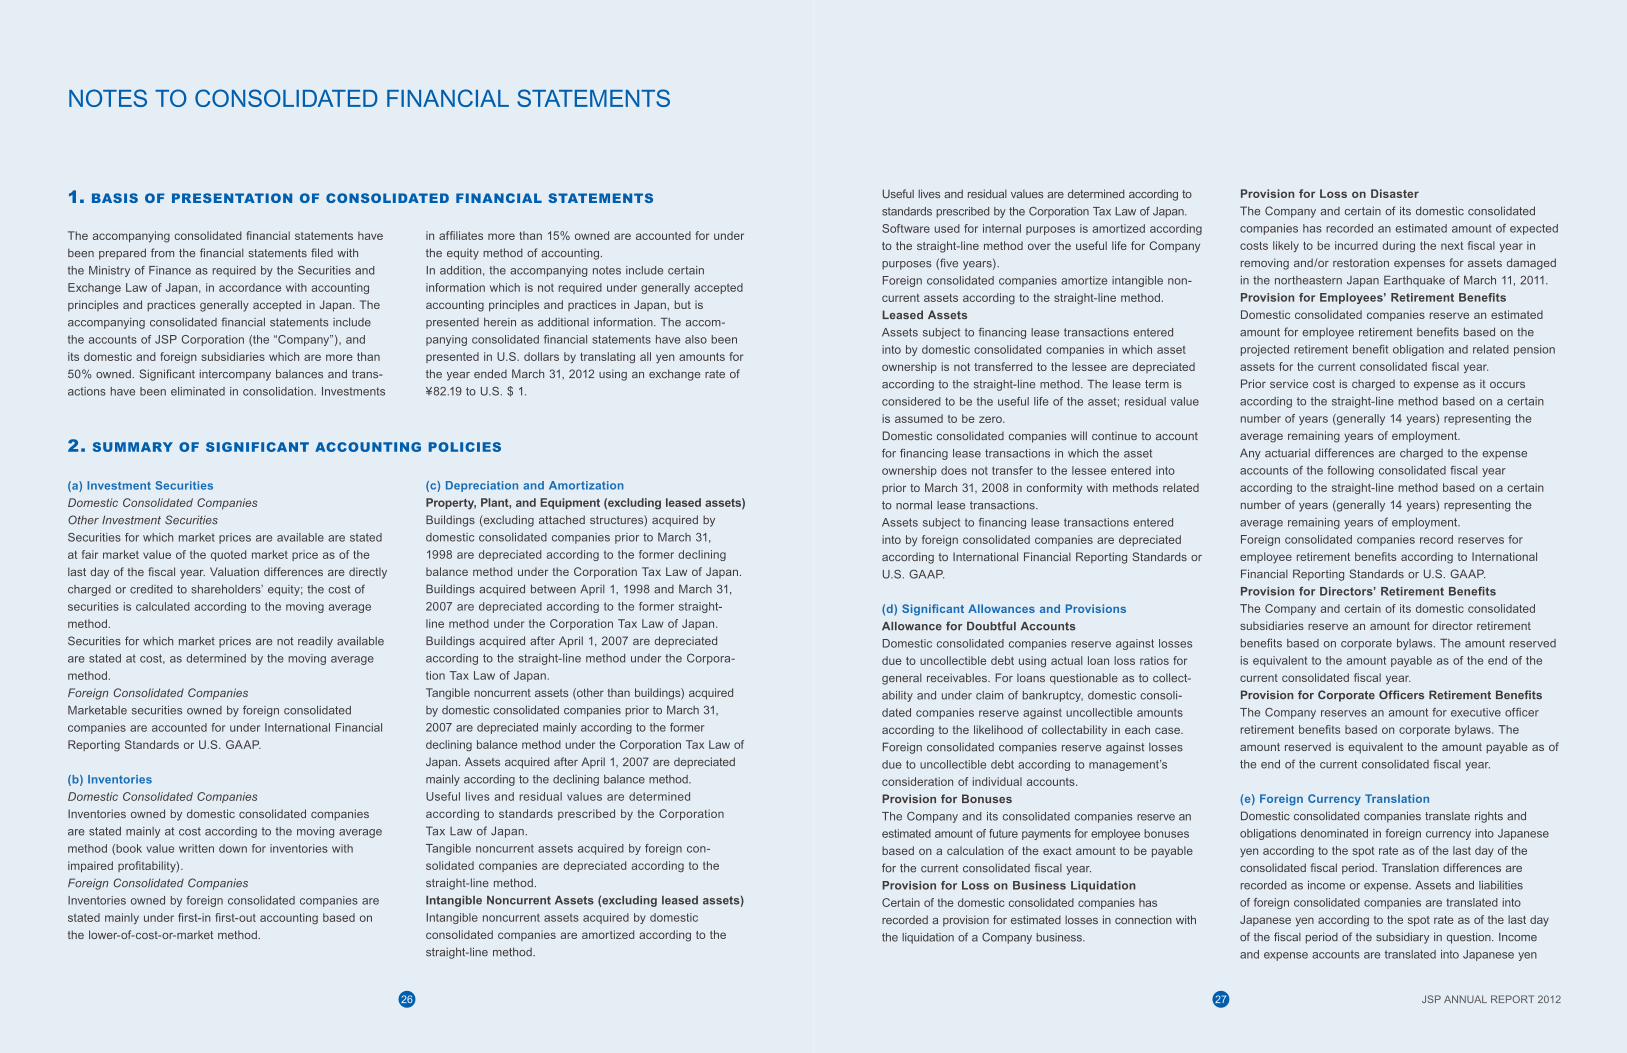
The ARPRO® Adventure is our EMEA annual client
event that aims to stimulate and inform. The ARPRO®
Adventure allows us to share our enthusiasm and
how we are continuously developing and investing in
ARPRO® with our valued client base, in an engaging
and interactive manner.
The event has been held in a different location each
October since 2008. Locations so far have been;
Weggis/Luzern, Frankfurt, Prague and Geneva.
The 2012 event is to be held in Barcelona at Camp
Nou, the home of the incomparably successful and
current World Club Champions F C Barcelona. Each
ARPRO® Adventure is unique and is built around a
time pertinent business theme. The theme for 2012,
given the location, is teamwork, strategy and efficient
and effective execution.
The majority of speakers are drawn from JSP, but
we also have highly relevant and thought provoking
external speakers, with whom we as a business or
The ARPRO® Awards
THe ARPRO® AdveNTuRe
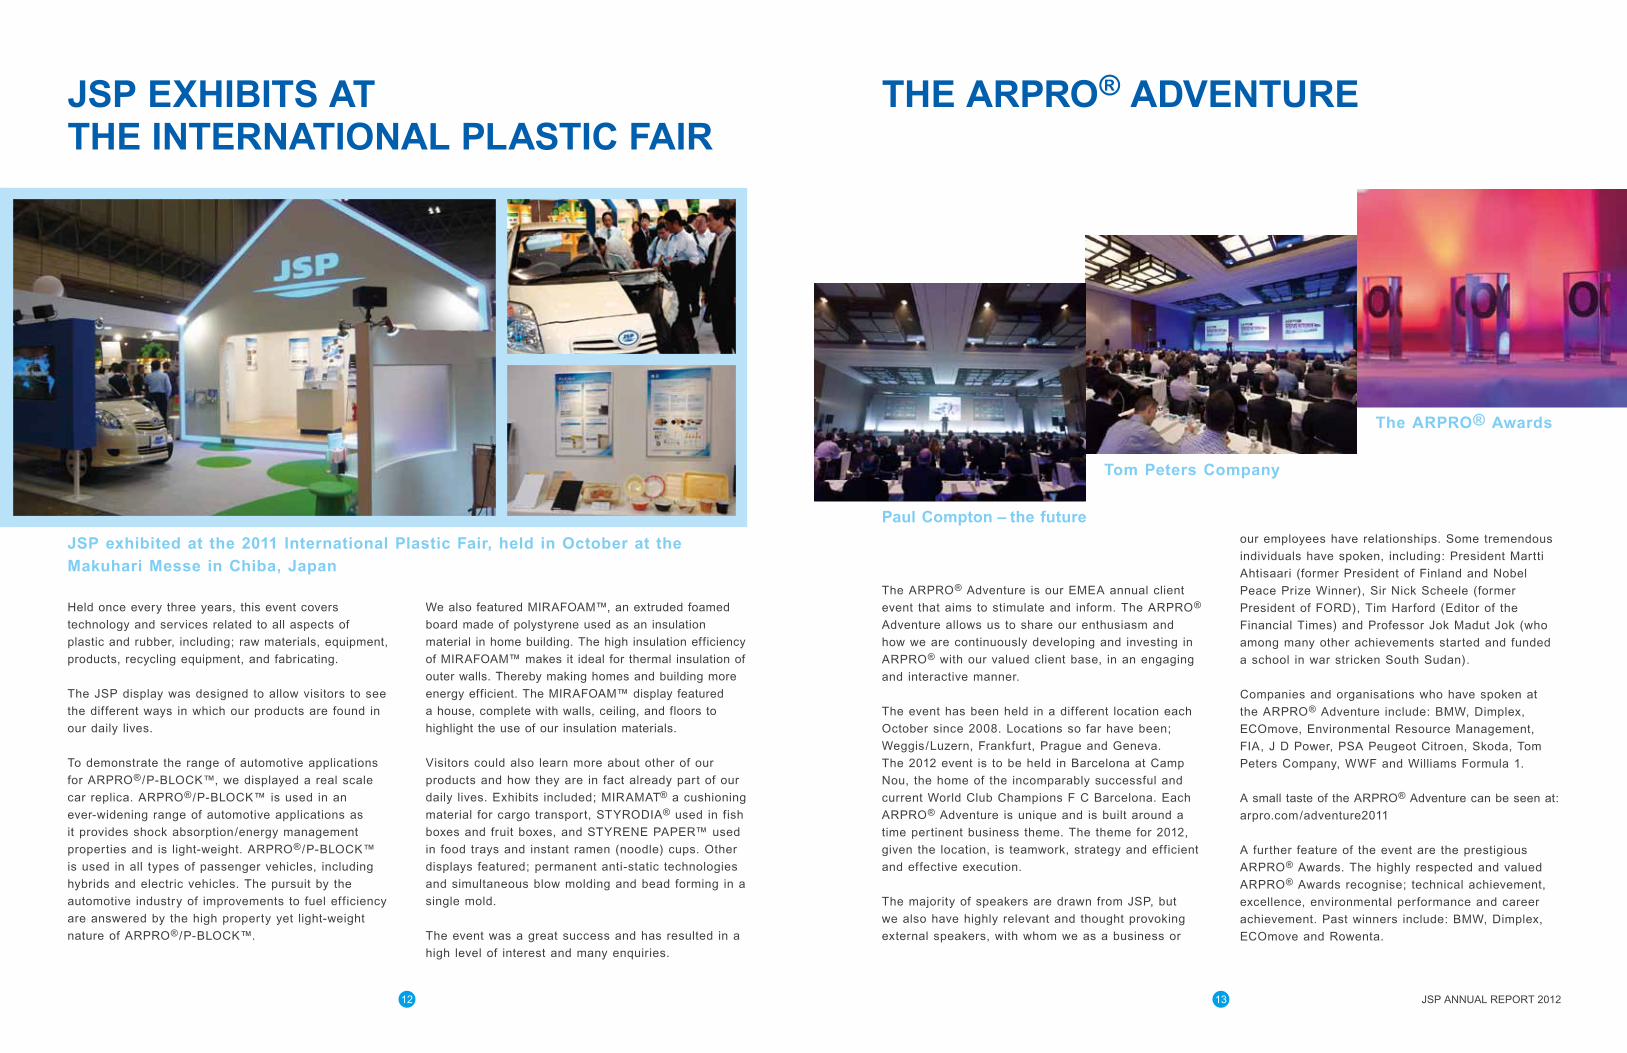
Held once every three years, this event covers
technology and services related to all aspects of
plastic and rubber, including; raw materials, equipment,
products, recycling equipment, and fabricating.
The JSP display was designed to allow visitors to see
the different ways in which our products are found in
our daily lives.
To demonstrate the range of automotive applications
for ARPRO®/P-BLOCK™, we displayed a real scale
car replica. ARPRO®/P-BLOCK™ is used in an
ever-widening range of automotive applications as
it provides shock absorption/energy management
properties and is light-weight. ARPRO®/P-BLOCK™
is used in all types of passenger vehicles, including
hybrids and electric vehicles. The pursuit by the
automotive industry of improvements to fuel efficiency
are answered by the high property yet light-weight
nature of ARPRO®/P-BLOCK™.
JSP exHIbITS AT THe INTeRNATIONAL PLASTIC FAIR
Tom Peters Company
We also featured MIRAFOAM™, an extruded foamed
board made of polystyrene used as an insulation
material in home building. The high insulation efficiency
of MIRAFOAM™ makes it ideal for thermal insulation of
outer walls. Thereby making homes and building more
energy efficient. The MIRAFOAM™ display featured
a house, complete with walls, ceiling, and floors to
highlight the use of our insulation materials.
Visitors could also learn more about other of our
products and how they are in fact already part of our
daily lives. Exhibits included; MIRAMAT® a cushioning
material for cargo transport, STYRODIA® used in fish
boxes and fruit boxes, and STYRENE PAPER™ used
in food trays and instant ramen (noodle) cups. Other
displays featured; permanent anti-static technologies
and simultaneous blow molding and bead forming in a
single mold.
The event was a great success and has resulted in a
high level of interest and many enquiries.
Paul Compton – the future
JSP exhibited at the 2011 International Plastic Fair, held in October at the Makuhari Messe in Chiba, Japan
our employees have relationships. Some tremendous
individuals have spoken, including: President Martti
Ahtisaari (former President of Finland and Nobel
Peace Prize Winner), Sir Nick Scheele (former
President of FORD), Tim Harford (Editor of the
Financial Times) and Professor Jok Madut Jok (who
among many other achievements started and funded
a school in war stricken South Sudan).
Companies and organisations who have spoken at
the ARPRO® Adventure include: BMW, Dimplex,
ECOmove, Environmental Resource Management,
FIA, J D Power, PSA Peugeot Citroen, Skoda, Tom
Peters Company, WWF and Williams Formula 1.
A small taste of the ARPRO® Adventure can be seen at:
arpro.com/adventure2011
A further feature of the event are the prestigious
ARPRO® Awards. The highly respected and valued
ARPRO® Awards recognise; technical achievement,
excellence, environmental performance and career
achievement. Past winners include: BMW, Dimplex,
ECOmove and Rowenta.
12 13 JSP ANNUAL REPORT 2012

BRAZIL
CHINA (WUXI)
JAPAN
MEXICO
TOKYO HEAD OFFICEHOKKAIDOKANUMAKASHIMAYOKKAICHIKANSAIKYUSHU
SINGAPORE
INDIA
TAIWAN
KOREA
CHINA (KUNSHAN)
CHINA (DONGGUAN)FRANCE
GERMANYCZECH REPUBLIC
USA(DETROIT)USA (BUTLER)USA
(JACKSON) USA (TULLAHOMA)
GLObAL NeTwORKCORPORATe GOveRNANCe
1 Basic Stance
We recognize that our basic mission as management
is to increase shareholder value in a sustainable
manner. Further, we understand the need to meet our
responsibilities to all of our stakeholders, including
employees, customers, consumers, the local citizens,
and the communities which we serve.
In light of this stance, we believe that proper
corporate governance represents an indispensable
part of our business. It is important for us as a
company to be consistent in our pursuit of efficiency,
transparency, and soundness in management, from
the election of corporate directors through the estab-
lishment of corporate compliance mechanisms.
2 Governance organizations
The board of directors deliberate and decide
important company business matters. The board and
the audit committee ensure business is performed in
an appropriate manner.
We also hold management meetings made up of
regular members who discuss important business.
We have adopted a system of executive officers to
ensure the efficient execution of our business. In this
way, we have established a system to assign both
authority over the execution of our business and
responsibility.
3 internal Controls, risk management
We have taken measures to institute appropriate
systems and structures for internal controls and risk
management. We have policies in compliance with
legal statutes, continually reviewing these systems
and revising as necessary.
We have established the risk management and
compliance committee chaired by the representative
director. This committee has responsibility for cross-
organizational monitoring and audit, taking the lead in
exercising risk and compliance management for JSP.
4 external audits
Our external and internal auditors assess legal
compliance and the validity of company operations
and assets. External and internal auditors have
dynamic exchange and coordination.
14 15 JSP ANNUAL REPORT 2012

RESULTS OF OPERATIONS
For the fiscal year ended March 31, 2012 (FY2011),
JSP Corporation and its consolidated subsidiaries
(“the Company”) recorded net sales of ¥93,397 million,
representing a 1.6% year-on-year increase. Consolidated
operating income amounted to ¥5,296 million, a 29.9%
year-on-year decrease, while ordinary income fell 29.7%
year-on-year, amounting to ¥5,536 million. Consolidated
net income amounted to ¥3,100 million, representing a
36.5% decrease compared to the prior fiscal year.
These results reflected both the economic situation in
Japan and for the world at large. While the economies in
Asia and other emerging markets experienced continued
growth, financial issues continued to disrupt the markets
in Europe, and instability in the Middle East and Northern
Africa resulted in soaring oil prices. In Japan, due to the
aftereffects of the Great East Japan Earthquake in March
2011, demand and production has reduced in industrial
sector. The strong valuation of the yen against other world
currencies led to lower exports and inevitable downward
economic pressure.
In the face of these challenges, JSP worked as a group
to improve our profit structure, building up our produc-
tion systems and focusing on selling high-value-added
products based on our proprietary technologies.
On a consolidated basis, the Company recorded extraordi-
nary income of ¥323 million, including ¥221 million related
to negative goodwill. Extraordinary losses amounted
to ¥682 million, which included ¥223 million in losses
attributable to the aftereffects of the Great East Japan
Earthquake in March 2011.
Total Sales
¥ 93,397million
5,2965,046
2,701
5,685
4,881
3,1002,589
1,366
3,209
2012
Sales Breakdown by Business Segment
(Millions of yen)
Operating Income
(Millions of yen)
Net Income
(Millions of yen)
Extrusion Business
Bead Business
Other Business
37.0%
56.6%
6.4%
3,000
2,000
1,000
0
4,000
5,000
6,000
1208 09 10 11
7,552
3,000
2,000
1,000
4,000
5,000
6,000
01208 09 10 11
7,000 7,000
8,000 8,000
FINANCIAL POSITION
As of March 31, 2012, total consolidated assets amounted
to ¥89,072 million, a ¥79 million decrease compared to
the end of the prior consolidated fiscal year. This decrease
was primarily due to a decrease of ¥1,018 million in current
assets, offset somewhat by a ¥938 million increase in
noncurrent assets.
Total consolidated liabilities amounted to ¥41,709 million,
which was a ¥960 million decrease compared to the
end of the prior consolidated fiscal year. The bulk of this
decrease was due to a ¥1,840 million decrease in current
liabilities partially offset by a ¥879 million in increased
noncurrent liabilities.
As a result, consolidated net assets amounted to a total
of ¥47,362 million as of the end of the consolidated fiscal
year, representing a 50.2% shareholders’ equity ratio, up
1.0% from the end of the prior consolidated fiscal year.
86,197
45,912
Total Assets/Total Net Assets
Shareholder’s Equity Ratio
Return on Equity
6,000
4,000
2,000
0
8,000
10,000
(Millions of yen)
Total Assets
Total Net Assets
1208 0 9 10 11
46,481
89,152 89,07294,993
84,316
48,05742,001
1208 0 9 10 110
30
20
10
40
50
60
49.2
50.247.0
47.1
50.1
(%) (%)
1208 0 9 10 110
4
2
6
8
10
12 11.2
7.05.9
3.2
7.7
47,36247,362
17 JSP ANNUAL REPORT 201216

CASH FLOWS
Consolidated cash and cash equivalents as of March
31, 2012 amounted to ¥5,976 million. This represented
a ¥4,511 million decrease in total cash and cash equiva-
lents compared to the end of the prior consolidated
fiscal year.
Net cash from operating activities amounted to
¥5,532 million, a ¥2,308 million year-on-year decrease.
This decrease was primarily due to ¥5,176 million in
net income before taxes and adjustments, depreciation
and amortization in the amount of ¥4,607 million, and
an increase in accounts payable-trade of ¥1,837 million.
These increases were offset by an increase of ¥2,739
million in accounts receivable-trade, and income tax
payments of ¥1,936 million.
Net cash used in investing activities amounted to
¥6,138 million, representing a year-on-year increase of
¥941 million. These funds were used primarily to acquire
noncurrent assets (¥6,006 million) and a net outlay of
cash for time deposits (¥614 million).
Net cash used in financing activities amounted to
¥3,602 million, an increase of ¥3,126 million compared
to the prior fiscal year. These funds were primarily used
to repay long-term loans (¥5,243 million) and short-term
loans (¥2,991 million), and to pay dividends (¥894 million).
These outlays were offset by cash inflows of ¥5,728 million
in new long-term loans.
3,209
4,688
Free Cash Flows
1208 09 10 11
3,000
4,000
5,000
6,000
7,000
8,000
0
-1,000
1,000
2,000
-606
1,148
7,167
2,643
-365
(Millions of yen)
Net Income/Depreciation and Amortization/Operating Cash Flows
7,840
5,532
7,512
6,129
11,283
Net Income
Depreciation and Amortization
Operating Cash Flows
4,5824,881
3,100
4,6075,069
2,589
1,366
4,950
1208 09 10 11
4,000
6,000
2,000
0
(Millions of yen)
10,000
8,000
12,000
Operating Cash Flows to Net Sales Ratio
(%)
1208 09 10 110
9
6
3
12
15
8.5
5.9
7.6
6.3
13.8
INDEPENDENT AUDITOR’S REPORT
We have audited the accompanying consoli-dated financial statements of JSP Corporation and its subsidiaries, which comprise the consolidated balance sheets as at March 31, 2012, and the consolidated statements of income, changes in net assets and cash flows for the year then ended, and a summary of significant accounting policies and other explanatory information.
Management’s Responsibility for the Consoli-dated Financial StatementsManagement is responsible for the preparation and fair presentation of these consolidated financial statements in accordance with accounting principles generally accepted in Japan, and for such internal control as man-agement determines is necessary to enable the preparation of consolidated financial statements that are free from material mis-statement, whether due to fraud or error.
Auditor’s ResponsibilityOur responsibility is to express an opinion on these consolidated financial statements based on our audit. We conducted our audit in accordance with auditing standards generally accepted in Japan. Those standards require that we plan and perform the audit to obtain reasonable assurance about whether the consolidated financial statements are free from material misstatement.
An audit involves performing procedures to obtain audit evidence about the amounts and disclosures in the consolidated financial state-ments. The procedures selected depend on
As the above is an English translation from the original auditor’s report (Yukashoken Hokokusho) filed with the Financial Services Agency for public disclosure pursuant to the Financial Instruments and Exchange Law, the Toho Audit Corporation’s signature has been omitted.
the auditor’s judgment, including the assess-ment of the risks of material misstatement of the consolidated financial statements, whether due to fraud or error. In making those risk assessments, the auditor considers internal control relevant to the entity’s preparation and fair presentation of the consolidated financial statements in order to design audit procedures that are appropriate in the circumstances, but not for the purpose of expressing an opinion on the effectiveness of the entity’s internal control. An audit also includes evaluating the appropriateness of accounting policies used and the reasonableness of accounting estimates made by management, as well as evaluating the overall presentation of the consolidated financial statements.
We believe that the audit evidence we have obtained is sufficient and appropriate to provide a basis for our audit opinion.
OpinionIn our opinion, the consolidated financial state-ments present fairly, in all material respects, the financial position of JSP Corporation and its subsidiaries as at March 31, 2012, and their financial performance and cash flows for the year then ended in accordance with account-ing principles generally accepted in Japan.
Toho Audit CorporationJune 22, 2012Tokyo, Japan
to the Board of Directors of JSp Corporation
18 19 JSP ANNUAL REPORT 2012

CONSOLIDATED STATEMENTS OF INCOMEJSP Corporation and Consolidated Subsidiaries
Years Ended March 31
Millions of yenThousands ofU.S. Dollars
2012 2011 2012Net sales ¥ 93,397 ¥ 91,971 $ 1,136,364Cost of sales 67,516 64,320 821,465 Gross profit 25,881 27,651 314,899Selling, general and administrative expenses
Selling expenses 6,735 6,498 81,954General and administrative expenses 13,849 13,600 168,506Total selling, general and administrative expenses 20,585 20,098 250,461
operating income 5,296 7,552 64,437Non-operating income
Interest income 245 166 2,991 Dividends income 20 85 244Rent income 53 61 647Foreign exchange gains 28 — 351Amortization of negative goodwill 120 120 1,467Equity in earnings of affiliates 15 — 186Other 249 327 3,040Total non-operating income 733 762 8,929
Non-operating expensesInterest expenses 240 236 2,921Foreign exchange losses — 95 — Equity in losses of affiliates — 11 — Other 253 97 3,090Total non-operating expenses 494 440 6,011
ordinary income 5,536 7,874 67,356extraordinary income
Gain on sales of noncurrent assets 17 6 211 Gain on sales of investment securities 0 257 6Reversal of allowance for doubtful accounts — 30 — Gain on negative goodwill 221 — 2,693Reversal of provision for loss on disaster 84 — 1,027Other — 74 — Total extraordinary income 323 369 3,938
extraordinary lossLoss on retirement of noncurrent assets 54 104 660Loss on sales of noncurrent assets 39 118 485Loss on sales of investment securities — 7 —Loss on valuation of investment securities 20 — 243Impairment loss 169 — 2,058Loss on valuation of inventories 9 — 120Provision for loss on business liquidation 166 — 2,020Loss on disaster 223 401 2,719Loss on support to subsidiaries and affiliates — 100 —Other — 41 —Total extraordinary losses 682 773 8,308
income before income taxes 5,176 7,470 62,986income taxes-current 1,470 2,296 17,896refund of income taxes for prior periods — (21) —income taxes-deferred 287 (63) 3,497total income taxes 1,758 2,211 21,394income before minority interests 3,418 5,258 41,592minority interests in income 318 376 3,870Net income ¥ 3,100 ¥ 4,881 $ 37,721
CONSOLIDATED BALANCE SHEETSJSP Corporation and Consolidated Subsidiaries
As of March 31
Millions of yenThousands ofU.S. Dollars
assets 2012 2011 2012
Current assets Cash and deposits ¥ 9,362 ¥ 13,474 $ 113,907
Notes and accounts receivable-trade 29,055 26,709 353,516
Short-term investment securities 0 0 1
Merchandise and finished goods 5,416 4,862 65,899
Work in process 680 598 8,282
Raw materials and supplies 3,398 2,868 41,343
Accounts receivable-other 572 710 6,960
Deferred tax assets 858 1,056 10,450
Other 1,011 1,025 12,308
Allowance for doubtful accounts (282) (214) (3,432)
Total current assets 50,073 51,091 609,237
Noncurrent assets Property, plant and equipment
Buildings and structures 28,065 27,650 341,472
Accumulated depreciation (16,837) (16,161) (204,856)
Accumulated impairment loss (69) — (848)
Buildings and structures, net 11,158 11,489 135,767
Machinery, equipment and vehicles 53,926 53,608 656,124
Accumulated depreciation (45,049) (44,343) (548,111)
Accumulated impairment loss (24) — (303)
Machinery, equipment and vehicles, net 8,852 9,265 107,708
Land 13,054 11,995 158,836
Lease assets 120 93 1,472
Accumulated depreciation (75) (54) (915)
Lease assets, net 45 38 557
Construction in progress 1,477 771 17,978
Other 8,198 8,000 99,747
Accumulated depreciation (7,634) (7,368) (92,890)
Accumulated impairment loss (2) — (32)
Other, net 560 632 6,824
Total Property, plant and equipment 35,150 34,194 427,672
Intangible assets 967 986 11,771
Investments and other assets
Investment securities 1,873 1,673 22,789
Long-term loans receivable 27 27 334
Deferred tax assets 221 253 2,692
Other 778 965 9,471
Allowance for doubtful accounts (19) (40) (231)
Total investments and other assets 2,881 2,880 35,056
Total noncurrent assets 38,999 38,060 474,500
Total assets ¥ 89,072 ¥ 89,152 $ 1,083,737
The accompanying notes are an integral part of these statements.
20 21 JSP ANNUAL REPORT 2012

Millions of yenThousands ofU.S. Dollars
liabilities 2012 2011 2012
Current liabilitiesNotes and accounts payable-trade ¥ 11,868 ¥ 10,210 $ 144,402
Short-term loans payable 6,122 9,200 74,493
Current portion of long-term loans payable 4,582 4,533 55,749
Lease obligations 36 34 445
Accounts payable-other 3,086 2,541 37,548
Income taxes payable 307 967 3,739
Accrued consumption taxes 111 306 1,355
Deferred tax liabilities 10 6 123
Provision for bonuses 1,168 1,326 14,211
Provision for loss on business liquidation 166 — 2,020
Provision for loss on disaster 32 340 399
Notes payable-facilities 87 59 1,065
Accounts payable-facilities 853 637 10,389
Other 1,634 1,743 19,891
Total current liabilities 30,068 31,908 365,836
Noncurrent liabilitiesLong-term loans payable 9,753 9,307 118,674
Lease obligations 49 41 597
Deferred tax liabilities 469 355 5,717
Provision for retirement benefits 714 508 8,691
Provision for directors' retirement benefits 152 130 1,857
Provision for corporate officers retirement benefits 27 12 328
Negative goodwill 120 241 1,467
Other 354 164 4,307
Total noncurrent liabilities 11,641 10,761 141,642
Total liabilities 41,709 42,670 507,479
Net assetsShareholders' equity
Capital stock 10,128 10,128 123,234
Capital surplus 13,405 13,405 163,103
Retained earnings 30,681 28,475 373,299
Treasury stock (1,371) (1,371) (16,692)
Total shareholders’ equity 52,843 50,638 642,945
Valuation and translation adjustments
Valuation difference on available-for-sale securities 148 11 1,803
Foreign currency translation adjustment (8,270) (6,805) (100,630)
Total valuation and translation adjustments (8,122) (6,794) (98,827)
Minority interests 2,641 2,638 32,139
Total net assets 47,362 46,481 576,258
Total liabilities and net assets ¥ 89,072 ¥ 89,152 $ 1,083,737
CONSOLIDATED STATEMENT OF CHANGES IN NET ASSETSJSP Corporation and Consolidated Subsidiaries
Years Ended March 31
Millions of yenThousands ofU.S. Dollars
2012 2011 2012
Shareholders' equity Capital stock
Balance, Beginning of Period ¥ 10,128 ¥ 10,128 $ 123,234
Changes of items during the period
Total changes of items during the period — — —
Balance, End of Period 10,128 10,128 123,234
Capital surplus
Balance, Beginning of Period 13,405 13,405 163,103
Changes of items during the period
Total changes of items during the period — — —
Balance, End of Period 13,405 13,405 163,103
Retained earnings
Balance, Beginning of Period 28,475 24,413 346,460
Changes of items during the period
Dividends from surplus (894) (819) (10,883)
Net income 3,100 4,881 37,721
Total changes of items during the period 2,205 4,061 26,838
Balance, End of Period 30,681 28,475 373,299
Treasury stock
Balance, Beginning of Period (1,371) (211) (16,688)
Changes of items during the period
Purchase of treasury stock (0) (1,159) (3)
Total changes of items during the period (0) (1,159) (3)
Balance, End of Period (1,371) (1,371) (16,692)
Total shareholders' equity
Balance, Beginning of Period 50,638 47,736 616,110
Changes of items during the period
Dividends from surplus (894) (819) (10,883)
Net income 3,100 4,881 37,721
Purchase of treasury stock (0) (1,159) (3)
Total changes of items during the period 2,205 2,901 26,835
Balance, End of Period ¥ 52,843 ¥ 50,638 $ 642,945
The accompanying notes are an integral part of these statements.
22 23 JSP ANNUAL REPORT 2012

Millions of yenThousands ofU.S. Dollars
2012 2011 2012
Valuation and translation adjustments Valuation difference on available-for-sale securities
Balance, Beginning of Period ¥ 11 ¥ 167 $ 137
Changes of items during the period
Net changes of items other than shareholders' equity 136 (155) 1,665
Total changes of items during the period 136 (155) 1,665
Balance, End of Period 148 11 1,803
Foreign currency translation adjustment
Balance, Beginning of Period (6,805) (4,682) (82,807)
Changes of items during the period
Net changes of items other than shareholders' equity (1,464) (2,123) (17,822)
Total changes of items during the period (1,464) (2,123) (17,822)
Balance, End of Period (8,270) (6,805) (100,630)
Total valuation and translation adjustments
Balance, Beginning of Period (6,794) (4,515) (82,670)
Changes of items during the period
Net changes of items other than shareholders' equity (1,327) (2,279) (16,156)
Total changes of items during the period (1,327) (2,279) (16,156)
Balance, End of Period (8,122) (6,794) (98,827)
minority interests Balance, Beginning of Period 2,638 2,691 32,097
Changes of items during the period
Net changes of items other than shareholders' equity 3 (52) 42
Total changes of items during the period 3 (52) 42
Balance, End of Period 2,641 2,638 32,139
Net assets Balance, Beginning of Period 46,481 45,912 565,537
Changes of items during the period
Dividends from surplus (894) (819) (10,883)
Net income 3,100 4,881 37,721
Purchase of treasury stock (0) (1,159) (3)
Net changes of items other than shareholders' equity (1,324) (2,332) (16,114)
Total changes of items during the period 881 569 10,720
Balance, End of Period ¥ 47,362 ¥ 46,481 $ 576,258
CONSOLIDATED STATEMENTS OF CASH FLOWSJSP Corporation and Consolidated Subsidiaries
Years Ended March 31
Millions of yenThousands ofU.S. Dollars
2012 2011 2012
Net cash provided by (used in) operating activitiesIncome before income taxes ¥ 5,176 ¥ 7,470 $ 62,986Depreciation and amortization 4,607 4,582 56,057Impairment loss 169 — 2,058Amortization of negative goodwill (120) (120) (1,467) Gain on negative goodwill (221) — (2,693) Increase (decrease) in allowance for doubtful accounts 54 (22) 664Increase (decrease) in provision for bonuses (150) 217 (1,835) Increase (decrease) in provision for retirement benefits 208 103 2,539Increase (decrease) in provision for directors' retirement benefits 36 (16) 441Loss (gain) on sales and retirement of noncurrent assets 76 217 933Loss (gain) on sales of investment securities (0) (250) (6) Loss (gain) on valuation of investment securities 20 — 243Interest and dividends income (265) (252) (3,236) Interest expenses 240 236 2,921Foreign exchange losses (gains) 19 (70) 235Equity in (earnings) losses of affiliates (15) 11 (186) Decrease (increase) in notes and accounts receivable-trade (2,739) (2,186) (33,327) Increase (decrease) in notes and accounts payable-trade 1,837 1,157 22,356Decrease (increase) in inventories (1,325) (659) (16,129) Increase (decrease) in accrued consumption taxes (240) (140) (2,925) Other, net 6 697 83Subtotal 7,373 10,976 89,715Interest and dividends income received 323 202 3,932Interest expenses paid (228) (241) (2,778) Income taxes paid (1,936) (3,097) (23,556) Net cash provided by (used in) operating activities 5,532 7,840 67,312
Net cash provided by (used in) investing activitiesPurchase of noncurrent assets (6,006) (3,368) (73,082) Proceeds from sales of noncurrent assets 385 47 4,686Payments for retirement of noncurrent assets (23) (19) (289) Purchase of investment securities (8) (9) (100) Proceeds from sales of investment securities 4 395 55Net decrease (increase) in time deposits (614) (409) (7,477) Purchase of stocks of subsidiaries and affiliates — (300) —Purchase of investments in subsidiaries resulting in change in scope of consolidation — (1,681) — Other, net 124 148 1,519Net cash provided by (used in) investing activities (6,138) (5,197) (74,687)
Net cash provided by (used in) financing activities Net increase (decrease) in short-term loans payable (2,991) 2,713 (36,391) Proceeds from long-term loans payable 5,728 3,800 69,695Repayment of long-term loans payable (5,243) (4,689) (63,802) Redemption of bonds — (162) —Purchase of treasury stock (0) (1,159) (3) Cash dividends paid (894) (819) (10,883) Cash dividends paid to minority shareholders (160) (122) (1,958) Other, net (40) (35) (487) Net cash provided by (used in) financing activities (3,602) (475) (43,830)
effect of exchange rate change on cash and cash equivalents (303) (748) (3,686) Net increase (decrease) in cash and cash equivalents (4,511) 1,418 (54,892) Cash and cash equivalents at beginning of period 10,487 9,069 127,603Cash and cash equivalents at end of period ¥ 5,976 ¥10,487 $ 72,710
The accompanying notes are an integral part of these statements.
24 25 JSP ANNUAL REPORT 2012
NOTES TO CONSOLIDATED FINANCIAL STATEMENTS
1. BaSiS oF preSeNtatioN oF CoNSoliDateD FiNaNCial StatemeNtS
The accompanying consolidated financial statements have
been prepared from the financial statements filed with
the Ministry of Finance as required by the Securities and
Exchange Law of Japan, in accordance with accounting
principles and practices generally accepted in Japan. The
accompanying consolidated financial statements include
the accounts of JSP Corporation (the “Company”), and
its domestic and foreign subsidiaries which are more than
50% owned. Significant intercompany balances and trans-
actions have been eliminated in consolidation. Investments
in affiliates more than 15% owned are accounted for under
the equity method of accounting.
In addition, the accompanying notes include certain
information which is not required under generally accepted
accounting principles and practices in Japan, but is
presented herein as additional information. The accom-
panying consolidated financial statements have also been
presented in U.S. dollars by translating all yen amounts for
the year ended March 31, 2012 using an exchange rate of
¥82.19 to U.S. $ 1.
2. SUmmarY oF SiGNiFiCaNt aCCoUNtiNG poliCieS
(a) Investment Securities
Domestic Consolidated Companies
Other Investment Securities
Securities for which market prices are available are stated
at fair market value of the quoted market price as of the
last day of the fiscal year. Valuation differences are directly
charged or credited to shareholders’ equity; the cost of
securities is calculated according to the moving average
method.
Securities for which market prices are not readily available
are stated at cost, as determined by the moving average
method.
Foreign Consolidated Companies
Marketable securities owned by foreign consolidated
companies are accounted for under International Financial
Reporting Standards or U.S. GAAP.
(b) Inventories
Domestic Consolidated Companies
Inventories owned by domestic consolidated companies
are stated mainly at cost according to the moving average
method (book value written down for inventories with
impaired profitability).
Foreign Consolidated Companies
Inventories owned by foreign consolidated companies are
stated mainly under first-in first-out accounting based on
the lower-of-cost-or-market method.
(c) depreciation and Amortization
Property, Plant, and equipment (excluding leased assets)
Buildings (excluding attached structures) acquired by
domestic consolidated companies prior to March 31,
1998 are depreciated according to the former declining
balance method under the Corporation Tax Law of Japan.
Buildings acquired between April 1, 1998 and March 31,
2007 are depreciated according to the former straight-
line method under the Corporation Tax Law of Japan.
Buildings acquired after April 1, 2007 are depreciated
according to the straight-line method under the Corpora-
tion Tax Law of Japan.
Tangible noncurrent assets (other than buildings) acquired
by domestic consolidated companies prior to March 31,
2007 are depreciated mainly according to the former
declining balance method under the Corporation Tax Law of
Japan. Assets acquired after April 1, 2007 are depreciated
mainly according to the declining balance method.
Useful lives and residual values are determined
according to standards prescribed by the Corporation
Tax Law of Japan.
Tangible noncurrent assets acquired by foreign con-
solidated companies are depreciated according to the
straight-line method.
Intangible Noncurrent Assets (excluding leased assets)
Intangible noncurrent assets acquired by domestic
consolidated companies are amortized according to the
straight-line method.
Useful lives and residual values are determined according to
standards prescribed by the Corporation Tax Law of Japan.
Software used for internal purposes is amortized according
to the straight-line method over the useful life for Company
purposes (five years).
Foreign consolidated companies amortize intangible non-
current assets according to the straight-line method.
Leased Assets
Assets subject to financing lease transactions entered
into by domestic consolidated companies in which asset
ownership is not transferred to the lessee are depreciated
according to the straight-line method. The lease term is
considered to be the useful life of the asset; residual value
is assumed to be zero.
Domestic consolidated companies will continue to account
for financing lease transactions in which the asset
ownership does not transfer to the lessee entered into
prior to March 31, 2008 in conformity with methods related
to normal lease transactions.
Assets subject to financing lease transactions entered
into by foreign consolidated companies are depreciated
according to International Financial Reporting Standards or
U.S. GAAP.
(d) Significant Allowances and Provisions
Allowance for doubtful Accounts
Domestic consolidated companies reserve against losses
due to uncollectible debt using actual loan loss ratios for
general receivables. For loans questionable as to collect-
ability and under claim of bankruptcy, domestic consoli-
dated companies reserve against uncollectible amounts
according to the likelihood of collectability in each case.
Foreign consolidated companies reserve against losses
due to uncollectible debt according to management’s
consideration of individual accounts.
Provision for bonuses
The Company and its consolidated companies reserve an
estimated amount of future payments for employee bonuses
based on a calculation of the exact amount to be payable
for the current consolidated fiscal year.
Provision for Loss on business Liquidation
Certain of the domestic consolidated companies has
recorded a provision for estimated losses in connection with
the liquidation of a Company business.
Provision for Loss on disaster
The Company and certain of its domestic consolidated
companies has recorded an estimated amount of expected
costs likely to be incurred during the next fiscal year in
removing and/or restoration expenses for assets damaged
in the northeastern Japan Earthquake of March 11, 2011.
Provision for employees’ Retirement benefits
Domestic consolidated companies reserve an estimated
amount for employee retirement benefits based on the
projected retirement benefit obligation and related pension
assets for the current consolidated fiscal year.
Prior service cost is charged to expense as it occurs
according to the straight-line method based on a certain
number of years (generally 14 years) representing the
average remaining years of employment.
Any actuarial differences are charged to the expense
accounts of the following consolidated fiscal year
according to the straight-line method based on a certain
number of years (generally 14 years) representing the
average remaining years of employment.
Foreign consolidated companies record reserves for
employee retirement benefits according to International
Financial Reporting Standards or U.S. GAAP.
Provision for directors’ Retirement benefits
The Company and certain of its domestic consolidated
subsidiaries reserve an amount for director retirement
benefits based on corporate bylaws. The amount reserved
is equivalent to the amount payable as of the end of the
current consolidated fiscal year.
Provision for Corporate Officers Retirement benefits
The Company reserves an amount for executive officer
retirement benefits based on corporate bylaws. The
amount reserved is equivalent to the amount payable as of
the end of the current consolidated fiscal year.
(e) Foreign Currency Translation
Domestic consolidated companies translate rights and
obligations denominated in foreign currency into Japanese
yen according to the spot rate as of the last day of the
consolidated fiscal period. Translation differences are
recorded as income or expense. Assets and liabilities
of foreign consolidated companies are translated into
Japanese yen according to the spot rate as of the last day
of the fiscal period of the subsidiary in question. Income
and expense accounts are translated into Japanese yen
26 27 JSP ANNUAL REPORT 2012

according to average rate during the period, and translation
differences are included in the foreign currency translation
adjustment and minority interests of the net assets section
of the consolidated balance sheet.
(f) Major Hedge Accounts
Hedge Accounting
Accounting for hedges using the deferred treatment.
However, special treatment is applied for interest rate
swaps meeting certain special conditions.
Hedge Methods and Transactions
Hedge Method: Interest rate swap transaction
Hedge Transactions: Interest rates on borrowings
Hedge Policy
Company policy is not to enter into speculative transac-
tions. Derivatives are used to reduce the risk of interest
rate fluctuations on debt, according to Company manage-
ment rules.
evaluation of Hedge effectiveness
Effectiveness is assessed by confirming whether there is a
high correlation among the rate fluctuation of the hedged
transaction, cash flows, and the hedge method in question.
(g) Amortization of Goodwill and Negative Goodwill
Goodwill is amortized over five years under the straight-
line method during the period in which said goodwill is
considered to provide benefits. Negative goodwill occurring
prior to March 31, 2010 is amortized over five years under
the straight-line method.
(h) Scope of Cash included in the Consolidated
Statement of Cash Flows
“Cash” stated in the consolidated cash statement of cash
flows includes cash on hand, demand deposits, and
other short-term investments that are highly liquid, easily
convertible to cash, are redeemable within three months of
acquisition, and are not subject to material risk of fluctua-
tion in value.
(i) Accounting for Consumption Taxes
Accounting for consumption taxes using the tax-exclusion
method.
3. SeCUritieSSecurities as of March 31, 2012
Millions of YenClassification Cost Book Value Change
Securities with Value on Consolidated Balance Sheet Greater than Acquisition Cost Stock 478 734 255Sub-total 478 734 255Securities with Value on Consolidated Balance Sheet Not Exceeding Acquisition CostStock 245 220 (25)Sub-total 245 220 (25)Total 724 954 230
(Notes)1: The market value for unlisted stocks (¥918 million on consolidated balance sheets) is extremely diff icult to
discern. Accordingly, such is not included in the table above.2: “Cost” in the table above reflects book value after recording impairment loss. The Company recognized
impairment losses for certain securities and recorded ¥20 million in loss on valuation of investment securi-ties during the consolidated fiscal year.
4. loNG-term loaNS paYaBleAmounts payable for fiscal years ending March 31.
Millions of Yen
2012 2013 2014 2015 2016 After 2016
Long-term loans payable 4,582 4,393 2,594 1,758 822 185
5. taX-eFFeCt aCCoUNtiNG
2012 Millions of Yen
Deferred tax assets Provision for Bonuses 381 Allowance for Doubtful Accounts 44 Depreciation 29 Accrued Enterprise Taxes and Accrued Business Office Taxes 34 Retirement Benefits, etc. 235 Provision for Directors’ Retirement Benefits 53 Provision for Corporate Officers Retirement Benefits 9 Loss on Valuation of Stocks of Affiliates 4 Loss on Valuation of Investment Securities 42 Loss on Valuation of Golf Club Memberships 19 Loss Carryforward 62 Valuation Differences on Assets Received in Merger 6 Other 430 Sub-total 1,353 Less: Valuation Allowances (77) Total Deferred Tax Assets 1,276
Deferred tax liabilities PPE, Insufficient Accelerated Depreciation 318 Unrealized Gains (Losses) on Marketable Securities, Net 91 Valuation Differences on Assets Received in Merger 94 Other 171 Total Deferred Tax Liabilities 676
Net Deferred Tax Assets 600
reconciliation of Differences between Statutory tax rate and effective income tax rate Normal Effective Statutory Tax Rate 40.7% (Adjustments) Entertainment and Other Non-Deductible Expenses 2.5% Dividends and Other Non-Taxable Income (0.6%) Per-Capita Taxation 0.7% Deduction for Foreign Taxes (0.4%) Special Deduction for R&D (2.2%) Gain in Equity in Affiliates (0.1%) Difference in Tax Rate on Income of Consolidated Subsidiaries (13.2%) Income Taxes for Prior Periods 0.9% Reversal of Deferred Tax Assets due to Amendments of the Corporate Tax Act 1.3% Valuation Allowances 2.9% Other 1.5% Actual Effective Tax Rate 34.0%
28 29 JSP ANNUAL REPORT 2012

6. emploYee retiremeNt BeNeFitSCurrent Consolidated Fiscal Year
1. Overview of Retirement Plan
Domestic consolidated companies have adopted a
defined benefit plan for employees. At the time of retire-
ment, employees may be given severance pay in some
circumstances.
2. defined benefit Plan (as of March 31, 2012)Millions of Yen
a. Projected Benefit Obligation (7,227)b. Plan Assets 4,742c. Sub-total (a + b) (2,484)d. Unrecognized Actuarial Differences 1,658e. Unrecognized Past Service Obligation 112f. Net Accrued Retirement Benefits Recognized in Consolidated Balance Sheets (c+d+e)
(714)
g. Prepaid Pension Cost —h. Provision for Retirement Benefits (f – g) (714)
(Note) Certain consolidated subsidiaries utilize the simplif ied method to calculate the projected benefit obligation.
3. Retirement benefit expenses (as of March 31, 2012)Millions of Yen
a. Service Cost 447b. Interest Cost 112c. Expected Return on Pension Assets (74)d. Recognized Actuarial Differences 165e. Amortization of Prior Service Cost 24f. Net Retirement Benefit Cost (a+b+c+d+e) 674
(Note) The net retirement benefit cost for consolidated subsidiaries adopting the simplif ied method is recorded as “a. Service Cost.”
4. basis of Projected benefit Obligation Calculation
a. Period Allocation Method for Projected Benefits Period Straight-Line Basisb. Discount Rate Primarily 1.7%c. Expected Return on Pension Assets Primarily 1.7%d. Years over which Past Service Cost is Amortized Primarily 14 years (Charged to expense using the straight-line method over the average remaining years of employee service.)
e. Years over which Actuarial Differences are Amortized Primarily 14 years (Charged to expense in the following consolidated fiscal year using the straight-line method over the average remaining years of employee service.)
Certain foreign consolidated companies have adopted
a defined contribution plan for employee retirement
benefits.
7. SeGmeNt iNFormatioN
1. Reporting Segments
Reporting segments are those segments comprising the
Company group for which separate financial information
can be obtained. The Company board of directors periodi-
cally reviews these segments to determine the allocation
of Company resources and to assess performance.
The Company has adopted a business division structure.
Each business division is responsible for comprehensive
strategy related to domestic and international products
3. Net Sales and Income (Loss) by Reporting Segment
Consolidated Fiscal Year (April 1, 2010 to March 31, 2011)
2011 Millions of YenReporting Segments Other
(Note 1)Total
Adjustment(Note 2)
Consolidated(Note 3)Extrusion Bead Sub Total
Net Sales External Customers 35,429 50,219 85,648 6,322 91,971 — 91,971 Intersegment Sales/Transfers 882 495 1,378 33 1,412 (1,412) —Total Net Sales 36,311 50,715 87,027 6,356 93,384 (1,412) 91,971 Segment Income (Loss) 3,090 4,556 7,647 7 7,654 (102) 7,552
(Notes)1: “Other” represents a classification for a business segment not included in reporting segments. This segment includes the manufacture and sale
of general packaging products. 2: The ¥102 million of Adjustment under Segment Loss consists of ¥103 million in companywide expenses not allocated to each reporting segment and
¥0 million in intersegment eliminations. The majority of these expenses are costs for research and development not attributable to either reporting segment.3: Segment Income (Loss) is adjusted with Operating Income on the Consolidated Statements of Income.
Consolidated Fiscal Year (April 1, 2011 to March 31, 2012)
2012 Millions of YenReporting Segments Other
(Note 1)Total
Adjustment(Note 2)
Consolidated(Note 3)Extrusion Bead Sub Total
Net Sales External Customers 34,585 52,869 87,454 5,942 93,397 — 93,397 Intersegment Sales/Transfers 829 447 1,276 56 1,333 (1,333) —Total Net Sales 35,415 53,316 88,731 5,999 94,730 (1,333) 93,397 Segment Income (Loss) 2,557 3,212 5,769 (214) 5,555 (259) 5,296
(Notes)1: “Other” represents a classification for a business segment not included in reporting segments. This segment includes the manufacture and sale
of general packaging products. 2: The ¥259 million of Adjustment under Segment Loss consists of ¥260 million in companywide expenses not allocated to each reporting segment and
¥1 million in intersegment eliminations. The majority of these expenses are costs for research and development not attributable to either reporting segment.3: Segment Income (Loss) is adjusted with Operating Income on the Consolidated Statements of Income.
handled therein, as well as for their business activities.
Accordingly, the business divisions are comprised of the
basic products making up that segment, and have been
classified into the Extrusion Business and Bead Business
reporting segments.
Extrusion foaming technology is the core of the Extrusion
Business, which manufactures and sells polystyrene,
polyethylene, and polypropylene sheets and boards. Bead
foaming technology is the basis of the Bead Business, which
manufactures and sells foamed polypropylene, foamed
polyethylene, and foamed polystyrene products, etc.
2. Calculation of Net Sales, Profit or Loss, Assets and
Other Items for Reporting Segments
The Company follows the provisions of “Summary of
Significant Accounting Policies” in accounting for reporting
business segments.
Inter-segment sales are based on transaction prices with
third parties.
4. Matters related to Changes in Reportable Segments
Beginning with the current consolidated fiscal year, the
Company has moved some products under the “Other”
segment to the “Bead” segment due to changes to the
Company’s organization.
Net sales and income (loss) by reporting segments
for the prior consolidated fiscal year (April 1, 2010 to
March 31, 2011) is based on new segment categorization.
30 31 JSP ANNUAL REPORT 2012

WORKING TOGETHER FOR A PROMISING FUTURE
Shares held Voting right Shareholders (thousands) ratio (%)
Mitsubishi Gas Chemical Company, Inc. 13,212 42.06
Japan Trustee Services Bank, Ltd. 2,190 6.97
The Master Trust Bank of Japan, Ltd. 1,565 4.98
JSP Client Stock Ownership Plan 1,081 3.44
JPMorgan Chase Bank, N.A. 575 1.83
JSP Employee Stock Ownership Plan 485 1.54
BBH LUX Fidelity Funds Japan Advantage 424 1.35
Trust & Custody Services Bank, Ltd. 311 0.99
Nippon Life Insurance Company 301 0.95
Head Office: Shin nisseki Bld., 4-2, 3-chome Marunouchi, Chiyoda-ku, Tokyo, 100-0005, Japan
President, Representative director: Kozo Tsukamoto
Founded: January 1962
Paid-in Capital: 10,128.610 Million Yen
Number of Shareholders: 16,826
Stock exchange Listing: Tokyo (First Section: 7942)
Fiscal Year-end: March 31
Investor Relations Contact: Investors Relations Department, Tel: +81-3-6212-6302
uRL: jsp.com
MAJOR SHAREHOLDERS (As of March 31, 2012)
CORPORATE DATA (As of March 31, 2012)
JSP Corporation
32

jsp.com
In so many ways, and in so many places,
JSP protects the things and
the people that are
most important
to you.