our report - mr price group...
TRANSCRIPT

ourreport ANNUAL
INTEGRATEDREPORTAPR 2013 - MAR 2014

PREVIOUS | CONTENTS | NEXT
contents
ANNUAL INTEGRATED REPORT 2
overviewScope & Boundary 032014 highlights 04Who We Are 05chairman’s report 06ceo’s report 08cfo’s report 10
Businessour Business Model 15our operations & footprint 16Stakeholder engagement 17
our People 20our corporate citizenship 24
Strategyour Strategy 28Key Performance indicators 34
BrandsDivisional reviews 35Divisional Performance indicators 47
Governancecorporate Governance report 48risk committee report 56Audit & compliance committee report 58internal Audit report 59Social, ethics, transformation &Sustainability committee report 61
remuneration report 63Board of Directors 75
financesAnnual financial Statements 77Administration, contact Details & Defi nitions 121

PREVIOUS | CONTENTS | NEXT
The independent external auditor also verifi ed the
information in the Remuneration Report on
page 63.
The South African Broad-Based Black Economic
Empowerment (B-BBEE) accreditation level has
been externally verifi ed by a SANAS accredited
organisation, BEESCORE (Pty) Ltd.
The Group’s Internal Audit Division has verifi ed the
disclosures contained in Our People Report (page
20) and Our Corporate Citizenship Report (page
24).
The Board is satisfi ed with the level of integrated
reporting, but recognises that it is premature to
subject the Annual Integrated Report to external
assurance at this point.
directors’ responsibilityThe Board acknowledges its responsibility to
ensure the integrity of the Annual Integrated Report.
The Board has applied its mind to the Annual
Integrated Report and confi rms that it addresses all
material matters, and presents fairly the integrated
performance and impact of the Group. The Annual
Integrated Report has been prepared in line with
best practice pursuant to the recommendations of
the King III Code (principle 9.1) and in accordance
with the International Integrated Reporting
Framework.
The Board authorised the Annual Integrated Report
for release on 27 May 2014.
about the reportThe Group is committed to integrating social, environmental and governance principles with fi nancial performance in accordance with the King Code of Governance for South Africa, 2009 (King III).
All matters that are considered to be material to the
business have been incorporated into this report.
Material matters have been identifi ed and prioritised
after taking into consideration:
• Items that are top of mind to the Board and
executive management
• Issues derived from key stakeholder
engagement
• Strategic objectives and key business risks
arising from the Group’s Strategic Planning
Framework
• Our business model and values
• External factors that impact on the Group’s
ability to create value in the short, medium and
long-term.
The International Integrated Reporting Framework
has also provided guidance on identifying issues
material to long-term sustainability.
This year we have printed and distributed an
abridged report to our shareholders with the full
Annual Integrated Report only being made available
online. Additional information pertaining to the
Group is available on our website
www.mrpricegroup.com.
scope and boundaryThis Annual Integrated Report, for the 52 week
period ended 29 March 2014, includes the fi nancial
results of Mr Price Group Limited trading in South
Africa, Botswana, Namibia, Lesotho, Swaziland,
Ghana and Nigeria as well as the income received
from franchise operations trading elsewhere in
Africa. The geographical footprint of our operations
is detailed on page 16.
The Annual Financial Statements have been
prepared on the historic cost and going concern
bases, and in accordance with International
Financial Reporting Standards (IFRS), the
requirements of the Companies Act of South Africa
(71 of 2008) and the JSE Listings Requirements.
The Group’s social investment is focused on South
African national priorities and the carbon footprint
incorporates only South African operations at this
point.
assuranceThe Group’s consolidated Annual Financial
Statements were audited by the independent
external auditor, Ernst & Young Inc. Their
unqualifi ed report can be found on page 80. SI Birdceo
MM Blaircfo
NG PaynechAirMAN
Scope &boundary
3SCOPE & BOUNDARY

PREVIOUS | CONTENTS | NEXT
4
highlights
20142014 HIGHLIGHTS
+ 22.6%
52.2%
+ 22.4%+ 21.1%+ 15.2%+ 125.1%
R2.3 bn
revenue
new channels (online) & markets (West Africa)
operating profit
diluted headline earnings per share
return on equity
cash resources
dividends per share
20
40
60
80
100
120
140
160
100
200
300
400
500
600
700
800
1986
1988
1990
1992
1994
1996
1998
2000
2002
2004
2006
2008
2010
2012
2014
Sha
re p
rice
(R)
HE
PS
and
DP
S (c
)
l l l
COMPOUND ANNUAL GROWTH RATE
Headline Earnings Per Share Dividends Per Share Share Price
HEPS DPS SP28 years 23.4% 25.2% 27.1%10 years 24.0% 30.0% 34.7%5 years 24.9% 29.4% 45.1%

PREVIOUS | CONTENTS | NEXTPREVIOUS | CONTENTS | NEXT
To add value to our customers’ lives and worth to our partners’ lives, whilst caring for the communities and the environments in which we operate.
ourvalues
ourpurposeourvisionTo become a top performing international, omni-channel retailer.
PASSION • VALUE • PARTNERSHIPThese are the 3 key values upon which the Group has been built. They are the foundation stones of the business and never change. By staying true to PASSION, VALUE and PARTNERSHIP, we ensure that we are building a sustainable business as we progress towards our vision and fulfi lling our dreams for our partners – our Mr Price family.
PASSION is our engine. This means ordinary people doing extraordinary things. It is the positive attitude and enthusiasm of all our associates who approach each day bright-eyed, smiling and projecting a positive image – believing that work is fun.
VALUE is the heart of our business. Our success has been, and will continue to be, built on our ability to add value to our customers’ lives. But it is more than just price. It’s about quality, fashion, being in stock of the wanted item and delighting our customers by doing more than what is expected.
PARTNERSHIP Mutual respect is integral to the ethos of the Group. We therefore refer to our co-workers as “associates” and, once they own shares or share options, they are referred to as “partners”. Partnership is sharing the ownership and success of the Company with all our associates and fostering solid and long-term partnerships with our suppliers. Without our customers, we don’t have a business and they are one of our most valued partners. We partner with our community by investing in strategic initiatives that improve the lives of those who are less fortunate, particularly children and youth.
whoweare Targeting younger customers in the mid to
upper LSM categories
retail predominantly own branded merchandise +80% of sales are for cash
1 079 stores and online channels offering full product assortments
28-year cAGr in hePS and dividends +20% Market capitalisation of R39 billion, ranked
42nd on JSe
included in MSCI Emerging Markets Index 50% of shares held by international investors
(uSA 23%, uK 13%)
3rd in Financial Mail Top Companies 2013and 6th in Sunday times top 100 companies
Finalist in World Retail Awards ‘emerging Market retailer of the Year’ 2013
A high growth, omni-channel, fashion value retailer:
WHO WE ARE 5
p
pv

Another year of pleasing operational and fi nancial performance
chairman’sreportNigel PaynechAirMAN
On behalf of the Board, I am privileged to report to
our people, customers, suppliers, shareholders and
to all other stakeholders. Another year of pleasing
operational and fi nancial performance is reported
on by our CEO, Stuart Bird and CFO, Mark Blair.
The Annual Integrated Report contains a wealth of
information about our DNA and values, our vision
to become a top performing international omni-
channel retailer, our strategy to get there and the
related risks we are embracing and mitigating.
When read together with our previous Annual
Integrated Reports, it is clear that, not only have
our intentions remained the same with a well
defi ned strategic plan to guide our journey, but we
have largely implemented the things we said we
would. We continue this phase of our journey with
the same conviction we had when we embarked
upon it, but now with even greater assurance that
the path we have chosen is the correct one, and
that we will attain the goals we pursue.
The Annual Integrated Report also details how
we govern the Group, appoint and evaluate the
Board, deploy the skills of our Directors in various
Board Committees, align the remuneration of the
executives to the achievement of earnings targets
and strategic milestones, and ensure that we
invest appropriately for the future. I believe that
these structures, processes and outcomes remain
appropriate. I again thank Lead Independent
Director, Bobby Johnston, for shouldering much
of the corporate governance responsibilities, most
of which takes place outside the boardroom. This
allows me to focus on ensuring that the Board’s
role in relation to strategy and risk management is
appropriate, and that most of the Board’s meeting
time is devoted to these issues.
CHAIRMAN’S REPORTPREVIOUS | CONTENTS | NEXT
6

PREVIOUS | CONTENTS | NEXT
7
as to continuously recycle our working capital
and avoid the various traps related to credit
and debt. Increasing innovation in our business
model, coupled with ongoing investment in
our merchandising, supply chain, logistics and
information technology backbones, are aimed
at achieving our targeted rates of sales and
profi t growth for many years to come. This is
notwithstanding any short-term impact of having
to invest ahead of such growth.
The Board has devoted a signifi cant amount of its
time to ensuring that we remain true to our values,
with an appropriate strategy and the best possible
leadership team to implement it. Our recruitment,
development and reward mechanisms are all
tailored to this end. I believe that our remuneration
policies and practices, are well conceived, have
been fairly and consistently applied, and serve the
best interests of the Company in the short, medium
and long-term. Refer to the Remuneration Report
on page 63 for more details.
No company can survive apart from the society
in which it operates. We thus continue to
passionately drive our many corporate social
investment initiatives via RedCap Foundation, in
conjunction with other funders who have chosen
the Foundation as a custodian for their CSI
investments. We are very proud to be working in
partnership with you.
I believe that the Board and each individual Director
have functioned effectively during the year, have
made a valuable contribution to the Group, and
have earned their Directors’ fees. The culture in the
boardroom is robust, based upon transparency
and mutual respect, but with signifi cant space for
challenge and independent thinking, and with no
tolerance for sloth or mediocrity. Particular thanks
are due to the Chairmen of our Board Committees
for their ongoing commitment to excellence.
I am thoroughly enjoying my role as Chairman, with
such passionate and talented people, a special
business model built upon a robust value system,
and a world of opportunities awaiting us. Thank you
to our Mr Price people, our shareholders and other
stakeholders for your engagement with the Board
and with me during the year. We appreciate being
entrusted with the leadership and governance of
your Company into its exciting future.
CHAIRMAN’S REPORT
Our Mr Price people have again demonstrated
how much can be achieved by a committed
team, with a common purpose, in an energised
environment. This report, and our 28-year history of
earnings growth, is a celebration of our people, and
evidence of the power of an effective team. Well
done and thank you to our leaders and to every
member of the Mr Price family.
The global and South African economies are
currently not stable, predictable or safe. Turbulent
times are to the advantage of those who are alert,
lean, disciplined and prepared. The fact that the
vast majority of our management and staff have an
ownership stake in the Company equips us better
than most to tackle more challenging times.
Securing sustainable economic growth requires
countries to make tough choices to avoid
populism, take bold action to implement structural
reforms, deregulate labour and product markets,
remove tariff barriers to employment and trade,
increase transparency and competitiveness,
and remove disincentives to hard work and
entrepreneurship.
The retail industry is in the early phases of a
number of disruptive trends, including the
integration of online with other channels to market,
fast fashion and the globalisation of customers
and suppliers. We have made it our business to
be one of the disruptors, with much of our efforts
over the past few years being devoted to these
opportunities. Even as societies in some advanced
economies are ageing rapidly, there are millions of
emerging consumers aspiring to own fashionable
goods, available where they live and at prices
they can afford - ideal Mr Price customers. Our
opportunities for growth are exciting, and are not
based upon chasing diminishing marginal returns.
Our value focus remains on offering our
merchandise at prices that people can afford, at
the leading edge of fashion, so they will be desired,
and on an overwhelmingly cash sales basis, so
Our opportunities for growth are exciting, and are not based upon chasing diminishing marginal returns.nigel payne, chairman
PREVIOUS | CONTENTS | NEXT
8CHIEF EXECUTIVE OFFICER’S REPORT
Stuart Birdchief executive officer
ceo’sreport
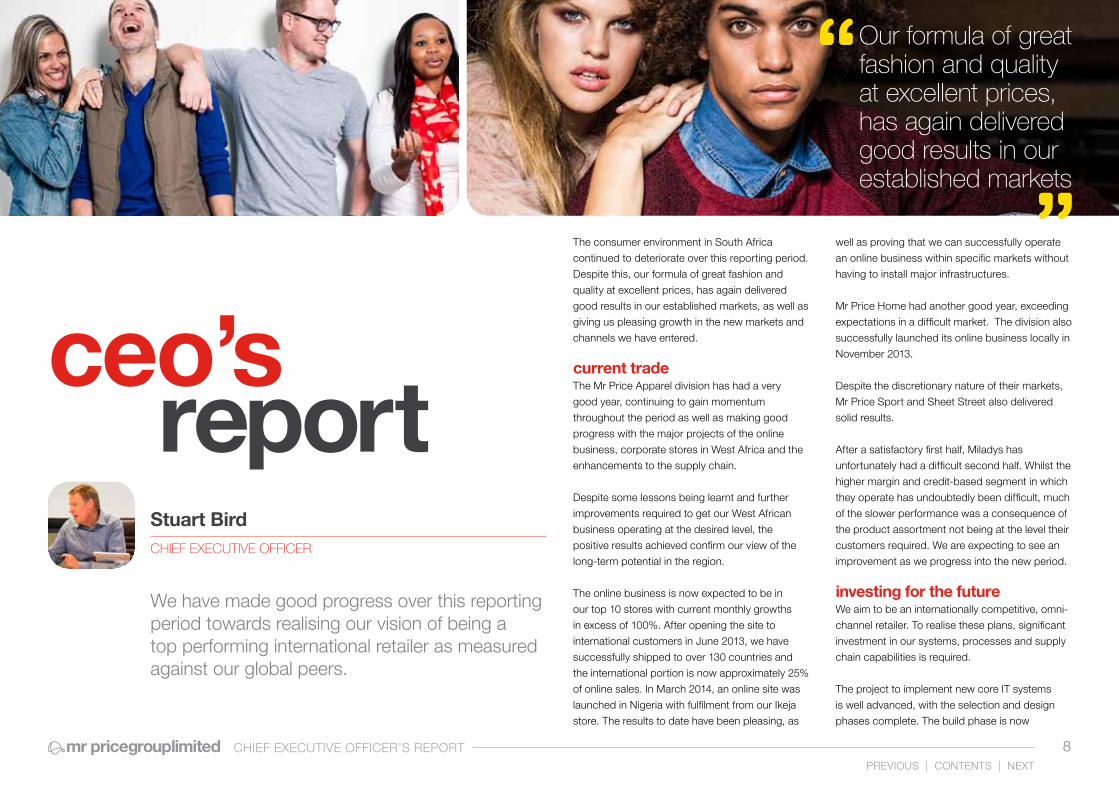
We have made good progress over this reporting period towards realising our vision of being a top performing international retailer as measured against our global peers.
our formula of great fashion and quality at excellent prices, has again delivered good results in our established markets
The consumer environment in South Africa
continued to deteriorate over this reporting period.
Despite this, our formula of great fashion and
quality at excellent prices, has again delivered
good results in our established markets, as well as
giving us pleasing growth in the new markets and
channels we have entered.
current tradeThe Mr Price Apparel division has had a very
good year, continuing to gain momentum
throughout the period as well as making good
progress with the major projects of the online
business, corporate stores in West Africa and the
enhancements to the supply chain.
Despite some lessons being learnt and further
improvements required to get our West African
business operating at the desired level, the
positive results achieved confirm our view of the
long-term potential in the region.
The online business is now expected to be in
our top 10 stores with current monthly growths
in excess of 100%. After opening the site to
international customers in June 2013, we have
successfully shipped to over 130 countries and
the international portion is now approximately 25%
of online sales. In March 2014, an online site was
launched in Nigeria with fulfilment from our Ikeja
store. The results to date have been pleasing, as
well as proving that we can successfully operate
an online business within specific markets without
having to install major infrastructures.
Mr Price Home had another good year, exceeding
expectations in a difficult market. The division also
successfully launched its online business locally in
November 2013.
Despite the discretionary nature of their markets,
Mr Price Sport and Sheet Street also delivered
solid results.
After a satisfactory first half, Miladys has
unfortunately had a difficult second half. Whilst the
higher margin and credit-based segment in which
they operate has undoubtedly been difficult, much
of the slower performance was a consequence of
the product assortment not being at the level their
customers required. We are expecting to see an
improvement as we progress into the new period.
investing for the futureWe aim to be an internationally competitive, omni-
channel retailer. To realise these plans, significant
investment in our systems, processes and supply
chain capabilities is required.
The project to implement new core IT systems
is well advanced, with the selection and design
phases complete. The build phase is now

CHIEF EXECUTIVE OFFICER’S REPORT
underway, with the first division, Mr Price Sport,
expected to “go live” in April 2015, followed by the
Mr Price Apparel division, with their target to be
operational before peak trade in December 2015.
The plans to have our new distribution centre
operational by August 2015 were unfortunately
disrupted by the final municipal zoning approval
not being obtained, despite the municipality
having indicated during the entire process that
approval would be given. Fortunately, contingency
plans were in place for such an eventuality and
no disruptions are expected, particularly over
the forthcoming peak periods. A new site that
the municipality is in favour of has since been
sourced, for which zoning approval is now
awaited. Completion date is now expected to be
August 2016.
the Mr Price way
Our achievements, both past and in the future, are and will be as a consequence of our people and the culture we have in the business, no matter where we operate. We see both our people and our culture as precious assets that require constant care, attention and investment. To this end, our associates have attended over 28 800 courses, aimed at personal development and to instil
our culture of Passion, Value and Partnership.
We strongly subscribe to transformation and have
made good progress towards our employment
equity targets and improved our B-BEEE status
from a level 6 to a level 5 contributor. We remain
of the view that, for our transformation strategy to
be meaningful and sustainable, there is no quick
fix. Our approach is to consistently invest in and
develop people both within our Group and in
related businesses outside the Group to grow and
transition them meaningfully.
The Group has always been committed to
investing in the communities in which it operates,
not only through employment, but also through
positively impacting the lives of children and
youth through RedCap Foundation’s national
imperatives. In August 2013, RedCap Foundation’s
JumpStart Manufacturing Programme was
launched. This is a partnership between Mr Price
Apparel, Miladys, RedCap Foundation and 5
selected strategic suppliers, to develop the skills
in the local clothing and footwear manufacturing
sector, including quick response as a key strategy
to build a sustainable supply chain. The Group’s
local commitment was rewarded when the
Department of Trade and Industry (dti) approved
both cluster applications aimed at strengthening
the competitiveness of the South African Clothing,
Footwear and Textile Industry.
The Group joined the Ethical Trading Initiative as
a Foundation Stage Member during the year as
well as the Supplier Ethical Data Exchange. Social
responsibility and a deeper understanding of our
supply chain are critical to a sustainable business
that creates value over the short, medium and
long-term.
as we look aheadThe challenging economic and consumer
environment is expected to continue for the
foreseeable future, particularly in our current major
market of South Africa.
Nonetheless, by continuing to deliver on our
formula of great fashion and quality at excellent
prices and continuing to build our capacity to
further execute this formula, I am confident that
we will satisfy our customers in both current and
new markets and deliver positive future results.
In closing, I would like to thank all our wonderful
associates across the Group, who have not only
played their role in delighting our customers and
consequently delivering the results that we have
achieved, but also for making this such a special
place to work.
PREVIOUS | CONTENTS | NEXT
9

PREVIOUS | CONTENTS | NEXT
10CHIEF FINANCIAL OFFICER’S REPORT
cfo’sreport
Mark Blairchief fiNANciAL officer
highlights % change
Revenue R15 892m +15.2%
Gross profi t margin 42.0% 0.0%
Profi t from operating activities R2 537m +22.6%
Group operating margin 16.7% +1.1%
Headline earnings per share 765.1c +20.5%
Diluted headline earnings per share 715.1c +22.4%
Dividends per share - annual 482.0c +21.1%
- fi nal 314.0c +18.5%
Cash resources R2 252m +95.9%
Return on shareholders’ equity 52.2% +1.1%
economic and retail environment The challenging retail environment that we experienced last year has
continued into the current reporting period. Although all retailers have
previously benefi tted from the tailwinds driven by credit extension
and strong real wage growth, these have now slowed. Consumers,
particularly those in the lower income groups, are being fi nancially
stretched and will avoid or postpone spending where possible,
especially on big ticket durable items. In such circumstances our
positioning, being a value retailer targeting customers mainly in the mid
to upper LSM categories, is a distinct advantage.
change in accounting policies and disclosuresThe Group adopted IFRS 10 in the current year, which impacted the
accounting for its 100% interest in the equity shares of the Financial
Services cell captives. As a result of no longer meeting the
requirements for consolidation, IFRS 4 has been applied to account for
the cell captives as reinsurance contracts. Full disclosure of the impact
on the income statement and fi nancial position is provided in the
Annual Financial Statements. The prior year’s reported earnings were
restated, reducing by an immaterial amount of R2.8 million.
Airtime sales have been reclassifi ed in the current and prior period into
other income and cost of sales, whereas previously the net income
was included in ‘other income’. This was a disclosure change only and
had no impact on profi t.
fi nancial performanceTotal Group revenue increased by 15.2% to R15.9 billion primarily
due to increases in:
• retail sales of 14.8% (comparable 10.6%) to R15.2 billion
• fi nancial services income growth of 27.8% to R582.5 million.
PREVIOUS | CONTENTS | NEXT
10

PREVIOUS | CONTENTS | NEXT
11
Growth in our new channels delivered encouraging results:
• Online sales were up by 293.4%
• International sales increased by 37.6% and now account for 7.3% of Group retail sales.
In the key West African markets of Nigeria and Ghana, sales were up by 98.2%.
We are delighted that the Group has produced a strong set of results on the back of a good performance in
the prior year, despite:
• the challenging retail environment
• incurring costs that will position the Group to realise its long-term growth goals
• a planned curtailment of credit sales growth, which increased by only 9.6% compared to cash sales
which were up 16.1%.
Retail sales for the Group reflected growth of 14.8% highlighting the appeal of our merchandise offer. The
Group’s South African retail sales increased by 13.4% compared with the total retail sector which grew by
6.9%.
Retail selling price (RSP) inflation was 9.7%, which comprised input price inflation of 5.3% and product mix
inflation of 4.4%. Unit sales were up by 4.9% to 216.9 million.
Trading space continued to expand, with 68 new stores being opened and 18 non-performing stores being
closed. At year end there were 1 079 corporate-owned and 23 franchise stores. Gross space added in the
form of new stores and expansions represents an increase of 4.8% over the prior year. After store closures
and space reductions, weighted average trading space increased by 3.4%.
Financial Services delivered a strong performance despite tightening credit limits and limiting new account
growth. Revenues increased by growing insurance premium income by 38.1%, airtime sales by 41.7% and
debtors’ interest and fees by 19.2%.
The Apparel chains retail sales and other income increased by 17.0% to R11.4 billion with comparable
sales up by 11.9%. Retail selling price inflation was 9.3% and 157.0 million units were sold. Mr Price Apparel
opened 24 new stores and recorded sales growth of 18.9% (comparable 13.0%) to R8.6 billion. The
division’s excellent second half performance significantly outperformed the market, with comparable sales
increasing by 15.3%. In contrast, Miladys had a disappointing second half which had the effect of reducing
annual sales growth to 7.0% (comparable 7.2%) to R1.4 billion. Mr Price Sport recorded sales growth of
14.2% (comparable 6.5%) to R962.4 million.
The Home chains increased retail sales and other income by 10.2% to R4.3 billion with comparable
sales up by 7.3%. Retail selling price inflation was 10.9% and 59.8 million units were sold. Mr Price Home
increased sales by 10.5% (comparable 8.2%) to R2.9 billion and Sheet Street by 8.9% (comparable 5.4%) to
R1.3 billion.
costs and expensesThe gross profit margin remained in line with last year at 42.0% (after adjusting for the reclassification of
airtime sales and related costs discussed earlier), while the merchandise gross profit percentage in both
periods was 42.2%.
Selling expenses increased by 11.9% and constituted 22.0% of retail sales compared with 22.6% in the
prior year. Significant factors driving this expense growth were an increase in net bad debt, store rentals (as a
consequence of performance-based turnover rental clauses and weighted average space growth), increased
computer licence fees relating to the new human capital management and e-commerce systems, and staff
costs, which rose in line with salary inflation and space growth. Higher performance-based store incentives
were paid.
CHIEF FINANCIAL OFFICER’S REPORT
% s
ales
gro
wth
Q1 Q2 Q3 Q4
18%
6%
12%
MPC Total SA retail sales Retailers in textiles, clothing and footwear
Source: Stats SA
10.1
%
7.5% 11
.3%
16.5
%
6.3% 10
.2%
12.9
%
6.4% 10
.1%
13.4
%
7.6% 11
.0%
Segmental analysis
Retail sales and other income
16 000
12 000
8 000
R’m
4 0001 957
H1 H2 Annual
+11.2%
Apparel Home
5 161 6 252
2 333
11 413
4 290
+16.4% +17.4%
+9.4%
+17.0%
+10.2%
27.3%
72.7%

PREVIOUS | CONTENTS | NEXT
12
Administrative expenses increased by 10.3% and comprised 6.8% of retail sales, an improvement on last
year’s 7.0%. Staff costs relating to building online and merchandise trending teams, higher incentives paid as
a result of divisional and Group performance and a reduction in foreign exchange gains were the signifi cant
movements.
The effective taxation rate for the year was 28.2%, higher than the prior year (27.8%) primarily due to a
capital gains tax release in the base period.
operating profi tGroup operating profi t increased by 22.6% and the operating margin increased from 15.6% to 16.7% of
retail sales.
The Apparel chains’ operating profi t grew by 21.7% toR2.1 billion and the operating margin increased from 18.3% to 19.1% of retail sales. The Home chains’ operating profi t rose by 20.2% to R590.6 million and the operating margin increased from 12.9% to 14.0% of retail sales.
earnings and dividendsper shareThe number of shares in issue at year end
increased by 2.0 million due to the decreased
number of treasury shares held. Treasury shares
sold (4 649 937 shares) as a result of share options
vesting exceeded treasury share purchases during
the year (2 649 714 shares at an average cost of
R137.70 per share totaling R364.9 million).
Headline earnings per share increased by 20.5%
to 765.1 cents. The dilution impact has reduced
from 50.6 cents last year to 50.0 cents this year
as a result of the increase in the weighted average
share price for the year (R139.41) being more
than offset by the reduced number of shares and
options outstanding. Accordingly, diluted headline
earnings per share increased by 22.4%. The Group
is pleased to have performed in line with its long-
term performance, which is a 28-year CAGR in
HEPS of 23.4%.
The annual dividend payout ratio has risen from
62.7% to 63.0%, resulting in a dividend of 482.0
cents per share, an increase of 21.1%, marginally
higher than the increase in HEPS of 20.5%. The
fi nal dividend to be paid in June 2014 will be 314.0
cents per share, an increase of 18.5%, which is
lower than the increase in the interim dividend and
2nd half HEPS growth due to the closer alignment
of interim and annual dividend payout ratios. In the
current year, the interim payout ratio was increased
from 52.5% to 55.1%. Dividend withholding tax of
15.0% will be applicable to shareholders who are
not exempt.
The return on equity of 52.2% and the return
on net worth (RONW) of 47.6% are the highest
achieved to date, and over the last 5 years. The
latter has been driven mainly by an increased net
profi t margin as follows: 2014 2009
Net profi t margin % 12.3 7.2
Asset turn times 2.3 2.6
Return on assets % 28.3 18.7
Leverage times 1.7 1.9
RONW % 47.6 34.9
CHIEF FINANCIAL OFFICER’S REPORT
Segmental analysis
Apparel Home
H1
Operating profi t
1 000
2 000
3 000
R’m
H2
1 237
364
+23.7%
+16.3%
Annual
2 102
591
+21.7%
+20.2%
+18.9%
+27.0%
865
226
21.9%
78.1%

PREVIOUS | CONTENTS | NEXT
13
financial positionAdditions to property, plant and equipment
for the year amounted to R253 million, of which
furniture, fittings, equipment and vehicles
constituted 83% and computer equipment 13%.
Disposals totaling R30 million related primarily
to the sale of a retail property. The depreciation
charge for the year was R162.2 million.
Intangible asset additions amounted to
R151 million and related primarily to e-commerce
and ERP systems. The amortisation charge for the
year amounted to R29.1 million.
Gross inventories were well managed, increasing
by 12.3% relative to a 14.8% increase in retail sales
and Group stock turn increased from 6.4 to 6.8
times.
Trade and other receivables increased by
10.6% to R1.7 billion. Prepayments decreased
from the prior period, while gross trade receivables
increased by 13.1% to R1.8 billion. Despite the
net bad debt increasing from 6.5% to 7.6% of the
debtors’ book, external benchmarking has reflected
the Group’s book to be one of the best performing
in the industry. Since December 2013, an improved
ageing profile of the Group’s debtors has been
encouraging. However, until such time that the
economic conditions detailed in the outlook
Equity attributable to shareholders has increased by R613 million to R3.9 billion.
The movement is made up as follows (R’m):
Opening balance 3 309
Total comprehensive income for the year 1 880
Treasury share transactions (247)
The purchase of treasury shares to partially cover options granted (365)
The net credit on vesting of options 77
Taxation relating to grants from the Company to share trusts 41
Recognition of share-based payments 75
Dividends to shareholders (1 094)
Non-controlling interests (1)
Closing balance 3 922
Long-term lease obligations comprise the long-term portion of straight line lease liabilities.
Trade and other payables increased by 56.1% to R2 billion. Trade payables grew by 74.9% to R1.2 billion
(2013: R673.3 million) as a result of the timing of creditor payments referred to above. Accruals and other
payables increased by 34.8% to R804.2 million mainly as a result of stock in transit, increased incentive
accruals and higher turnover rentals due.
section below show signs of improvement, and
the improvement in ageing profiles of the Group’s
trade receivables are considered sustainable, the
provision for impairment, currently at 9.8%, will
continue to be conservatively set.
Cash balances ended the year at R2.3 billion,
which was impacted by substantial trade creditor
payments being made after the year end cut-
off date. After creditor and SARS payments
in the subsequent week, cash balances were
approximately R1.5 billion. Cash sales remained
high at 80.8% of total sales. The Group seeks to
strike a balance between:
• maintaining a strong balance sheet by having
adequate cash resources to fund the working
capital and capital expenditure requirements to
maintain and expand its operations, without the
need to incur debt
• hedging its obligations to participants in the
various share schemes. An ongoing repurchase
programme is in place that spreads the
purchase of shares over an extended period
and limits the percentage of daily trade to
ensure that there is no impact on the share
price. During the year treasury shares to the
value of R364.9 million were purchased and the
hedged ratio at year end was 65.2%
• returning funds to shareholders in the form of
dividends.
CHIEF FINANCIAL OFFICER’S REPORT

PREVIOUS | CONTENTS | NEXTPREVIOUS | CONTENTS | NEXT
14
outlookThe country is in a rising interest rate cycle,
although this is not expected to be as extreme as
previous cycles. The impact of currency weakness
has found its way into the broader economy,
increasing infl ation, which now exceeds the
Reserve Bank’s targeted range and affects the cost
of living of all South Africans.
The Group’s target customers are mainly in the
mid to upper LSM categories, who have to date
been less affected by the constraints mentioned
above. If infl ation rises further and interest rates
increase materially this situation could change. In
the short-term, consumers will need to address
the economic challenges facing them by spending
wisely and reducing debt. We aim to ease their
plight, and ensure that all areas of our business,
including those which can be described as
‘discretionary buys’ or are exposed to lower
income customers, receive our intense focus.
Detailed plans are in place to protect and entrench
the foundations upon which the business has been
built – selling fashionable merchandise at incredible
value for cash.
However, cycles are temporary and the Group
has many reasons to have an optimistic long-term
view. Locally, we plan to capitalise on changing
market conditions and continue with our approach
of requiring quality growth. This includes a cautious
approach to credit, being selective in new space
acquired and constantly challenging all aspects
for improved processes and effi ciencies. The
Group has high expectations of the performance
of its South African operations and is confi dent of
achieving further market share gains.
The performance of our new channels and
markets, being online and West Africa are very
encouraging, providing early support for our
intentions of taking our proven business concepts
to new territories, rather than look for acquisitive
growth. We have much work to do to realise the full
potential of the brand beyond our borders and will
approach this sensibly on a research and test basis
prior to committing to substantial expansion.
We are prepared tactically for a tough year ahead but, at the same time, our sights are set on a long-term growth strategy that will do homage to our 28-year earnings growth history. By achieving these goals we hope to reward investors, improve the lives of our associates and positively contribute to society.
CHIEF FINANCIAL OFFICER’S REPORT

15PREVIOUS | CONTENTS | NEXT
value is at the very core of the Group’s existence...
our businessmodel
1value
fashion+
quality+
price
THIS LEVEL OF CASH ENSURES THAT THE GROUP IS:• Less impacted by the cyclical nature of retail
• Not dependent on releasing more credit into the market to drive turnover, particularly during poor economic times
• Less exposed to bad debt
• Able to fund future growth without gearing. Strong cash fl ows will support increased capital expenditure and maintain an appropriate dividend pay-out ratio.
MAINTAINING A LOW OVERHEAD STRUCTURE IS IMPERATIVE TO DELIVERING ACCEPTABLE OPERATING MARGINS:• Best price for quality and fashion offered
• Being a value retailer means lower mark-ups in order to offer ‘everyday low prices’. This results in large order quantities and higher sales volumes that keep input prices low
• The Company seeks to balance this with incurring costs often ahead of revenue generation, which will support future growth2
THIS IS HOW WE SATISFY OUR CUSTOMERS’ NEEDS FOR FASHION: • Fashion research, specialist trend teams and frequent international travel
• Active dialogues through digital and social media
• Responding to customers’ changing fashion needs
• Thorough product testing before making large merchandise commitments
• Slow selling merchandise is cleared to make way for new fresh merchandise
fashion Fashionable merchandise at everyday low prices.
15OUR BUSINESS MODEL
3cashRemaining a cash-driven retailer with a cash sale contribution of 80% of total sales.

PREVIOUS | CONTENTS | NEXT
our operations& footprint
2Total Stores
Ghana
23Total Stores
Franchise
Total Stores1 014South Africa
Total Stores4Nigeria
4Total Stores
Lesotho
29Total Stores
Namibia
16OUR OPERATIONS & FOOTPRINT
404 Mr Price Apparel Stores 158 Mr Price
Home Stores
Average store size 632m2
Total trading area 255 380m2
Average store size 813m2
Total trading area 49 578m2
Average store size 318m2
Total trading area 60 748m2
191Miladys Stores 1 079 Total
Stores
Average store size 883m2
Total trading area 139 452m2
Average store size 187m2
Total trading area 49 584m2
61Mr Price Sport Stores 265 Sheet
StreetStores
Total trading area 554 742m2
19Total Stores
Botswana
369 Mr Price Apparel148 Mr Price Home60 Mr Price Sport
253 Sheet Street184 Miladys
7Total Stores
Swaziland 2 Mr Price Apparel1 Mr Price Home2 Sheet Street2 Miladys
16 Mr Price Apparel4 Mr Price Home1 Mr Price Sport5 Sheet Street3 Miladys
2 Mr Price Apparel1 Mr Price Home1 Sheet Street
4 Mr Price Apparel
1 Mr Price Apparel1 Mr Price Home
8 Kenya2 Mauritius3 Mozambique2 Rwanda2 Tanzania1 Uganda5 Zambia
10 Mr Price Apparel3 Mr Price Home4 Sheet Street2 Miladys

17PREVIOUS | CONTENTS | NEXT
17STAKEHOLDER ENGAGEMENT
An analysis of the business from a strategic
and operational perspective highlighted where
particular external parties currently have an
interest in the organisation or may have an interest
in the future.
Key stakeholders were then mapped and
prioritised as those individuals, groups of
individuals or organisations who affect and/or
could be affected by the Group’s activities,
products, services and performance of the Group.
Each key stakeholder group has a business
stakeholder
owner who is the individual in the Group primarily
accountable for managing the relationship with the
particular stakeholder or stakeholder group.
The tables that follow provide information on the
Group’s key stakeholders. Although we have not
listed the communities in which we operate and
certain government departments with whom we
have a relationship, it is important to note that
the Group acts in a responsible and compliant
manner towards these stakeholders.
engagementThe Group recognises the importance of engaging with its stakeholders to ensure the long-term sustainability of the business. This process ensures greater transparency, as key stakeholder issues are identified and response plans developed.

18PREVIOUS | CONTENTS | NEXT
18STAKEHOLDER ENGAGEMENT
shareholders and the investment community customers
Why they are important to us Shareholders are the owners of the Company and requireinformation about its performance and business strategy.
The investment community assists shareholders to understandthe value of the Company.
To better understand needs so that we may provide the wanted product and service; to understand brand perceptions so that we may grow long-term loyalty with our brand by relevant targeted customer communication.Our customers thrive on engagement - the more we connect and engage, the more social capital we build and the more we are a part of their decisions as a brand in the fashion value space. Ultimately, top of mind brands translate into increased market share.
What we engage on(key themes / issues identified)
• Company performance• Retail market trends and issues• Dividend policy• Share price performance• Share schemes• Business strategy• Future prospects
• The common engagement themes and issues are related to product, delivery and payment followed by store experience, staff and environment
• Brand perception and expectations• Fashion trends• Customer service levels• Product and quality feedback• Community support and fundraising through RedCap Foundation• e-Commerce technical assistance, orders and queries• Account queries and payment
How we engage • Annual General Meetings• Results announcements and presentations to the Investment
Analysts Society and roadshows to the UK and USA• SENS announcements• Trading updates• Group website• Annual Integrated Report• Annual Results booklet• Press releases
• In-store interaction• Traditional and digital media• Telephone, email and various social media platforms• Live chat feedback on our e-commerce sites• Affiliate publisher partners in foreign markets, these local market affiliates feedback
weekly via email any successes or challenges faced in their local market• Inbound and outbound call centres• Customer and market surveys• Advertising campaigns and competitions• Customer panel surveys• Mystery shopper programme
Engagement frequency • Throughout the year with increased engagement during the release of the interim and year-end results
• Daily in-store, customer care engagement, social media channels and online• Weekly and bi-weekly through e-mailers and customer/market research• Monthly communication across various channels
How we measure our engagement
• Responses by shareholders to resolutions voted on at the Annual General Meeting
• Feedback from the Investment Analysts Society• Share price
• Call centre service levels• Campaign response rate• Social media reporting• In-store sell offs • Data collection to continue engagement• Customer feedback

19PREVIOUS | CONTENTS | NEXT
19
associates and partners (our people) suppliers
Why they are important to us Our associates are our most valuable asset and brand ambassadors as their efforts and activities drive our profitability and the effectiveness of our customer engagement.
To enhance associates’ sense of value, commitment and motivation; to align associates to the Group strategy; and to receive feedback on areas for workplace and performance improvement.
Suppliers are key to our performance and core to our strategic positioning.
What we engage on(key themes / issues identified)
• Vision and values • Business Code of Conduct• Group policies and guidelines• Company financial performance • Individual and team performance• Remuneration, benefits and incentives• Transformation and employment equity• People development and training• Wellness programmes• Health and safety • Culture survey issues
• Supplier performance• Order quantities, factory capacities, product cost and quality• Future growth and expectations of the Group• Supplier core competencies• Future trends in product and sourcing opportunities • DC requirements• Quick Response• Supplier Ethical Data Exchange (SEDEX)• RedCap Foundation Manufacturing Programme (Skills development)• National textile and apparel cluster• Regional Footwear cluster interaction• B-BBEE Compliance
How we engage • Induction programmes• Training needs• Performance reviews and fireside chats• Career planning discussions• Culture and climate surveys• Internal media – Red Cap Radio and TV• Team meetings • Results presentations• Divisional events, including awards events• Whistleblowers’ hotline
• Supplier days• Regular supplier meetings• Supplier performance reviews • Strategic partnerships• Quality audits• Ethical and social audits• Distribution Centre (DC) tours• Factory visits and tours• Whistleblowers’ hotline
Engagement frequency • On joining, through “Your Journey” induction programme• Communication sessions throughout the year• Internal TV broadcasts (fortnightly)• Company results communicated (bi-annually)• Fireside chats and performance reviews (bi-annually)• Incentives set, aligned to business strategies (annually)• Training plans compiled (annually)• Cost-to-company letters distributed to all associates, including updated
share option information (annually)• Divisional and Group succession plans reviewed (annually)• Culture survey conducted (annually)
• Supplier opening meetings and tours• Ad-hoc meetings on topical issues• Continuous quality audits• Weekly or fortnightly current trade meetings• Bi-annual/seasonal performance reviews• Annual ethical and social audits (1st tier suppliers) • Annual supplier days
How we measure our engagement
• Culture and climate survey results• Solutions Café’s following Culture Survey• Feedback from fireside chats/performance reviews• Employment Equity Committee Evaluation• Whistleblower complaints and compliments• Turnover statistics• Exit interviews
• Integrated Supplier Grading Tool • Performance to Strategic Agreements – capacity, performance, flexibility to trade• Performance to Service Level Agreements• Supplier audit results
STAKEHOLDER ENGAGEMENT

20PREVIOUS | CONTENTS | NEXT
OUR PEOPLE
our
capacity buildingThe past year was characterised by considerable
investment in human capacity in line with the
upgrading and renewal of processes, systems,
technologies and ways of working across the
Group. A number of new roles were established
creating valuable new skills that improve the
Group’s competitive advantage. Most of these
positions were fi lled internally indicating excellent
progress in providing career opportunities for our
associates.
In the year ahead we will continue to look for
people who are adaptive, enjoy working in a fast-
paced, progressive and changing environment and
who thrive on high performance.
associate engagementInspired by our core values of Passion, Value and
Partnership, our energetic and entrepreneurial culture
continues to be central to the Company’s successful
performance. We have paid close attention to
our culture during this period of high growth and
organisational change by striving to understand the
climate within our working environments. This has
been achieved through our annual independently
The Group strives to be a sought-after international company of employment choice by offering leading career opportunities in fashion value retailing.
conducted culture and climate survey, followed
by sessions designed to listen to the needs of
associates, while protecting our core values.
In line with our culture, we ensure that
communication is ongoing through frequently held
“Comm Times”, regular internal TV broadcasts and
social media platforms. Close working relationships
between managers and associates are valued
and, to allow associates to participate proactively
in this relationship, employee self service and
interactive learning management systems have
been introduced. These will provide associates with
direct access to information relating to personal
performance and management of their careers,
thereby improving the quality of discussions with their
managers.
The Group benefi cially impacts the lives of
associates, their families and the communities in
which they live through RedCap Foundation. We also
reach into communities through our talent attraction
and acquisition teams, ensuring that young people
are engaged at an early stage of their careers and
gain insight into the many employment opportunities
available in our Group.

21PREVIOUS | CONTENTS | NEXT
performance recognitionand rewardOur Group thrives on happy, motivated employees.
A very important element of our culture is to
actively encourage, recognise and reward
exceptional performance and the achievement
of personal goals. Well-defi ned incentive targets
are set annually, with performance discussions
conducted at year-end or as required through the
year. The result is generous fi nancial incentives
for outstanding performance. All associates within
the SADC region are invited to participate in the
Mr Price Group share or share option schemes.
This after fulfi lling the specifi c employment tenure
requirements of that scheme as detailed on the
Group’s website. As these employees are part-
owners in the Company, we refer to them as
partners or associates. Further details are contained
in the Remuneration Report on page 63 and on the
Group’s website.
We use every opportunity to celebrate team or
personal achievements and reinforce the spirit
of performance. Group results are presented to
associates bi-annually at communication sessions
and, more frequently, divisional performance is
discussed in the respective divisions. A highlight
is the award of the Mr Price Group ‘Running Man’
statue, presented to selected associates who
have made extraordinary contributions over an
extended period. These highly valued individuals
embody the Group’s culture and core beliefs and
demonstrate consistently high dedication and
performance. Additionally, the Mr Price Group
medallion is awarded to associates who have
delivered outstanding performance or exceptional
innovation through the year. These individuals set
new standards and become role models for those
who follow. In this way we are able to maintain a
working culture that encourages people to succeed
and drives them towards their personal aspirations.
21
human capital management (hcm) systemsThe continuous transformation of our human capital
management capabilities to world-class standards
has included investment in leading edge workforce
management, learning management and payroll
systems. These enable us to better manage and
develop our people, supporting our objective to
differentiate the Group as an employer of choice.
Intended benefi ts are higher levels of productivity
and cost effi ciency as well as improved HCM
transactional effi ciency in support of our business
expansion plans.
We have also planned for a Business Intelligence
solution that will enable our business leaders to
make better-informed and predictive HCM decisions,
particularly relating to building people capacity
ahead of strategic requirements. All associates will
be offered access to employee self service and
learning management platforms with readily available
personal information. This will engender a modern
culture of performance accountability through direct
ownership of career planning and development. The
roll-out of these platforms will continue to be a focus
in the new fi nancial year.
talent acquisition and development
Attracting the right skills externally has become
increasingly important in the high growth
environment. We frequently conduct fun, exciting
and creative campaigns to profi le our employment
proposition, either to potential associates through
our social networking platform or through direct
involvement with schools, colleges and universities.
Systems to administer and hold application data
allow proactive management of these talent pools.
Our talent acquisition teams are constantly striving
to improve our induction processes to cater for the
increasing geographic spread of associates. On
joining, new associates attend induction programmes
introducing their job specifi c requirements and we
use this opportunity to introduce the core values
and the benefi ts of belonging to an exciting working
environment.
Turnover at senior management and executive levels
is low, indicating the Group’s ability to retain key staff.
Store associate turnover for this fi nancial year was
20.1%, substantially below comparative industry
norms of 30.9%. Our stringent pre-employment
assessments for store and key positions which
include numeracy and behavioural attributes, ensure
that the required levels of skill are maintained. The
introduction of psychometric assessments has also
proved highly effective in screening of key skills at the
point of hiring.
career and personal development
In the last 2 years many new career opportunities
have been created such as in Digital Marketing,
e-Commerce, ERP Systems, Business Process
Improvement, Product Development, Resourcing,
Supply Chain, International, Governance and Legal.
Personal growth and career development are
discussed with each associate at least annually
and line managers are responsible for ensuring
that these discussions give rise to meaningful
development plans. Assessments have been
increasingly used to inform career paths, training,
development and improved performance, with
competency profi ling being core to their effective
application.
OUR PEOPLE
Developing ‘homegrown’ talent is a strategy that has served the Group extremely well to date and will continue to be our core area of focus.
We offer outstanding career opportunities and associates are actively encouraged to pursue their ambitions within the Group.
22PREVIOUS | CONTENTS | NEXT
22
management andleadership developmentGiven the hands-on nature of retail, managers
are encouraged to take direct ownership for their
areas of responsibility and to use the programmes
provided to build their own entrepreneurial
leadership style. We have continued to partner with
leading training organizations and business schools,
locally and internationally, to design and run creative
leadership development programmes. We favour
flexibility in the design of these programmes to cater
for unique peer group needs within the demands of
their busy day-to-day working environments.
The successful Emerging Leaders Development
Programme has enriched our succession plans
with entry-level leaders who display high potential
for future leadership positions. A Leadership
Series is planned for the forthcoming year. This
will focus on individuals in positions of influence
who are candidates for growth into higher levels of
leadership, as well as incumbent senior executives
with specific developmental requirements relating
to the demands of their positions and/or strategic
priorities.
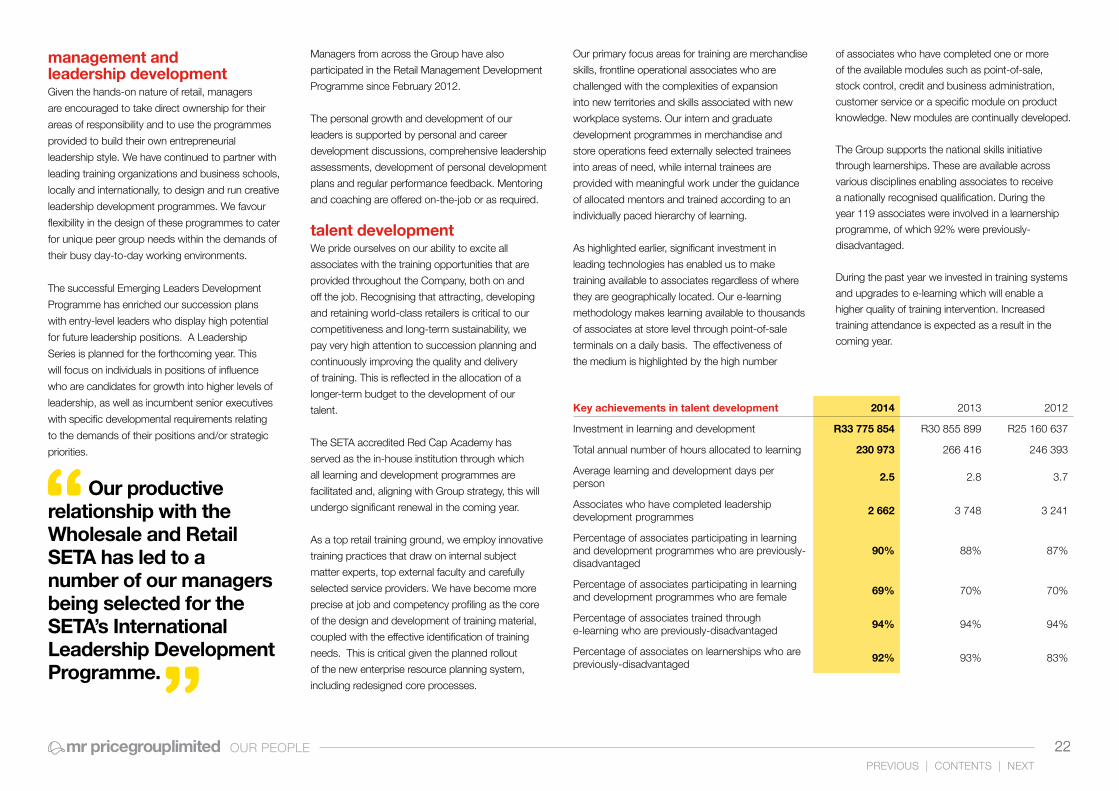
Our productive relationship with the Wholesale and Retail SETA has led to a number of our managers being selected for the SETA’s International Leadership Development Programme.
Managers from across the Group have also
participated in the Retail Management Development
Programme since February 2012.
The personal growth and development of our
leaders is supported by personal and career
development discussions, comprehensive leadership
assessments, development of personal development
plans and regular performance feedback. Mentoring
and coaching are offered on-the-job or as required.
talent developmentWe pride ourselves on our ability to excite all
associates with the training opportunities that are
provided throughout the Company, both on and
off the job. Recognising that attracting, developing
and retaining world-class retailers is critical to our
competitiveness and long-term sustainability, we
pay very high attention to succession planning and
continuously improving the quality and delivery
of training. This is reflected in the allocation of a
longer-term budget to the development of our
talent.
The SETA accredited Red Cap Academy has
served as the in-house institution through which
all learning and development programmes are
facilitated and, aligning with Group strategy, this will
undergo significant renewal in the coming year.
As a top retail training ground, we employ innovative
training practices that draw on internal subject
matter experts, top external faculty and carefully
selected service providers. We have become more
precise at job and competency profiling as the core
of the design and development of training material,
coupled with the effective identification of training
needs. This is critical given the planned rollout
of the new enterprise resource planning system,
including redesigned core processes.
Our primary focus areas for training are merchandise
skills, frontline operational associates who are
challenged with the complexities of expansion
into new territories and skills associated with new
workplace systems. Our intern and graduate
development programmes in merchandise and
store operations feed externally selected trainees
into areas of need, while internal trainees are
provided with meaningful work under the guidance
of allocated mentors and trained according to an
individually paced hierarchy of learning.
As highlighted earlier, significant investment in
leading technologies has enabled us to make
training available to associates regardless of where
they are geographically located. Our e-learning
methodology makes learning available to thousands
of associates at store level through point-of-sale
terminals on a daily basis. The effectiveness of
the medium is highlighted by the high number
Key achievements in talent development 2014 2013 2012
Investment in learning and development R33 775 854 R30 855 899 R25 160 637
Total annual number of hours allocated to learning 230 973 266 416 246 393
Average learning and development days per person
2.5 2.8 3.7
Associates who have completed leadership development programmes
2 662 3 748 3 241
Percentage of associates participating in learning and development programmes who are previously-disadvantaged
90% 88% 87%
Percentage of associates participating in learningand development programmes who are female
69% 70% 70%
Percentage of associates trained through e-learning who are previously-disadvantaged
94% 94% 94%
Percentage of associates on learnerships who are previously-disadvantaged
92% 93% 83%
of associates who have completed one or more
of the available modules such as point-of-sale,
stock control, credit and business administration,
customer service or a specific module on product
knowledge. New modules are continually developed.
The Group supports the national skills initiative
through learnerships. These are available across
various disciplines enabling associates to receive
a nationally recognised qualification. During the
year 119 associates were involved in a learnership
programme, of which 92% were previously-
disadvantaged.
During the past year we invested in training systems
and upgrades to e-learning which will enable a
higher quality of training intervention. Increased
training attendance is expected as a result in the
coming year.
OUR PEOPLE
23PREVIOUS | CONTENTS | NEXT
23
employee relationsMaintaining sound working relationships is of utmost
importance to us, hence one-on-one relationships
between managers and associates and open
communication channels are encouraged. Frequent
communication sessions are held to update
all associates on business progress, celebrate
achievements and introduce new associates.
General employee communication is conducted
through Red Cap TV with informative broadcasts
delivered twice monthly via intranet or point-of-sale
technologies. A Social Media policy is in place to
provide guidelines for new and innovative ways of
communicating internally using social networking
technologies.
employment legislationThe Group complies with all relevant legislation
including the Labour Relations Act, the Basic
Conditions of Employment Act, the Sectoral
Determination Act No. 9, the Skills Development
Levy Act, the Skills Development Act, the
Employment Equity Act, the Unemployment
Insurance Fund Act and the Occupational Health
and Safety Act. Line management is supported by
well-trained employee relations practitioners who
guide the interpretation and application of legislation
in the workplace.
There have been significant changes to national
employment legislation during the past year,
including changes to the Basic Conditions of
Employment Act, Employment Equity Act and
Employment Services Act (effective dates are
not determined at time of this report). Changes
contained in the Labour Relations Amendment
Bill and the Employment Equity Regulations were
subject to negotiation at the time of this report. The
process regarding the proposed amendments to
the Unemployment Insurance Bill and the newly
proposed Women Empowerment and Gender
Equality Bill are being monitored.
The Group has taken positive steps to transform
contractual relationships with all employees through
conversion of non-permanent employee contracts
to permanent. This aligns with the requirements
of future national employment legislation and in
particular the principle of “equal pay for work of
equal value”.
We have commenced implementation of our
responses to the major impact areas of the
Labour Relations Act and the Basic Conditions of
Employment Act and are responding proactively
to proposed changes to the Employment Equity
Regulations. This ensures that the Group is
compliant with national employment legislation.
We have maintained active membership of
the National Retail Association, through which
representation to Nedlac and participation in
discussions of national interest is facilitated. This
has assisted us to stay abreast of labour law
developments and plan our responses accordingly.
ethical behaviourEnsuring that ethical behaviour is widely practiced
and demonstrated is very important to the
sustainability of our Group culture. As such the
Business Code of Conduct is acknowledged by
each new associate when joining the Group. Senior
and other selected associates complete an annual
declaration in which compliance with the Code is
confirmed and any external interests or relationships
that could potentially give rise to a conflict of
interest are disclosed. The Group has a confidential,
independently managed, toll-free number for
the reporting of suspected fraudulent activity or
unacceptable behaviour. Associates are encouraged
to be alert to fraud or unacceptable activity and
immediately report incidents. These reports are
investigated by Internal Audit. The Social, Ethics,
Transformation and Sustainability Committee
monitors matters relating to ethical conduct.
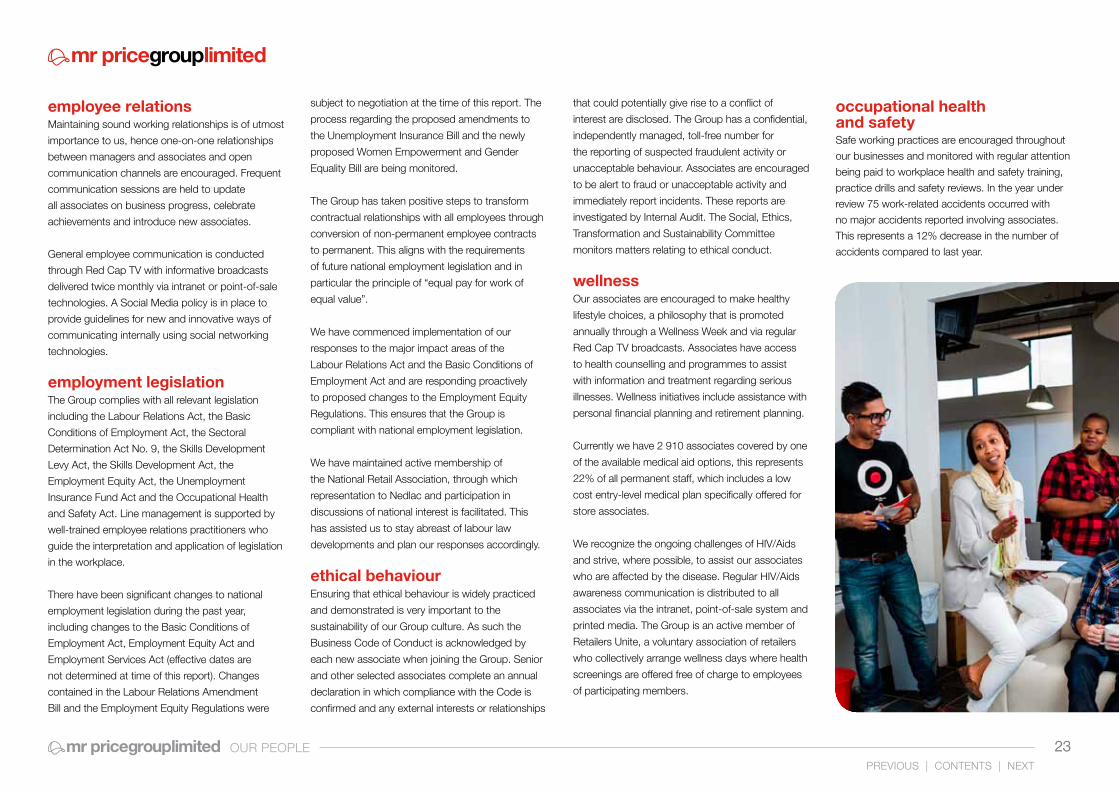
wellnessOur associates are encouraged to make healthy
lifestyle choices, a philosophy that is promoted
annually through a Wellness Week and via regular
Red Cap TV broadcasts. Associates have access
to health counselling and programmes to assist
with information and treatment regarding serious
illnesses. Wellness initiatives include assistance with
personal financial planning and retirement planning.
Currently we have 2 910 associates covered by one
of the available medical aid options, this represents
22% of all permanent staff, which includes a low
cost entry-level medical plan specifically offered for
store associates.
We recognize the ongoing challenges of HIV/Aids
and strive, where possible, to assist our associates
who are affected by the disease. Regular HIV/Aids
awareness communication is distributed to all
associates via the intranet, point-of-sale system and
printed media. The Group is an active member of
Retailers Unite, a voluntary association of retailers
who collectively arrange wellness days where health
screenings are offered free of charge to employees
of participating members.
occupational healthand safetySafe working practices are encouraged throughout
our businesses and monitored with regular attention
being paid to workplace health and safety training,
practice drills and safety reviews. In the year under
review 75 work-related accidents occurred with
no major accidents reported involving associates.
This represents a 12% decrease in the number of
accidents compared to last year.
OUR PEOPLE

24PREVIOUS | CONTENTS | NEXT
24OUR CORPORATE CITIZENSHIP
B-BBEE Scorecard
element total weighting F2014 F2013 F2012
Ownership 20 5.51 6.47 5.46
Management 10 3.08 3.38 3.68
Employment Equity 15 6.26 6.18 6.01
Skills Development 15 12.00 12.00 12.00
Preferential Procurement 20 15.92 14.54 11.20
Enterprise Development 15 7.55 7.09 8.80
Socio-economic Development 5 5.00 5.00 5.00
Total 100 55.31 54.66 52.15
B-BBEE Level 5 6 6
corporateourcitizenship
Sustainability is deeply entrenched in the Group’s corporate values and its commitment to long-term business success.
In this report we provide an overview of performance against the generic Broad-Based Black Economic
Empowerment (B-BBEE) Scorecard and key social and environmental sustainability issues in relation to our
value-adding journey. The Social, Ethics, Transformation and Sustainability Committee reviews the Group’s
corporate citizenship agenda and related activities. Their report is located on page 91.
Our Governance is about effective and ethical leadership, the outcomes of which are sustained value creation,
success and longevity. The Board subscribes to ethical leadership, business sustainability, stakeholder
inclusivity and sound values of good corporate governance. The principles of governance are a natural
extension of our values of Passion, Value and Partnership and have been adopted and integrated into our
business. More information on the Group’s governance strategy and activities during the period can be found
in the Corporate Governance Report on page 48.
BROAD-BASED BLACK ECONOMIC EMPOWERMENT (B-BBEE)
Our Level 5 Compliance has been independently verifi ed against the Department of Trade and Industry’s (dti’s)
B-BBEE Codes of Good Practice, 2007 by BEESCORE (Pty) Ltd, a SANAS accredited verifi cation agency.
We are committed to driving social transformation and B-BBEE in a way that is both meaningful and
sustainable. A high level assessment of the impact of the Revised Codes on our future scorecard has been
conducted and it is acknowledged that the scorecard result is likely to be less favourable. Current initiatives
that will be impacted include the Mr Price Partners Share Trust (which has approximately 95% black
participants), as well as signifi cant investment in people’s skills, local suppliers and local communities (through
RedCap Foundation).

25PREVIOUS | CONTENTS | NEXT
25
management and employment equityThe Group recognises the need for its workforce
to be representative of national and regional
demographics and continues attracting,
employing and developing people from previously
disadvantaged groups. Focus is given to taking
in graduates from previously disadvantaged
backgrounds and preparing them for management
and specialist retail positions. Pre-employment
internships are also offered as a means of
evaluating prospective employees and the RedCap
Foundation’s JumpStart programme provides
soft skill training and retail work experience for
unemployed matriculants.
The Group’s philosophy is to encourage all
associates to achieve to their full potential,
irrespective of race or gender. Associates are
encouraged to apply for and secure growth
opportunities within the Group as these arise. Those
who have the potential to attain top management
positions and meet the needs of the succession
plans are invited to attend internal and external
leadership programmes that provide relevant
business exposure and highlight development
areas. This assists in the attainment of the
employment equity (EE) goals set for the various
occupational levels. The EE goals, set to 2017, have
supporting action plans to address representation
requirements at senior levels and there is regular
reporting in place to monitor progress.
The Executive Transformation Committee reviews
and assesses, and the Board ratifies, appropriate
employment equity targets in line with the Group’s
B-BBEE plan. An Employment Equity and Skills
Development Committee, fully representative
of the Group’s associates, meets regularly to
discuss progress in employment equity, identify
and recommend steps to overcome barriers to
affirmative action and to ensure adherence to
relevant legislation.
enterprise developmentThe Enterprise Development investment has
been centered on the development of strategic
local suppliers in order to build the local South
African manufacturing capacity. The investment
may involve a combination of loan, early payment
(to assist with cash flow) and skills development
(through RedCap Foundation’s Jumpstart
Programmes) and is dependent on the needs
of the individual supplier, their level of supplier
performance and capacity.
The Group’s commitment to partnering with
suppliers to build a sustainable local supply
base is demonstrated through the Group’s role
as the founding retailer in the dti approval of 2
cluster applications aimed at strengthening the
competitiveness of the South African Clothing,
Footwear and Textile Industry. The Footwear and
Leather Regional Goods Cluster and the National
occupational level female male grandtotal
foreign national
A C I W A C I W female male
Top Management 1 1 8 25 35
Senior Management 2 10 56 3 1 5 38 115 4 1
Professionally Qualified 19 23 69 172 17 7 61 117 485 3 0
Skilled technical 1 065 560 282 446 455 109 123 124 3 164 8 6
Semi-Skilled 4 613 1 178 293 120 1 797 294 119 38 8 452 5 7
Unskilled 47 8 5 41 1 11 113
Total Permanent 2014 5 744 1 772 660 802 2 313 412 319 342 12 364 20 14
Non-Permanent 2014 2 594 492 79 74 1 019 152 23 44 4 477 1
Total 8 338 2 264 739 876 3 332 564 342 386 16 841 21 14
Equity Statistics for all South African Associates
Sustainable Textiles and Apparel Cluster will receive
the full funding required to further their objectives.
The objective of the Regional Footwear Cluster
is to deepen and widen engagement in people,
product and processes in the footwear and leather
value chain to increase profitability and employment
levels within the region. The suppliers involved
are strategic partners in the RedCap Foundation
JumpStart Manufacturing Programme and they are
Enterprise Development beneficiaries. The cluster
has a budget of R51 million over 5 years.
The National Textile and Apparel Cluster aims
to strengthen South Africa’s competitiveness in
producing sustainable raw materials and textiles for
local consumption and potential exports in future.
This will inform the Group’s future raw material
considerations and will enable the availability of raw
material sourcing data for business decisions and
reporting. The cluster has a 5 year budget of R228
million, of which R61 million will be allocated for the
first year’s implementation.
socio-economic developmentThe strategy is to invest in South African
communities to support a local sustainable
market and skilled labour force. Social funds
are strategically invested in a way that unlocks
empowerment in the hands of individuals rather
than creating a cycle of dependence.
The social investment initiatives are implemented by
RedCap Foundation NPC, a registered Non-Profit
and Public Benefit Organisation. Partnerships
with various stakeholders, including the National
Department of Basic Education (DBE) and the
JobsFund, remain focused on delivering innovative
solutions whilst building towards systemic change
at a national level.
The Foundation has a vision of a South Africa
where young people create positive social change
by being inspired, healthy and engaged citizens.
Gap areas within the national priorities form
the space in which the Foundation focuses its
attention, by delivering strategic and innovative
OUR CORPORATE CITIZENSHIP

26PREVIOUS | CONTENTS | NEXT
26
solutions to the socio-economic issues. The
Foundation’s partnership with the Group allows it to
respond with strategic solutions designed to meet
the socio-economic needs of society as well as
those of the Group and its supply chain.
This year the Foundation initiated the JumpStart
Manufacturing Programme to develop the skills
of unemployed youth in the clothing and footwear
manufacturing industry, thereby addressing
the needs of both the youth and industry alike.
In February 2014, 21 pre-production and 100
production students started an internship
programme across 5 manufacturing sites of
strategic suppliers in KZN. In June 2014, another
intake of 100 students will take the total to 200
multi-skilled production trainees being skilled
for the sector in 2014. The JumpStart Retail
Programme has assisted 717 previously
unemployed youth to find job placements within
the Group and other business partners of the
programme during the past year. The investment
cost per delegate is a mere R1 750 per person.
The programme started in 2007 and is currently
implementing a successful collaborative
programme in partnership with National Treasury
through the JobsFund. This has resulted in 2 061
job placements since its inception.
The YoungHeroes Programme expanded to
the Free State and made history by implementing
all elements (physical education, extra-mural,
intra-school and inter-school) of the programme
simultaneously at the time of launch. The
programme has been successfully implemented in
8 provinces and continues to show best practice
in Physical Education (PE) and school sport. The
programme started in 2005 and was enhanced
in 2009 with the collaboration between the
Foundation and the DBE. The objective of this
collaboration was for the Foundation’s programmes
and learnings to be incorporated into the new
School Sport Policy and the Department’s National
Strategy on PE and school sport for all public
schools. In the next year, 2 of the YoungHeroes
provinces will enter the sustainability phase, which
will test the ability of the local Department of
Education officials to manage the programme.
The RedCap Schools in Kwa-Dukuza further
improved their academic results to above the KZN
average of 42% and the national average of 40%.
At these schools, the Iciko Programme (focused on
arts, drama, dance and music) achieved significant
results and overwhelming support from principals
and teachers to integrate the programme into
school curricula. This integration started in February
2014. From March 2014, the Foundation will
utilise the RedCap Schools computer laboratories
to launch the Global Literacy and Numeric
programmes in support of further developing both
educators and learners in the areas of Maths and
English.
The Foundation’s Saturday School was launched
in early 2013 with 129 learners (from grades 2 to
12) attending lessons in Maths and English on a
Saturday morning at the Group Head Office.
The Foundation raised over R2.8 million in outside
donations this year, Facebook visits increased from
636 likes to 1 051 over a period of 6 months
(65% increase) and the number of visits on the
website increased by around 47% since last year.
For further information on the activities of the
Foundation refer to www.redcapfoundation.org
social responsibility
The Group’s social strategy, guided by its
values, recognises the partnership with society,
acknowledges the impact on partners and takes
the necessary steps to ensure that our involvement
is of a positive nature and results in “win-win”
outcomes.
The health, wellbeing and physical environment
in countries where people produce our products
is important to us. To this end, the Group has
become a Foundation Stage Member of the
Ethical Trading Initiative (ETI) during the year.
The ETI membership gives the Group access
to a framework and expertise that will assist in
developing a process of supplier compliance and
alignment to our core values. By becoming a
member, we have joined a list of many international
businesses from various sectors which are
committed to improving the lives of global supply
workers.
The alignment of the Group’s Supplier Code
of Conduct to the ETI Base Code is one of the
key steps in committing to trading ethically and
improving conditions in a vast, complex and
global supply chain. A deeper engagement with
our suppliers on these issues is fundamental
to influencing future change and obtaining
transparency. Further to this, the Group also joined
the Supplier Ethical Data Exchange (SEDEX) during
the year. SEDEX provides member companies
with a secure online tool for sharing and managing
supply chain information on 4 key pillars: health and
safety, labour standards, business practices and
the environment. Becoming a member highlights
the Group’s willingness to share information and
to utilise the available information to manage and
improve ethical standards within the supply chain.
OUR CORPORATE CITIZENSHIP

27PREVIOUS | CONTENTS | NEXT
27
environmental responsibilityThe business is reliant on the environment for basic
needs such as water, energy and the provision of
raw materials needed to produce and transport
products. The reliance on natural resources and
the implications of climate change have recently
been acknowledged in terms of the impact on the
business risk profile. Whilst sufficient sector specific
information is still largely lacking to effectively inform
business decisions, it is acknowledged that, for
future survival and success, a resilience to sustain
the impacts of climate change has to be built.
The Group recently joined WWF as a corporate network partner to access the expertise of global subject matter experts in environmental issues.
Raw materials and supply chain
The Group’s most significant environmental impact
occurs within its supply chain, during the process
of production and transportation, as well as during
the customer washing and drying of the apparel
and textile products.
The Supplier Code of Conduct requires compliance
with in-country environmental legislation, but it
is acknowledged that further work is required to
ensure that the Code is actually in line with
international legislation, particularly in countries
where laws do not sufficiently address
environmental degradation.
In order to fully understand the climate change risk
and impact on raw materials used in the production
of the Group’s products, detailed and specific
research appropriate to the needs of the industry
is required. It is expected that the participation in
the National Sustainable Textile and Apparel Cluster
will produce life cycle assessments that will assist
the South African textile industry to make informed
decisions regarding the fibers that are socially and
environmentally appropriate for local production
and it will assist retailers to make appropriate textile
and design decisions.
Energy and carbon footprint
The regular interruption of the national power grid
and rising cost of electricity could have a significant
impact on the Group.
The Group’s commitment is to reduce its carbon
footprint by 10% over the medium-term (on
baseline year 2013). During this year our carbon
footprint was reduced by 2.9 million Kwh (2 871
tons CO2 emissions). The accuracy of the carbon
footprint calculation improved significantly and
initiatives to calculate, monitor and reduce the
emissions were implemented.
The Group’s direct impact on the environment is
limited, with the largest impact being electricity
usage at store level. Carbon reduction initiatives
included lighting retrofitting in stores, ongoing
evaluation of energy requirements and improved
user behavior around energy reduction. The
initiatives have been enabled through an energy
management programme and meters installed at
store level. New store designs are now 30% more
energy efficient than they were 5 years ago.
Water
The Group has not yet focused on water usage
reduction as the nature of our business operations
requires a very low usage of water. It is
acknowledged, however, that South Africa is
considered to be a water scarce country and we
anticipate incorporating responsible water usage in
our value chain in the future.
Waste
Our office recycling rates are still fairly low
compared to industry norms and a target recycling
rate of 20% has been set for F2015. To this end,
the recycling initiative at our Head Office recently
underwent a re-launch to simplify source separation
and a packaging specialist has been commissioned
to investigate opportunities for further product
packaging efficiencies and guide in-store recycling
efforts.
Both our Distribution Centres (DC) have excellent
recycling rates with an average of 95% of all waste
generated being recycled.
Further to this, the DC has implemented an
innovative solution to the standard wooden pallets-
recycled cardboard pallets have been implemented
for all airfreighted stock. This pallet is lightweight
and eliminates the need for fumigation of containers
when sending stock to our international operations.
They have also reduced the quantity of cardboard
boxes (cartons) in the post distribution process by
eliminating the need for repacking through
engagement with suppliers on carton dimensions
and specifications to supply merchandise into the
DC.
Fuel and travel
The Group’s outbound transportation and
distribution is managed by an external service
provider who has successfully implemented fuel
and kilometer travel reduction for the distribution
to stores. Due to the rising cost of fuel, this could
have a significant impact on the Group if not well-
managed. Scope 3 emissions, relating to business
travel and emissions in the value chain, are
currently not included in the Group’s carbon
footprint however opportunities for reduction are
constantly investigated.
Awareness and education
Over the past year, regular awareness campaigns
to associates involved energy tips, recycling and a
continuous focus on improving waste recycling.
OUR CORPORATE CITIZENSHIP

OUR STRATEGY
The Group’s strategy has been developed after
careful consideration of the operating environment
within the international, local and retail industry
contexts. In particular, cognisance has been given
to the following signifi cant matters:
• economic and socio-political landscape of
South Africa
• globalisation of retail and the need for robust
systems and processes to ensure competitive
advantage both in South Africa and new
markets
• increasing role of technology in everyday life
and the impact on current operations and
international expansion
• supply chain, infrastructure and retail space
challenges in new markets
• sustainability, the environmental and social
impacts of a company’s operations.
retail industryRetail is a highly dynamic sector involving property,
design, technology, logistics, fashion and popular
culture. The current context of retail is challenging
due to many retailers facing market saturation and
increased commoditisation, and many wrestling
with new multi-channel strategies to drive sales in a
Retailers are also continuing to focus heavily on resourcing, supply chain and costs to reduce lead times, the cost of procurement, enhance effi ciency and improve working capital in an increasingly competitive environment.
our strategyperiod of low economic growth. At the same time,
retailers are under increased pressure to consider
the environmental and social impacts of their
operations.
Customers have begun to move with much greater
fl uidity between physical, mobile and PC-based
interfaces. Accordingly, it is critical that brands
create customer experiences that fuse the physical
and digital worlds. The international trend is for
an omni-channel approach (bricks and clicks)
and presenting a consistent look and feel across
all contact points. Social media has become a
critical success factor in the retail environment.
Real-time mass communication can be leveraged
as an advantage, for example to test consumer
opinion on an issue or on merchandise, but can
also have the opposite impact in the event of poor
quality or an unpleasant shopping experience. The
Group’s target customers have fully embraced
these new disruptive technologies. New-generation
shoppers want to engage with retailers who are
at the forefront of technology, both in store and
online, and interact in a world without walls. Several
exciting initiatives are underway to ensure that the
Group meets and exceeds such expectations.
28PREVIOUS | CONTENTS | NEXT
28

29PREVIOUS | CONTENTS | NEXT
local marketEconomic considerations
South African retailers have, in general, experienced
a decade of remarkable growth, benefi tting from
the expansion of the emerging middle class.
The recent slower momentum, which impacts all
retailers, is due to the following:
• Wage growth has slowed and, although still
higher than infl ation, the gap has narrowed
signifi cantly.
• Current rand weakness is fuelling an already
pressurised environment, impacting imports and
the cost of goods and services. South Africa
has a volatile currency and, as the major South
African apparel retailers import the majority
of their merchandise, all are affected. Locally
produced apparel also does not escape the
volatility of the exchange rate as the majority
of fabric used in South Africa is imported. With
its average selling prices being lower than its
competitors (which can be as much as 3 times
higher), the Group is potentially less impacted
than its competitors by currency weakness. The
same percentage increase in the landed cost
price due to a weak rand will widen the selling
price gap, making the Group’s merchandise
offer more attractive on a relative basis. Our
strategy is to maintain the gross profi t margin
during periods of currency weakness, rather
than absorbing the cost thereof.
• Infl ation is on the rise and has exceeded the
targeted range of 3-6%. This has a knock-on
effect across the whole economy, however
it has the biggest impact on lower income
customers. The Group generally targets
customers in the mid to upper income groups,
although Sheet Street’s target customers are in
the mid LSM 5-8 bands.
• Interest rates have entered an upward cycle,
however the impact is not expected to be as
extreme as previous cycles. If increases are
moderate, the impact on retail sales will be
minimal and the Group will benefi t from higher
interest income on its cash resources and
accounts receivable.
• Unsecured credit, which accounts for 12% of
total credit in South Africa, is slowing as lenders
lower their risk appetites. The credit quality of
this segment continues to weaken, however
the ageing profi les of other credit types remain
strong. The Group’s credit quality is strong
relative to the industry.
The business model, which is explained in detail on
page 15, has proven itself in previous economically
challenging times. Consumers will look for greater
value and, for fear of falling into a debt trap, will be
more confi dent paying by cash. In these conditions,
as a cash-based value retailer, the Group is well
placed to capture further market share. The past
few years have seen an increasing number of
international apparel retailers establishing a
presence in South Africa. However, their market
positioning results in them competing more with
the higher price-point credit retailers. The Mr Price
brand is well entrenched in the hearts and minds
of South African consumers and Mr Price Apparel
has continued to increase market share despite
the presence of international retailers. Although
the local market is still very important, the Group’s
strategy is to take our proven business concepts
to new markets and expose consumers there to
the merchandise offer that has served us so well
to date.
With regard to real estate, there is always high
demand for premium locations and there have
been instances where new entrants have been
willing to pay higher rentals in order to secure
space. However, the Group has strict store
feasibility guidelines and would rather decline such
space opportunities than run the risk of performing
sub-optimally as a result of inappropriate overhead
structures.
Social and political considerations
The South African social landscape remains
challenging, with low levels of education, a high
unemployment rate and pressure on National
Government as a result of the high number of
people employed by that sector or drawing social
benefi ts from it. Critical skill shortages continue to
impact the business environment, including the
retail, clothing and textile industries.
While the Company gives preference to and
sources a proportion of its merchandise from local
suppliers, its efforts are hampered by the lack of
competitiveness of the local manufacturing industry.
A lack of investment in new technology and high
cost of employment, without a corresponding
increase in productivity, contributes to the high
costs of local manufacturing. In response to the
opportunity to assist the competitiveness of local
manufacturers, the Group has developed an
Enterprise Development Strategy and has recently
been involved in the establishment of 2 dti-approved
competitiveness clusters. Refer to Our Corporate
Citizenship report on page 24 for further details.
Through the Red Cap Academy, talent and
management development programmes support
the development of black managers and grow the
leadership in the Group. Electronic retail-specifi c
training programmes train associates for a career in
retail. Refer to the report on Our People on page 20.
The Group remains committed to acting responsibly
and to considering the interests of its key
stakeholders – in short, being a good corporate
citizen. In doing so, the Group abides by the laws
of the territories in which it transacts and expects
its associates, suppliers and stakeholders to do
likewise. Refer to the Corporate Governance Report
on page 48.
OUR STRATEGY

30PREVIOUS | CONTENTS | NEXT
30
international
The African continent, with a rapidly urbanising population of nearly
900 million, is being considered by many as “the next big thing”.
Disposable incomes are rising and consumer
spending is expected to grow to almost $1 trillion.
GDP growth is close to 6% and several Sub-
saharan African countries rank among the 10
fastest growing economies globally. A middle class
is emerging and increasingly wealthy consumers
are embracing Western brands, products and
lifestyles. Mobile phones and the internet are
proliferating rapidly across the continent and
internet penetration is expected to increase from
167 million to 600 million by 2025, and smart
phone utilisation to increase from 67 million to
360 million over the same timeframe. There are
significant opportunities for retail in developing
economies. Africa represents a major opportunity
for us to expand but capturing it will require
patience, hard work and ingenuity. Formal retail
space (malls and shopping centres) is scarce
and expensive, while under-developed supply
chains, corruption and lack of infrastructure are
additional challenges. The Group’s growth strategy
is multi-faceted, incorporating local, African and
international growth.
The East, particularly China, continues to be the
major force in apparel manufacturing, however
sourcing from that location is not always ideal
as the need for fast-fashion and shorter lead
times would, in theory, seem to support local
sourcing. Where possible, the Group procures
from local manufacturers and suppliers, however
the ability to accommodate our order volumes at
the most attractive price requires the Group to
source from international suppliers to a significant
extent. The Company is currently reviewing its
resourcing strategy to enable quick response and
is working with strategic suppliers to develop key
manufacturing skills. Refer to the Group’s social
responsibility initiatives on page 26.
Worldwide businesses have acknowledged the
need to address climate change via more efficient
and effective usage of resources such as energy,
water and fuel. This reduces carbon footprints
and the overall impact on the environment and
mitigates rising costs. The Group’s usage of these
resources is under scrutiny, through energy and
supply chain initiatives. Read further on the Group’s
environmental responsibility on page 27.
The Group’s most material matters are those which affect the execution of its strategy and its ability to
create and sustain value in the short, medium and long-term. These material matters have been identified
and prioritised after taking into consideration the Group’s business model, unique culture and partnership
philosophy, the top of mind issues for the Board and executive management, issues that have been derived
from key stakeholder engagement, strategic objectives and key risks. The Group’s most material matters
have not been reported separately; instead these are integrated throughout this report.
FIX Address all areas of operational weakness and improve the operating margins of underperforming divisions. This phase was targeted at the Home businesses which were performing below expectation and Mr Price Sport which was a start-up business that had not yet achieved critical mass and was incurring losses. These divisions have improved their trading densities and operating margins are now all in excess of 10%. A revised target of a minimum of 15% within the next 5 years has been set, while Apparel and Miladys are targeting in excess of 20%.
INVEST Improve processes and systems, the foundations of which will support and enable the growth strategy. Detailed assessments of systems, people, resourcing and supply chain have taken place and the Group has committed to capital expenditure of R3 billion over the next 5 years. Significant investments are a new ERP system and distribution centre (page 31 & 32).
GROW To be an internationally competitive omni-channel retailer with robust top line growth and an increasing contribution of foreign revenue. The Group’s approach to expansion is to fully test foreign markets before committing to an entry strategy. Early results are encouraging, with focus now being placed on supply chain improvements to ensure appropriate pricing and consistent brand positioning in all markets and research into other territories (page 31).
group strategyThe Company’s vision is to become a top performing, international omni-channel retailer which requires
sustainable value creation over the short, medium and long-term. The Board of Directors reviews the
appropriateness of the strategic objectives annually and performance against set targets regularly throughout
the year. An integrated approach to strategy, risk management, performance and sustainability has been
adopted and there is continued commitment to the alignment of “people, profit and planet”. The Group’s
strategy has been captioned ‘FIX, INVEST, GROW’:
OUR STRATEGY
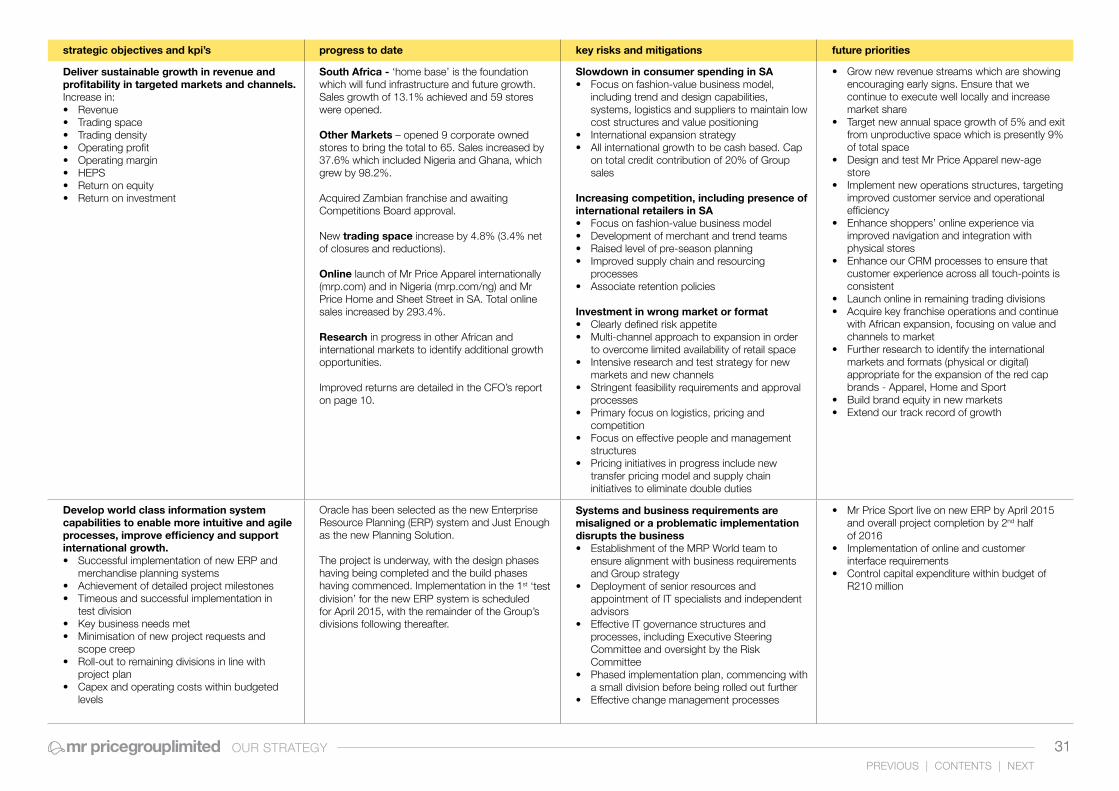
31PREVIOUS | CONTENTS | NEXT
31
strategic objectives and kpi’s progress to date key risks and mitigations future priorities
Deliver sustainable growth in revenue and profitability in targeted markets and channels. Increase in:• Revenue• Trading space• Trading density• Operating profit• Operating margin• HEPS• Return on equity• Return on investment
South Africa - ‘home base’ is the foundation which will fund infrastructure and future growth. Sales growth of 13.1% achieved and 59 stores were opened.
Other Markets – opened 9 corporate owned stores to bring the total to 65. Sales increased by 37.6% which included Nigeria and Ghana, which grew by 98.2%.
Acquired Zambian franchise and awaiting Competitions Board approval.
New trading space increase by 4.8% (3.4% net of closures and reductions).
Online launch of Mr Price Apparel internationally (mrp.com) and in Nigeria (mrp.com/ng) and Mr Price Home and Sheet Street in SA. Total online sales increased by 293.4%.
Research in progress in other African and international markets to identify additional growth opportunities.
Improved returns are detailed in the CFO’s report on page 10.
Slowdown in consumer spending in SA• Focus on fashion-value business model,
including trend and design capabilities, systems, logistics and suppliers to maintain low cost structures and value positioning
• International expansion strategy• All international growth to be cash based. Cap
on total credit contribution of 20% of Group sales
Increasing competition, including presence of international retailers in SA• Focus on fashion-value business model • Development of merchant and trend teams • Raised level of pre-season planning • Improved supply chain and resourcing
processes• Associate retention policies
Investment in wrong market or format• Clearly defined risk appetite• Multi-channel approach to expansion in order
to overcome limited availability of retail space• Intensive research and test strategy for new
markets and new channels• Stringent feasibility requirements and approval
processes• Primary focus on logistics, pricing and
competition• Focus on effective people and management
structures• Pricing initiatives in progress include new
transfer pricing model and supply chain initiatives to eliminate double duties
• Grow new revenue streams which are showing encouraging early signs. Ensure that we continue to execute well locally and increase market share
• Target new annual space growth of 5% and exit from unproductive space which is presently 9% of total space
• Design and test Mr Price Apparel new-age store
• Implement new operations structures, targeting improved customer service and operational efficiency
• Enhance shoppers’ online experience via improved navigation and integration with physical stores
• Enhance our CRM processes to ensure that customer experience across all touch-points is consistent
• Launch online in remaining trading divisions• Acquire key franchise operations and continue
with African expansion, focusing on value and channels to market
• Further research to identify the international markets and formats (physical or digital) appropriate for the expansion of the red cap brands - Apparel, Home and Sport
• Build brand equity in new markets • Extend our track record of growth
Develop world class information system capabilities to enable more intuitive and agile processes, improve efficiency and support international growth.• Successful implementation of new ERP and
merchandise planning systems• Achievement of detailed project milestones• Timeous and successful implementation in
test division• Key business needs met • Minimisation of new project requests and
scope creep • Roll-out to remaining divisions in line with
project plan • Capex and operating costs within budgeted
levels
Oracle has been selected as the new Enterprise Resource Planning (ERP) system and Just Enough as the new Planning Solution.
The project is underway, with the design phases having being completed and the build phases having commenced. Implementation in the 1st ‘test division’ for the new ERP system is scheduled for April 2015, with the remainder of the Group’s divisions following thereafter.
Systems and business requirements are misaligned or a problematic implementation disrupts the business• Establishment of the MRP World team to
ensure alignment with business requirements and Group strategy
• Deployment of senior resources and appointment of IT specialists and independent advisors
• Effective IT governance structures and processes, including Executive Steering Committee and oversight by the Risk Committee
• Phased implementation plan, commencing with a small division before being rolled out further
• Effective change management processes
• Mr Price Sport live on new ERP by April 2015 and overall project completion by 2nd half of 2016
• Implementation of online and customer interface requirements
• Control capital expenditure within budget of R210 million
OUR STRATEGY

32PREVIOUS | CONTENTS | NEXT
32
strategic objectives and kpi’s progress to date key risks and mitigations future priorities
Build an improved end-to-end supply chain, including resourcing and logistics, to improve visibility, optimise costs, reduce lead times and support international expansion• Ongoing transition of resourcing strategy - %
of inputs acquired via direct relationships with manufacturers
• Like-for-like product input price inflation• Delivery performance – on time in full, lead
times• Elimination of double duties in foreign trading
territories - % of merchandise delivered from point of manufacture to each respective market
• Achievement of consolidation centre and bond store utilisation targets
• DC cost per unit• Freight cost as % of FOB value• Build a new distribution centre in SA – timing,
efficiency gains and costs
Direct imports increased by 53% to 16% of total imported merchandise.
Group input price inflation was 9.7%, of which approximately 5.3% was like-for-like input prices and 4.4% mix.
Bond store established and accredited.4 consolidation centres established in the East.
New DC plans were well advanced, however setback due to municipal approval being declined. Alternative approved site identified and an environmental impact assessment is underway.
Freight as a % of FOB reduced, exceeding initial targets set.
Increased direct exposure to exchange rates may cause volatility in selling prices and gross margin %• Increase in direct imports is on a phased basis
over a few years• Hedging strategy in place and treasury
committee established• Selling prices routinely checked against
competitors
Inability to eliminate double duties will result in retail selling prices in foreign markets being higher than desired. This will hamper our competitiveness, result in the brand identity not being consistent in all markets and the growth strategy being impacted• Detailed plans to eliminate double duties• Amended transfer pricing policies awaiting
regulatory approval• RSP’s to be lowered as benefits accrue which
will positively impact competitiveness against informal markets and increase market share
Distribution Centre capacity may be unable to cope with peak trading throughputs and future growth• Interim focus on process and stock-flow
optimisation• Use of off-site facilities during peak periods• New DC project has been set up as a major
initiative, with a focused team, appointment of specialists, sound project governance structures and processes including reporting to the Services Division Board and Risk Committee
• New DC to be in use by August 2016
• Ensure that suppliers are reputable and able to meet our increasingly complex requirements.
• Achieve consistent progress on factory direct and trading relationships, with 85% of imports to be on this basis by F2019
• Eliminate double-duty in foreign markets. Foreign stores incurring single duty to increase from present level of 17% to 90% over the next 5 years
• Conduct limited tests on direct shipments from China to Nigeria in July 2014
• Obtain necessary approvals for new distribution centre and achieve project milestones
• Establish the potential of bringing the fulfillment of e-commerce sales in house
Empower and engage people, enhance people and leadership capabilities and ensure that company values and corporate ‘DNA’ are embedded• Effective staff recruitment strategy• Effectiveness of succession plan• Appropriate training investment • Achievement of Employment Equity (EE) targets• Successful implementation of human capital
management (HCM) system• Results of culture surveys• Staff retention
• Investment in learning and development increased to R33.8 million
• Continued investment in e-learning facilitated training across a widespread footprint
• Various initiatives to train the new skills required to support the Group’s strategy
• Focus on leadership development, including EE• 96% of associates that joined the Group in
2014 were from disadvantaged backgrounds• 119 associates, 92% of whom are
disadvantaged were involved in a learnership programme
Poor education levels and a lack of skills result in the further decline in the manufacturing industry which is already struggling with competiveness• Supplier and enterprise development plans, by
the merchandise, resourcing and sustainability teams aimed at improving supplier sustainability and quick response capabilities in SA
• RedCap Foundation participation in skills development with strategic suppliers in the footwear and apparel manufacturing sectors (JumpStart Manufacturing)
• RedCap Foundation JumpStart Retail Project
Remuneration structures will be reviewed across all levels to ensure that they are still relevant to those whom they impact and continue to act as a strong motivator to drive future growth.
Significant focus will be placed on the completion of the HCM system roll-out and the results obtained. Refer Our People report on page 20.
OUR STRATEGY
33PREVIOUS | CONTENTS | NEXT
strategic objectives and kpi’s progress to date key risks and mitigations future priorities
• Achievement against EE targets • At store level, the staff turnover rate of 20.1%,
is within industry norms. The retention of head office staff is high
• Further roll-out of a world class HCM system, labour scheduling module to all stores in the next financial year and implement the learning management module
• Succession plans are in place for key positions and is reviewed annually by the Board
The Group may not be able to attract and retain critical skills• Brand profiling and talent search strategy,
including intern and graduate programmes• Improved recruitment processes and
information• Ongoing focus on skills development in order to
create suitable talent pools, particularly around merchandise skills
• Continued focus on embedding of Group culture and enhancing the work environment
Leadership does not have the ability toexecute the strategy • Executive development initiatives include
strategy and operating in a global marketplace• Board oversight of performance to strategic
KPI’s• Robust succession planning
Be a responsible corporate citizen that operates in a sustainable manner• King III application register• Number of incidents of legislative infringements• B-BBEE accreditation (in SA)• Volume of carbon emissions (in SA)• Electricity consumed (in SA)• Social Investment • Enterprise Development Investment • Adherence of our associates and suppliers to
our codes of conduct
Mr Price Group has an established foundation of good corporate governance - refer to the Our Governance section on page 48. Further enhancements were made to the Group’s governance processes, including:• Optimisation of Board structures and mandates• Implementation of a new strategic risk
appetite policy, the core instrument for aligning strategy, risk management, performance and sustainability
• Publishing of the King III Application Register, which confirmed the Group’s commitment to uphold and integrate the spirit and principles of good governance
• Updates to key Governance policies, including the delegation of authority, to further improve the Board’s oversight over strategic areas and to advance empowered leadership
The Group joined the Ethical Trading Initiative (ETI) and Supplier Data Exchange (SEDEX) to encourage socially responsible practices in its supply chain.
The installation of efficient lighting and electricity meters in stores resulted in a more accurate calculation of consumption and carbon emissions and lower costs.
Level 5 Contributor B-BBEE status was attained through sustainable interventions, including social investment through RedCap Foundation, preferential procurement and enterprise development investment with strategic suppliers.
Insufficient engagement with or consideration of business input into new or changed legislation may result in onerous compliance requirements e.g. dti’s Revised B-BBEE Codes of Good Practice will result in a less favourable rating, despite the Group’s firm commitment and significant advancements in this area• Continuous involvement in national and retail
forums and considered input into proposed changes
• Engaging and building positive relationships with regulators
• Group’s compliance philosophy• Sustainability strategy
Although the Group insists that suppliers uphold the standards set in the code of conduct it is possible that this may be breached by suppliers, and may cause undue reputational risk to the Group.• Enhanced supplier code of conduct and
supplier’s annual declaration process• Supplier relationships and engagement• Joined the Ethical Trading Initiative (ETI) and
Supplier Data Exchange (SEDEX) to encourage socially responsible supplier practices
• Partnership with independent quality assurance provider in aligning conduct to the ETI Base Code
• Group’s consistent and direct response to noted breaches
The Group governance strategy has remained one that is “Beyond Compliance”, and is therefore focussed on enabling the adoption, integration and embedding of the spirit and principles of governance (fairness, accountability, integrity, responsibility and transparency) in all areas of the business.
The ETI Framework and SEDEX will be implemented across the Group over the next 3 years.
The energy behaviour across the Group is being monitored and further savings in electricity are expected as the initiatives undertaken are expanded further across the business.
The Group will respond to the Revised Codes of Good Practice issued by the dti.
OUR STRATEGY

3434
Unit 2014 2013 2012 2011 2010
Economic
Retail sales R’m 15 227 13 266 11 767 10 673 9 454
Headline earnings per share cents 765.1 634.8 503.0 418.9 276.9
Operating margin % 16.7 15.6 14.8 13.4 10.5
Dividends per share cents 482.0 398.0 314.0 252.0 173.0
Share price (closing) Rand 156.01 116.99 94.34 63.38 39.80
Return on net worth % 47.6 46.4 43.8 42.2 32.5
Cash sales as a % of total sales % 80.8 79.9 81.4 83.8 83.9
Social
Total number of people employed 18 1041 19 384 17 894 17 887 17 300
Staff turnover % 20.08 21.5 22.6 22.1 25.7
Black staff as a % of total permanent staff % 91 94 91 89 90
Promotions of black people as a % of total promotions % 82 87 85 78 83
Investment in people learning & development R’m 33.8 30.8 25.1 9.9 7
Black people participating in learning & development % 90 88 87 83 78
B-BBEE rating Level 5 6 6 6 Not measured
Corporate Social Investment R’m 18.8 16.7 13.0 11.4 7.4
Enterprise Development Investment R’m 28.0 23.2 21.4 1.5 Not measured
Environmental2
Carbon emissions (estimated) (in SA) Tonnes 157 639 210 786
Electricity consumed (Kwh in SA) Million 2.9 Not reported
1 The decline in associates employed is due to the Group addressing employment contract types in response to amended labour legislation, where the conversion of casuals
to permanent contracts resulted in fewer people being employed. Refer to Our People Report on page 20 for further information2 Refer to Our Corporate Citizenship Report on page 24 for further information
Key Performance Indicators
The following key indicators have been identified to measure the Group’s economic, social and environmental progress:
OUR STRATEGYPREVIOUS | CONTENTS | NEXT

who we areWe retail a selection of own sub-brands along with
designer collaborations. Assortments are differentiated
and category dominant in the wanted fashion items of
the season. We target young and youthful customers
in the LSM 6 to 10 range who love fashion and
appreciate exceptional value.
An omni-channel retail approach is used to leverage
multi-markets, together with social media platforms, to
engage with customers.
The store footprint is supported by a strong
e-commerce capability, thereby giving customers
access to our full assortment online.
Nicci LyneMANAGiNG Director, Mr Price APPAreL
Mr Price is a leading fashion value retailer that provides an inspired range of differentiated, on-trend clothing, intimatewear, shoes and accessories offering distinctive and market-leading value.
We target young and youthful customers in the LSM 6 to 10 range who love fashion
DIVISIONAL REVIEW 35PREVIOUS | CONTENTS | NEXT
3535

36PREVIOUS | CONTENTS | NEXT
3636
what we didThe division had an exceptional year, with sales
growing by 18.9% and comparable sales by 13.0%.
This performance was driven by the following:
• Weighted average trading space growth of
8.4%, the highest in the Group, as a result of
opening 24 stores and expanding another 15.
In total, the sales performance of these new
stores exceeded feasibility
• West African stores continue to perform well,
growing sales by 95.8%
• Growth of our e-commerce in South Africa
since the launch in July 2012 and the launch of
e-commerce internationally in June 2013.
e-Commerce has added an exciting new dimension
to our business, strategically opening up new
growth opportunities and positioning us as one
of the most progressive omni-channel retailers
in Africa. Significant improvements to all aspects
of the online platform have been made since the
launch, resulting in growth of 203.5% year-on-
year. We have also noted the positive impact that
where we are going
Significant investment has already been made
in securing and up-skilling human resource
capabilities, improving merchandise buying and
planning processes, acquiring new systems and
streamlining our resourcing and logistics. However,
the capacity building will be ongoing, as we plan to
penetrate selected international markets through a
focused omni-channel approach.
the online business has had on our physical store
(bricks) sales and believe that this has been a key
driver in our overall market share gains this year.
Although RSP inflation of 11% appears high, it was
impacted by product mix and lower markdowns.
Like-for-like product input prices increased by 4.7%.
The gross profit percentage increased primarily due
to an improved markdown performance. Overhead
growth, despite the many investments being made
to position the Group for future growth (which are
most often first implemented in Mr Price Apparel),
increased at a rate lower than sales growth.
18.9%13.0%
R8.6 billionSalesgrowth
Sales
Comparable sales growth
We are optimistic about the opportunities for the brand beyond our borders, given the customer response to our initial tests. Value is a key differentiator in all new markets and we have identified further opportunities to enhance our value positioning, mainly via supply chain improvements.
DIVISIONAL REVIEW
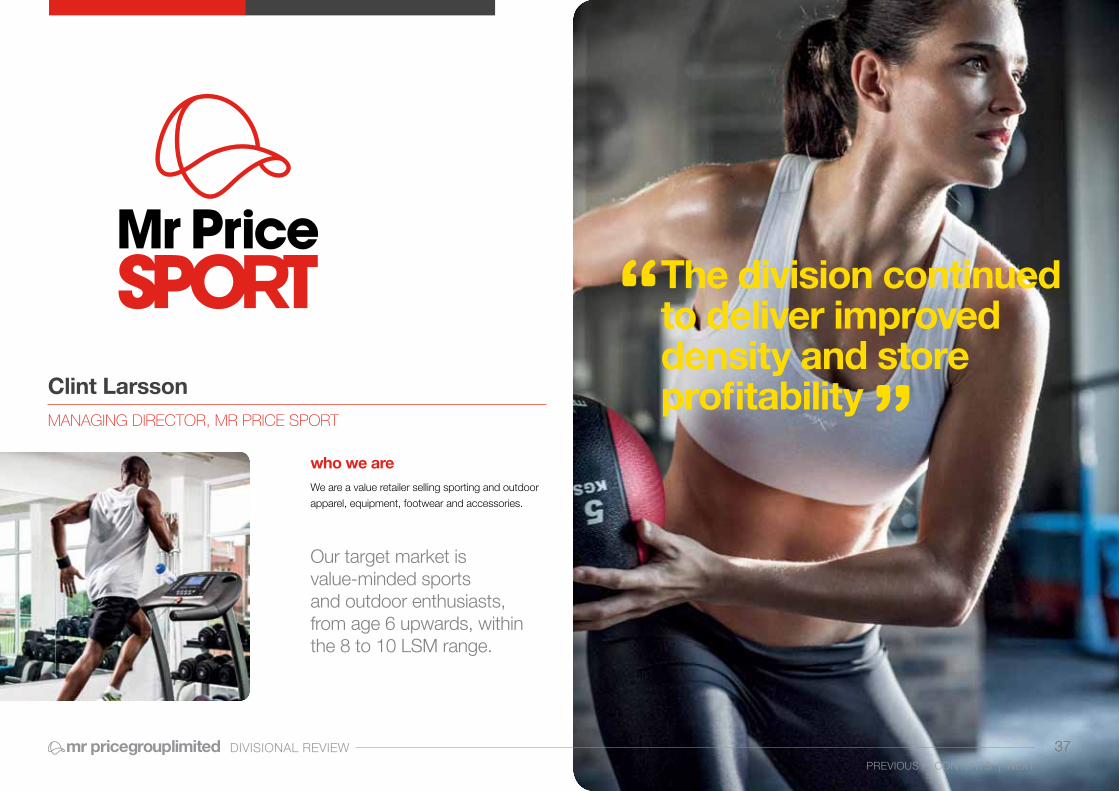
The division continued to deliver improved density and store profitability
who we are We are a value retailer selling sporting and outdoor
apparel, equipment, footwear and accessories.
Our target market is value-minded sports and outdoor enthusiasts, from age 6 upwards, within the 8 to 10 LSM range.
Clint LarssonMANAGiNG Director, Mr Price SPort
DIVISIONAL REVIEW 37PREVIOUS | CONTENTS | NEXT
3737
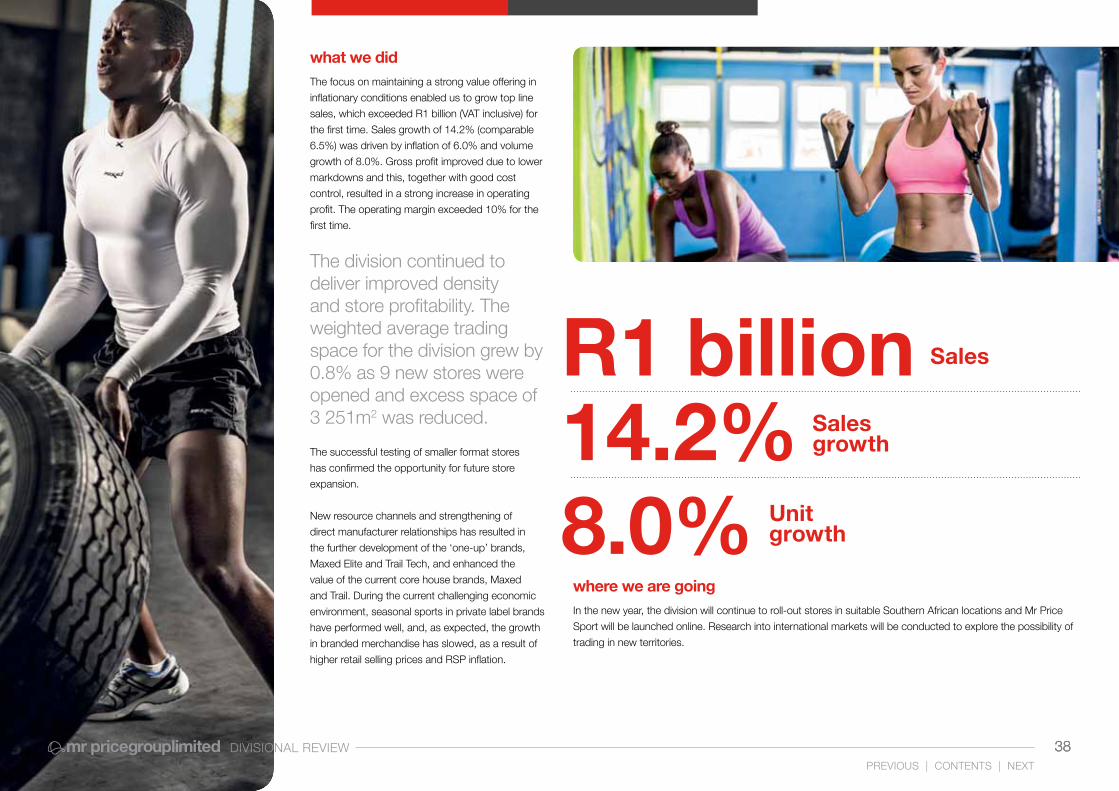
38PREVIOUS | CONTENTS | NEXT
3838
what we didThe focus on maintaining a strong value offering in
inflationary conditions enabled us to grow top line
sales, which exceeded R1 billion (VAT inclusive) for
the first time. Sales growth of 14.2% (comparable
6.5%) was driven by inflation of 6.0% and volume
growth of 8.0%. Gross profit improved due to lower
markdowns and this, together with good cost
control, resulted in a strong increase in operating
profit. The operating margin exceeded 10% for the
first time.
The division continued to deliver improved density and store profitability. The weighted average trading space for the division grew by 0.8% as 9 new stores were opened and excess space of 3 251m2 was reduced.
The successful testing of smaller format stores
has confirmed the opportunity for future store
expansion.
New resource channels and strengthening of
direct manufacturer relationships has resulted in
the further development of the ‘one-up’ brands,
Maxed Elite and Trail Tech, and enhanced the
value of the current core house brands, Maxed
and Trail. During the current challenging economic
environment, seasonal sports in private label brands
have performed well, and, as expected, the growth
in branded merchandise has slowed, as a result of
higher retail selling prices and RSP inflation.
where we are goingIn the new year, the division will continue to roll-out stores in suitable Southern African locations and Mr Price
Sport will be launched online. Research into international markets will be conducted to explore the possibility of
trading in new territories.
DIVISIONAL REVIEW
8.0%14.2%R1 billion
Salesgrowth
Sales
Unit growth

who we areMiladys retails a focused assortment of own brand
women’s clothing, intimatewear, shoes, bags and
accessories which are of good value, trend right,
differentiated and of flattering fit.
Our customer is primarily a 40+ family-orientated
woman who is not a fashion “risk taker” but has
fashion sense and wants to look on trend. She is in
the LSM 6 to 10 range and requires good quality,
comfortably fitting garments and value for money.
Larry SimonMANAGiNG Director, MiLADYS
On trend, good quality, comfortably fitting garments and value for money
DIVISIONAL REVIEW 39PREVIOUS | CONTENTS | NEXT
3939

40PREVIOUS | CONTENTS | NEXT
4040
what we didThe division delivered a solid first half performance, however, the
gains were diminished as a result of performance in the second
half of the year falling short of expectations.
Being predominantly a credit retailer (54.3% of sales are on
store credit), the division has been impacted by the tightening
of credit extension in line with its peers. This, together with a
poor performance in certain merchandise categories, resulted
in a second half sales growth of 4.6%, impacting the annual
performance substantially.
Weighted average trading space reduced by 2.0% as a result of
the opening of 7 stores being offset by the closing of 5 stores and
right-sizing of a further 6 stores.
The division was able to partly mitigate the lost sales opportunities
and lower gross profit percentage (higher markdowns) by
maintaining overhead costs in line with the prior year. As a result,
the division was able to deliver a meaningful increase in annual
operating profit.
The focus on windows and in-store displays to improve the brand
experience was positively acknowledged in our market research.
where we are going
The past trading period highlighted opportunities for improvement
in certain merchandise processes and team structures. The value
offering will be further enhanced to improve our market positioning.
Despite the temporary set-back, there are significant opportunities to improve gross margins via improved resourcing and lower markdowns. The division is generating an operating margin which is high in the Group context, but is some way off its potential.
Miladys will continue to take a conservative approach to
the opening of new stores, by ensuring that store size and
location match strict feasibility criteria.
DIVISIONAL REVIEW
7.0%R1.4 billion
Salesgrowth
Sales

who we areMr Price Home sells contemporary in-house
designed, fashionable homeware and furniture to
value-minded customers, with a young-at-heart
attitude.
Our primary customer is a fashion-value minded
female, aged 18 years and older within LSM 8 to
10, who loves her home. With the insight of past
results, expected future local and international
trends and customer feedback, we constantly aim
to delight our customers with innovative products
at everyday low prices.
Arn de HaasMANAGiNG Director, Mr Price hoMe
Mr Price Home is the most loved and frequented homeware retailer in South Africa
DIVISIONAL REVIEW 41PREVIOUS | CONTENTS | NEXT
4141

42PREVIOUS | CONTENTS | NEXT
4242
what we did
We grew our sales by 10.5% and comparable sales
by 8.2%, in line with expectations. Our sales growth
reflected an increase in RLC market share and,
while it was fairly consistent across all merchandise
categories, we achieved above average growth in
our textiles and home décor categories.
We opened 9 new stores and closed 1, keeping
our weighted average space footprint in line with
the past year as we right-sized existing stores.
In the current year, the division increased sales
in right-sized stores despite a space reduction
of 2 825m2, which led to a strong bottom line
improvement. The stock turn was consistent with
last year and merchandise quality improved with a
greater level of fresh stock. The gross margin grew
faster than sales, and this, combined with well-
managed overheads, contributed to a meaningful
increase in operating profit.
The local launch of our e-commerce channel in
the second half of the year proved successful,
with results exceeding our expectations and
enhancing our customers’ shopping experience.
We were recognised for great customer service in
the Homeware category through the Orange Index
and were identified as the Most Iconic Homeware
brand by the TGI Icon Brands Survey. Independent
research, conducted by Nielsens, reflected that
Mr Price Home is the most loved and frequented
homeware retailer in South Africa with the highest
level of brand awareness in the sector.
where we are going
As a leading fashion-value retailer of homeware
and furniture, we remain committed to continued
improvements to enhance customers’ shopping
experiences through product selection, range and
brand experience.
The division still has significant opportunity to drive
efficiency via the right-sizing of stores, with excess
space in the division approximating 28 000m2.
We expect to capitalise on the opportunities
presented through our online channel, grow the
omni-channel experience in our stores and facilitate
further benefits to our customers. Our international
e-commerce website will be launched in the year
ahead.
Our strategy includes increased focus on improved
resourcing and supply chain initiatives, as we look
to grow market share across current assortments
and store footprint within Southern Africa. In
addition, we plan to test stores in West Africa and
explore other opportunities to grow our business
beyond our current geographic locations.
DIVISIONAL REVIEW
8.2%10.5%R2.9 billion
Salesgrowth
Sales
Comparable sales growth

who we areWe are a value retailer offering a range of affordable
home textile and décor products for bedroom,
living-room, bathroom, kitchen and dining.
In particular, we pride ourselves on providing
exceptional value to middle-income households
(LSM 5 to 8) who can create a home they love at a
price they can afford. South Africans love and trust
Sheet Street for providing freshness, co-ordination
and helpful tips in-store, in catalogues and online.
Sheet Street online gives shoppers access to over
1 000 products, 24 hours a day, 7 days a week,
with delivery direct to their doorstep.
Roger MaingardMANAGiNG Director, Sheet Street
Our customers are very important to us and we interact and engage extensively at various service touch points in our 265 stores and via various social media channels. The store environment is small and intimate, with clearly-defined and easy-to-shop room categories.
DIVISIONAL REVIEW 43PREVIOUS | CONTENTS | NEXT
4343
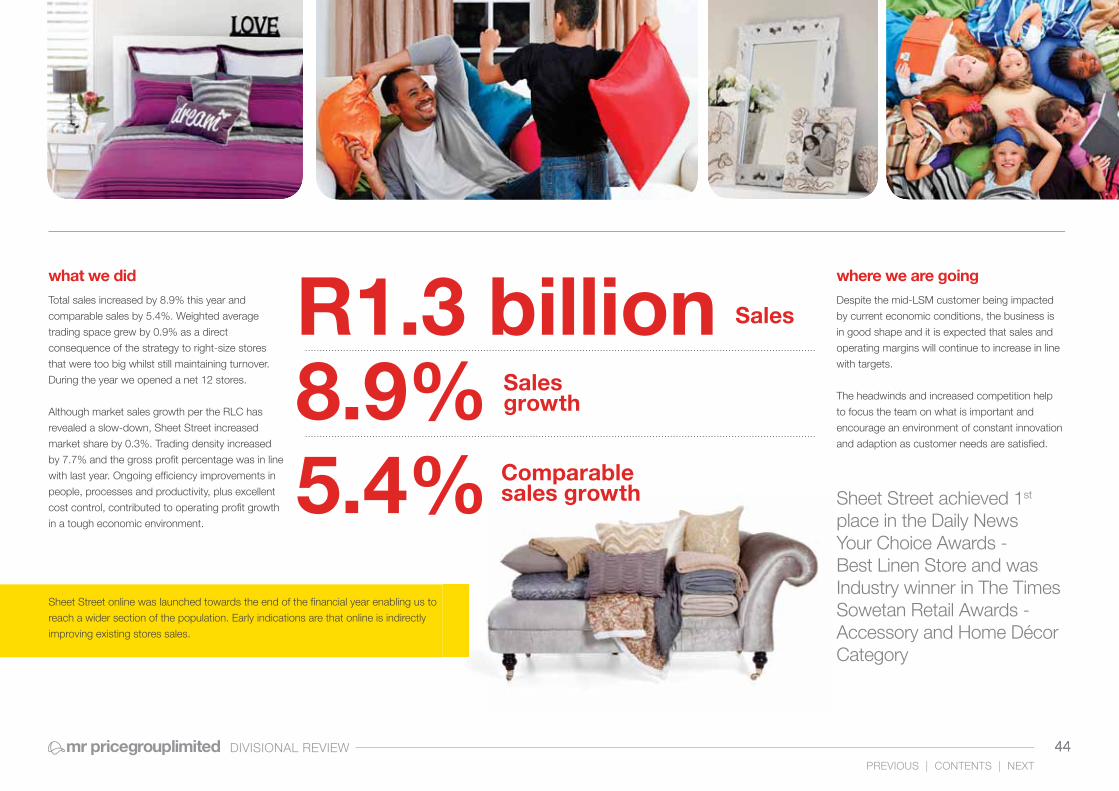
44PREVIOUS | CONTENTS | NEXT
what we didTotal sales increased by 8.9% this year and
comparable sales by 5.4%. Weighted average
trading space grew by 0.9% as a direct
consequence of the strategy to right-size stores
that were too big whilst still maintaining turnover.
During the year we opened a net 12 stores.
Although market sales growth per the RLC has
revealed a slow-down, Sheet Street increased
market share by 0.3%. Trading density increased
by 7.7% and the gross profi t percentage was in line
with last year. Ongoing effi ciency improvements in
people, processes and productivity, plus excellent
cost control, contributed to operating profi t growth
in a tough economic environment.
4444
where we are goingDespite the mid-LSM customer being impacted
by current economic conditions, the business is
in good shape and it is expected that sales and
operating margins will continue to increase in line
with targets.
The headwinds and increased competition help
to focus the team on what is important and
encourage an environment of constant innovation
and adaption as customer needs are satisfi ed.
Sheet Street achieved 1st place in the Daily News Your Choice Awards - Best Linen Store and was Industry winner in The Times Sowetan Retail Awards - Accessory and Home Décor Category
Sheet Street online was launched towards the end of the fi nancial year enabling us to
reach a wider section of the population. Early indications are that online is indirectly
improving existing stores sales.
DIVISIONAL REVIEW
5.4%8.9%R1.3 billion
Salesgrowth
Sales
Comparable sales growth
Rex SamuelsonMANAGiNG Director, Mr Price fiNANciAL ServiceS
We support the Group’s profitable growth in retail market share
who we areWe support the Group’s profitable growth in retail
market share by developing and maintaining the
right relationship with customers across our primary
financial service products.
These products are positioned to reward and retain
our most valued customers, in addition to being
competitive, simple and easy to understand.
These include:
• Store cards – support customer
acquisition and merchandise sales
• Insurance – life, income and disability
protection with family and individual
benefits
what we didGrowth in profitability was achieved despite
declining consumer disposable income.
The strategic decision taken in 2012 to moderate
credit sales growth resulted in credit growth
slowing to 9.6% (2013: 18.3%). This, together
with a strong cash retail performance, resulted in
the credit sales contribution declining to 19.2%
of total sales (2013: 20.1%). The active account
base growth slowed to 5% (2013: 10%) as did our
debtors book at 13% (2013: 28%).
DIVISIONAL REVIEW 45PREVIOUS | CONTENTS | NEXT
4545

46PREVIOUS | CONTENTS | NEXT
4646
mrpricemoney.com The following key successful strategic projects were completed this year:
• Collections - introduced additional risk segmentation and propensity-to-pay tools, enhanced our structures
and resources, and created a “cradle to grave” strategy from collections through to write-offs and recoveries
• Digital - built a platform that facilitates an end-to-end solution to shop, pay and manage your account
online, and continued migration of customers to cost-effective digital channels
• Finalised a new joint venture which will be launched subsequent to the internal test phase.
where we are goingThe challenges in the external credit and regulatory environment are expected to remain, and even potentially
intensify, for the foreseeable future. We therefore remain cautious regarding our credit landscape, but we do
however anticipate good growth from insurance and other new products.
Our customer centric focus will include the following imperatives:
• Optimisation of product, process and distribution
• Customer service investment in system integration and contact centre infrastructure
• Investment in systems and processes to support cash customers across insurance and mobile
• Ongoing investment in our collection model, data management and analytics
• Attracting and retaining key skills necessary to support a diversified financial services business.
Despite the challenging credit environment, our bad debt increased marginally to 7.6% (2013: 6.5%) which is testament to our robust credit risk policies and improved collections environment. Our credit portfolio remains one of the best in the industry based on independent benchmarking performed by Principa.
Account management summary 2014 2013
Gross trade debtors (R’000) 1 754 054 1 550 324 Total active accounts 1 375 259 1 307 751 Average balance (R) 1 275 1 185 % of debtors able to purchase on credit 88.4% 86.5%Retail sales analysis (% of total sales)Cash 80.8% 79.9%Credit 19.2% 20.1%Net bad debt (net of recoveries)% of credit sales 4.5% 3.8%% of debtors 7.6% 6.5%Impairment provision % of debtors 9.8% 9.0%
Gross trade receivables per division (R’000)Mr PriceApparel
Mr PriceHome
Mr Price Sport
Miladys SheetStreet
Total 2014 Total 2013
6 months 323 152 77 769 10 661 90 721 49 767 552 070 478 88012 months 713 618 122 439 43 621 240 932 57 898 1 178 508 1 051 092 24 months 23 476 23 476 20 352
Total 1 036 770 223 684 54 282 331 653 107 665 1 754 054 1 550 324
96.6% of the debtors’ book is interest bearing (2013: 94.5%), with all of the interest free accounts being
Miladys 6 month facilities.
DIVISIONAL REVIEW

47PREVIOUS | CONTENTS | NEXT
4747
divisional performance indicatorsMr Price Mr Price Sport Miladys
Apparel Segment
Mr Price Home Sheet StreetHome
SegmentTotal
Retail sales (R'm) - incl. Franchise
2014 8 677 962 1 384 11 023 2 905 1 299 4 204 15 227
2013 7 304 843 1 293 9 440 2 633 1 193 3 826 13 266
% change 18.8 14.2 7.0 16.8 10.3 8.9 9.9 14.8
Retail sales (R'm) - excl. Franchise
2014 8 588 962 1 384 10 934 2 892 1 299 4 191 15 125
2013 7 226 843 1 293 9 362 2 618 1 193 3 811 13 173
% change 18.9 14.2 7.0 16.8 10.5 8.9 10.0 14.8
Comparable sales growth (%)
2014 13.0 6.5 7.2 11.9 8.2 5.4 7.3 10.6
2013 3.9 11.9 12.9 5.9 12.4 7.6 10.8 7.3
Retail selling price inflation (%)
2014 11.0 6.0 4.1 9.3 12.0 8.3 10.9 9.7
2013 4.0 7.7 0.5 4.4 7.0 6.6 6.9 5.1
Number of stores (year end)
Opening 384 53 189 626 150 253 403 1 029
New stores 24 9 7 40 9 19 28 68
Closures (4) (1) (5) (10) (1) (7) (8) (18)
Closing 404 61 191 656 158 265 423 1 079
Trading area - weighted average net m2
2014 248 882 48 034 60 932 357 848 138 026 49 158 187 184 545 032
2013 229 640 47 675 62 197 339 512 139 079 48 735 187 814 527 326
% change 8.4 0.8 (2.0) 5.4 (0.8) 0.9 (0.3) 3.4
Trading area - year end net m2
Opening 239 502 47 200 61 675 348 377 138 008 49 317 187 325 535 702
New stores 13 564 5 142 1 482 20 188 3 556 2 566 6 122 26 310
Expansions 3 594 - 97 3 691 290 149 439 4 130
Reductions - (1 684) (939) (2 623) (2 006) (1 105) (3 111) (5 734)
Closures (1 280) (1 080) (1 567) (3 927) (396) (1 343) (1 739) (5 666)
Closing 255 380 49 578 60 748 365 706 139 452 49 584 189 036 554 742
Sales densities (Rand per weighted average net m2)
2014 34 507 20 036 22 731 30 560 20 956 26 342 22 373 27 747
2013 31 466 17 678 20 794 27 575 18 820 24 469 20 286 24 979
% change 9.7 13.3 9.3 10.8 11.3 7.7 10.3 11.1
DIVISIONAL REVIEW

PREVIOUS | CONTENTS | NEXT
corporategovernance
Governance is about effective and ethical leadership, the outcomes of which are sustained value creation, success and longevity.
The Board subscribes to ethical leadership,
business sustainability, stakeholder inclusivity and
sound values of good corporate governance.
The governance environment is supported by the
King Code of Governance for South Africa 2009
(King III) principles and practices and the JSE
Listings Requirements. The Board recognises that
compliance with this combination of voluntary and
compulsory guidelines creates a solid governance
foundation. It details the ethical standard of
conduct required of Directors and executive
management in the discharge of their fi duciary and
governance duties and ensures that the Group
remains a sustainable and good corporate citizen.
The principles of governance are a natural
extension of our values of Passion, Value and
Partnership and have been adopted and integrated
into our business.
The supporting documents for this report which
can be found on the Group website
www.mrpricegroup.com are as follows:
• Board Charter
• Policy for the appointment of Directors
• Board Committee Mandates
• Outline of Board, Statutory and Management
Committees
• Internal Audit Mandate
• Internal Audit Annual Assurance Statement
• Business Code of Conduct
• Supplier Code of Conduct
• King III application register
• Notice of AGM
4848CORPORATE GOVERNANCE

PREVIOUS | CONTENTS | NEXT
compliance with king IIIKing III is not prescriptive but rather a series of
recommendations which can be adopted on
an “apply or explain” basis. Furthermore, we
believe in going “beyond compliance” through
the adoption, integration and embedding of the
spirit and principles of governance as opposed
to simply responding to and complying with rule
sets and recommended codes. As such, we
do not follow King III blindly, but very carefully
consider each and every aspect, even where the
JSE Listings Requirements prescribe compliance.
The Board then applies or rejects that aspect in
light of what it considers to be in the best interest
of all stakeholders. A qualitative evaluation of the
extent to which each of the 75 King III principles
has been strategically integrated into the Group’s
processes was undertaken in 2013. The outcome
of this evaluation was extremely positive. Except for
the 1 area of non-compliance and 3 areas of partial
compliance, all of which have been fully explained
in previous Annual Integrated Reports, we have
effectively adopted and integrated the principles
of King III into our business. Please refer to the
comprehensive register of King III application which
is available on the website.
Those sub-principles which the Group acknowledges not applying or partially applying for year under review can be summarised as follows:
principle sub-principle explanation for non-application
2.23: The board should delegate certain functions to well-structured committees but without abdicating its own responsibilities.
The committees should be appropriately constituted and the composition and the terms of reference should be disclosed in the integrated report.
At the Special Corporate Governance meeting held in April 2014, the Board reconsidered the position of Chairman of the Risk Committee and it concluded that Mr NG Payne, as a recognised industry expert in risk management, remained the best qualified Director to chair this Committee, despite his position as Chairman of the Board.
2.25: Companies should remunerate directors and executives fairly and responsibly.
The remuneration policy should address base pay and bonuses, employee contracts, severance and retirement benefits and share-based and other long-term incentive schemes.
The Company does not disclose the present value of long-term awards due to the varied models and unpredictable forecasting element required to determine the value of the share options upon vesting. However, full details of each award are given enabling stakeholders to value such future awards on whatever basis they deem appropriate.
9.3: Sustainability reporting and disclosure should be independently assured
Even though the entire sustainability report and disclosure are currently not independently assured, the Board is satisfied with the progress made both on the sustainability journey and with integrated reporting and is of the opinion that it remains premature to subject the entire report to an external verification at this point.
9.3: Sustainability reporting and disclosure should be independently assured
The audit committee should oversee the provision of assurance over sustainability issues.
In terms of the Audit and Compliance Committee’s charter it must ensure that a combined assurance model is applied to provide a co-ordinated approach to all assurance activities. The consolidated Annual Financial Statements, contained within the Annual Integrated Report, are audited by the external auditor and Our People and Corporate Citizenship reports are verified by internal audit.
we believe in going “beyond compliance” through the adoption, integration and embedding of the spirit and principles of governance
4949CORPORATE GOVERNANCE
PREVIOUS | CONTENTS | NEXT
JSE listingsrequirements governance principle JSE guidance mr price group response
3.84(a) The Nominations Committee must constitute only non-executive Directors, of whom the majority must be independent, and should be chaired by the Chairman of the Board of Directors.
The Nominations Committee must be chaired by the Lead Independent Director if the Board is chaired by an executive Chairman.
The Nominations Committee operates in a co-joined manner with the Remuneration Committee and the Lead IndependentDirector acts as chair. The Board did notconsider it operationally effective for theChairman of the Board to chair the Nominations aspect of this co-joined meeting.
3.84(d) The composition of such (Board) Committees, a brief description of their mandates, the number of meetings held and any other relevant information must be disclosed in the annual report.
The Risk Committee must have a minimum of three members. Membership of the Risk Committee should include executive and non-executive Directors. The Chairman ofthe Board may be a member of this Committee but must not chair it.
The Board believes that its Chairman, asa recognised industry expert in risk management, is the best qualifi ed Director to chair the Risk Committee.
JSE listings requirementsRand Merchant Bank (a division of FirstRand Bank Limited) remains the Company’s Sponsor and, among other functions, it advises the Board on compliance with the
JSE Listings Requirements.
In addition to the voluntary governance principles outlined by King III, Paragraph 3.84 of the Listings Requirements stipulate those corporate governance requirements
with which compliance is compulsory. Although respectful of the JSE’s rulings, there were 2 areas where the Board did not believe that compliance was in the best
interest of the Company. These can be summarised as follows:
companies act (71 of 2008)The Company Secretary, the Group Legal and Compliance Offi cer and the Group’s external legal advisors remain abreast of any changes to this legislation to ensure
continued compliance.
5050CORPORATE GOVERNANCE

PREVIOUS | CONTENTS | NEXT
demographics have been adjusted over the last
few years. The Group believes in the application
of holistic long-term planning to its succession
programmes. The Board holds the view that its
current succession plan allows for the scheduled
retirement of older Board members and, with the
introduction of appropriately skilled and mentored
new members, ensures the continuity of a vibrant
and knowledgeable Board.
ongoing training and development
There is an appropriate induction and mentoring
programme for new Directors. A Director skills
assessment is conducted annually, supported
by a development and succession plan. The
Directors are primarily responsible for acquiring
the skills necessary for the effective discharge of
their duties, although the Group does share in this
responsibility. To this end, an annual economic
board structureThe Group operates with a unitary Board structure.
There were no changes to the Board during the
year under review and the year-end membership of
the Board comprised 2 executive, 10 non-executive
and 3 Alternate Directors.
Although the Group no longer has an executive
Chairman, the Board has elected for Mr MR
Johnston to continue in his position as Lead
Independent Director, thereby ensuring that a
balance of power and authority remains on the
Board and that no one individual has unfettered
power of decision making. The necessity and
appropriateness for the position of Lead
Independent Director is reviewed on an annual
basis.
The alternate Directors were appointed to the
Board for 2 separate reasons. Mr SA Ellis had been
a fully appointed Director of the Board but resigned
in August 2010 as part of the restructuring which
sought to reduce the size of the Board. The Board
did not want to lose his valuable contribution, thus
he was appointed as alternate Director with the
invitation to attend meetings as and when possible.
To ensure the continuity of founding family
shareholdings and interest in the Group, the
daughter (Mrs TA Chiappini-Young) and son-in-law
(Mr N Abrams) of the Honorary Chairmen were
appointed as alternate Directors in August 2010.
The intention is for them to become full Directors
upon the retirement of the Honorary Chairmen.
The qualifications of each Director and their brief
CV’s are detailed on pages 75 and 76.
board charterThe Board operates in terms of a formal charter,
the purpose of which is to regulate business in
accordance with sound corporate governance
principles. Furthermore, it seeks to ensure that
these principles are applied in all dealings by
Directors, in respect of, and on behalf of, the
Company. The charter sets out the specific
responsibilities to be discharged by the Board
members collectively and individually, and was
reviewed and updated at the Special Corporate
Governance meeting of the Board in April 2014.
The full charter can be found on the Group’s
website.
board appointmentsAll appointments to the Board are made in terms
of a formal policy, after taking into account the
skills requirement for the Board and the philosophy
of maintaining a vibrant Board that constructively
5151
challenges management’s strategies and evaluates
performance against established benchmarks.
There is a preponderance of non-executive
Directors, the majority of whom are independent,
with the only executive Directors being the CEO
and the CFO. The objective is to maintain a good
representation of retail experience, to ensure that
business strategies remain robust and sustainable,
value creation and performance are enhanced
and effective management of key risks is enabled.
Consideration is also given to the contribution
afforded by skills and experience in other disciplines
which strengthen the decision making abilities
of the Board. The policy for the appointment of
Directors can be viewed on the Group’s website.
The Board is satisfied that it is operating at its
optimal size, with an appropriate weighting of
non-executive to executive Directors. Furthermore,
there is an appropriate balance of retail and non-
retail skills and the age profile, racial and gender
CORPORATE GOVERNANCE

CORPORATE GOVERNANCE
update is facilitated and any relevant briefings or
presentations are disseminated during the course
of the year.
Independence
An evaluation of non-executive Directors, in terms of
the independence criteria set out in King III and the
requirements of the Companies Act, was conducted
at the Special Corporate Governance meeting of the
Board in April 2014.
The following Directors were accepted as being
independent:
• Mr MR Johnston
• Mrs RM Motanyane
• Ms D Naidoo
• Mr NG Payne
• Mr MJD Ruck
• Mr WJ Swain
• Mr M Tembe.
It was agreed that the following Directors should
not be classified as independent:
• The Honorary Chairmen, Messrs SB Cohen
and LJ Chiappini, on account of their material
shareholdings
• Mr K Getz, who acts as a professional advisor
to the Company.
Sub principle 66 of principle 2.18 of King III states
that:
“An independent Director should be independent in
character and judgement and there should be no
relationships or circumstances which are likely to
affect, or could appear to affect this independence.
Independence is the absence of undue influence
and bias which can be affected by the intensity
of the relationship between the Director and the
Company rather than any particular fact such as
length of service or age.”
In this regard, the Board agreed that, although not
classified as independent, Messrs Cohen, Chiappini
and Getz do act independently in their service to
the Board.
The potential impact that the length of service
of a Director has on their independence was
considered in respect of Messrs Johnston and
Swain, in the form of a more robust evaluation
than was applied to other independent Directors.
It was concluded that both Directors remain
independent. Furthermore, the cyclical nature
of retail necessitates the need for Directors with
long-serving Board experience. It is therefore not
practical, nor in the best interest of its stakeholders,
for Directors with more than 9 years service to
resign from the Board or to automatically lose their
“independent” status.
information and communication
The Board is supplied with timely and relevant
information in a form and of a quality appropriate
to enable it to discharge its duties and to enable
it to assess the Group’s quantitative performance
and consider other qualitative performance issues.
Non-executive Directors are made aware of any
relevant developments in the affairs of the Group
and receive comprehensive monthly trading reports
and annual strategy and risk management reviews
by the trading and support divisions. Furthermore,
the non-executive Directors are welcome to attend
any merchandise window reviews held during the
year. To fulfil their responsibilities, Directors have full
and unrestricted access to Group information and
personnel and can seek independent professional
advice at the Group’s cost, in accordance with the
Board Charter. All Directors have access to the
advice and services of the Company Secretary and
unrestricted access to the Chairman.
employment contracts
The Honorary Chairmen, as founders of the Group,
continue to participate in the business and give
guidance and direction in general and on strategy,
merchandise and Group culture in particular. They
attend most Committee meetings as observers/
invitees and offer substantial input. The Board
has determined that their contribution should be
financially rewarded and they therefore operate
within the framework of employment contracts.
Their remuneration is revised annually, to take into
account the planned, gradual reduction of their
involvement over time. Details of the remuneration
received can be viewed in the Remuneration
Report on page 63. No Directors have fixed-term
employment contracts.
rotation
In accordance with the requirements of the
Companies Act and the Group’s Memorandum of
Incorporation, one third of non-executive Directors
retire by rotation every year, at which time they may
be considered for re-election at the Annual General
Meeting. At the 2013 Annual General Meeting, 4
Directors retired by rotation and were approved
for re-election by shareholders. In addition, the
3 alternate Directors retired and were approved
for re-election by shareholders. The names of the
Directors retiring by rotation in the current financial
year can be located in the Notice of Meeting in the
Annual Results booklet.
conflicts of interest and share dealings
The matter of conflicts of interest is a standing
Board agenda item and a register of all Directors’
company shareholdings, other directorships and
information regarding any potential conflict of
interest is tabled at each meeting. Directors are
required to recuse themselves from discussion on
any matters in which they may have a conflict of
interest.
Non-executive Directors cannot participate in the
Group’s share incentive schemes. Furthermore,
before dealing in Company shares, Directors
are obliged to obtain the written consent of the
Chairman or (should the Chairman be involved in a
transaction) the Lead Independent Director.
PREVIOUS | CONTENTS | NEXT
5252
PREVIOUS | CONTENTS | NEXT
performance reviews The Board undertakes an annual series of
assessments so as to monitor performance and
identify areas for improvement. These assessments
can be summarised as follows:
board assessment
This is conducted on a bi-annual cycle. Every
second year a full review and assessment of
the Board’s activities is undertaken by all Board
members. From this assessment, a “Steps for
Improvement” document is generated. In the
alternate years, the Board assesses their
performance against the Steps document. A full
Board assessment was undertaken in January
2013, with the Steps document being approved
by the Board at the Special Corporate Governance
Meeting in March 2013. A review against the Steps
to address any pertinent matters was in progress
at year end.
committee evaluations
The Board Committees follow the same bi-annual
cycle as the Main Board with a Steps assessment
being conducted in the year under review. The
exception to this was the Social, Ethics,
Transformation and Sustainability Committee which
did not undertake an assessment due to its relative
infancy. It will be included in the full committee
assessment process to be undertaken in the latter
part of 2014.
chairman evaluation
A full performance evaluation of Mr NG Payne’s
performance as Chairman was undertaken at the
beginning of 2013. Any suggestions for
improvement were communicated to Mr Payne by
the Lead Independent Director. By year end, the
Lead Independent Director was in the process of
approaching each Director individually to ascertain
if the suggested improvements had been made and
to request comment on any additional aspects of
Mr Payne’s performance. Any further suggestions
for improvement would be communicated to the
Chairman by the Lead Independent Director.
peer and self-evaluation
In a similar fashion to the Chairman, the full
self-assessment and peer evaluation process
conducted on the non-executive Directors in 2013
was supported by a follow up review conducted
by the Lead Independent Director with each
Director individually. Any further suggestions for
improvement would be communicated by the
Chairman and the Lead Independent Director.
company secretary evaluation
During the year under review, and in compliance
with paragraph 3.84(i) and (j) of the JSE Listings
Requirements, the Board evaluated Mrs HE
Grosvenor, the Company Secretary, and is
satisfied that she is competent, suitably qualified
and experienced. Furthermore, since she is not a
Director, nor is she related to or connected to any of the Directors, thereby negating a potential conflict of
interest, it was agreed that she maintains an arm’s length relationship with the Board.
board meetingsThe Board meets at least 4 times annually to conduct its regular business and is responsible for the Group’s
overall strategic direction and control. The last meeting of the financial year is usually held in March but due
to internal and external commitments, the Board was only able to meet on 1 and 2 April 2014. An annual
Special Corporate Governance meeting, under the chairmanship of the Lead Independent Director, has
historically been held in March but from the 2015 financial year it will be held in November. The purpose of
the Special Corporate Governance Meeting is to:
• Review and approve the Board Charter
• Review and approve the mandates of the various statutory and Board Committees, Internal Audit and the
IT Divisional Board Committee
• Consider the independence of Directors
• Consider the re-appointment of Directors retiring by rotation
• Confirm the appointment of the Board Chairman
• Propose the Chairman and members of the Audit and Compliance Committee
(subject to approval of the membership of this Committee by shareholders at the Annual General Meeting)
• Confirm the Chairman and members of other Committees for the forthcoming financial year
• Define levels of materiality, reserving specific powers to the Board and delegating other matters with the
necessary written authority to management
• Review and approve the Business Code of Conduct
• Evaluate the Company Secretary in terms of the JSE Listings Requirements
• Review the level of the Group’s compliance with the King III and JSE Listings Requirements governance
principles.
5353CORPORATE GOVERNANCE

PREVIOUS | CONTENTS | NEXT
attendance of directorsat board and committee meetings
director status board
special corporate
governance
audit and compliance committee
risk committee
remuneration and
nominations committee
social, ethics, transformation
and sustainability
committee
SI Bird executive 4/4 1/1 4/4
MM Blair executive 4/4 1/1 4/4
LJ Chiappini non-executive 3/4 0/1
SB Cohen non-executive 4/4 1/1
K Getz non-executive 4/4 1/1 4/4 4/4
MR Johnston independent non-executive 4/4 1/1 4/4 4/4
RM Motanyane independent non-executive 4/4 1/1 4/4
D Naidoo independent non-executive 4/4 1/1 3/4
NG Payne independent non-executive 4/4 1/1 4/4 4/4
MJD Ruck1 independent non-executive 4/4 1/1 4/4 2/2 4/4
WJ Swain independent non-executive 4/4 1/1 4/4 4/4 4/4
M Tembe independent non-executive 4/4 1/1 4/4
N Abrams 2 alternate non-executive 2/4 1/1
TA Chiappini-Young 2
alternate non-executive 3/4 0/1
SA Ellis 2 alternate executive 4/4 1/1
1 Appointed to the Risk Committee effective October 20132 Alternate Directors are not required to attend every meeting
non-attendance of meetings by directorsGenerally, all Directors attend the Annual General
Meeting and are available to answer shareholders’
questions. Alternate Directors are not required
to attend each meeting. Mr N Abrams (UK) was
kept updated on Board issues by receiving all
Board meeting documentation. Ms D Naidoo
was unable to attend the August Audit and
Compliance Committee meeting due to out-of-
town commitments. Mr LJ Chiappini and
Mrs TA Chiappini-Young had overseas
commitments at the time of the April 2014
meetings. Mr MD Ruck joined the Risk Committee
for the second half of the year.
prescribed officersAs per the requirements of the Companies Act, the
Board determined that the prescribed officers are
the CEO, Mr SI Bird and the CFO, Mr MM Blair.
These individuals exercise general executive control
and management of the business and all divisional
heads report directly to them.
5454CORPORATE GOVERNANCE

PREVIOUS | CONTENTS | NEXT
codes of conductDirectors and associates are required to maintain
the highest ethical standards. On joining the Group,
every associate receives a copy of the Business
Code of Conduct and is required to sign as
acknowledgement of acceptance of the Code. On
an annual basis, all senior associates of the Group
are required to submit a declaration confirming
their continued compliance with the Code. Any
areas of non-compliance or any perceived conflicts
of interest are addressed through the appropriate
levels of divisional management, with ultimate
reporting to the CEO and Board. The Code, which
has been updated during the year under review
and was approved at the Special Corporate
Governance meeting in April 2014, is located on
the Group’s website.
The Supplier Code of Conduct, setting standards
and practices to which the Group expects its
suppliers to adhere, is currently being updated to
take into account the requirements of the Ethical
Trading Initiative and to allow for greater focus on
the environmental and social impact of trade. The
code is located on the Group’s website.
closed and prohibited periodsThe Group operates a closed period policy in
line with the JSE Listings Requirements and the
Financial Markets Act (19 of 2012). During the
defined closed periods, Directors, officers and
other selected associates are prohibited from
dealing in the Company’s shares. Associates who
may have access to confidential or price-sensitive
information are cautioned against the possibility
of insider trading. Regard is also had to other JSE
Listings Requirements in respect of the dealings of
Directors in the Company’s shares.
governance andassuranceAs Head of Governance and Assurance, Mrs
S Moodley is responsible for the strategic
leadership of the Company Secretariat, Enterprise
Risk Management, Legal and Compliance and
Internal Audit functions. This consolidated and
holistic approach to governance has improved
the integration of strategy, risk management and
sustainability.
A robust model of combined assurance has
been adopted in recognition of the need for a
co-ordinated approach to risk management to
allow for the effective management, monitoring
and mitigation of key risks. The model clarifies the
roles and co-ordinates the efforts of management,
internal assurance providers and independent
assurance providers. In addition, it increases
collaboration and facilitates a shared and more
holistic view of the Group’s risk profile. Internal
Audit plays a vital role as an independent 3rd line of
defense.
The independence, organisational positioning and
scope and nature of work of the Governance and
Assurance Division were evaluated by the Audit and
Compliance and Risk Committees in April 2014
and determined to be appropriate and consistent
with the approved combined assurance model. In
addition it has been confirmed that there were no
impairments to the independence or objectivity of
the assurance provided by Internal Audit as a result
of the consolidated structure, and that in fact this
structure had the desired effect of strengthening
the Group’s assurance framework. Refer to the
Internal Audit annual assurance statement, on page
59.
statutory, board and management committeesTo assist the Board in discharging its responsibilities for corporate governance, it functions with 2 Board
Committees and 2 Statutory Committees. The statutory and non-statutory obligations of each Committee
are constantly being reviewed to reduce overlap and prevent governance fatigue. Details of the composition
and key achievements of each Committee can be located in the following sections of this Annual Integrated
Report:
The Board believes that, in respect of the business specifically reserved for its decision, it has satisfactorily discharged its duties and responsibilities during the year under review.
An outline of the Board, Statutory and Management Committee structures, together with the mandates/
charters of the respective Committees, can be located on the Group’s website.
committee name page
Risk Committee 56
Audit and Compliance Committee 58
Social, Ethics, Transformation and Sustainability Committee 61
Remuneration and Nominations Committee 63
5555CORPORATE GOVERNANCE
56PREVIOUS | CONTENTS | NEXT
56RISK COMMITTEE REPORT
The Board of Directors is accountable and
responsible for the governance of strategy and risk,
and is satisfied that the Group’s management has:
• Integrated and aligned strategy, risk
management, performance and sustainability
• Implemented an effective risk management
system, which enables the effective
identification, assessment and responses to
risks and opportunities
• Managed risks within the approved appetite and
tolerance levels
• Embedded risk management into the day-
to-day activities of the Group.
board commitmentThe Board is committed to business sustainability
and to creating and preserving stakeholder value.
It recognises that the governance of strategy, risks/
opportunities and performance are critical success
factors and, therefore, exercises active oversight
over these processes in order to ensure that the
achievement of its strategic objectives is enabled.
compositionThe Risk Committee, established in May 2010,
operates in terms of a formal mandate. The
Committee is comprised of the following Directors:
• Mr NG Payne (Chairman) Independent
non-executive Director
• Mr WJ Swain Independent non-executive
Director
• Mr M Ruck Independent non-executive
Director
• Mr SI Bird Executive Director
• Mr MM Blair Executive Director
The Committee mandate is published on the
Group’s website www.mrpricegroup.com
roleThe Committee has an independent and advisory
role with accountability to the Board. The purpose
of the Committee is to assist the Board to fulfill its
corporate governance responsibilities relating to the
governance of risk.
The Committee is responsible for overseeing risk
governance (including the risk appetite and
monitoring the effectiveness of the risk
management framework and processes. The
Committee reviews key opportunities and risks,
assesses risk mitigation plans and reports back
to the Board. The Committee gives due
consideration to the legitimate and fair expectations
of all key stakeholders, resource constraints,
external pressures and the drivers of the Group’s
sustainability.
Management is accountable to the Board for
designing, implementing and monitoring the
process of risk management and integrating it into
the day-to-day activities of the Group. Management
is also accountable for building the competencies
and capacity required for a sustainable business.
RISKcommittee
report

57PREVIOUS | CONTENTS | NEXT
57
risk governance and managementDuring the year under review, the Committee
fulfilled its mandate by meeting 4 times to discuss
the following key issues:
Risk Appetite
The Board recognises that a well-defined risk
appetite is the core instrument for aligning overall
corporate strategy, capital allocation, risk and
performance. Risk appetite and tolerance are the
fundamental concepts that provide the context for
strategy setting, entrepreneurial behaviour and the
pursuit of Group objectives. It is informed by the
Group risk culture and clarifies what risks the Group
can, or is willing to, take and the risks that the
Group will avoid. Risk appetite and risk tolerance
are inextricably linked to performance over time.
The Board has formally defined its appetite for
risk, and an enhanced strategic risk appetite
framework and policy was developed, approved
and successfully implemented during the year. The
Committee confirms that this policy has enabled
increased consideration of risk capacity, system/
process maturity and overall risk capability in
relation to the key strategic, financial, operational
and compliance focus areas of the Group; and
that the enhanced policy is being increasingly
referred to, including in the development of related
governance polices.
The Committee confirms that there were no
material deviations from the Group’s risk appetite in
the period.
Risk Profile
The Board is satisfied that strategy and business
plans do not give rise to risks that have not been
thoroughly assessed by management and confirms
that there were no undue, unexpected or unusual
risks taken by the Group and no material losses
were incurred during the year.
Key Business Risks and Opportunities
Key business opportunities and risks were
discussed comprehensively by the Committee
during the year. The Committee, having considered
the Group’s key risks, is satisfied that the systems
and processes in place to manage risk are
adequate and that management has generally
executed their risk management responsibilities
satisfactorily.
Enterprise-wide Risk Management (ERM)
The Committee, having evaluated the ERM
Framework, which is based on ISO 31000 and
Committee of Sponsoring Organisations (COSO),
is satisfied that it is adequate, and if consistently
applied, should guide the Group’s approach to
identifying, evaluating and responding to key
opportunities and risks that may impact on
strategic objectives.
The Group recognises that a co-ordinated
approach to risk/opportunity management is
needed in order to create and sustain value in the
longer-term and to enable the achievement of its
vision.
For this reason, the Group has adopted the globally
recognised, three-lines-of-defence Combined
Assurance Model. The model optimises the skills
and expertise of management, second-line-of-
defence functions and assurance providers to
increase collaboration and to facilitate a shared
and more holistic view of the Group’s risk profile.
The Committee confirms that all key strategic risks
were assured by at least 1 of the 3 lines of defence
functions.
RISK COMMITTEE REPORT
58PREVIOUS | CONTENTS | NEXT
58AUDIT AND COMPLIANCE COMMITTEE REPORT
Mr Price Group remains committed to the principles of good governance, ethical leadership and exemplary corporate citizenship. To this end, the Audit and Compliance Committee assists and supports the Board in discharging its duties.
audit and compliance committee report
compositionThe Committee is constituted as a statutory Mr
Price Group Limited Committee in respect of its
duties in terms of section 94(7) of the Companies
Act (71 of 2008), and has been delegated the
responsibility to provide meaningful oversight,
particularly over the audit, finance, IT and
compliance functions.
The Committee is comprised of the following 4
Directors:
• Mr WJ Swain (Chairman) Independent non-
executive Director
• Mr MR Johnston Independent non-executive
Director
• Ms D Naidoo Independent non-executive
Director
• Mr MJD Ruck Independent non-executive
Director
role• Assists the Board to discharge its responsibility
to:
- safeguard the Group’s assets,
- operate adequate and effective systems of
internal control, financial risk management
and governance
- prepare materially accurate financial
reporting information and statements in
compliance with applicable legal/
regulatory requirements and accounting
standards
- monitor compliance with laws and regulations
- provide oversight of the external and internal
audit functions and appointments.
• Provides a communication channel between the
Board, the internal and external auditors and
other assurance providers
• Assists the Board, in conjunction with the Risk
Committee, to monitor management’s system of
controls, particularly over enterprise-wide risks.
The Committee mandate is published on the
Group’s website www.mrpricegroup.com
annual report of the committeeDuring the year under review, the Committee
fulfilled its mandate by meeting 4 times to deal
with comprehensive agendas. It received the
appropriate information from internal audit, external
audit, management and other sources deemed
necessary to fulfill its obligations. Pursuant to these
activities and the investigations it conducted, the
Committee can report satisfaction with the external
auditor’s independence and established principles
governing the auditor’s employment for non-audit
services.
having given due consideration, the committee believes that:• Mr MM Blair, who is the Financial Director
and carries the title of Chief Financial Officer,
possesses the appropriate expertise and
experience to meet his responsibilities
and that the Company’s financial function
incorporates the necessary expertise, resources
and experience to adequately carry out its
responsibilities
• The Company’s accounting practices and
the effectiveness of the internal controls have
been maintained at a high standard and fully
support the accuracy of the financial and related
information presented to stakeholders in the
integrated report
• It has satisfactorily carried out its obligations in
terms of its mandate
• It can confirm that there were no material
or frequently repeated instances of non-
compliance by either the Group or the Directors
during the year
• The Designated Auditor attended a meeting of
the Committee not more than a month before
the Board met to approve the integrated report
to discuss matters of importance to the auditor
and the Committee regarding the Company’s
financial statements and general affairs.
The Directors believe that the Committee has
satisfied its responsibilities under its mandate.
Under the sponsorship of the Committee’s
Chairman, a self-evaluation assessment was
undertaken during the year and action to address
certain issues requiring attention was determined.
The Chairman of the Committee, Mr WJ Swain,
attends the Annual General Meeting and is available
to answer shareholders’ questions.

59PREVIOUS | CONTENTS | NEXT
59
The Group Internal Audit Division (Internal
Audit) was established to assist the Board and
executive management with the achievement
of their objectives and has remained a vital
part of the Group’s governance and combined
assurance structures. Internal Audit is the primary
independent assurance provider on the adequacy
and effectiveness of the Group’s governance, risk
management and control structures, systems and
processes. The centralised division operates in
terms of a formal mandate, in full conformance to
the International Professional Practices Framework
for Internal Audit (Standards) and with leading risk-
based and integrated methodology.
professional positioningand recognitionInternal Audit has been subjected to 2 independent
external quality assessment reviews (QAR), in 2007
and 2011. It was recognised as the first internal
audit activity in South Africa with full conformance
to all Standards; and in 2011 was confirmed as the
INTERNAL AUDIT REPORT
only activity in South Africa with the exceptional
rating of full conformance in an independent
external quality review. This result placed the
Internal Audit activity in the top QAR results
globally. The independent external QAR team
recognised that:
• “This level of operations could only have been
sustained by a combination of strategic
leadership of Internal Audit, an alignment of
interests and incentives; the maturity and mutual
respect of the Audit and Compliance
Committee, executive and senior management
and the external auditor towards Internal Audit;
and Internal Audit’s ability to consistently deliver
a highly professional audit product over time”.
• “Internal Audit has continued to be a leading
professional activity, characterised by
innovation, development of leading practices
ahead of the theory or requirements to do
so, wide integration of global best practices
and unequivocally demonstrating a commitment
to upholding the Standards”.
internal auditreport
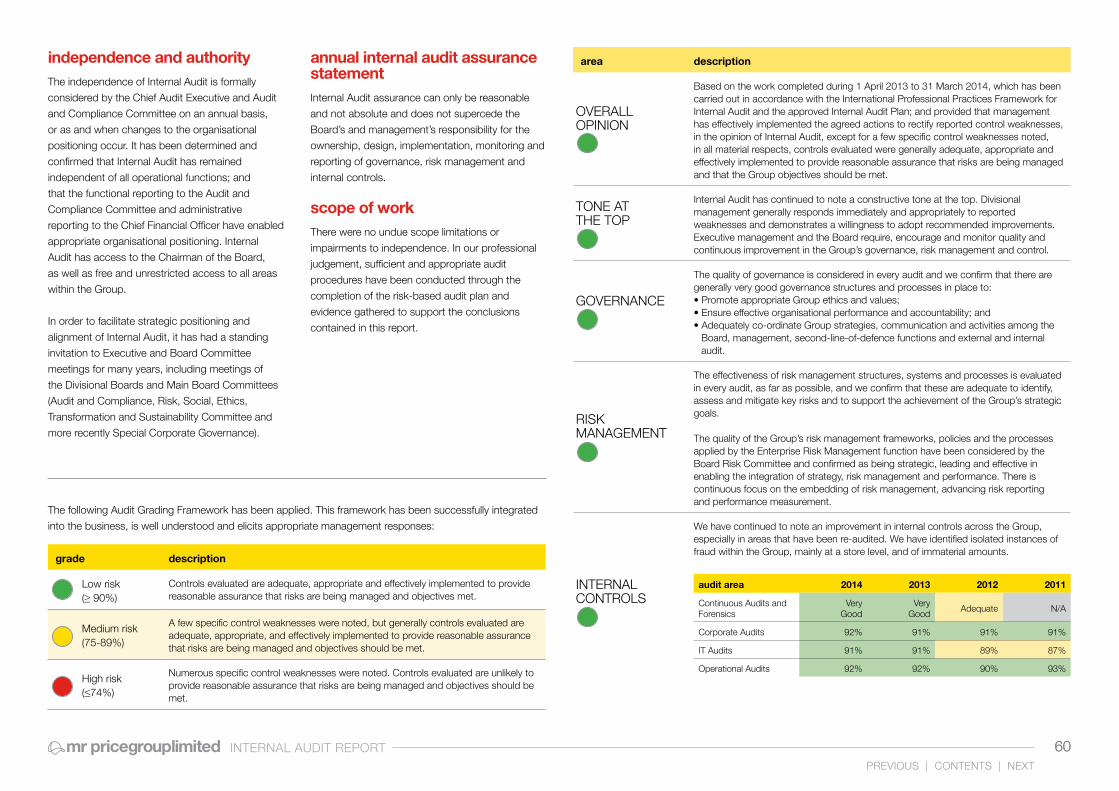
60PREVIOUS | CONTENTS | NEXT
60INTERNAL AUDIT REPORT
The following Audit Grading Framework has been applied. This framework has been successfully integrated
into the business, is well understood and elicits appropriate management responses:
area description
Based on the work completed during 1 April 2013 to 31 March 2014, which has been carried out in accordance with the International Professional Practices Framework for Internal Audit and the approved Internal Audit Plan; and provided that management has effectively implemented the agreed actions to rectify reported control weaknesses, in the opinion of Internal Audit, except for a few specific control weaknesses noted, in all material respects, controls evaluated were generally adequate, appropriate and effectively implemented to provide reasonable assurance that risks are being managed and that the Group objectives should be met.
Internal Audit has continued to note a constructive tone at the top. Divisional management generally responds immediately and appropriately to reported weaknesses and demonstrates a willingness to adopt recommended improvements. Executive management and the Board require, encourage and monitor quality and continuous improvement in the Group’s governance, risk management and control.
The quality of governance is considered in every audit and we confirm that there are generally very good governance structures and processes in place to:• Promote appropriate Group ethics and values;• Ensure effective organisational performance and accountability; and• Adequately co-ordinate Group strategies, communication and activities among the
Board, management, second-line-of-defence functions and external and internal audit.
The effectiveness of risk management structures, systems and processes is evaluated in every audit, as far as possible, and we confirm that these are adequate to identify, assess and mitigate key risks and to support the achievement of the Group’s strategic goals.
The quality of the Group’s risk management frameworks, policies and the processes applied by the Enterprise Risk Management function have been considered by the Board Risk Committee and confirmed as being strategic, leading and effective in enabling the integration of strategy, risk management and performance. There is continuous focus on the embedding of risk management, advancing risk reporting and performance measurement.
We have continued to note an improvement in internal controls across the Group, especially in areas that have been re-audited. We have identified isolated instances of fraud within the Group, mainly at a store level, and of immaterial amounts.
grade description
Low risk (≥ 90%)
Controls evaluated are adequate, appropriate and effectively implemented to provide reasonable assurance that risks are being managed and objectives met.
Medium risk (75-89%)
A few specific control weaknesses were noted, but generally controls evaluated are adequate, appropriate, and effectively implemented to provide reasonable assurance that risks are being managed and objectives should be met.
High risk (≤74%)
Numerous specific control weaknesses were noted. Controls evaluated are unlikely to provide reasonable assurance that risks are being managed and objectives should be met.
audit area 2014 2013 2012 2011
Continuous Audits and Forensics
VeryGood
VeryGood
Adequate N/A
Corporate Audits 92% 91% 91% 91%
IT Audits 91% 91% 89% 87%
Operational Audits 92% 92% 90% 93%
OVERALL OPINION
TONE ATTHE TOP
RISKMANAGEMENT
INTERNALCONTROLS
GOVERNANCE
independence and authorityThe independence of Internal Audit is formally
considered by the Chief Audit Executive and Audit
and Compliance Committee on an annual basis,
or as and when changes to the organisational
positioning occur. It has been determined and
confirmed that Internal Audit has remained
independent of all operational functions; and
that the functional reporting to the Audit and
Compliance Committee and administrative
reporting to the Chief Financial Officer have enabled
appropriate organisational positioning. Internal
Audit has access to the Chairman of the Board,
as well as free and unrestricted access to all areas
within the Group.
In order to facilitate strategic positioning and
alignment of Internal Audit, it has had a standing
invitation to Executive and Board Committee
meetings for many years, including meetings of
the Divisional Boards and Main Board Committees
(Audit and Compliance, Risk, Social, Ethics,
Transformation and Sustainability Committee and
more recently Special Corporate Governance).
annual internal audit assurance statementInternal Audit assurance can only be reasonable
and not absolute and does not supercede the
Board’s and management’s responsibility for the
ownership, design, implementation, monitoring and
reporting of governance, risk management and
internal controls.
scope of workThere were no undue scope limitations or
impairments to independence. In our professional
judgement, sufficient and appropriate audit
procedures have been conducted through the
completion of the risk-based audit plan and
evidence gathered to support the conclusions
contained in this report.

SOCIAL, ETHICS, TRANSFORMATION AND SUSTAINABILITY COMMITTEE REPORT
Social, Ethics, Transformation and SustainabilityCommittee ReportIn compliance with the requirements of the
Companies Act (71 of 2008), the Social, Ethics,
Transformation and Sustainability Committee was
established in March 2012 and held its inaugural
meeting in May 2012.
It operates in terms of a formal mandate, which
contains detailed provisions relating to the terms
of reference, duties, composition, role and
responsibilities of the Committee.
the committee is comprised of the following directors:• Mr K Getz (Chairman)
Non-executive Director
• Mr M Tembe
Independent non-executive Director
• Mrs RM Motanyane
Independent non-executive Director
In addition, all Board members are permanent
invitees to meetings and this invitation is duly
taken up on occasion by certain Board members
(including by the Board Chairman and CEO).
The following senior executives were permanent
attendees at the meeting:
• Mrs VT Botha-Richards Corporate
Services and Sustainability Executive
• Mrs N Ambrosio Sustainability Manager
• Mrs T Clarke Group Legal and
Compliance Officer
• Mr S Glendinning Group People Director
• Mrs HE Grosvenor Company Secretary
• Mrs S Moodley Head of Governance
and Assurance
61PREVIOUS | CONTENTS | NEXT
61

62PREVIOUS | CONTENTS | NEXT
62
Statutorily, the Committee is responsible for
monitoring the Group’s activities as per the
Companies Act with regard to matters relating to:
• Social and economic development
• Good corporate citizenship
• Environment, health and public safety
• Consumer relationships
• Labour and employment practices.
The Committee incorporates the responsibility to
draw matters within its mandate to the attention
of the Board and to shareholders of the Company.
It can be viewed on the Group’s website: www.
mrpricegroup.com
meetingsThe Committee met 4 times during the year,
although the fi nal meeting was held 3 days post
year end. Meetings are convened and conducted
in terms of a detailed agenda accompanied by
supporting documents, minutes of 4 supporting
management sub-committees and reports of the
permanent attendees. These representations
cover the core mandate of the Committee and
serve as a material tool used by the Committee to
monitor its responsibilities.
The Committee actively engages with
management during these presentations.
Matters considered by the Committee (and
reported to the Board) include:
• Oversight of the comprehensive updating of
the Group’s Business Code of Conduct to be
more refl ective of the values of the Group.
• Approval of the Group’s membership
application to the Ethical Trading Initiative.
• Oversight of the alignment of the Group’s
Supplier Code of Conduct with the Ethical
Trading Initiative Base Code.
• Monitoring and assessing of the Group’s
transformational progress (including
consideration of the Employment Equity Act,
the Broad-Based Black Economic
Empowerment Act and the supporting Codes
of Good Practice). The Committee is materially
assisted in monitoring transformation by the
Executive Transformation Committee, chaired
by the CEO, and the input of the Board.
• Report on the Group’s compliance with
applicable legislation, codes of good practice
and other legal requirements. This included a
review of the Group’s exposure to anti-
corruption legislation.
• Review and monitoring of the Group’s
environmental sustainability strategy and the
execution thereof.
• Review of the social sustainability initiatives
undertaken by RedCap Foundation and
RedCap Sport. (Post the year end, RedCap
Sport was incorporated into RedCap
Foundation). The details of the projects
undertaken can be located on the website
www.redcapfoundation.org
• Monitoring of matters relating to its statutory
obligation and good corporate governance and
corporate citizenship
• Approval of the Group’s participation in 2 dti
funded competitiveness clusters.
As the Committee has now been in operation
for more than 18 months, it is in a position to
undertake a meaningful self-evaluation. This
will be conducted in time for the November
2014 Special Corporate Governance Meeting.
The Committee believes that the Group is
substantively addressing the issues monitored by
the Committee, in terms of its statutory mandate
and the additional mandates referred to it by the
Board, in a benefi cial and positive manner. Refer
to Our Corporate Citizenship report on page
24 for more details around transformation and
sustainability.
As Chairman of the Social, Ethics, Transformation
and Sustainability Committee, Mr K Getz will be
available at the Annual General Meeting to answer
any questions relating to the statutory obligations
of the Committee.
SOCIAL, ETHICS, TRANSFORMATION AND SUSTAINABILITY COMMITTEE REPORT
The Committee is responsible for assisting the Board with the monitoring and reporting of social, ethical, transformational and sustainability practices that are consistent with good corporate citizenship, as well as assisting the Group in discharging its business responsibilities in relation thereto.

REMUNERATION REPORT
The Remuneration Report provides an overview of the Group’s remuneration philosophy, policy, practices and governance, with particular focus on the remuneration payments to the executive and non-executive Directors.
remunerationreport
remuneration governance structure
board
The Board is ultimately responsible for the Group’s
remuneration policy and applies it with the
assistance of the Remuneration and Nominations
Committee.
remuneration and nominations committee
The Committee oversees the remuneration
of executive Directors and divisional executives and
operates according to a formal Board mandate,
which can be found at www.mrpricegroup.com
Meeting attendance is disclosed in the Corporate
Governance Report on page 48. Other executive
and non-executive parties attend the Committee
meetings where appropriate, but no individual is
present when their remuneration is discussed.
The Chairman attends the Annual General Meeting
(AGM) and is available to answer shareholders’
questions regarding the remuneration policy, its
application and the Committee’s activities.
63PREVIOUS | CONTENTS | NEXT
63

64PREVIOUS | CONTENTS | NEXT
64
The Committee met 4 times during the year under
review. In respect of its nominations activities,
the philosophy guiding the Committee on Board
appointments and annual evaluations are outlined
in the Corporate Governance Report on page 48.
In satisfying its mandate in remuneration focused
matters, the main activities undertaken were to:
• Approve base increases for general staff and
senior management
• Approve, on the basis of the market benchmark
exercise undertaken, the executive Director and
divisional executive management remuneration,
including the basis for determination of
incentives
• Propose non-executive Director fees for
consideration by shareholders at the AGM
• Update letters of appointment relating to the
non-executive Directors
• Review employment contracts of the Honorary
Chairmen and approve remuneration payable in
terms of the contracts
• Review the performance of the Chairman,
executive Directors and divisional management
• Conduct an annual self-evaluation review, from
which steps and targets for the improvement of
processes and operational methods were
agreed
• Review the Human Capital Management Project
progress, which addresses the Group’s most
crucial needs through the implementation of the
workforce management, learning management
and payroll solutions
• Review the effi cacy of the existing share
schemes and propose changes, including
the introduction of Forfeitable Share Plans
(FSP’s)
• Review all new share and share option
allocations under the various share schemes in
operation
• Review the impact of labour legislation
amendments and the introduction of various
new employment contract types
• Review and update the mandate for approval at
the Special Corporate Governance meeting in
April 2014
• Review the 2014 Remuneration Report for
inclusion in the Annual Integrated Report and
subsequent to its publication, respond to
queries and comments received from
shareholders or their representatives who
identifi ed opportunities to improve the
determining methodology and future disclosure.
people division
The People Division is responsible for implementing
and monitoring human resources policies and
processes and the People Director attends
Divisional Board meetings, reporting directly to
the CEO. Key responsibilities include researching
market trends in employee remuneration,
benchmarking remuneration policies and practices
to retail and other sectors and making remuneration
recommendations to management. The main
activities undertaken during the year under review
were:
• Maintaining personalised communications to
every associate including an analysis of their
total cost-to-company. This has allowed
associates to fully understand the true value and
benefi t of their employment contract with the
Company and is a key retention mechanism
• Evaluating certain aspects of the annual
Culture Survey and discussing areas for
improvement with associates in “Solutions
Café’s”
• Communicating share scheme changes to
associates and, where requested, the
provision of externally conducted personal
fi nancial counselling for those associates
receiving substantial share scheme payouts
• Conducting ongoing remuneration
benchmarking for Support and Group Head
Offi ce positions in conjunction with PwC
RemChannel
• Staff contracts in operations were brought in
line with new employment legislation
• The Dayforce workforce management system
has been implemented to improve store
effi ciency. This greatly enhances the staff
scheduling capabilities of store managers and
will lead to gains in productivity and diminished
labour costs
• The new VIP Payroll system has been
implemented to enable improved payroll
processes and procedures, which provides
upgraded functionality in the processing and
administration of pay and incentive schemes
• The Cornerstone learning management system
is being implemented, contributing to employee
self-service functionality.
REMUNERATION REPORT

65PREVIOUS | CONTENTS | NEXT
65
remuneration philosophyDriven by the principles of Passion, Value and
Partnership, the Group culture encourages and
incentivises high performance as the key driver of
business success. An entrepreneurial management
style is encouraged, providing all associates with
the room to innovate and grow, effectively enabling
ordinary people to achieve extraordinary things.
The ability to attract, retain and motivate competent
people is critical to the Group’s continued growth
and long-term sustainability and is therefore
the core of the remuneration philosophy. This
philosophy aims to create partnerships with
associates in their journey of continued growth
through market-related base pay and benefits,
attractive performance-driven short-term (bonuses)
and long-term (share schemes) incentives and
recognition and reward programmes.
Being a value retailer, the Group aims to pay basic
salaries and benefits at the market median.
In the case of newly appointed associates whose
remuneration is below the median, the intention is
that adjustments will be made to raise them to the
median over a 3 year period, commensurate with
their increased experience. Where the Group needs
to urgently attract core skills, pay above the median
is considered, as long as internal equity is not
disrupted and the Group’s commitment to ensuring
the right candidate fit is achieved.
Associates are provided with the opportunity to earn well above the median through generous incentives. This
is achieved by reaching stretch performance targets, whereby associates’ efforts are aligned with strong corporate performance and increased shareholder value.
remuneration policy and practicesThe Group’s remuneration policy is to reward
executives for their contribution to the performance
of the business, taking into consideration an
appropriate balance between long and short-term
benefits.
Remuneration levels are influenced by work
performance and scarcity of skills especially in the
area of merchandising.
Given that performance-related incentives form a
material part of remuneration packages, ongoing
performance feedback is vital. Associates annually
participate in performance and career development
evaluations, focusing on work achievements,
learning and development needs, values and
cultural alignment. Remuneration is not influenced
by race, creed or gender, with the emphasis on
equal pay for equal work. There is strong alignment
of the types of benefits offered to the various levels
of permanent associates. The Group can justify
areas where differentiation has been applied,
specifically where consideration has been given to
the position’s seniority and the need to attract and
retain key skills.
All associates sign letters of employment, which
stipulate the notice period. The contract may be
terminated by either party giving written notice of
1 month for a store or head office associate, 3
months for a divisional Director and 6 months for
executive Directors. Despite these provisions, either
party may terminate the contract of employment
without notice for any cause recognised by law
or by agreement by both parties to waive the
notice period. Contracts are also terminated in the
event of a dismissal without the associate having
an entitlement for compensation. Employment
contracts do not contain provisions relating to:
• the compensation of executives for a change of
control of the Company
• providing ‘balloon’ payments on termination or
retirement
• restraint of trade payments, although these may
be contained elsewhere.
External service providers assist the Remuneration
and Nominations Committee from time to time.
Where this involves the remuneration of executives
and non-executive Directors, appropriate
benchmarking comparatives are made. This
benchmarking exercise takes place every 2 years,
with inflationary adjustments made in alternate
years. A benchmark assessment was conducted
during the 2013 financial year, for implementation
on 1 April 2013:
• Senior management - roles were graded
according to the Paterson and Towers Watson
global grading job evaluation methodology. The
benchmarks included PE Corporate Services’
Total Executive Remuneration Survey (which
comprises approximately 800 companies listed
on the JSE, private companies and parastatals),
as well as the JSE database which contains
information extracted from annual reports
of listed companies. Each position is strictly
benchmarked against like-for-like criteria
and necessary adjustments are made to ensure
competitive pay. In establishing an appropriate
peer group for organisational benchmarking,
the individual’s role and business size including
turnover, profit before tax, total assets, number
of employees and annual salary and wage bill
are taken into account, as well as the level of
the individual’s decision-making.
• Executive Directors - (including, basic pay,
short-term incentives and share option awards),
a peer group of 16 companies was selected
in conjunction with PwC. This included 8 retail
companies, 4 companies with a similar market
capitalisation and 4 companies that had
achieved similar total shareholder returns.
Meaningful comparisons in respect of long-
term incentives are difficult given the various
methodologies adopted by companies. Awards
can either be based on the face value (approach
used by the Group) or the expected value of the
instruments issued and companies can either
have smaller annual awards (approach adopted
by the Group) or larger awards which vary in
frequency, or a combination of both.
• Non-executive Directors – fees are
benchmarked every 2 years and proposed at
the market median. The most recent
benchmarking exercise was conducted in
F2013 using the PE Corporate Services survey.
It is envisaged that the next benchmark study,
which will be performed in the current year, with
any changes being effective from 1 April 2015,
will use the same peer group of companies
used for benchmarking the executive Directors.
REMUNERATION REPORT

66PREVIOUS | CONTENTS | NEXT
6666
The disclosure of the remuneration of executive
Directors is governed by the JSE Listings
Requirements and the Companies Act, 2008, with
additional recommendations from King III. In order
to maintain its competitive edge, the Company has
applied the principles of King III that are appropriate
for the business, to which there have been no
material changes during the year under review.
The Company complies with all disclosure aspects,
except the recommendation of paragraph 180 of
King III, relating to the present value of long-term
incentives due to the varied valuation models and
the unpredictable forecasting elements required
to determine the value of the share options when
vesting. The Group’s view is that to consider the
present value of option awards as remuneration
is misleading, in that the present value does
not refl ect the value paid to or receivable by the
executive. Such gains can only be determined upon
exercise of the options. However, to compensate
for this omission, share option disclosure has been
enhanced in order to aid shareholder evaluation
(refer pages 71 and 72).
The Group is appreciative of the input and
feedback received from shareholders. The general
feedback has been that the level of disclosure on
remuneration matters is detailed and clearly laid
out. Specifi c issues raised are detailed on page 68.
At the AGM held in August 2013, shareholders
representing 97.0% of total votes voted in favour
of the Remuneration Policy of the Company,
while votes in favour of the proposed fees for the
various roles and Committee memberships of non-
executive Directors ranged between 99.35% and
99.91%.
remuneration structureRemuneration and reward structures are
categorised into 3 elements:
• Fixed remuneration: base pay and benefi ts
• Variable remuneration: short-term performance-
related incentives
• Long-term incentives: shares and share options.
fi xed remuneration
All associates, including executive Directors,
receive a fi xed remuneration package based on
their roles, individual performance and the Group’s
performance. Increases are based on a review
of market data and consideration of individual
performance and potential.
Basic Pay - salary and benefi ts are reviewed
at least annually and all associates earn above
legislated minimum wages.
Motor vehicle expenses - a travel allowance or
company car is offered to associates whose
position requires them to travel for business
purposes. Associates who are required to
travel less frequently for business purposes are
reimbursed for this cost.
Medical aid membership - is offered to all full-
time associates, but is not a condition of service.
Where the offer of comprehensive medical aid is
not accepted by associates due to affordability
reasons, membership of cost-effective schemes
is encouraged to gain access to hospital care,
chronic illness benefi ts (including HIV/Aids care)
and daily benefi ts including doctors and medicines.
Retirement benefi ts - the majority of associates
employed in South Africa, Swaziland and Lesotho
are provided for in a funded defi ned benefi t
fund and 2 funded defi ned contribution funds.
Associates employed in Namibia, Botswana,
Nigeria and Ghana are members of separate
defi ned contribution funds in those countries. The
defi ned benefi t fund was closed to new entrants
with effect 1 June 1997. The funds provide for
pensions and related benefi ts for permanent
associates and membership is compulsory after the
fi rst year of service. No material ex-gratia payments
are routinely paid.
variable remuneration
All associates, including executive Directors,
participate in an annual short-term incentive
scheme which is related to performance.
Although challenging targets are set, the incentive
schemes are potentially generous to encourage
the achievement of targets that can be directly
infl uenced by superior performance. In setting
the performance targets, the Remuneration and
Nominations Committee ensures targets are linked
to the Group’s or division’s annual key imperatives,
are substantially within the associate’s control, do
not expose the organisation to undue risk caused
by their behaviour and that there is an appropriate
balance between short-term and long-term
incentivisation.
The Group does not defer bonus payments as
it is essential to attract and retain bright young
talent, many of whom are at the age that they
are committing to their fi rst property purchase or
fi nancing their children’s education. Associates
have to be in the Group’s employ at year end to
receive incentive bonuses, unless due to specifi c
circumstances, alternative arrangements have been
approved by the Remuneration and Nominations
Committee. The incentive structures for the 2014
fi nancial year were as follows:
REMUNERATION REPORT

67PREVIOUS | CONTENTS | NEXT
67
% allocation
financial total
Achieving budgeted operating profit 3 months 37.5Stretch targets operating profit 5 months 62.5Total operating profit 8 months 100.0 66.6Achievement of strategic key imperatives 2 months 16.7Personal performance 2 months 16.7 Total maximum number of months 12 months 100.0
divisional executives
The bulk of the short-term incentive award depends
on exceeding budget and achieving stretch
performance targets, which should have a positive
impact on shareholder returns. The number of
months’ incentive can be reduced by a maximum
of 2 penalty months should stock levels or ageing
exceed target, or employment equity or internal
audit scores fall short of target.
In the case of the heads of service divisions
such as Systems, Governance and Assurance,
People, Real Estate and Sustainability, the
maximum incentive ranges from 8 to 12 months
(including personal performance). Measurement
criteria include performance evaluation from, and
financial performance of the trading divisions
whom they support (budget and stretch targets),
overhead costs, service delivery, innovative
business improvements and the achievement of
key imperatives. Penalty months apply to specific
criteria.
Personal performance, incorporating areas of
demonstrated performance contribution like
leadership, innovation, effort and teamwork are
also assessed. For senior management, ‘soft’
awards are generally capped at 2 months basic
salary, although in deserving circumstances, the
CEO can propose a higher award. A poor personal
performance evaluation can reduce or eliminate
the incentive due under measurable company
performance.
executive directorsA strong relationship exists between executive
incentives and sustainable value created for
shareholders. The incentive portion of Directors’
earnings is tied to financial targets and is measured
as a multiple of monthly salary. The achievement of
predetermined targets is a function of:
- Measurable Company performance, dependent
on the executive’s work function. Targets are
linked to the Group’s performance and are
tailored annually to ensure alignment with key
imperatives for the year. For the 2014 financial
year, the targets against which the CEO and
CFO were measured included: growth in
headline earnings per share, return on equity
and the achievement of Strategic KPI’s. The
maximum that can be earned is equal to 12
month’s basic salary. The awards are only made
if the Group achieves its budgeted half year and
annual headline earnings per share targets. In
that event, a maximum award of 3 months’
salary is made, with the result that the majority
of the short-term incentive award allocated
to company performance therefore depends
on exceeding budget and achieving stretch
performance targets. The Supply Chain Director,
who is an alternate Director, was measured on
the combined profitability of the trading
divisions, which also included budget and
stretch targets, Distribution Centre targets and
the delivery of KPI’s related to the supply chain
strategy. The maximum potential award is equal
to 10 months’ remuneration.
- Personal performance, incorporating areas
of demonstrated performance contribution such
as leadership, innovation, effort and teamwork.
Measuring these ‘soft’ issues necessitates
more subjective judgment and is determined via
individual and peer reviews. For executive
Directors, ‘soft’ awards are capped at 12
months basic salary, however this would only
be achieved in exceptional circumstances. A
poor personal performance evaluation can
reduce or eliminate the incentive due under
measurable company performance.
All associates, including executive Directors,
participate in a ‘December bonus’ scheme that
generally commences at the level of 20% of
monthly salary per completed year of service up
to 80% (after 4 years), followed by an additional
20% after the completion of 10 years’ service. This
incentive is not guaranteed and is payable at the
discretion of the Company.
REMUNERATION REPORT

68PREVIOUS | CONTENTS | NEXT
68
long-term incentives Partnership and reward for performance are among
the Group’s key beliefs. The Group has ambitious
growth plans that will require substantial capital
expenditure and the continued dedication of its
associates, and the long-term incentives (LTI) are
to motivate and retain associates critical to the
achievement of these goals. To that end, various
share and share option schemes have been
established to enable all permanent associates
within the SADC region the opportunity to share in
the long-term success of the Group. We believe
that our inclusive approach to share ownership in
the Company is a key differentiator and is essential
to achieving a high level of performance in the
long-term. In other companies, LTI’s are typically
reserved for company executives, however in our
case, executive management’s interest is less than
25% of total company share or option awards.
The scheme in which associates can participate
depends on their position in the Company. Long-
term incentives are subjected to an annual review
to confirm their efficacy and affordability. The
schemes which are active are summarised below
and further information can be found on the
Group’s website www.mrpricegroup.com
• Mr Price Group Employees Share Investment
Trust allows associates the opportunity to
purchase shares on a monthly basis up to a
value of 15% of their monthly remuneration
(salary, and where applicable, car allowance).
The Company makes an additional contribution,
equal to 15% of the associates’ contribution,
which amounted to R2.6 million in the current
financial year. This scheme has been in
existence since 1992 and at year end 3 642
associates were participants, holding 308 334
shares. In order to encourage participants to
hold the shares, restrictions are in place
limiting the number of times shares may be sold
in a year. Directors and prescribed officers
cannot participate in the scheme.
• Mr Price Partners Share Scheme - shares
are awarded instead of options. Associates in
junior positions, where staff turnover is relatively
high, are awarded shares after being
permanently employed for 12 months.
• 4 share option schemes.
• 2 forfeitable share plans (FSP) which were
introduced during the year – page 69-71.
Mr Price Partners Share Scheme
A key factor of the share and share option
schemes would, in essence, incorporate the
Group’s intentions regarding the ownership criteria
of B-BBEE. Rather than enter into an ownership
deal with external parties, the Board resolved to
embrace the true spirit of B-BBEE and, subject to
certain qualifying criteria, included all associates
in its various share and share option schemes. In
this way those responsible for contributing to the
Group’s success become partners in the business
and are rewarded for sustained high performance.
Since an upfront free allocation of shares, not share
options, are awarded under the Mr Price Partners
Share Scheme, participants of this scheme receive
bi-annual dividends and are eligible to vote on
their shares as shareholders. Of the trustees
overseeing the operation of this scheme, 50%
were elected by the participants, which serves
to ensure greater understanding and enhanced
communication between partners, the trustees and
the Board. Black ownership in this scheme is 95%
and the average value of shares held on behalf of
each individual associate is R87 000. Associates
who became participants between the date of
introduction of this scheme and November 2010,
were allocated 1 000 shares or 1 250 shares as
an assistant store manager. They have received
dividends amounting to R18.3 million over the last
year (final 2013 and interim 2014 dividends).
The Company has paid out total dividends of R77.7 million to associates participating in the Partners Share Scheme since its inception in 2006, and at year end, 7 404 associates hold 4 877 144 shares, to the value of R761 million.
share option schemesThe share option schemes operate on a “rolling”
basis, in that smaller annual awards are made (rather
than larger upfront awards) according to market
benchmarked criteria and the timing of these awards
coincides with a tranche vesting. This mechanism
spreads the market risk, avoiding the situation
where all options could be out of the money, which
is a disincentive to associates. All option and share
awards are based on a formula of guaranteed annual
pay multiplied by a factor, divided by the share price,
which limits company exposure during a period of
share price strength. The strike price mechanism for
all share option schemes is calculated at the lower of
the 30 day volume weighted average price (VWAP)
for the period preceding the offer date, or the price
on the day prior to the offer. Re-pricing of strike
prices is not permitted and options are not awarded
to or exercised by key personnel in the Executive
and Executive Director Share Schemes during
closed periods. The Remuneration and Nominations
Committee has the authority to prevent vesting in
circumstances where the individual is deemed to
have demonstrated poor personal performance.
Specific issues raised by shareholders during the
year regarding long-term incentives include:
• The need for more substantial returns based
performance - the mechanics of the share
schemes are reviewed annually. Last year,
consideration was given to the input received
from shareholders and minimum performance
conditions were introduced. The purpose of this
hurdle (HEPS growing a minimum of CPI +1%)
was to ensure that share options would not
vest in the event of there being poor company
performance. The intention was not to raise the
performance hurdle to a height that would cause
the schemes to lose their motivational appeal
to the valued partners within the Group.
Cognisance was also taken of the fact that, due
to strong company performance and the re-
rating of the share price (the PE ratio varied from
around 12 to a peak of 25), the quantum of share
options awarded to participants has decreased.
The option schemes are rolling in nature and
the current awards are materially lower than
options vesting. The remuneration philosophy of
the Group is to remunerate at the median and
reward through bonuses and shares. Should the
shares become less attractive, the Group would
need to employ a less favourable approach of
increasing basic salaries to retain key associates.
As detailed in last year’s report, the Company
has further considered performance targets upon
introducing the FSP’s – refer pages 69 to 71.
REMUNERATION REPORT

69PREVIOUS | CONTENTS | NEXT
69
16012
10
8
6
4
2
0
14012010080604020
2010 2011 2012 2013 2014
shar
e pr
ice
(r)
optio
ns a
war
ded
(mill
ion)
0
54.5
43.5
32.5
21.5
10.5
02012 2013 2014
vest
ing
vs a
war
ded
(mill
ion)
• Discounted strike prices – previously the strike
price of options in 2 of the option schemes
(excluding the Executive Director Share
Scheme) had the potential to be reduced upon
the attainment of certain financial targets. This
practice was discontinued with effect from the
November 2013 awards.
• Limits for participation - the Company’s
partnership approach results in all associates
within the SADC region participating in the
share schemes, which is unique in South Africa
and critical to the success of the Company.
Over 9 000 associates are members of the
various share schemes in operation, which
has resulted in a large number of shares or
options being awarded. This is expected to
reduce over time, as there is a shift to an
allocation formula which takes into account
annual guaranteed remuneration and the
prevailing share price which has led to smaller
tranches being awarded. Furthermore, the
Board is of the opinion that it is not appropriate
to include shares allocated under the Partners
Share Scheme, which effectively operates as
the Group’s B-BBEE scheme, in this overall
participation total. Excluding this scheme, the
total number of shares committed under the
various equity incentive schemes equates to
8.05% of the issued share capital.
new awards are less than those vesting...total options/shares awarded annuallyis reducing...
Note: tables above exclude FSP’s
total options/shares at year end (rhs) % of issued share capital (lhs) % excluding partners share scheme (lhs)
• The remuneration report could contain more
details on financial indicators and parameters
but the Group is very sensitive to releasing
information which could be considered
forecasting. To that end, the Group will not
commit in print to goals of attaining certain
financial indicators. Nonetheless, the reports
from the Chairman, CEO and CFO clearly detail
both the exceptional historic performance and
the strategic goals of the Company.
Other amendments that were implemented during
the year were as follows:
• The tapering off of share option allocations
for associates nearing retirement - applies
to participants of the General Staff and Senior
Management share schemes in recognition of
the retention aspect diminishing. These
associates’ job functions are more
administrative or short-term in nature. The
impact of their work does not generally impact
the business well after their retirement, as is
the case with the participants in the Executive
and Executive Director share schemes.
Consequently, as associates approach
retirement age, their option awards reduce on a
sliding scale.
• Adjustment to the factor of guaranteed
remuneration upon which the option awards are
calculated - considering the cost of each
scheme, the removal of strike price discounts
in the Senior Management and Executive Share
Schemes, and the strong need to motivateand
retain our most senior people, the factors
applied to the General Staff Share Scheme was
decreased and those of the Senior Management
and Executive share schemes were increased.
The factors applied to the Executive Director
Share Scheme remained unchanged.
• Introduction of FSP’s – in the prior year, the
company’s advisors, PwC, recommended the
implementation of a FSP as 82% of companies
LTI awards as a % of share capital is reducing
surveyed had more than 1 type of long-term
incentive scheme operating in parallel.
Forfeitable shares are freeshares awarded to
participants, subject tocertain conditions and
offer more certainty to the recipient as the value
is in the share that vests, not growth on strike
price as is the casewith options. From a
company perspective FSP’s are attractive due
to the strong retention element as well as the
fact that the shares result in a lower number of
instruments than options. Generally companies
offer FSP’s without performance conditions and
senior employees can also receiveenhancement
shares which are subject to performance
conditions. The following FSP schemes were
introduced during the year:
- Mr Price Executive Forfeitable Share Plan
for executive Directors and certain divisional
Directors, executives and senior managers.
Awards will be of an annual rolling nature, as
per the option schemes. In order to keep the
cost to company (IFRS 2 charge) at a level no
higher than that of the option schemes, the
number of options awarded was reduced and
a lower number of FSP’s awarded. The shares
are held in escrow and vest in 5 years’ time,
with participants receiving dividends during
this period. This ‘vanilla’ award does not contain
performance conditions. A matching
‘performance award’ (equivalent to the vanilla
award) was also made, but this contains stretch
HEPS targets linked to the company’s 5 year
strategic plan. 89 954 shares have been
acquired by the Company and are held by an
institutional 3rd party to satisfy the current
obligation in full.
REMUNERATION REPORT
201420132012
14%35302520151050
12%
10%
8%
6%
% o
f sh
are
cap
ital
op
tio
ns a
war
ded
(mill
ion)

- Mr Price Group Forfeitable Share Plan
It is imperative to retain the executives who are central to the Group’s growth strategy detailed elsewhere in this report. Participants were awarded free shares
equivalent to between 2 and 3 times their annual guaranteed remuneration and these shares vest in full in 5 years’ time. This award was offered subject to
participants entering into a restraint and retention agreement which precludes them from joining a competitor for a period of 2 years should they leave the
employment of the company. 433 576 shares have been acquired by the company and are held by an institutional 3rd party to fully satisfy this obligation.
The vesting periods of the various share option schemes have been amended over the years that they have been in operation. A balance has been sought
between allowing sufficient time to experience a meaningful growth in the share price and having the options vest in a timeframe which is not so distant as to
appear unattainable. Summarised, the position is as follows:
vesting period exercise period frequency of allocations
Partners Share Trust Unconditional vesting occurs 60 days
after the death or retirement of the
recipient associate
Immediate upon unconditional vesting A once-off initial allocation is made with
no further routine top-up allocations being
awarded
General Staff Share Trust 3 years from date of offer within 90 days of vesting Annual
Senior Management Share Trust 5 years from date of offer within 90 days of vesting Annual
Executive Share Trust 5 years from date of offer within 5 years of vesting Annual
Executive Director Share Trust 5 years from date of offer within 5 years of vesting Annual
Mr Price Executive FSP 5 years from date of offer Immediately upon vesting Annual
Mr Price Group FSP 5 years from date of offer Immediately upon vesting Once-off award
Concerning the vesting of shares on retirement
or for other reasons for ending employment, the
share trusts’ rules stipulate that associates retiring
at the age of 65 may retain unvested share options
that will vest according to their original timeframes.
However, given associates are entitled to take early
retirement from the age of 50, guidelines were
established taking into account the age and years’
service of associates retiring before 65. These
guidelines permit the retention post-retirement
of unvested options on a sliding scale whereby
associates can take early retirement from 50 and
retain their options if they have a minimum 25
years’ service, to retirement at 64 which requires 11
years’ service. Retirement at 65 does not require
a minimum service period. In all other retirement
or dismissal situations, unvested options will lapse
unless the Board exercises its discretion and
permits the exercise of any or all of the unexercised
options.
In the Mr Price Partners Share Scheme, retirement
causes the shares to vest unconditionally. The age
and length of service guidelines detailed above
have also been applied to those associates retiring
before 65.
Since the inception of the share option schemes,
the Board has exercised its discretion on an
exceptional basis and has allowed a very limited
number of associates to retain unvested options
post resignation. In using its discretion, the Board
considered the associate’s length of service,
resignation circumstances, past services to the
Group and the vesting period remaining on all
offered tranches. In most cases, the tranche
closest to maturity was retained while the remaining
unvested tranches were forfeited. No accelerated
vesting of share options is permitted.
REMUNERATION REPORT 70PREVIOUS | CONTENTS | NEXT
70

71PREVIOUS | CONTENTS | NEXT
71
In terms of cash flow, the Company’s unhedged commitments, at a closing share price of R156.01 amounts to R1.6 billion. In comparison the strike price payable by participants amounts to R1.3 billion.
long-term incentive scheme number of
participants
number ofoptions/
shares
shares held bythe share
trusts
% of totalobligation
hedged
Mr Price Share Option Scheme 67 55 467 - 0%
Mr Price Partners Share Trust 7 404 4 877 114 6 592 145 135%
Mr Price General Staff Share Trust 1 773 9 371 943 4 806 015 51%
Mr Price Senior Management Share Trust 204 4 297 119 1 444 615 34%
Mr Price Executive Share Trust 32 2 966 758 1 822 530 61%
Mr Price Executive Director Share Trust 5 3 007 621 1 365 067 45%
Mr Price Executive FSP 34 89 954 89 954 100%
Mr Price Group FSP 13 433 576 433 576 100%
Total 9 532 25 099 552 16 553 902 66%
In terms of specific authority received from share-
holders, the Company may issue 46 548 430
shares to satisfy the requirements of its share
schemes. Since the schemes were introduced in
2006, the Company has issued 9 463 292 shares
and therefore still has 37 085 138 shares that may
be issued for this purpose. However, in order to
avoid shareholder dilution, the Group’s current
policy is to purchase shares on the open market
to satisfy the requirements of the various share
schemes, as opposed to issuing new shares. The
Company has a share purchase programme in
place to hedge against the future obligations of
the schemes. The extent to which the Company is
hedged against further share price appreciation and
details of unvested/unexercised shares and options
at balance sheet date are as follows:
executive directors’ remunerationThe Remuneration and Nominations Committee
annually reviews executive Directors’ remuneration,
set at the market median, to attract and retain the
calibre required to successfully direct the Group’s
business. In line with the remuneration philosophy,
performance-related incentives form a material
part of the remuneration package and share option
awards align the Director with the Group interest
in attaining profitable long-term growth. The
benchmarking of base pay against the peer group
of companies detailed on page 65 revealed that the
CEO and CFO were behind the peer group average
by 24% and 12% respectively. Accordingly their
remuneration was adjusted by these factors on
1 April 2013.
The emoluments of executive Directors for the year were as follows (R’000):
salarymotor vehicle
benefitspension
contributionsother
benefits short-term incentives
total2014
total2013
SI Bird* 4 692 220 961 149 9 384 15 406 11 522
MM Blair* 3 131 367 672 120 5 688 9 978 8 214
SA Ellis 2 564 286 554 103 2 628 6 135 5 522
Total 10 387 873 2187 372 17 700 31 519 25 258
*Considered to be prescribed officers
Details of the interest of executive Directors in long-term incentives are as follows:
Forfeitable share plans date ofaward
sharesgranted
share price at
award date
shares held at
end of the year
vestingdate
SI BirdMr Price Executive FSP (EFSP)
- vanilla award 29-Nov-13 10 341 R155.97 10 341 29-Nov-18- performance award 29-Nov-13 10 341 R155.97 10 341 29-Nov-18
Mr Price Group FSP (GFSP) 29-Nov-13 96 546 R155.97 96 546 29-Nov-18
MM BlairMr Price Executive FSP (EFSP)
- vanilla award 29-Nov-13 6 334 R155.97 6 334 29-Nov-18- performance award 29-Nov-13 6 334 R155.97 6 334 29-Nov-18
Mr Price Group FSP (GFSP) 29-Nov-13 67 315 R155.97 67 315 29-Nov-18
SA EllisMr Price Executive FSP (EFSP)
- vanilla award 29-Nov-13 2 233 R155.97 2 233 29-Nov-18- performance award 29-Nov-13 2 233 R155.97 2 233 29-Nov-18
Total 201 677 201 677
REMUNERATION REPORT

72PREVIOUS | CONTENTS | NEXT
Share options - Mr Price Executive Director Share Trustoptions held at
the beginningof the year
date ofoffer
options granted and accepted
during the year
options exercised or taken up
during the year
option priceof award
gain on options exercised
during the year (R'000)
options held at the end of
the year
number of tranches
remaining
vesting date of first tranche
vesting dateof last tranche
latest expiry date for
exercise of options
SI Bird 40 0001 22-Nov-06 40 000 R21.15 5 855 - -
376 000 27-May-09 94 000 R26.50 9 226 282 000 3 27-May-14 27-May-16 27-May-21
71 000 22-Nov-09 R32.75 71 000 1 22-Nov-14 22-Nov-19
400 000 25-Aug-10 R46.00 400 000 1 25-Aug-15 25-Aug-20
90 000 30-Nov-10 R62.77 90 000 1 30-Nov-15 30-Nov-20
210 500 22-Nov-11 R76.49 210 500 1 22-Nov-16 22-Nov-21
129 777 22-Nov-12 R133.67 129 777 1 22-Nov-17 22-Nov-22
22-Nov-13 112 271 R151.94 112 271 1 22-Nov-18 22-Nov-23
1 317 277 1 295 548
MM Blair 117 000 22-Nov-06 117 000 R21.15 15 774 - -
146 000 22-Nov-09 R32.75 146 000 1 22-Nov-14 22-Nov-19
155 000 30-Nov-10 R62.77 155 000 1 30-Nov-15 30-Nov-20
142 600 22-Nov-11 R76.49 142 600 1 22-Nov-16 22-Nov-21
86 870 22-Nov-12 R133.67 86 870 1 22-Nov-17 22-Nov-22
22-Nov-13 68 770 R151.94 68 770 1 22-Nov-18 22-Nov-23
647 470 599 240
SA Ellis 280 000 22-Nov-06 70 000 R21.15 9 351 210 000 1 22-Nov-13 22-Nov-18
50 000 22-Nov-09 R32.75 50 000 1 22-Nov-14 22-Nov-19
50 000 30-Nov-10 R62.77 50 000 1 30-Nov-15 30-Nov-20
50 000 22-Nov-11 R76.49 50 000 1 22-Nov-16 22-Nov-21
32 591 22-Nov-12 R133.67 32 591 1 22-Nov-17 22-Nov-22
22-Nov-13 24 242 R151.94 24 242 1 22-Nov-18 22-Nov-23
462 591 416 833
AE McArthur2 327 000 22-Nov-06 327 000 R21.15 44 029 - -
396 000 22-Nov-09 R32.75 396 000 1 22-Nov-14 20-Feb-15
250 000 30-Nov-10 R62.77 250 000 1 30-Nov-15 28-Feb-16
973 000 646 000
S van Niekerk2 140 000 22-Nov-06 140 000 R21.15 18 850 - -
50 000 22-Nov-09 R32.75 50 000 1 22-Nov-14 20-Feb-15
190,000 50 000
72REMUNERATION REPORT
1 The options awarded to SI Bird were awarded in terms of the Mr Price Executive Share Trust prior to his appointment as an executive Director of the Company. These options were subject to a discount on the strike price due to strong Company performance and vested at R9.00 per share.
2 Disclosure required although no longer Directors of the Company.

73PREVIOUS | CONTENTS | NEXT
73
Composition of executive Directors’ total remuneration for the year: The emoluments of non-executive Directors for the year were as follows:
R’000 salaryvehicle
allowances & expenses
pension contributions
feestotal2014
total2013
LJ Chiappini 975 394 343 625 2 337 3 194
SB Cohen 1 085 375 324 625 2 409 3 250
K Getz - - - 396 396 377
MR Johnston - - - 556 556 534
RM Motanyane - - - 284 284 270
D Naidoo - - - 314 314 279
NG Payne - - - 1 050 1 050 1 000
LJ Ring - - - - - 202
MJD Ruck - - - 430 430 372
S Sebotsa - - - - - 84
WJ Swain - - - 555 555 537
M Tembe - - - 284 284 270
Total 2 060 769 667 1 250 8 616 10 369
2014
56% long-term incentive
25% short-term incentive
19% salary &benefits
2013
52% long-term incentive
25% short-term incentive
23% salary &benefits
REMUNERATION REPORT
non-executive directors’ remunerationNon-executive Directors’ fees, which comprise
separate remuneration for Board activity and
Committee participation, are approved at the AGM.
The Company does not pay an attendance fee per
meeting, as historically, the attendance at meetings
has been good and the performance of non-
executive Directors is reviewed annually via peer
evaluation. In addition, the Board has always felt
that Directors contribute as much outside of
meetings as they contribute within meetings.
Proposed fees are detailed in the Notice of Meeting
set out in the Annual Results booklet for approval at
the forthcoming AGM. Non-executive Directors do
not participate in any short-term incentive schemes
and do not receive share option awards.
The Honorary Chairmen have employment
contracts with the Company and the remuneration
payable in terms of these contracts is decided by
the Remuneration and Nominations Committee.
Details explaining the role of the Honorary
Chairmen, in support of their remuneration, are
provided in the Corporate Governance Report on
page 48. Their total remuneration is decreasing
over a 3 year period (which commenced in the
March 2014 financial year) to the level that the Lead
Director’s total fees are expected to be in 2016,
which is approximately R625 000 per annum.
This was calculated by applying an inflationary
increase of 6% per annum to the proposed Lead
Director’s total fees for the forthcoming year. This
has been implemented by increasing the Honorary
Chairmen’s fees to R625 000 in 2014, a level
which will remain unaltered until 2016. Effective
1 April 2013, the balance of their remuneration,
represented by the total cost to company less
the fees of R625 000, is being reduced in annual
installments to 2016. Therefore in 2016, the
Honorary Chairmen’s salary and benefits will be
Rnil, and their total remuneration, in the form of
fees, will amount to R625 000.

Analysis of the remuneration of non-executive Directors for their services as Board Committee Chairmen and members is detailed below:
proposals for future remuneration policy• Research and implementation of suitable long-term incentive structures for new geographic trading
territories.
• Effective November 2014, participants in the Mr Price Executive Forfeitable Share Plan, 34 associates in
total, can qualify to have their total (options and FSP’s) annual long-term incentive awards increased by
10% should they meet their minimum personal shareholding threshold, namely twice annual guaranteed
remuneration for divisional executives and 3 times for executive Directors.
• Alignment of the peer group utilised for benchmarking non-executive Directors’ fees to the peer group
used for executive Directors.
1 Fees for the non-executive Chairman include his duties as Chairman of both the Board and the Risk Committee.
F2014 actual F2015 proposed
board or committee chairman member chairman member
Main Board 1 050 000 212 000 1 113 000 225 000
Main Board - Honorary Chairman 625 000 625 000
Main Board - Lead Independent Director 341 000 361 500
Audit and Compliance Committee 182 000 102 000 193 000 108 000
Risk Committee1 89 000 94 500
Remuneration and Nominations Committee 112 500 71 500 119 250 75 800
Social, Ethics, Transformation andSustainability Committee
112 500 71 500 119 250 75 800
REMUNERATION REPORT 74PREVIOUS | CONTENTS | NEXT
74

75PREVIOUS | CONTENTS | NEXT
75BOARD OF DIRECTORS
board ofHonorary Chairman
Stewart Cohen
other directorships include: Catregav Holdings (Pty) Limited, Holdspec Investments (Pty) Limited, Kovacs Investments 343 (Pty) Limited
years of service: 28qualifi cations: BCom, LLB, MBA
Age: 69
Honorary Chairman
Laurie Chiappini
other directorships include: Gretrac Holdings (Pty) Limited, Storevest Investments (Pty) Limited
years of service: 28
Age: 69
Chairman
Nigel Payne
other directorships include: JSE Limited, The Bidvest Group Limited, Bidvest Bank Limited, BSi Steel Limited, Vukile Property Fund Limited, STRATE (Pty) Limited, Free State Maize (Pty) Ltd, PPS Insurance Company Limited
years of service: 7qualifi cations: CA (SA), MBL
Age: 54
Chief Executive Offi cer
Stuart Bird
years of service: 20qualifi cations: CA (SA)
Age: 54
Chief Financial Offi cer
Mark Blair
years of service: 8qualifi cations: CA (SA)
Age: 48
directors

76PREVIOUS | CONTENTS | NEXT
76
Alternate Director
Steve Ellis
years of service: 22qualifications: CA (SA)
Age: 52Independent Non-Executive Director
Myles Ruck
other directorships include: Standard Bank Group Limited, The Standard Bank of South Africa Limited, ICBC Argentina
years of service: 7qualifications: BBusSc PMD (Harvard)
Age: 58
Age: 73
Age: 52
Age: 42
Age: 65
Independent Non-Executive Director
John Swain
other directorships include: The Sharks (Pty) Limited
years of service: 20qualifications: CA (SA)
Independent Non-Executive Director
Moses Tembe
other directorships include: Beige Holdings Limited, Crescendo Management Services, Geochem (Pty) Ltd, OCS (Sa) (Pty) Limited
years of service: 6qualifications: BA Public Administration and Political Science, Graduate of Caltex Business Management Programme (UCT)
Age: 49
Alternate Director
Neill Abrams
other directorships include: Ocado Group Plc
years of service: 4qualifications: BA, LLB (Wits), LLM (Cambridge)
Alternate Director
Tracey Chiappini-Young
other directorships include: Taunina (Pty) Limited, Taunina LLC
years of service: 4qualifications: BBusSci (UCT), CFA, Associate in Applied Science (FIT),TRIUM EMBA (NYU, HEC, LSE)
Lead Independent Director
Bobby Johnston
other directorships include: STRATE (Pty) Limited
years of service: 20qualifications: CA (SA)
Non-executive Director
Keith Getz
other directorships include: BVPG Consulting (Pty) Limited, Steak Ranches Inter-national BV, Spur International Limited, Spur Corporation Limited, Spur Corporation UK Limited, Cape Union Mart Group (Pty) Limited, STRATE (Pty) Limited
years of service: 9qualifications: BProc, LLM
Independent Non-Executive Director
Daisy Naidoo
other directorships include: STRATE (Pty) Limited, Hudaco Industries Limited,OMNIA Holdings Limited, Marriott Unit Trust Management Company Limited, Old Mutual Unit Trust Managers Limited, Anglo Platinum Limited, Old Mutal Alternative Risk Transfer Limited
years of service: 2qualifications: CA (SA) MCom (Tax)
Age: 41
Age: 58
Independent Non-Executive Director
Maud Motanyane
other directorships include: Kagiso Media, G4S Secure Solutions, G4S Aviation Security, Jet Education Trust
years of service: 6qualifications: Diploma Library Science, WPI fellow
Age: 62
BOARD OF DIRECTORS

ANNUAL FINANCIAL STATEMENTS 77PREVIOUS | CONTENTS | NEXT
These Annual Financial Statements as at
29 March 2014 have been prepared under the
supervision of the Chief Financial Offi cer, Mr MM
Blair CA(SA).
The Annual Financial Statements of the Company
and the Group were approved by the Board on
27 May 2014 and are signed on its behalf by:
company secretarystatementI hereby certify that the Company has lodged
with the Companies and Intellectual Property
Commission all such returns as are required of a
public company in terms of the Companies Act
and that all such returns are true, correct and up
to date.
Approval of theannual financialstatements
The preparation and presentation of the Annual
Financial Statements and all information
included in this report are the responsibility of
the Directors. The Annual Financial Statements
were prepared in accordance with the provisions
of the Companies Act and comply with
International Financial Reporting Standards
and the AC 500 Standards, as issued by the
Accounting Practices Board and its successors,
the SAICA Financial Reporting Guides as issued
by the Accounting Practices Committee and the
Financial Reporting Pronouncements as issued
by the Financial Reporting Standards Council.
In discharging their responsibilities, both for
the integrity and fairness of these statements,
the Directors rely on the internal controls and
risk management procedures applied by
management.
Based on the information and explanations
provided by management and the internal
auditors and on comment by the independent
auditor on the results of their statutory audit, the
Directors are of the opinion that:
• the internal controls are adequate;
• the fi nancial records may be relied upon
in the preparation of the Annual Financial
Statements;
• appropriate accounting policies,
supported by reasonable and prudent
judgements and estimates, have been
applied; and
• the Annual Financial Statements fairly
present the results and the fi nancial
position of the Company and the Group.
The Annual Financial Statements are prepared on
the going concern basis and nothing has come
to the attention of the Directors to indicate that
the Company and the Group will not remain a
going concern.
SI BirdCEO
NG PayneCHAIRMAN
HE GrosvenorCOMPANY SECRETARY27 MAY 2014
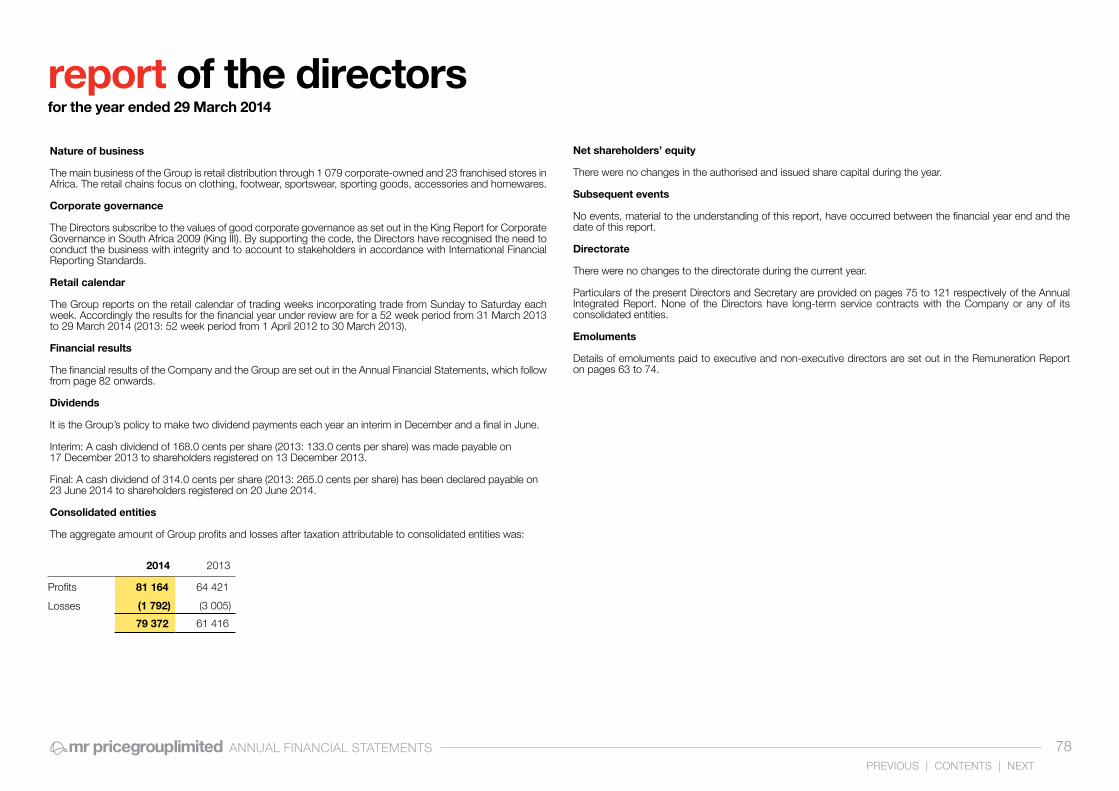
ANNUAL FINANCIAL STATEMENTS 78PREVIOUS | CONTENTS | NEXT
report of the directorsfor the year ended 29 March 2014
Nature of business
The main business of the Group is retail distribution through 1 079 corporate-owned and 23 franchised stores in Africa. The retail chains focus on clothing, footwear, sportswear, sporting goods, accessories and homewares.
Corporate governance
The Directors subscribe to the values of good corporate governance as set out in the King Report for Corporate Governance in South Africa 2009 (King III). By supporting the code, the Directors have recognised the need to conduct the business with integrity and to account to stakeholders in accordance with International Financial Reporting Standards.
Retail calendar
The Group reports on the retail calendar of trading weeks incorporating trade from Sunday to Saturday each week. Accordingly the results for the financial year under review are for a 52 week period from 31 March 2013 to 29 March 2014 (2013: 52 week period from 1 April 2012 to 30 March 2013).
Financial results
The financial results of the Company and the Group are set out in the Annual Financial Statements, which follow from page 82 onwards.
Dividends
It is the Group’s policy to make two dividend payments each year an interim in December and a final in June.
Interim: A cash dividend of 168.0 cents per share (2013: 133.0 cents per share) was made payable on17 December 2013 to shareholders registered on 13 December 2013.
Final: A cash dividend of 314.0 cents per share (2013: 265.0 cents per share) has been declared payable on23 June 2014 to shareholders registered on 20 June 2014.
Consolidated entities
The aggregate amount of Group profits and losses after taxation attributable to consolidated entities was:
Net shareholders’ equity
There were no changes in the authorised and issued share capital during the year.
Subsequent events
No events, material to the understanding of this report, have occurred between the financial year end and the date of this report.
Directorate
There were no changes to the directorate during the current year.
Particulars of the present Directors and Secretary are provided on pages 75 to 121 respectively of the Annual Integrated Report. None of the Directors have long-term service contracts with the Company or any of its consolidated entities.
Emoluments
Details of emoluments paid to executive and non-executive directors are set out in the Remuneration Report on pages 63 to 74.
2014 2013
Profits 81 164 64 421
Losses (1 792) (3 005)
79 372 61 416

ANNUAL FINANCIAL STATEMENTS 79PREVIOUS | CONTENTS | NEXT
B Ordinary shares
2014 2013
Direct Beneficial
Indirect Beneficial
Held By Associate Other Total
3 % Direct
BeneficialIndirect
BeneficialHeld By
Associate Other Total3
%
LJ Chiappini - 6 000 759 - - 6 000 759 44.63% - 6 000 759 - - 6 000 759 44.63%
SB Cohen - 6 000 000 - - 6 000 000 44.63% - 6 000 000 - - 6 000 000 44.63%
MR Johnston - - 46 504 46 504 0.35% - - 46 504 46 504 0.35%
Ordinary B Ordinary
Issued share capital 2014 251183 867 13 445 081
Issued share capital 2013 251183 867 13 445 081
Ordinary shares
2014 2013
Direct Beneficial
Indirect Beneficial
Held By Associate Total % Direct
BeneficialIndirect
BeneficialHeld By
Associate Total %
SI Bird 211 384 94 000 - 305 384 0.12% 211 384 - - 211 384 0.08%
MM Blair 78 230 26 324 400 104 954 0.04% 56 836 - 800 57 636 0.02%
LJ Chiappini - - - - 0.00% - 316 349 - 316 349 0.13%
TA Chiappini-Young 199 - - 199 0.00% 199 - - 199 0.00%
SB Cohen 490 14 013 44 588 59 091 0.02% 490 131 121 44 588 176 199 0.07%
SA Ellis 56 853 67 248 - 124 101 0.05% 56 853 67 248 - 124 101 0.05%
K Getz - - 20 000 20 000 0.01% - - 20 000 20 000 0.01%
MR Johnston - - 91 250 91 250 0.04% - - 91 250 91 250 0.04%
WJ Swain - 611 670 - 611 670 0.24% - 611 670 - 611 670 0.24%
LJ Ring1 2 500 - 2 500 5 000 0.00%
SEN Sebotsa2 1 000 - - 1 000 0.00%
1 316 649 0.52% 1 614 788 0.64%
Notes:
1 Retired as alternate Director on 30 March 2013.2 Retired by rotation as Director on 30 August 2012.3 The 1 397 818 B ordinary shares not detailed above belong to:
(a) trusts (1 397 618 shares) of which Mr MR Johnston’s major children are beneficiaries. Mr Johnston has no direct or indirect beneficial ownership in these shares and has relinquished all voting rights thereto; and(b) Mr AE McArthur (200 shares).
There have been no changes in the above interests between the year end and the date of approval of these Annual Financial Statements.
report of the directorsfor the year ended 29 March 2014 (continued)
Interest in shares of the company
At the financial year end, the directors were interested in the Company’s issued shares as follows:

ANNUAL FINANCIAL STATEMENTS 80PREVIOUS | CONTENTS | NEXT
independent auditor’s report
fi nal cash dividenddeclaration
To the Shareholders of Mr Price Group Limited
We have audited the consolidated and separate annual fi nancial statements of Mr Price Group Limited, which comprise the remueration report, the consolidated and separate statements of fi nancial position as at 29 March 2014, and the consolidated and separate statements of comprehensive income, consolidated and separate statement of changes in equity and consolidated and separate cash fl ows for the 52 weeks then ended, and a summary of signifi cant accounting policies and other explanatory notes, as set out on pages 82 to120 and pages 63 to 74.
Directors’ Responsibility for the Financial Statements
The company’s directors are responsible for the preparation and fair presentation of these fi nancial statements in accordance with International Financial Reporting Standards and the requirements of the Companies Act of South Africa, and for such internal control as the directors determine is necessary to enable the preparation of consolidated fi nancial statements that are free from material misstatement, whether due to fraud or error.
Auditor’s Responsibility
Our responsibility is to express an opinion on the fi nancial statements based on our audit. We conducted our audit in accordance with International Standards on Auditing. Those standards require that we comply with ethical requirements and plan and perform the audit to obtain reasonable assurance about whether the fi nancial statements are free from material misstatement.
An audit involves performing procedures to obtain audit evidence about the amounts and disclosures in the fi nancial statements. The procedures selected depend on the auditor’s judgement, including the assessment of the risks of material misstatement of the fi nancial statements, whether due to fraud or error. In making those risk assessments, the auditor considers internal control relevant to the entity’s preparation and fair presentation of the fi nancial statements in order to design audit procedures that are appropriate in the circumstances, but not for the purpose of expressing an opinion on the effectiveness of the entity’s internal control. An audit also includes evaluating the appropriateness of accounting policies used and the reasonableness of accounting estimates made by management, as well as evaluating the overall presentation of the fi nancial statements.
We believe that the audit evidence we have obtained is suffi cient and appropriate to provide a basis for our audit opinion.
Opinion
In our opinion, the annual fi nancial statements present fairly, in all material respects, the consolidated and separate fi nancial position of Mr Price Group Limited as at 29 March 2014, and its consolidated and separate fi nancial performance and consolidated and separate cash fl ows for the 52 weeks then ended in accordance with International Financial Reporting Standards, and the requirements of the Companies Act of South Africa.
Other reports required by the Companies Act
As part of our audit of the consolidated and separate fi nancial statements for the year ended 29 March 2014, we have read the Directors’ Report, the Audit Committee’s Report and the Company Secretary’s Certifi cate for the purpose of identifying whether there are material inconsistencies between these reports and the audited consolidated and separate fi nancial statements. These reports are the responsibility of the respective preparers. Based on reading these reports we have not identifi ed material inconsistencies between these reports and the audited consolidated and separate fi nancial statements. However, we have not audited these reports and accordingly do not express an opinion on these reports.
Ernst & Young Inc.Director – Jane Anne OlivaRegistered AuditorChartered Accountant (SA)
1 Pencarrow Crescent, La Lucia Ridge Offi ce Estate, Durban, 4000
27 May 2014
Notice is hereby given that a fi nal gross cash dividend of 314.0 cents per share has been declared, an
increase of 18.5%. As the dividend has been declared from income reserves and no STC credits are
available for utilisation, shareholders, unless exempt or who qualify for a reduced withholding tax rate, will
receive a net dividend of 266.9 cents per share.
The issued share capital at the declaration date is 251 183 867 listed ordinary and 13 445 081 unlisted
B ordinary shares. The tax reference number is 9285/130/20/0.
The salient dates for the dividend will be as follows:
Last date to trade ‘cum’ the dividend Thursday 12 June 2014
Date trading commences ‘ex’ the dividend Friday 13 June 2014
Record date Friday 20 June 2014
Payment date Monday 23 June 2014
Shareholders may not dematerialise or rematerialise their share certifi cates between Friday, 13 June 2014
and Friday, 20 June 2014 both dates inclusive.
On behalf of the boardDurban27 May 2014
SI BirdCEO
NG PayneCHAIRMAN
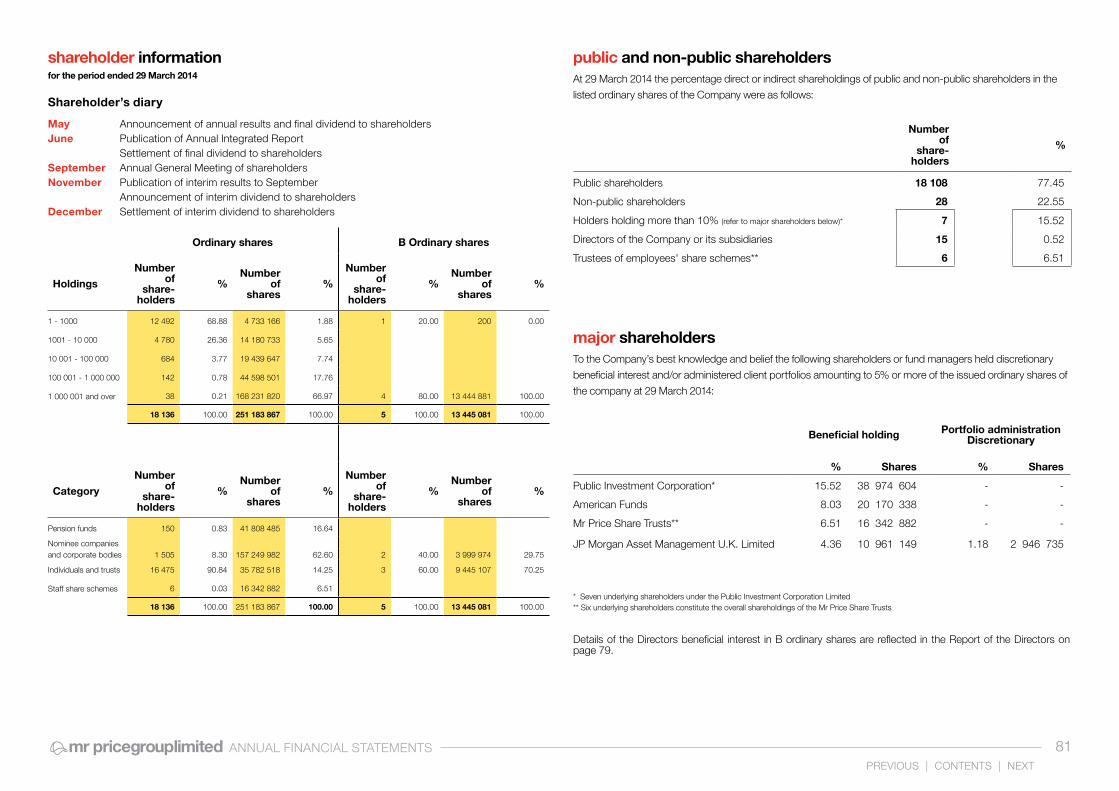
ANNUAL FINANCIAL STATEMENTS 81PREVIOUS | CONTENTS | NEXT
public and non-public shareholdersAt 29 March 2014 the percentage direct or indirect shareholdings of public and non-public shareholders in the
listed ordinary shares of the Company were as follows:
major shareholdersTo the Company’s best knowledge and belief the following shareholders or fund managers held discretionary
beneficial interest and/or administered client portfolios amounting to 5% or more of the issued ordinary shares of
the company at 29 March 2014:
Number of
share-holders
%
Public shareholders 18 108 77.45
Non-public shareholders 28 22.55
Holders holding more than 10% (refer to major shareholders below)* 7 15.52
Directors of the Company or its subsidiaries 15 0.52
Trustees of employees' share schemes** 6 6.51
Beneficial holding Portfolio administration Discretionary
% Shares % Shares
Public Investment Corporation* 15.52 38 974 604 - -
American Funds 8.03 20 170 338 - -
Mr Price Share Trusts** 6.51 16 342 882 - -
JP Morgan Asset Management U.K. Limited 4.36 10 961 149 1.18 2 946 735
Details of the Directors beneficial interest in B ordinary shares are reflected in the Report of the Directors on page 79.
* Seven underlying shareholders under the Public Investment Corporation Limited** Six underlying shareholders constitute the overall shareholdings of the Mr Price Share Trusts
shareholder informationfor the period ended 29 March 2014
Shareholder’s diary
May Announcement of annual results and final dividend to shareholders June Publication of Annual Integrated Report Settlement of final dividend to shareholders September Annual General Meeting of shareholders November Publication of interim results to September Announcement of interim dividend to shareholdersDecember Settlement of interim dividend to shareholders
Ordinary shares B Ordinary shares
Holdings
Number of
share-holders
%Number
of shares
%
Number of
share-holders
%Number
of shares
%
1 - 1000 12 492 68.88 4 733 166 1.88 1 20.00 200 0.00
1001 - 10 000 4 780 26.36 14 180 733 5.65
10 001 - 100 000 684 3.77 19 439 647 7.74
100 001 - 1 000 000 142 0.78 44 598 501 17.76
1 000 001 and over 38 0.21 168 231 820 66.97 4 80.00 13 444 881 100.00
18 136 100.00 251 183 867 100.00 5 100.00 13 445 081 100.00
Category
Number of
share-holders
%Number
of shares
%
Number of
share-holders
%Number
of shares
%
Pension funds 150 0.83 41 808 485 16.64
Nominee companiesand corporate bodies 1 505 8.30 157 249 982 62.60 2 40.00 3 999 974 29.75
Individuals and trusts 16 475 90.84 35 782 518 14.25 3 60.00 9 445 107 70.25
Staff share schemes 6 0.03 16 342 882 6.51
18 136 100.00 251 183 867 100.00 5 100.00 13 445 081 100.00

ANNUAL FINANCIAL STATEMENTS 82PREVIOUS | CONTENTS | NEXT
statement ofaccounting policiesfor the year ended 29 March 2014
1. Consolidation
The consolidated financial statements comprise the financial statements of the Company and its consolidated entities as at 29 March 2014.
Consolidated entities (which include special purpose entities such as staff share trusts) are defined as entities in which the Group has the power to govern the financial and operating policies of the entity so as to gain benefit from its activities. Control is achieved when the Group is exposed, or has rights, to variable returns from its involvement with the investee and has the ability to affect those returns through its power over the investee. Specifically, the Group controls an investee if and only if the Group has:
- power over the investee (i.e. existing rights that give it the current ability to direct the relevant activities of the investee);
- exposure, or rights, to variable returns from its involvement with the investee; and
- the ability to use its power over the investee to affect its returns.
When the Group has less than a majority of the voting or similar rights of an investee, the Group considers all relevant facts and circumstances in assessing whether it has power over an investee, including:
- the contractual arrangement with the other vote holders of the investee;- rights arising from other contractual arrangements;
and- the Group’s voting rights and potential voting rights.
The Group re-assesses whether or not it controls an investee if facts and circumstances indicate that there are changes to one or more of the three elements of control. Consolidation of a subsidiary begins when the Group obtains control over the subsidiary and ceases when the Group loses control of the subsidiary. Assets, liabilities, income and expenses of a subsidiary acquired or disposed of during the year are included in the statement of comprehensive income from the date the Group gains control until the date the Group ceases to control the subsidiary. Profit or loss and each component of other comprehensive income (OCI) are attributed to the equity holders of the parent of the Group and to the non-controlling interests, even if this results in the non-controlling interests having a deficit balance. When necessary, adjustments are made to the financial statements of subsidiaries to bring their accounting policies into line with the Group’s accounting policies. All intra group assets and liabilities, equity, income, expenses and cash flows relating to transactions between members of the Group are eliminated in full on consolidation.
The Group uses the acquisition method of accounting to account for business combinations. The consideration transferred for the acquisition of a subsidiary is the fair value of the assets transferred, the liabilities incurred and the equity interests issued by the Group. The consideration transferred includes the fair value of any asset or liability resulting from a contingent consideration arrangement. Acquisition related costs are expensed as incurred. Identifiable assets acquired
and liabilities and contingent liabilities assumed in a business combination are measured initially at their fair values at the acquisition date. On an acquisition-by-acquisition basis, the Group recognises any non-controlling interest in the acquiree either at fair value or at the non-controlling interest’s proportionate share of the acquiree’s net assets.
If the business combination is achieved in stages, the previously held equity interest is remeasured at its acquisition date fair value and any resulting gain or loss is recognised in profit or loss. It is then considered in the determination of goodwill.
Any contingent consideration to be transferred by the acquirer will be recognised at fair value at the acquisition date. Contingent consideration classified as an asset or liability that is a financial instrument and within the scope of IAS 39 Financial Instruments: Recognition and Measurement, is measured at fair value with changes in fair value recognised either in profit or loss or as a change to other comprehensive income. If the contingent consideration is not within the scope of IAS 39, it is measured in accordance with the appropriate IFRS. Contingent consideration that is classified as equity is not remeasured and subsequent settlement is accounted for within equity.
Investments in subsidiaries are accounted for at cost less impairment. Cost is adjusted to reflect changes in consideration arising from contingent consideration amendments. Cost also includes directly attributable costs of investment. The excess of the consideration transferred, the amount of any non-controlling interest in the acquiree and the acquisition-date fair value of any previous equity interest in the acquiree over the fair value of the Group’s share of the identifiable net assets acquired is recorded as goodwill. If this is less than the fair value of the net assets of the subsidiary acquired in the case of a bargain purchase, the difference is recognised directly in the income statement.
Intercompany transactions, balances and unrealised gains/losses on transactions between Group companies are eliminated.
2. Fair value measurement
Fair value is the price that would be received to sell an asset or paid to transfer a liability in an orderly transaction between market participants at the measurement date. The fair value measurement is based on the presumption that the transaction to sell the asset or transfer the liability takes place either:
- in the principal market for the asset or liability, or- in the absence of a principal market, in the most
advantageous market for the asset or liability.
The principal or the most advantageous market must be accessible by the Group. The fair value of an asset or a liability is measured using the assumptions that market participants would use when pricing the asset or liability, assuming that market participants act in their economic best interest.
A fair value measurement of a non-financial asset takes into account a market participant’s ability to generate economic benefits by using the asset in its highest and best use or by selling it to another market participant that would use the asset in its highest and best use.
The Group uses valuation techniques where appropriate in the circumstances and for which sufficient data is available to measure fair value, maximising the use of relevant observable inputs and minimising the use of unobservable inputs.
All assets and liabilities for which fair value is measured or disclosed in the financial statements are categorised within the fair value hierarchy, described as follows, based on the lowest level input that is significant to the fair value measurement as a whole:
- Level 1 — Quoted (unadjusted) market prices in active markets for identical assets or liabilities
- Level 2 — Valuation techniques for which the lowest level input that is significant to the fair value measurement is directly or indirectly observable
- Level 3 — Valuation techniques for which the lowest level input that is significant to the fair value measurement is unobservable.
For assets and liabilities that are recognised in the financial statements on a recurring basis, the Group determines whether transfers have occurred between levels in the hierarchy by re-assessing categorisation (based on the lowest level input that is significant to the fair value measurement as a whole) at the end of each reporting period.
For the purpose of fair value disclosures, the Group has determined classes of assets and liabilities on the basis of the nature, characteristics and risks of the asset or liability and the level of the fair value hierarchy as explained above.
Fair values of financial instruments measured at amortised cost are disclosed in Note 28.
3. Property, plant and equipment
Capitalised leased office buildings are recognised at the fair value of the buildings at date of commencement of the lease agreement, or if lower, the present value of the minimum lease payments. The buildings are depreciated over the shorter of the period of the finance lease and the useful life of the buildings.
The annual financial statements have been prepared on the historic cost and going concern bases, except where indicated otherwise in a policy below. The annual financial statements are prepared in accordance with International Financial Reporting Standards (‘IFRS’). The consolidated financial statements are presented in Rands and all values are rounded to the nearest million (R’m), except when otherwise indicated.
The consolidated financial statements provide comparative information in respect of the previous period. In addition, the Group presents an additional statement of financial position at the beginning of the earliest period presented when there is a retrospective application of an accounting policy, a retrospective restatement, or a reclassification of items in financial statements. An additional statement of financial position as at 1 April 2012 is presented in these consolidated financial statements due to retrospective application of certain accounting policies, refer Note 1.1.
Unless otherwise indicated, any references to the Group include the Company.

ANNUAL FINANCIAL STATEMENTS 83PREVIOUS | CONTENTS | NEXT
Buildings occupied in the normal course of business are recognised at cost less accumulated depreciation and impairment losses.
Furniture, fittings, equipment, vehicles, computer equipment and improvements to leasehold premises are stated at historic cost less accumulated depreciation and any accumulated impairment and are depreciated, on the straight line basis to their expected residual values, over the estimated useful lives of the assets concerned which are as follows:
Furniture, fittings, equipment and vehicles- 5 to 14 yearsComputer equipment- 3 to 5 yearsImprovements to leasehold premises- Over period of lease subject to a maximum of 10 yearsBuildings - 20 years
Subsequent costs are included in the asset’s carrying amount or recognised as a separate asset, as appropriate, and only when it is probable that future economic benefits associated with the item will flow to the Group and the cost of the item can be measured reliably. The carrying amount of the replaced part is derecognised. All other repairs and maintenance are charged to the income statement during the financial period in which they are incurred.
The assets’ expected residual values, estimated useful lives, and depreciation policy are reviewed, and adjusted if appropriate, on an annual basis. Changes in the estimated useful life or expected pattern of consumption of future benefits embodied in the asset are accounted for by changing the depreciation period or method, as appropriate, and are treated as changes in accounting estimates.
4. Intangible assets
Intangible assets acquired separately are measured on initial recognition at cost. The cost of intangible assets acquired in a business combination is their fair value
at the date of acquisition. Following initial recognition, intangible assets are carried at cost less any accumulated amortisation and accumulated impairment losses. Internally generated intangible assets, excluding capitalised development costs, are not capitalised and expenditure is reflected in profit and loss in the period in which the expenditure is incurred.
Computer softwareAcquired software not regarded as an integral part of hardware is capitalised at historic cost and is amortised on the straight line basis over its estimated useful life (2 - 7 years), from the date of it being commissioned into the Group.
All other costs that are directly associated with the production of identifiable software controlled by the Group, and that are expected to generate economic benefits exceeding 1 year, are recognised as part of the cost of the intangible assets. Direct costs include the software development employee costs. Costs associated with developing software are recognised as an expense as incurred if it is not expected that they will provide future economic benefits to the Group. GoodwillGoodwill represents the excess of the cost of acquisition over the fair value of the net identifiable assets of the acquired consolidated entity or operation at date of acquisition, and is carried at cost less accumulated impairment losses.
TrademarksTrademarks are initially recorded at historic cost. Trademarks acquired in a business combination are recognised at fair value at the acquisition date. Trademarks have a finite useful life and are carried at cost less accumulated amortisation and net of accumulated impairment. Amortisation is calculated on a straight line basis to allocate the cost of trademarks over their estimated useful lives which do not exceed 20 years.
Customer listsAcquired customer lists are initially recorded at
historic cost and are carried at cost less accumulated amortisation. Amortisation is calculated on a straight line basis to allocate the cost of the lists over the period from which it is expected to generate revenue (4 years).
Changes in the estimated useful life or expected pattern of consumption of future benefits embodied in intangible assets are accounted for by changing the amortisation period or method, as appropriate, and treated as changes in accounting estimates.
5. Impairment and derecognition of non-financial assets
Assets, other than financial assets, goodwill and intangible assets not yet brought into use, are tested for indicators of impairment on an annual basis. Should such an indicator exist, the asset is then tested for impairment.
Separately recognised goodwill and intangible assets not yet brought into use are tested for impairment annually or more frequently if changes in circumstances indicate that the carrying amount may be impaired.
The amount of the impairment is determined by assessing the recoverable amount of the asset or cash generating unit to which the asset relates. The recoverable amount is the higher of an asset’s fair value less costs to sell and value in use. In assessing value in use, the estimated future cash flows are discounted to their present value using a pre-tax discount rate that reflects current market assessments of the time value of money and the risks specific to the asset. In determining fair value less costs to sell, recent market transactions are taken into account, if available. If no such transactions can be identified, an appropriate valuation model is used. These calculations are corroborated by valuation multiples, quoted share prices for publicly traded subsidiaries or other fair value indicators. Where the recoverable amount of the asset or cash generating unit or group of cash generating units is less than the carrying amount, an impairment loss is recognised in the income statement.
When an impairment loss subsequently reverses, the carrying amount of the asset or cash generating unit is increased to the revised estimate of its recoverable amount, but only to the extent of the carrying amount that would have been determined had no impairment loss been recognised previously. Impairments are reversed in the income statement in the period that the indicator of such reversal is in existence, unless the relevant asset is carried at a revalued amount, in which case the reversal is treated as a revaluation increase. Impairments to goodwill are never reversed.
The derecognition of a non-financial asset takes place upon disposal or when it is no longer expected
to generate any further economic benefits. Any derecognition gain/loss is recorded in the income statement in the period of derecognition.
6. Inventories
Inventories are valued at the lower of cost or net realisable value.
Cost is determined on the following bases:
- The cost of merchandise purchased for resale is determined using the weighted average method; and
- Consumables are valued at invoice cost on a first-in, first-out basis.
Costs include the charges incurred in bringing inventories to their present location and condition and are net of discounts from suppliers.
Net realisable value is the estimated selling price in the ordinary course of business, less applicable variable selling expenses.
7. Taxation
The taxation expense represents the sum of current taxation and deferred taxation. Taxation rates that have been enacted or substantively enacted by the reporting date are used to determine the taxation balances.
Current taxationCurrent income tax assets and liabilities for the current period are measured at the amount expected to be recovered from or paid to the taxation authorities. The taxation currently payable is based on the taxable profit for the year, which differs from the profit for the year in the income statement as it excludes both items of income or expense that are taxable or deductible in other years and those items that are never taxable or deductible. Current income taxation relating to items recognised directly in equity is also recognised in other comprehensive income or equity and not in profit or loss.
Deferred taxationDeferred taxation is provided for all temporary differences (other than temporary differences created on initial recognition which are not part of a business combination and at the time of the transaction no taxation or accounting effect has been recognised and goodwill for which amortisation is not deductible for accounting purposes) arising between the tax bases of assets and liabilities and their carrying amounts on the statement of financial position. Deferred taxation relating to items recognised outside profit and loss is recognised outside profit and loss. Deferred taxation items are recognised in correlation to the underlying transaction either in other comprehensive income or directly in equity.
statement ofaccounting policies (continued)
for the year ended 29 March 2014
ANNUAL FINANCIAL STATEMENTS 84PREVIOUS | CONTENTS | NEXT
Deferred tax assets and liabilities are measured at the tax rates that are expected to apply in the year when the asset is realised or the liability is settled, based on tax rates (and tax laws) that have been enacted or substantively enacted at the reporting date.
Deferred taxation assets are only recognised to the extent that it is probable that the temporary differences will reverse in the foreseeable future and that future taxable profit will be available to allow all or part of the deferred taxation asset to be utilised. Deferred tax is provided on temporary differences arising on investments in consolidated entities and associates, except for deferred tax liabilities where the timing of the reversal of the temporary difference is controlled by the Group and it is probable that the temporary difference will not reverse in the foreseeable future.
The carrying amount of deferred taxation assets is reviewed at each reporting date and reduced to the extent that it is no longer probable that sufficient taxable profits will be available to allow all or part of the asset to be recovered.
Deferred tax assets and deferred tax liabilities are offset if a legally enforceable right exists to set off deferred tax assets against deferred tax liabilities and the deferred taxes relate to the same taxable entity and the same taxation authority.
Tax benefits acquired as part of a business combination, but not satisfying the criteria for separate recognition at that date, are recognised subsequently if new information about facts and circumstances change. The adjustment is either treated as a reduction to goodwill (as long as it does not exceed goodwill) if it was incurred during the measurement period or recognised in profit or loss.
Value-Added Tax (VAT)Expenses and assets are recognised net of the amount of VAT, except when the VAT incurred on a purchase of assets or services is not recoverable from the taxation authority, in which case the VAT is recognised as part of the cost of acquisition of the asset or as part of the
expense item, as applicable.
Revenue and income are recognised net of the amount of VAT, except when the VAT due on the sale or income is not payable to the taxation authority, in which case the full amount is recognised as revenue or income as applicable.
The net amount of VAT recoverable from, or payable to, the taxation authority is included as part of receivables or payables in the statement of financial position.
Dividend Withholding Tax (DWT)DWT replaced STC on 1 April 2012 and is a tax levied on the beneficial owner of the shares instead of the company. The tax is withheld and is paid over to the South African Tax Authority on the beneficiaries’ behalf. The resultant tax expense and liability has been transferred to the shareholder and is no longer accounted for as part of the tax charge for the company. Amounts not yet paid over to the relevant tax authorities are included in trade and other payables and the measurement of the dividend amount is not impacted by the withholding tax.
8. Provisions
Provisions are recognised when the Group has a present obligation (legal or constructive) as a result of a past event, it is probable that an outflow of resources embodying economic benefits will be required to settle the obligation and a reliable estimate of the obligation can be made. Where the effect of discounting to present value is material, provisions raised are adjusted to reflect the time value of money. Provisions are reviewed at each reporting date and adjusted to reflect current best estimates.
9. Revenue recognition
Revenue is measured at the fair value of the consideration received or receivable, and is recognised when it is probable that the economic benefits associated with the transaction will flow to the Group and the amount of revenue can be reliably measured. Revenue is shown net of estimated customer returns, discounts and VAT and after eliminating sales within the Group.
Retail salesRetail sales comprise net income from the sale of merchandise and are recognised when the significant risks and rewards of ownership pass to the customer. It is the Group’s policy to sell its products to the retail customer with a right to return within a specified period. Accumulated experience is used to estimate and provide for such returns.
Premium incomePremiums are recognised when due in terms of the relevant contract and are shown before the deduction of commission and claims, which are recognised in administrative and other operating expenses.
Service fee revenueRevenue from a contract to provide services is recognised in the month in which the service charge accrues. Service fee revenue is derived from the provision of information technology and debtor management services.
Club feesClub fees are recognised in the month in which the customer charge accrues.
InterestInterest received is recognised on a time proportion basis at the effective interest rate as imputed in the contract.
Rental incomeRental income in respect of operating leases is recognised on a straight line basis over the lease period.
Dividend incomeDividend income includes the value of cash dividends received and surpluses distributed by a staff share trust.Dividends are recognised when the right to receive payment has been established.
FeesFees represent fee income from consolidated entities in respect of various administrative and operating functions performed on their behalf. Fees are recognised when the charge accrues.
Airtime salesAirtime sales are recognised once the significant risks and rewards of ownership pass to the customer.
10. Leases
Assets held in terms of finance leases, which transfer to the Group substantially all the risks and rewards
of ownership, are capitalised at the inception of the lease at the fair value of the leased item or, if lower, the present value of the minimum lease payments. The corresponding liability to the lessor is recognised as a finance lease obligation. Lease payments are apportioned between finance charges (recognised as finance costs) and a reduction of the lease liability so as to achieve a constant rate of interest on the remaining balance of the liability.
A leased asset is depreciated over the useful life of the asset. However, if there is no reasonable certainty that the Group will obtain ownership by the end of the lease term, the asset is depreciated over the shorter of the estimated useful life of the asset and the lease term.
Operating lease payments are recognised as an expense on a straight-line basis over the term of the lease. Contingent rentals (including turnover clause rentals) arising under operating leases are recognised as an expense in the period in which liability is accrued. The resulting difference arising from the straight-line basis and contractual cash flows is recognised as an operating lease obligation or asset.
11. Borrowing costs
Borrowing costs are capitalised where they are directly attributable to the acquisition, construction or production of a qualifying asset. All other borrowing costs are expensed in the period in which they occur.
12. Dividends to shareholders
Dividends in respect of equity instruments are recorded in the period in which the dividend is paid and are charged directly to equity.
13. Foreign currencies
Functional and presentation currencyItems included in the financial statements of the Group’s foreign consolidated entities are measured using the currency of the primary economic environment in which the entity operates (‘functional currency’). The consolidated financial statements are presented in Rands, which is the Group’s functional and presentation currency.
statement ofaccounting policies (continued)
for the year ended 29 March 2014

ANNUAL FINANCIAL STATEMENTS 85PREVIOUS | CONTENTS | NEXT
Transactions and balancesTransactions in foreign currencies are translated to the functional currency using the spot exchange rates prevailing at the dates of the transactions. Monetary assets and liabilities designated in foreign currencies are translated using the spot exchange rates prevailing at the reporting date. Non-monetary items are translated at historic rates or, where applicable, at the rate prevailing on the date of revaluation. All exchange differences are recognised in income in the period in which they occur.
Group companiesThe results and position of consolidated entities that have a functional currency that differs from the presentation currency are translated into the presentation currency as follows:
- Assets and liabilities for each statement of financial position presented are translated at the closing rate at the date of that statement of financial position;
- Income statement items are translated at the average rate for the period (unless this average is not a reasonable approximation of the cumulative effect of the rates prevailing on the transaction dates, in which case income and expenses are translated at the rate on the dates of the transactions); and
- All resulting exchange differences are recognised as a separate component of other comprehensive income.
On disposal of the consolidated entity, the accumulated exchange differences in other comprehensive income are recognised in the income statement.
14. Financial instruments
Financial assets and financial liabilities are recognised on the statement of financial position when the Group becomes a party to the contractual provisions of the instrument. Financial instruments are initially recognised at fair value plus transaction costs for all financial assets not carried at fair value through profit or loss. Financial assets carried at fair value through profit or loss are
initially recognised at fair value, and transaction costs are expensed in the income statement. Subsequent measurement is made in accordance with the specific instrument provisions of IAS 39 Financial Instruments: Recognition and Measurement. Where a legally enforceable right of offset exists for recognised financial assets and liabilities, and the Group intends to settle on a net basis, or to realise the asset and settle the liability simultaneously, the related asset and liability are offset.
Financial assets are reviewed annually for any evidence of impairment, and any impairment loss is recognised immediately in the income statement.
Long-term receivablesLong-term receivables are classified as a ‘loan or receivable’ and are recorded at fair value at inception using the effective interest rate implicit in the cash flows of the receivable. This effective interest rate is established by considering the market rate of interest for a similar investment on the date of each contribution. The long-term receivables are carried at amortised cost.
The deferred receivables, which are classified as a ‘loan or receivable’, are represented by advances to the participants in the Deferred Implementation Share Scheme and are recoverable when participants exercise their right to take up the shares.
The annual amortised cost adjustments are reflected in the income statement.
Trade and other receivablesTrade receivables, which generally have 6 to 12 month terms and are recognised and carried at amortised cost, namely the original invoice amount plus associated costs and interest charges to date, less any impairment allowance for uncollectible amounts, are classified as ‘loans and receivables’. Provision is made when there is objective evidence that the Group will have difficulty collecting the debts. Various economic factors and changes in the delinquency of payments are considered indicators that the trade receivables are impaired. The carrying amount of the
asset is reduced through the use of an allowance account, and the amount of the loss is recognised in the income statement within selling expenses. Bad debts are written off in the income statement when it is considered that the Group will be unable to recover the debt and it has been handed over for collection. Subsequent recoveries of amounts previously written off are credited against selling expenses in the income statement.
Other receivables are initially measured at fair value and are subsequently measured at amortised cost using the effective interest rate method and are carried net of any accumulated impairment.
Cash and cash equivalentsCash and cash equivalents comprise cash at banks and on hand and short-term deposits with an original maturity of three months or less, net of bank overdrafts. Cash and cash equivalents are classified as receivables originated by the enterprise and are measured at amortised cost.
Derivative financial instrumentsThe Group uses derivative financial instruments such as forward exchange contracts to hedge its risks associated with foreign currency fluctuations. Derivative financial instruments are initially recognised at fair value on the date the contract is entered into and are subsequently measured at fair value, which is calculated with reference to current forward exchange contracts with equivalent maturity periods. Gains or losses arising from fair value adjustments are taken directly to the income statement.
Trade and other payablesTrade payables, which are primarily settled on 30 day terms, are carried at cost, being the fair value of the consideration to be paid in the future for goods and services rendered. These are subsequently measured at amortised cost using the effective interest rate method.
Other payables are initially measured at fair value and are subsequently measured at amortised cost using the effective interest rate method.
Loans and borrowings Loans and borrowings are initially recognised at the fair value of the consideration received plus directly attributable transaction costs. They are subsequently measured at amortised cost using the effective interest rate method.
Financial guaranteesFinancial guarantees are initially recognised at their fair value and are subsequently measured at the higher of:
- The amount of the obligation under the contract, as determined in accordance with IAS 37 Provisions,
Contingent Liabilities and Contingent Assets; and- The amount initially recognised less, where
appropriate, cumulative amortisation recognised.
Amounts owing by/to consolidated entitiesConsolidated entity balances are initially recognised at the fair value of the consideration received, and are subsequently measured at amortised cost using the effective interest rate method. Current amounts owing are settled on 30 day terms.
Impairments and derecognitionFinancial assets are reviewed annually for any evidence of impairment. Provision is made for impairment if, and only if, there is objective evidence of impairment as a result of one or more events that occurred after the initial recognition of the asset and that loss event (or events) has an impact on the estimated future cash flows of the financial asset or group of financial assets that can be reliably measured.
For loans and receivables, the amount of the loss is measured as the difference between the asset’s carrying amount and the present value of estimated future cash flows (excluding future credit losses that have not been incurred), discounted at the financial asset’s original effective interest rate. The carrying amount is reduced and the amount of the loss is recognised in the income statement. If the loan has a variable rate, the discount rate for measuring any impairment loss is the current effective interest rate under the contract. If considered practical, the impairment may be measured on the basis of an instrument’s fair value using an observable market price.
If, in a subsequent period, the amount of the impairment loss decreases and the decrease can be objectively related to an event occurring after the impairment was recognised, the previously recognised impairment loss is reversed in the income statement.
A financial asset (or, where applicable, a part of a financial asset or part of a group of similar financial assets) is primarily derecognised (i.e. removed from the Group’s consolidated statement of financial position) when:
- The rights to receive cash flows from the asset have expired, or
- The Group has transferred its rights to receive cash flows from the asset or has assumed an obligation to pay the received cash flows in full without material delay to a third party under a ‘pass-through’ arrangement; and either (a) the Group has transferred substantially all the risks and rewards of the asset, or (b) the Group has neither transferred nor retained substantially all the risks and rewards of the asset, but has transferred control of the asset.
statement ofaccounting policies (continued)
for the year ended 29 March 2014
ANNUAL FINANCIAL STATEMENTS 86PREVIOUS | CONTENTS | NEXT
When the Group has transferred its rights to receive cash flows from an asset or has entered into a pass-through arrangement, it evaluates if and to what extent it has retained the risks and rewards of ownership. When it has neither transferred nor retained substantially all of the risks and rewards of the asset, nor transferred control of the asset, the Group continues to recognise the transferred asset to the extent of the Group’s continuing involvement. In that case, the Group also recognises an associated liability. The transferred asset and the associated liability are measured on a basis that reflects the rights and obligations that the Group has retained. Continuing involvement that takes the form of a guarantee over the transferred asset is measured at the lower of the original carrying amount of the asset and the maximum amount of consideration that the Group could be required to repay.
Any derecognition gain/loss is recorded in the income statement in the period of derecognition. The Group derecognises financial liabilities when the Group’s obligations are discharged, cancelled or they expire.
15. Reinsurance
The Group assumes insurance risk in the normal course of business. Reinsurance assets represents balances due from registered insurance companies. Amounts receivable are estimated in a manner consistent with the related reinsurance contract.
Reinsurance assets are reviewed for impairment at each reporting date, or more frequently, when an indication of impairment arises during the reporting year. Impairment occurs when there is objective evidence as a result of an event that occurred after initial recognition of the reinsurance asset that as a result of which the Group may or may not receive all outstanding amounts due under the terms of the contact and the event has a reliably measurable impact on the amounts that the Group will receive from the insurer. Any related impairment loss is recorded in the income statement.
Reinsurance liabilities represent balances due to registered insurance companies. Amounts payable are
estimated in a manner consistent with the outstanding claims provision or settled claims associated with the insurer’s policies and are in accordance with the related reinsurance contract.
Premiums and claims on assumed reinsurance are recognised as revenue or expenses in the same manner as they would be if the reinsurance were considered a direct business/activity of the Group, taking into account the product classification of the reinsurance business.
Premiums and claims, assets and liabilities, are presented on a gross basis for the assumed reinsurance.
Reinsurance assets and liabilities are derecognised when the contractual rights are extinguished or expire or when the contract is transferred to another party.
16. Employee benefits
Short-term employee benefitsShort-term employee benefits are recognised in the period of service. Short-term employee benefits paid in advance are treated as prepayments and are expensed over the period of the benefit.
Post retirement benefits
Defined benefit retirement fund and post retirement medical aid fund.
The costs of providing benefits under the defined retirement benefit fund and the obligation for post retirement medical aid benefits (which is limited to members of the defined benefit retirement fund) is determined using the projected unit credit actuarial valuation method. Actuarial gains or losses, which can arise from differences between expected and actual outcomes, or changes in actuarial assumptions, are recognised immediately in other comprehensive income. Any increase in the present value of plan liabilities expected to arise from employee service during the period is charged to operating profit.The defined benefit fund asset reflected in the statement of financial position represents the present
value of the defined benefit asset as adjusted for unrecognised past service costs and as reduced by the fair value of scheme assets. The asset resulting from this calculation is limited to past service costs, plus the present value of available refunds and reductions in future contributions to the plan.
Past service costs are recognised immediately to the extent that benefits have already vested, and are otherwise amortised on a straight line basis over the average period until the benefits become vested.
Defined contribution retirement fundPayments to defined contribution retirement funds are expensed as they accrue in terms of services provided by employees.
Share-based paymentsThe Group operates share incentive schemes for the granting of non-transferable options or shares to associates (employees). Equity-settled share-based payments in terms of the schemes are measured at fair value (excluding the impact of any non-market vesting conditions) at the date of the grant, which is expensed over the period of vesting of the grant, with a corresponding adjustment to equity. Fair value is actuarially determined using a binomial valuation model. At each reporting date the estimate of the number of options that are expected to vest is revised, and the impact of this revision is recognised on a cumulative catch-up basis in the income statement, with a corresponding adjustment to equity. Assumptions used in the respective valuations are detailed in note 9.5. Upon vesting, the amount remaining in the share-based payment reserve relating to any such vested tranche is transferred within equity to retained earnings.
Restraints of tradeRestraints of trade payments are expensed over the contractual periods from which benefits are expected.
Performance incentivesThe Group recognises a liability and expense for performance incentives which include a component based on formulae which take into consideration the profit for the year and other operational targets.
17. Treasury shares
Shares in Mr Price Group Limited held by the staff share trusts are classified as treasury shares and are recognised at cost and deducted from equity. No gain or loss is recognised in profit or loss on the purchase, sale, issue or cancellation of the Company’s own equity instruments. Any difference between the carrying amount and the consideration, if reissued, is recognised as equity. Voting rights related to these shares are restricted for the Company. Share options exercised during the reporting period are satisfied with treasury shares.
18. Segment reporting
The Group’s retailing operations are reported within two operating segments, namely the Apparel and Home divisions. Group service divisions are reported in the Central Services segment. The Group presents information about geographical areas based on retail sales and other income. The information reported is similar to the information provided to management to enable them to assess performance and allocate resources.
19. Cost of sales
Cost of sales comprise the direct cost of merchandise sold and incorporates the cost of distribution, inventory losses and provisions for markdowns less discounts received from suppliers.
20. Selling expenses
Selling expenses comprise the cost incurred in the marketing and advertising of merchandise, store operations and the provision of credit facilities.
21. Administrative and other operating expenses
These expenses comprise costs related to the operation of the support functions within the Group other than those included in selling expenses.
statement ofaccounting policies (continued)
for the year ended 29 March 2014

ANNUAL FINANCIAL STATEMENTS 87PREVIOUS | CONTENTS | NEXT
consolidated statements of financial positionfor the year ended 29 March 2014
Group Company
R’m Notes
201429 March
201330 MarchRestated
20121 April
Restated
201429 March
201330 MarchRestated
20121 April
Restated
Assets
Non-current assets 1 137 927 744 1 079 885 956
Property, plant and equipment 3 718 660 540 659 589 485
Intangible assets 4 215 105 102 208 100 97
Consolidated entities 5 18 40 277
Long-term receivables 6 7 8 10 7 8 10
Defined benefit fund asset 29 45 20 16 45 20 16
Deferred taxation assets 16 152 134 76 142 128 71
Current assets 5 426 3 971 3 552 5 109 3 648 3 660
Inventories 7 1 403 1 236 1 168 1 303 1 163 1 116
Trade and other receivables 8 1 673 1 513 1 183 1 651 1 491 1 175
Reinsurance assets 14 98 72 51 98 72 51
Current amounts owing by consolidated entities 5 290 146 453
Cash and cash equivalents 2 252 1 150 1 150 1 767 776 865
Total assets 6 563 4 898 4 296 6 188 4 533 4 616
Equity and liabilities
Equity attributable to equity holders of the parent 3 923 3 309 2 777 3 618 2 982 2 567
Issued capital 9 - - - - - -
Capital reserves 10 198 169 141 161 137 114
Treasury share transactions 11 (1 311) (1 059) (869) (1 446) (1 241) (971)
Retained income 5 048 4 223 3 537 4 898 4 094 3 434
Foreign currency translation reserve 12 (17) (16) (22) -
Defined benefit fund actuarial gains and losses 13 5 (8) (10) 5 (8) (10)
Non-controlling interests 5 (1) - - - - -
Total Equity 3 922 3 309 2 777 3 618 2 982 2 567
Non-current liabilities 220 206 195 201 196 192
Lease obligations 15 179 179 171 172 174 169
Deferred taxation liabilities 16 6 5 1 - - -
Long-term provisions 17 7 6 8 7 6 8
Long-term liabilities 5 6 - - - - -
Post retirement medical benefits 29 22 16 15 22 16 15
Current liabilities 2 421 1 383 1 324 2 369 1 355 1 857
Trade and other payables 18 1 982 1 270 1 228 1 931 1 240 1 210
Reinsurance liabilities 14 34 28 18 34 28 18
Current amounts owing to consolidated entities 5 7 5 551
Current provisions 17 4 4 6 4 4 6
Current portion of lease obligations 15 47 34 29 46 33 29
Taxation 354 47 43 347 45 43
Total equity and liabilities 6 563 4 898 4 296 6 188 4 533 4 616
Group Company
R’m Notes
201429 March
201330 MarchRestated
201429 March
201330 MarchRestated
Revenue 15 892 13 800 15 754 13 720
Retail sales and other revenue 15 829 13 744 15 695 13 668
Interest received 63 56 59 52
Retail sales and other revenue 15 829 13 744 15 695 13 668
Retail sales 15 227 13 266 14 883 13 047
Interest on trade receivables 311 261 310 261
Income from consolidated entities 222 146
Premium income 147 106 147 106
Club fees 12 12 11 12
Service fee revenue - 8 - 8
Other revenue 132 91 122 88
Costs and expenses 13 292 11 675 13 147 11 579
Cost of sales 8 907 7 744 8 929 7 767
Selling expenses 3 354 2 996 3 193 2 881
Administrative and other operating expenses 1 031 935 1 025 931
Profit from operating activities 19 2 537 2 069 2 548 2 089
Finance costs - - - (22)
Finance interest received 63 56 59 52
Profit before taxation 2 600 2 125 2 607 2 119
Taxation 20 733 591 708 564
Profit after taxation 1 867 1 534 1 899 1 555
Attributable to:
Non-controlling interests (1) -
Equity holders of the parent 1 868 1 534
Profit attributable to shareholders 1 867 1 534 1 899 1 555
Earnings per share cents per share cents per share % change
Basic 21 757.1 626.5 20.8
Headline 21 765.1 634.8 20.5
Diluted basic 21 707.2 576.5 22.7
Diluted headline 21 715.1 584.2 22.4
consolidated income statementsfor the year ended 29 March 2014
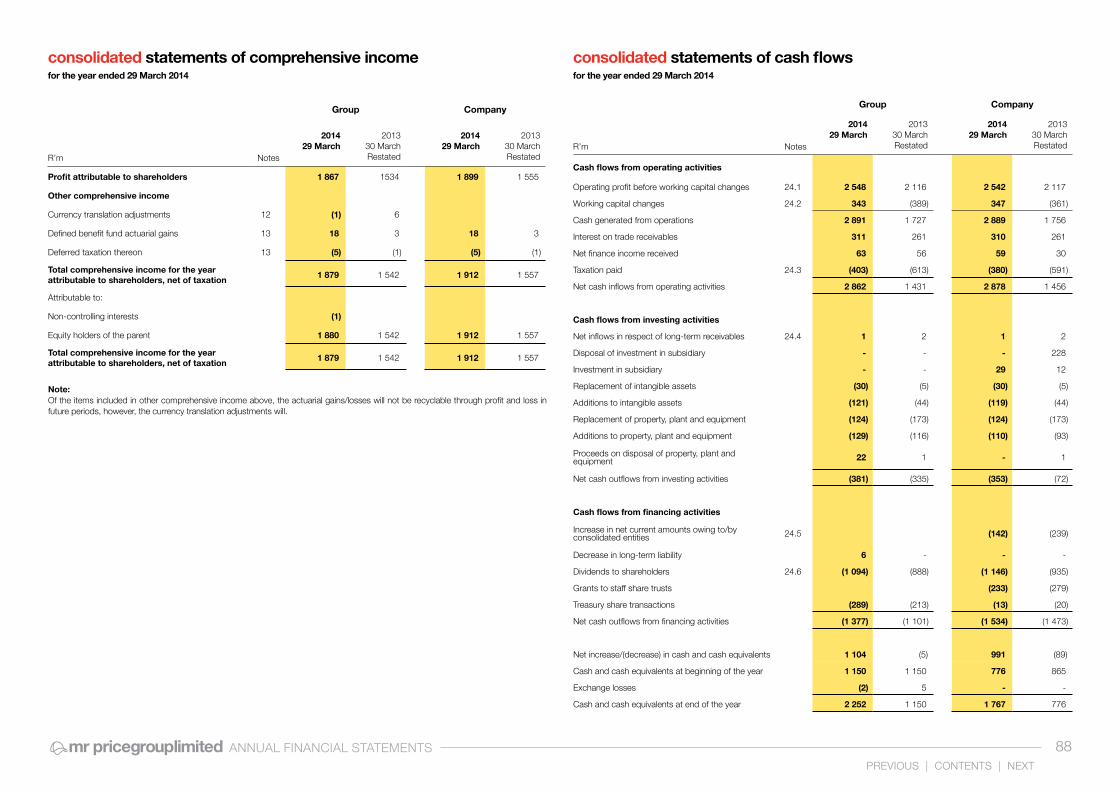
ANNUAL FINANCIAL STATEMENTS 88PREVIOUS | CONTENTS | NEXT
consolidated statements of comprehensive incomefor the year ended 29 March 2014
consolidated statements of cash flowsfor the year ended 29 March 2014
Group Company
R’m Notes
201429 March
201330 MarchRestated
201429 March
201330 MarchRestated
Profit attributable to shareholders 1 867 1534 1 899 1 555
Other comprehensive income
Currency translation adjustments 12 (1) 6
Defined benefit fund actuarial gains 13 18 3 18 3
Deferred taxation thereon 13 (5) (1) (5) (1)
Total comprehensive income for the year attributable to shareholders, net of taxation
1 879 1 542 1 912 1 557
Attributable to:
Non-controlling interests (1)
Equity holders of the parent 1 880 1 542 1 912 1 557
Total comprehensive income for the year attributable to shareholders, net of taxation
1 879 1 542 1 912 1 557
Group Company
R’m Notes
201429 March
201330 MarchRestated
201429 March
201330 MarchRestated
Cash flows from operating activities
Operating profit before working capital changes 24.1 2 548 2 116 2 542 2 117
Working capital changes 24.2 343 (389) 347 (361)
Cash generated from operations 2 891 1 727 2 889 1 756
Interest on trade receivables 311 261 310 261
Net finance income received 63 56 59 30
Taxation paid 24.3 (403) (613) (380) (591)
Net cash inflows from operating activities 2 862 1 431 2 878 1 456
Cash flows from investing activities
Net inflows in respect of long-term receivables 24.4 1 2 1 2
Disposal of investment in subsidiary - - - 228
Investment in subsidiary - - 29 12
Replacement of intangible assets (30) (5) (30) (5)
Additions to intangible assets (121) (44) (119) (44)
Replacement of property, plant and equipment (124) (173) (124) (173)
Additions to property, plant and equipment (129) (116) (110) (93)
Proceeds on disposal of property, plant andequipment 22 1 - 1
Net cash outflows from investing activities (381) (335) (353) (72)
Cash flows from financing activities
Increase in net current amounts owing to/byconsolidated entities 24.5 (142) (239)
Decrease in long-term liability 6 - - -
Dividends to shareholders 24.6 (1 094) (888) (1 146) (935)
Grants to staff share trusts (233) (279)
Treasury share transactions (289) (213) (13) (20)
Net cash outflows from financing activities (1 377) (1 101) (1 534) (1 473)
Net increase/(decrease) in cash and cash equivalents 1 104 (5) 991 (89)
Cash and cash equivalents at beginning of the year 1 150 1 150 776 865
Exchange losses (2) 5 - -
Cash and cash equivalents at end of the year 2 252 1 150 1 767 776
Note:Of the items included in other comprehensive income above, the actuarial gains/losses will not be recyclable through profit and loss in future periods, however, the currency translation adjustments will.

ANNUAL FINANCIAL STATEMENTS 89PREVIOUS | CONTENTS | NEXT
statement of changes in equity for the year ended 29 March 2014
Attributable to the equity holders of the parentTreasury share transactions
R’m
Notes Share capital
Share premium
Participants in staff share investment
trust
Capital redemption reserve fund
Share-based
payments reserve
Treasury shares at
cost
Deficit on treasury share
transactions
Taxation relating to grants to
share trusts
Foreign currency
translation reserve
Defined benefit fund
actuarial gains and
losses
Insurance reserve
Retained income
Total Non-
controlling interests
Total Equity
Group
Balance at 1 April 2012 - 12 15 - 114 (685) (260) 76 (22) (10) 4 3 537 2 781 - 2 781
Change in accounting policy 1.1 (4) (4) (4)
Total comprehensive income 6 2 - 1 534 1 542 - 1 542
Profit for the year 1 534 1 534 1 534
Other comprehensive income: 6 2 - - 8 - 8 Currency translation adjustments 12 6 6 6 Defined benefit fund actuarial gains 13 3 3 3 Deferred taxation thereon 13 (1) (1) (1)
Treasury shares acquired 11 (279) (279) (279)Taxation relating to grants to share trusts 11 29 29 29 Effect of consolidation of staff share trusts 11 5 (5) - -Deficit on treasury share transactions 11 (113) (113) (113)Recognition of share-based payments 9 63 63 63 Share-based payments reserve released toretained income for vested options
(40) 40 - -
Treasury shares sold 11 178 178 178 2012 final dividend to shareholders 22 (551) (551) (551)2013 interim dividend to shareholders 22 (337) (337) (337)
Balance at 30 March 2013 - 12 20 - 137 (791) (373) 105 (16) (8) - 4 223 3 309 - 3 309
Total comprehensive income (1) 13 - 1 868 1 880 (1) 1 879
Profit for the year 1 868 1 868 (1) 1 867
Other comprehensive income (1) 13 - - 12 - 12 Currency translation adjustments 12 (1) (1) (1)Defined benefit fund actuarial gains 13 18 18 18 Deferred taxation thereon 13 (5) (5) (5)
Treasury shares acquired 11 (365) (365) (365)Taxation relating to grants to share trusts 11 41 41 41 Effect of consolidation of staff share trusts 11 5 (5) - -Deficit on treasury share transactions 11 (186) (186) (186)Recognition of share-based payments 9 75 75 75 Share-based payments reserve released toretained income for vested options
(51) 51 - -
Treasury shares sold 11 263 263 263 2013 final dividend to shareholders 22 (666) (666) (666)2014 interim dividend to shareholders 22 (428) (428) (428)
Balance at 29 March 2014 - 12 25 - 161 (898) (559) 146 (17) 5 - 5 048 3 923 (1) 3 922

ANNUAL FINANCIAL STATEMENTS 90PREVIOUS | CONTENTS | NEXT
statement of changes in equity for the year ended 29 March 2014
Treasury share transactions
R’m
Notes Share capital Share premium Capital
redemption reserve fund
Share-based payments reserve
Treasury shares at cost
Deficit on treasury share transactions
Taxation relating to
grants to share trusts
Defined benefit fund actuarial
gains and losses
Retained income
Total Equity
Company
Balance at 1 April 2012 - - - 114 (874) (173) 76 (10) 3 403 2 536
Change in accounting policy 1.1 31 31
Total comprehensive income 2 1 555 1 557
Profit for the year 1 555 1 555
Other comprehensive income 2 2
Defined benefit fund actuarial losses 13 3 3
Deferred taxation thereon 13 (1) (1)
Grants to staff share trusts 11 (279) (279)
Deficit on treasury share transactions 11 (20) (20)
Taxation relating to grants to share trusts 11 29 29
Recognition of share-based payments 9 63 63
Share-based payments reserve released to retained income for vested options (40) 40 -
2012 final dividend to shareholders 22 (583) (583)
2013 interim dividend to shareholders 22 (352) (352)
Balance at 30 March 2013 - - - 137 (1 153) (193) 105 (8) 4 094 2 982
Total comprehensive income 13 1 899 1 912
Profit for the year 1 899 1 899
Other comprehensive income 13 13
Defined benefit fund actuarial gains 13 18 18
Deferred taxation thereon 13 (5) (5)
Grants to staff share trusts 11 (233) (233)
Deficit on treasury share transactions 11 (13) (13)
Taxation relating to grants to share trusts 11 41 41
Recognition of share-based payments 9 75 75
Share-based payments reserve released to retained income for vested options (51) 51 -
2013 final dividend to shareholders 22 (701) (701)
2014 interim dividend to shareholders 22 (445) (445)
Balance at 29 March 2014 - - - 161 (1 386) (206) 146 5 4 898 3 618

ANNUAL FINANCIAL STATEMENTS 91PREVIOUS | CONTENTS | NEXT
Statement, Interpretation or StandardEffective for annual
periods beginning
IAS 1 - Presentation of Items of Other Comprehensive Income (amendments) 1 July 2012
IAS 19 - Employee Benefits (amendment) 1 January 2013
IAS 27 - Separate Financial Statements 1 January 2013
IAS 28 - Investments in Associates and Joint Ventures 1 January 2013
IFRS 1 - Relief from full retrospective application when accounting for loans received from government at below market rate of interest 1 January 2013
IFRS 7 - Disclosures - offsetting financial assets and liabilities (amendment) 1 January 2013
IFRS 10 - Consolidated Financial Statements 1 January 2013
IFRS 11 - Joint Arrangements 1 January 2013
IFRS 12 - Disclosure of Involvement with Other Entities 1 January 2013
IFRS 10, IFRS 11 and IFRS 12 - Transition guidance amendments 1 January 2013
IFRS 13 - Fair Value Measurement 1 January 2013
Improvements to IFRSs Mainly 1 January 2013
1. Adoption of new Standards and changes in accounting policies
The following new Standards and Interpretations were adopted during the year and did not lead to any changes in the Group’s accounting policies, except as detailed in note 1.1:
Impact on income statement (increase/(decrease) in profit):
1.1 Changes in accounting policies
IFRS 10 - Consolidated financial statements
The Group adopted IFRS 10 in the current year; the application of IFRS 10 affected the accounting for the Group’s 100% interest in the Financial Services insurance cell captives. For all financial years up to 30 March 2013, the insurance cell captives were considered to be a subsidiary under IAS 27 and SIC 12, due to the fact that the Group was responsible for 100% of the insurance risk. Under IFRS 10, the cell captives do not meet the requirement of a deemed separate entity as the assets, liabilities and equity are not ring-fenced in all events. Hence the cell captives are no longer consolidated, but are now reflected in the financial statements as reinsurance assets and liabilities in terms of IFRS 4. This change in policy has been accounted for retrospectively and the opening balances as at 1 April 2012 have been restated in the financial statements. The quantitative impact on the financial statements is as follows:
2013
R’mGroup Company
Retail sales and other revenue - (57)
Income from consolidated entities - 49
Premium income - (106)
Costs and expenses 3 33
Administrative and other operating expenses 3 33
Finance interest received - (4)
Loss before taxation (3) (28)
Taxation - 22Loss after taxation (3) (6)
Decrease on statement of other comprehensive income:
Total comprehensive loss for the year attributable to shareholders, net of taxation
(3) (6)
Decrease on earnings per share:cents per
shareBasic 1.11
Headline 0.70
Diluted basic 1.02
Diluted headline 0.65
notes to the financial statements for the year ended 29 March 2014

ANNUAL FINANCIAL STATEMENTS 92PREVIOUS | CONTENTS | NEXT
IFRS 12 Disclosure of Interests in Other Entities
IFRS 12 sets out the requirements for disclosures relating to an entity’s interests in subsidiaries, joint arrangements, associates and structured entities. The requirements in IFRS 12 are more comprehensive than the previously existing disclosure requirements for subsidiaries. For example, where a subsidiary is controlled with less than a majority of voting rights. The Group has subsidiaries with non-controlling interests, and the cell captives which are treated as consolidated structured entities, in terms of IFRS 10. IFRS 12 disclosures are provided in Note 5.2.
IFRS 13 Fair Value Measurement
IFRS 13 establishes a single source of guidance under IFRS for all fair value measurements. IFRS 13 does not change when an entity is required to use fair value, but rather provides guidance on how to measure fair value under IFRS. IFRS 13 defines fair value as an exit price. As a result of the guidance in IFRS 13, the Group re-assessed its policies for measuring fair values, in particular, its valuation inputs such as non-performance risk for fair value measurement of liabilities. IFRS 13 also requires additional disclosures. Application of IFRS 13 has not materially impacted the fair value measurements of the Group. Additional disclosures where required, are provided in the individual notes relating to the assets and liabilities whose fair values were determined. Fair value hierarchy is provided in Note 28.5.
1.2 Statements, Interpretations or Standards
At the date of authorisation of these financial statements, the following Statements, Interpretations and Standards were in issue but not yet effective:
The Directors anticipate that the adoption of the above in future periods will have no material financial impact on the financial statements of the Group and will only result in additional disclosure requirements with the exception of IFRS 9. The impact of this new statement is currently being assessed. These Statements, Interpretations and Standards will be adopted at the respective effective dates.
Impact on equity (increase/(decrease) in net equity):
Decrease on statement of cash flows:
Group Company
R’m2013 As at 1
April 2012 2013 As at 1 April 2012
Assets
Non-current assets - - 1 1
Consolidated entities - - 1 1
Current assets - - 65 49
Reinsurance assets 72 51 72 51
Current amounts owing by consolidated entities - - (7) (2)
Cash and cash equivalents (72) (51) - -
Equity and liabilities 7 4 - -
Insurance reserve 7 4 - -
Current liabilities (7) (4) (28) (19)
Trade and other payables 6 6 - (1)
Reinsurance liabilities (28) (18) (28) (18)
Taxation 15 8 - -
Net impact on equity - - 38 31
2013
R’mGroup Company
Operating (21) -
Net decrease in cash and cash equivalents (21) -
Statement, Interpretation or StandardEffective for annual
periods beginning on or after
IAS 32 - Offsetting Financial Assets and Financial Liabilities (amendments) 1 January 2014
IAS 36 - Disclosure requirements for the recoverable amount of impaired assets (amendments)
1 January 2014
IFRS 9 - Financial instruments 1 January 2018
notes to the financial statements for the year ended 29 March 2014
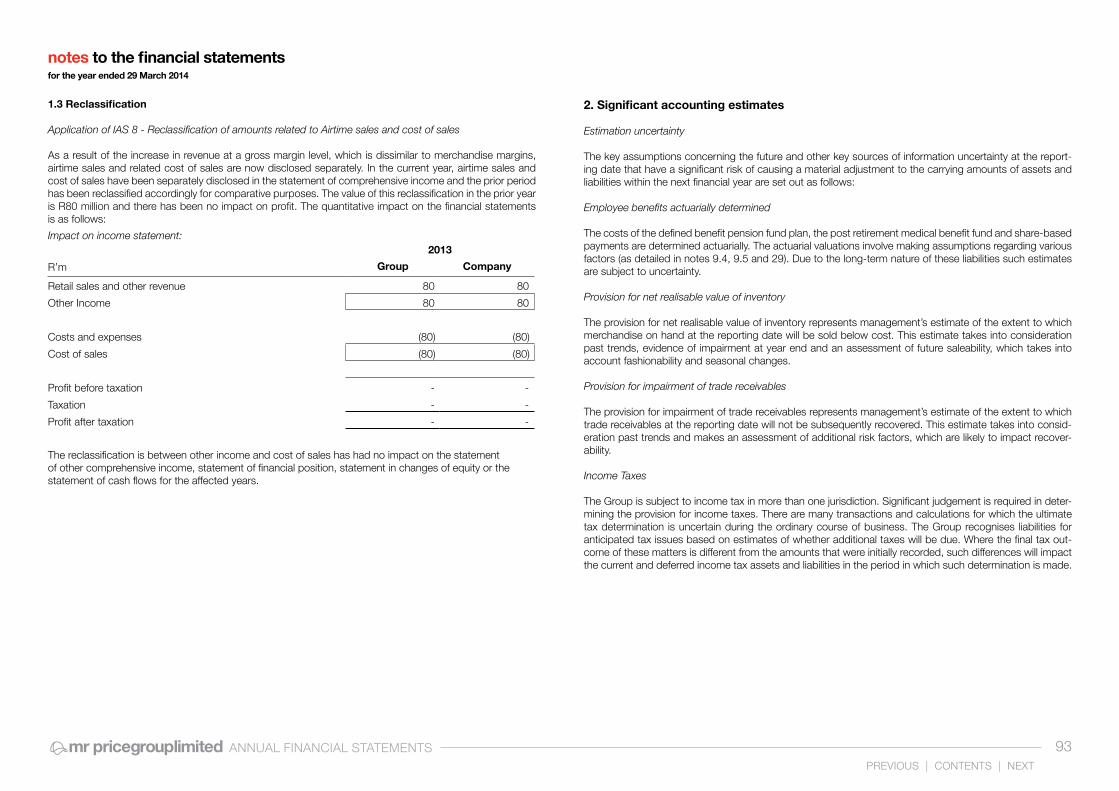
ANNUAL FINANCIAL STATEMENTS 93PREVIOUS | CONTENTS | NEXT
1.3 Reclassification
Application of IAS 8 - Reclassification of amounts related to Airtime sales and cost of sales
As a result of the increase in revenue at a gross margin level, which is dissimilar to merchandise margins, airtime sales and related cost of sales are now disclosed separately. In the current year, airtime sales and cost of sales have been separately disclosed in the statement of comprehensive income and the prior period has been reclassified accordingly for comparative purposes. The value of this reclassification in the prior year is R80 million and there has been no impact on profit. The quantitative impact on the financial statements is as follows:
Impact on income statement:
The reclassification is between other income and cost of sales has had no impact on the statement of other comprehensive income, statement of financial position, statement in changes of equity or the statement of cash flows for the affected years.
2. Significant accounting estimates
Estimation uncertainty
The key assumptions concerning the future and other key sources of information uncertainty at the report-ing date that have a significant risk of causing a material adjustment to the carrying amounts of assets and liabilities within the next financial year are set out as follows:
Employee benefits actuarially determined
The costs of the defined benefit pension fund plan, the post retirement medical benefit fund and share-based payments are determined actuarially. The actuarial valuations involve making assumptions regarding various factors (as detailed in notes 9.4, 9.5 and 29). Due to the long-term nature of these liabilities such estimates are subject to uncertainty.
Provision for net realisable value of inventory
The provision for net realisable value of inventory represents management’s estimate of the extent to which merchandise on hand at the reporting date will be sold below cost. This estimate takes into consideration past trends, evidence of impairment at year end and an assessment of future saleability, which takes into account fashionability and seasonal changes.
Provision for impairment of trade receivables
The provision for impairment of trade receivables represents management’s estimate of the extent to which trade receivables at the reporting date will not be subsequently recovered. This estimate takes into consid-eration past trends and makes an assessment of additional risk factors, which are likely to impact recover-ability.
Income Taxes
The Group is subject to income tax in more than one jurisdiction. Significant judgement is required in deter-mining the provision for income taxes. There are many transactions and calculations for which the ultimate tax determination is uncertain during the ordinary course of business. The Group recognises liabilities for anticipated tax issues based on estimates of whether additional taxes will be due. Where the final tax out-come of these matters is different from the amounts that were initially recorded, such differences will impact the current and deferred income tax assets and liabilities in the period in which such determination is made.
2013
R’m Group Company
Retail sales and other revenue 80 80
Other Income 80 80
Costs and expenses (80) (80)
Cost of sales (80) (80)
Profit before taxation - -
Taxation - -
Profit after taxation - -
notes to the financial statements for the year ended 29 March 2014

ANNUAL FINANCIAL STATEMENTS
3. Property, plant and equipment
Group Company
R’m2014 2013 2014 2013
Owned
Cost 1 700 1 528 1 611 1 434
Accumulated depreciation and impairment (982) (868) (952) (845)
Net carrying amount 718 660 659 589
Leased
Cost 27 27 27 27
Accumulated depreciation (27) (27) (27) (27)
Net carrying amount - - - -
Total net carrying amount 718 660 659 589
An analysis of the movement of property, plant and equipment is shown on pages 117 and 118.
4. Intangible assets
Cost or carrying amount 313 199 306 194
Accumulated amortisation and impairment (98) (94) (98) (94)
Net carrying amount 215 105 208 100
An analysis of the movement of intangible assets is shown on page 119.
notes to the financial statements for the year ended 29 March 2014
94PREVIOUS | CONTENTS | NEXT

ANNUAL FINANCIAL STATEMENTS 95PREVIOUS | CONTENTS | NEXT
5. Consolidated entities and material partly-owned subsidiaries 5.2 Partly-owned subsidiary
Financial information of subsidiaries that have non-controlling interests are provided below:Company
R’m2014 2013
Restated
5.1 Consolidated entities
Carrying value of shares 5 5
Ordinary shares at cost 5 5
Carrying value of long-term loans 13 35
Long-term loans at cost 14 36
Impairment provisions (1) (1)
The loans are unsecured, bear interest at rates of up to 15% per annum and have no fixed dates of repayment.
18 40
Net current amounts owing by/(to) consolidated entities 283 141
Current amounts owing by consolidated entities 290 146
Current amounts owing to consolidated entities (7) (5)
Current accounts are interest free and are settled within 12 months.
301 181
An analysis of the financial interest in consolidated entities is shown on page 120.
Group
%2014 2013
Proportion of equity interest held by non-controlling interests 45 -
R’m2014 2013
Loss attributable to non-controlling interest (1) -
The summarised financial information of the subsidiary are provided below.This information is based on amounts before inter-company eliminations.
R’m2014 2013
Summarised income statement:
Selling expenses (1) -
Administrative and other operating expenses (1) -
Loss before taxation (2) -
Total comprehensive income (2) -
Attributable to non-controlling interests (1) -
notes to the financial statements for the year ended 29 March 2014

ANNUAL FINANCIAL STATEMENTS 96PREVIOUS | CONTENTS | NEXT
5.2 Partly-owned subsidiary (continued)
Financial information of subsidiaries that have material non-controlling interests are provided below:
R’m2014 2013
Summarised statement of financial position:
Intangible assets 2 -
Trade and other receivables 1 -
Cash and cash equivalents 14 -
Long-term liability (6) -
Trade and other payables (5) -
Inter-company loan (8) -
Net equity (2) -
Attributable to equity holders of parent (1) -
Non-controlling interest (1) -
Summarised statement of cash flows:
Operating 9 -
Investing (2) -
Financing 7 -
Net increase in cash and cash equivalents 14 -
Long-term liability
The long term liability disclosed above represents a loan received from the non-controlling shareholders of the subsidiary. The loan has no set date of repayment and bears interest at a rate determined at thediscretion of the Directors, currently 0%.
6. Long-term receivables
7. Inventories
Group Company
R’m2014 2013 2014 2013
Enterprise development loan
Loan to accredited supplier 7 8 7 8
Total loan 8 9 8 9
Less: amount to be received in the next financial year transferred to trade and other receivables
(1) (1) (1) (1)
7 8 7 8
The Company loaned R10 million to a long-standing supplier as part of an enterprise development initiative to assist in the construction of a new footwear factory with enhanced capacity. The sum is repayable in monthly instalments of R100 000 which commenced in January 2013. The monthly instalment increases by 7.0% annually.
Group Company
R’m2014 2013 2014 2013
Merchandise purchased for resale 1 384 1 224 1 283 1 151
Consumable stores 19 12 20 12
1 403 1 236 1 303 1 163
The write-down of inventories provided for in the valuation of merchandise purchased for resale was:
114 102 108 95
notes to the financial statements for the year ended 29 March 2014
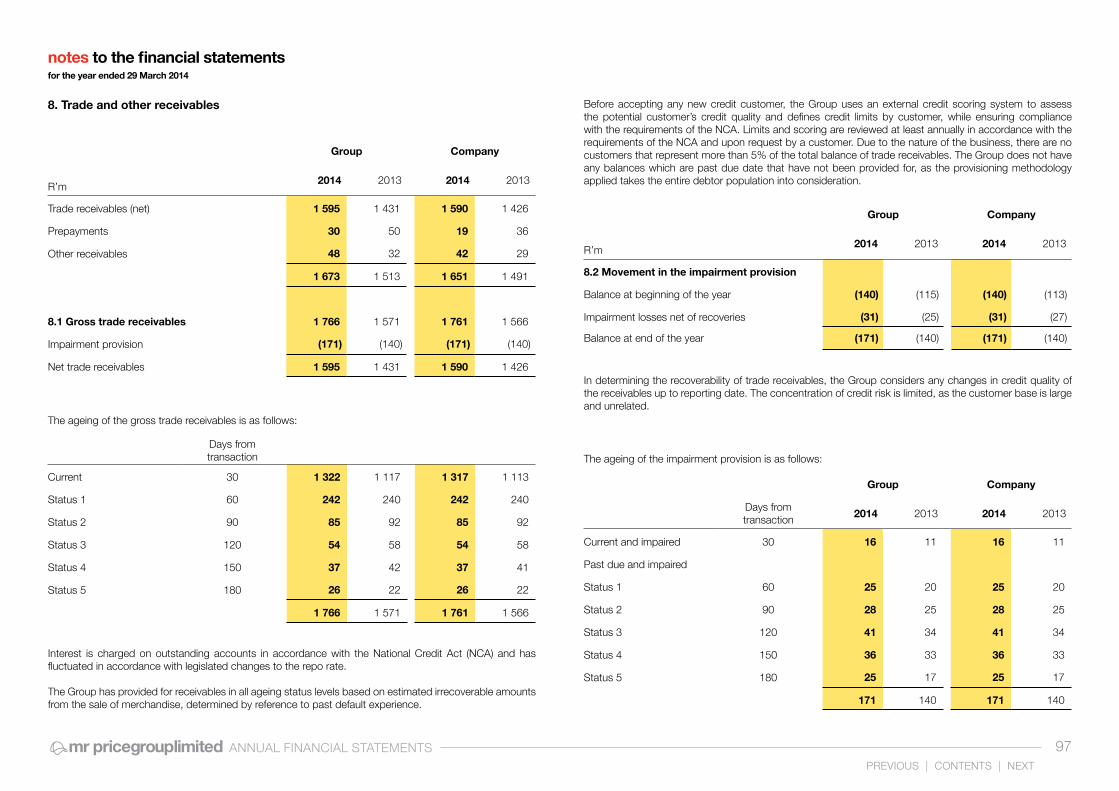
ANNUAL FINANCIAL STATEMENTS 97PREVIOUS | CONTENTS | NEXT
8. Trade and other receivables
Interest is charged on outstanding accounts in accordance with the National Credit Act (NCA) and has fluctuated in accordance with legislated changes to the repo rate.
The Group has provided for receivables in all ageing status levels based on estimated irrecoverable amounts from the sale of merchandise, determined by reference to past default experience.
Before accepting any new credit customer, the Group uses an external credit scoring system to assess the potential customer’s credit quality and defines credit limits by customer, while ensuring compliance with the requirements of the NCA. Limits and scoring are reviewed at least annually in accordance with the requirements of the NCA and upon request by a customer. Due to the nature of the business, there are no customers that represent more than 5% of the total balance of trade receivables. The Group does not have any balances which are past due date that have not been provided for, as the provisioning methodology applied takes the entire debtor population into consideration.
In determining the recoverability of trade receivables, the Group considers any changes in credit quality of the receivables up to reporting date. The concentration of credit risk is limited, as the customer base is large and unrelated.
Group Company
R’m2014 2013 2014 2013
Trade receivables (net) 1 595 1 431 1 590 1 426
Prepayments 30 50 19 36
Other receivables 48 32 42 29
1 673 1 513 1 651 1 491
8.1 Gross trade receivables 1 766 1 571 1 761 1 566
Impairment provision (171) (140) (171) (140)
Net trade receivables 1 595 1 431 1 590 1 426
Group Company
R’m2014 2013 2014 2013
8.2 Movement in the impairment provision
Balance at beginning of the year (140) (115) (140) (113)
Impairment losses net of recoveries (31) (25) (31) (27)
Balance at end of the year (171) (140) (171) (140)
The ageing of the gross trade receivables is as follows:
Days from transaction
Current 30 1 322 1 117 1 317 1 113
Status 1 60 242 240 242 240
Status 2 90 85 92 85 92
Status 3 120 54 58 54 58
Status 4 150 37 42 37 41
Status 5 180 26 22 26 22
1 766 1 571 1 761 1 566
The ageing of the impairment provision is as follows:
Group Company
Days from transaction 2014 2013 2014 2013
Current and impaired 30 16 11 16 11
Past due and impaired
Status 1 60 25 20 25 20
Status 2 90 28 25 28 25
Status 3 120 41 34 41 34
Status 4 150 36 33 36 33
Status 5 180 25 17 25 17
171 140 171 140
notes to the financial statements for the year ended 29 March 2014

ANNUAL FINANCIAL STATEMENTS 98PREVIOUS | CONTENTS | NEXT
8.3 Other receivables
9. Share capital
Group Company
R’m2014 2013 2014 2013
The expected maturity for other receivablesis as follows:
On demand 5 5 5 6
Less than 3 months 33 18 27 14
3 months to one year 10 9 10 9
48 32 42 29
Group
Number2014 2013
Options over ordinary shares in Mr Price Group Limited
Beginning of the year 151 569 310 539
Surrendered by participants - (14 500)
Options exercised (96 102) (144 470)
End of the year 55 467 151 569
R’000
9.1 Authorised
323 300 000 ordinary shares of 0.025 cent each 81 81 81 81
19 700 000 B ordinary shares of 0.3 cent each 59 59 59 59
Total authorised share capital 140 140 140 140
9.2 Issued
251 183 867 (2013: 251 183 867) ordinary shares of 0.025 cent each
63 63 63 63
B ordinary
13 445 081 (2013: 13 445 081) B ordinary shares of 0.3 cent each
40 40 40 40
Total issued share capital 103 103 103 103
9.3 B ordinary shares
The B ordinary shares are unlisted and are convertible into ordinary shares on a one-for-one basis at the instance of the B ordinary shareholders. The voting rights attached to the ordinary and B ordinary shares are in the same ratio as the par value of the respective shares. In the event of a poll, ordinary shareholders are entitled to one vote per share and B ordinary shareholders to 12 votes per share.
9.4 Share Trusts and Share Purchase Schemes
The company operates six share trusts, a share option scheme and two forfeitable share plans for the benefit of associates, including executive directors, employed by the Company and its consolidated entities. In terms of the deeds of trust, ordinary shares in Mr Price Group Limited may be acquired by the trust or awarded under the schemes for the benefit of associates in the Group, including directors. These share schemes are more fully detailed in the Remuneration Report on pages 63 to 74.
Details of shares and options held in terms of the deed of trust and the schemes are as follows:
9.4.1 The Mr Price Group Share Trust
This trust is currently dormant.
9.4.2 The Mr Price Group Share Option Scheme
Options held at the beginning of the year were exercisable at prices between R3.06 and R21.20 per share in a period between 3 and 10 years after the dates of the offers which commenced in May 1989. No new options will be issued under this scheme.
The vesting period of the options is detailed on page 70.
Option prices have been restated where necessary to recognise subdivisions and capitalisation issues.The share options under this scheme have all vested and have a weighted average option price of R12.73.
notes to the financial statements for the year ended 29 March 2014
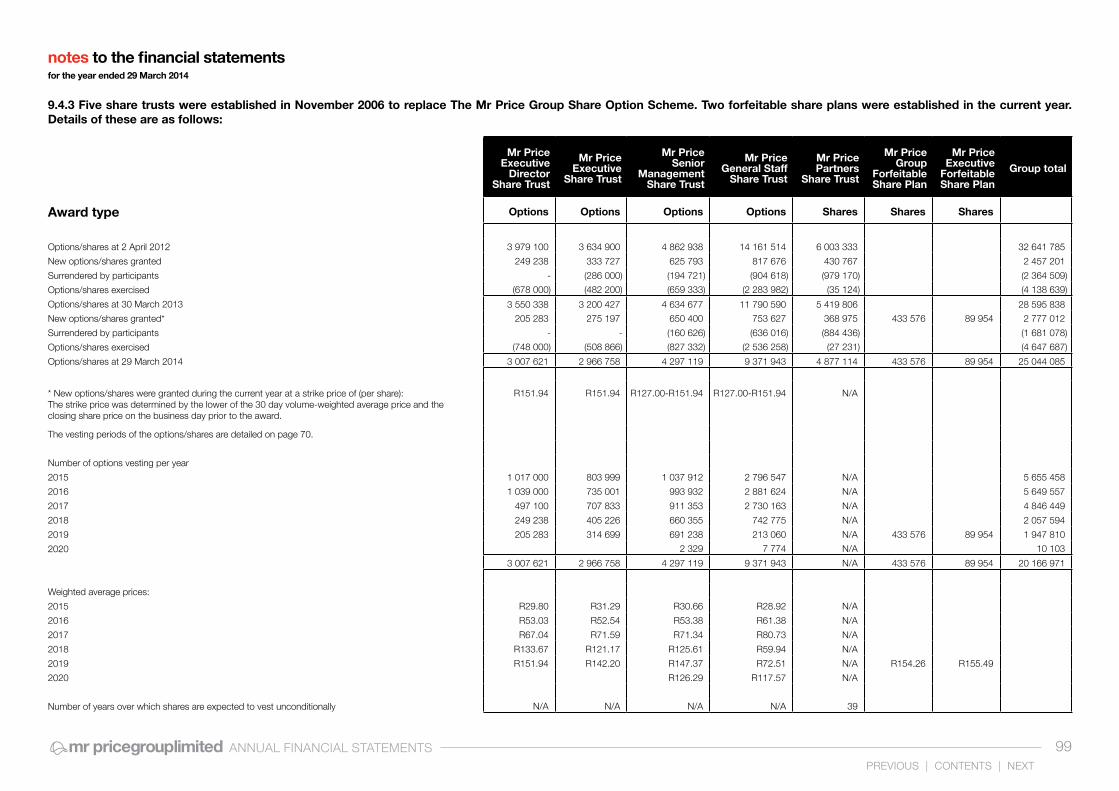
ANNUAL FINANCIAL STATEMENTS 99PREVIOUS | CONTENTS | NEXT
9.4.3 Five share trusts were established in November 2006 to replace The Mr Price Group Share Option Scheme. Two forfeitable share plans were established in the current year. Details of these are as follows:
Mr Price Executive
Director Share Trust
Mr Price Executive
Share Trust
Mr Price Senior
Management Share Trust
Mr Price General Staff
Share Trust
Mr Price Partners
Share Trust
Mr Price Group
Forfeitable Share Plan
Mr Price Executive
Forfeitable Share Plan
Group total
Award type Options Options Options Options Shares Shares Shares
Options/shares at 2 April 2012 3 979 100 3 634 900 4 862 938 14 161 514 6 003 333 32 641 785
New options/shares granted 249 238 333 727 625 793 817 676 430 767 2 457 201
Surrendered by participants - (286 000) (194 721) (904 618) (979 170) (2 364 509)
Options/shares exercised (678 000) (482 200) (659 333) (2 283 982) (35 124) (4 138 639)
Options/shares at 30 March 2013 3 550 338 3 200 427 4 634 677 11 790 590 5 419 806 28 595 838
New options/shares granted* 205 283 275 197 650 400 753 627 368 975 433 576 89 954 2 777 012
Surrendered by participants - - (160 626) (636 016) (884 436) (1 681 078)
Options/shares exercised (748 000) (508 866) (827 332) (2 536 258) (27 231) (4 647 687)
Options/shares at 29 March 2014 3 007 621 2 966 758 4 297 119 9 371 943 4 877 114 433 576 89 954 25 044 085
* New options/shares were granted during the current year at a strike price of (per share):The strike price was determined by the lower of the 30 day volume-weighted average price and theclosing share price on the business day prior to the award.
R151.94 R151.94 R127.00-R151.94 R127.00-R151.94 N/A
The vesting periods of the options/shares are detailed on page 70.
Number of options vesting per year
2015 1 017 000 803 999 1 037 912 2 796 547 N/A 5 655 458
2016 1 039 000 735 001 993 932 2 881 624 N/A 5 649 557
2017 497 100 707 833 911 353 2 730 163 N/A 4 846 449
2018 249 238 405 226 660 355 742 775 N/A 2 057 594
2019 205 283 314 699 691 238 213 060 N/A 433 576 89 954 1 947 810
2020 2 329 7 774 N/A 10 103
3 007 621 2 966 758 4 297 119 9 371 943 N/A 433 576 89 954 20 166 971
Weighted average prices:
2015 R29.80 R31.29 R30.66 R28.92 N/A
2016 R53.03 R52.54 R53.38 R61.38 N/A
2017 R67.04 R71.59 R71.34 R80.73 N/A
2018 R133.67 R121.17 R125.61 R59.94 N/A
2019 R151.94 R142.20 R147.37 R72.51 N/A R154.26 R155.49
2020 R126.29 R117.57 N/A
Number of years over which shares are expected to vest unconditionally N/A N/A N/A N/A 39
notes to the financial statements for the year ended 29 March 2014
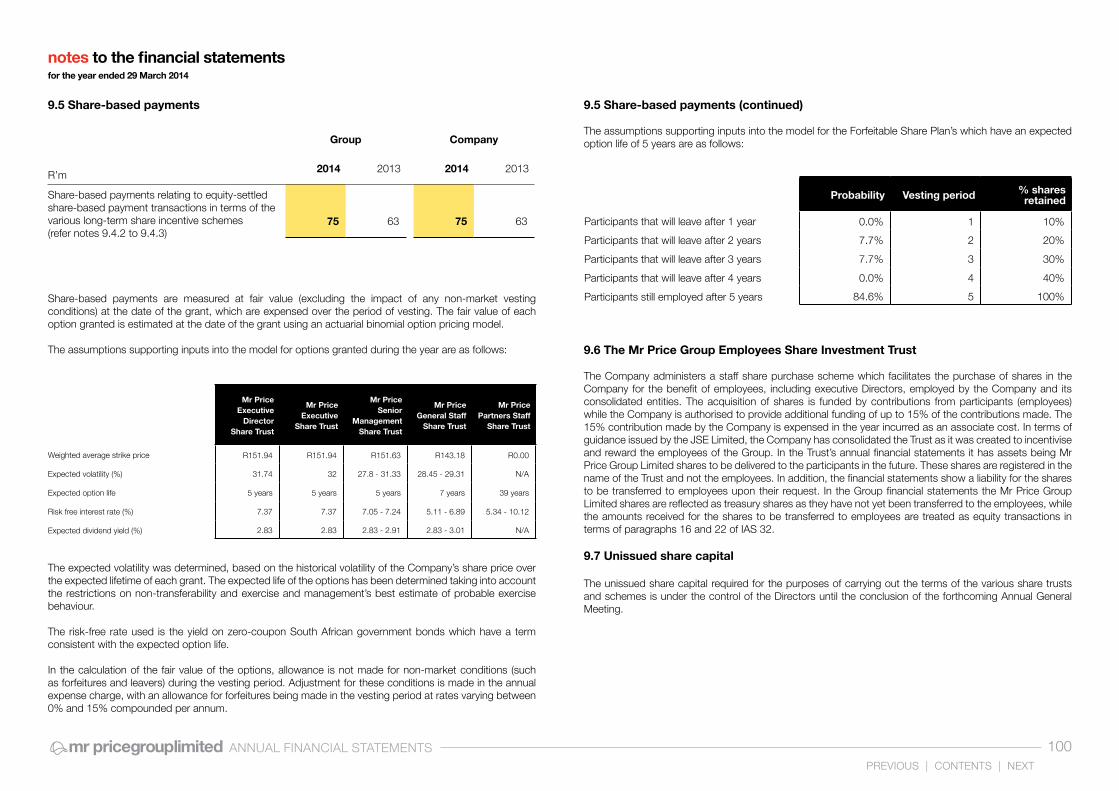
ANNUAL FINANCIAL STATEMENTS 100PREVIOUS | CONTENTS | NEXT
9.5 Share-based payments
Group Company
R’m2014 2013 2014 2013
Share-based payments relating to equity-settled share-based payment transactions in terms of the various long-term share incentive schemes(refer notes 9.4.2 to 9.4.3)
75 63 75 63
Share-based payments are measured at fair value (excluding the impact of any non-market vesting conditions) at the date of the grant, which are expensed over the period of vesting. The fair value of each option granted is estimated at the date of the grant using an actuarial binomial option pricing model.
The assumptions supporting inputs into the model for options granted during the year are as follows:
The expected volatility was determined, based on the historical volatility of the Company’s share price over the expected lifetime of each grant. The expected life of the options has been determined taking into account the restrictions on non-transferability and exercise and management’s best estimate of probable exercise behaviour.
The risk-free rate used is the yield on zero-coupon South African government bonds which have a term consistent with the expected option life.
In the calculation of the fair value of the options, allowance is not made for non-market conditions (such as forfeitures and leavers) during the vesting period. Adjustment for these conditions is made in the annual expense charge, with an allowance for forfeitures being made in the vesting period at rates varying between 0% and 15% compounded per annum.
9.6 The Mr Price Group Employees Share Investment Trust
The Company administers a staff share purchase scheme which facilitates the purchase of shares in the Company for the benefit of employees, including executive Directors, employed by the Company and its consolidated entities. The acquisition of shares is funded by contributions from participants (employees) while the Company is authorised to provide additional funding of up to 15% of the contributions made. The 15% contribution made by the Company is expensed in the year incurred as an associate cost. In terms of guidance issued by the JSE Limited, the Company has consolidated the Trust as it was created to incentivise and reward the employees of the Group. In the Trust’s annual financial statements it has assets being Mr Price Group Limited shares to be delivered to the participants in the future. These shares are registered in the name of the Trust and not the employees. In addition, the financial statements show a liability for the shares to be transferred to employees upon their request. In the Group financial statements the Mr Price Group Limited shares are reflected as treasury shares as they have not yet been transferred to the employees, while the amounts received for the shares to be transferred to employees are treated as equity transactions in terms of paragraphs 16 and 22 of IAS 32.
9.7 Unissued share capital
The unissued share capital required for the purposes of carrying out the terms of the various share trusts and schemes is under the control of the Directors until the conclusion of the forthcoming Annual General Meeting.
9.5 Share-based payments (continued)
The assumptions supporting inputs into the model for the Forfeitable Share Plan’s which have an expected option life of 5 years are as follows:
Mr Price Executive
Director Share Trust
Mr Price Executive
Share Trust
Mr Price Senior
Management Share Trust
Mr Price General Staff
Share Trust
Mr Price Partners Staff
Share Trust
Weighted average strike price R151.94 R151.94 R151.63 R143.18 R0.00
Expected volatility (%) 31.74 32 27.8 - 31.33 28.45 - 29.31 N/A
Expected option life 5 years 5 years 5 years 7 years 39 years
Risk free interest rate (%) 7.37 7.37 7.05 - 7.24 5.11 - 6.89 5.34 - 10.12
Expected dividend yield (%) 2.83 2.83 2.83 - 2.91 2.83 - 3.01 N/A
Probability Vesting period % shares retained
Participants that will leave after 1 year 0.0% 1 10%
Participants that will leave after 2 years 7.7% 2 20%
Participants that will leave after 3 years 7.7% 3 30%
Participants that will leave after 4 years 0.0% 4 40%
Participants still employed after 5 years 84.6% 5 100%
notes to the financial statements for the year ended 29 March 2014

ANNUAL FINANCIAL STATEMENTS
10. Capital reserves
Group Company
R’m2014 2013 2014 2013
10.1 Share premium account 12 12 - -
10.2 Participants in staff share investment trust(note 9.6)
25 20
Beginning of the year 20 15
Net movement for the year 5 5
10.3 Share-based payments reserve 161 137 161 137
Beginning of the year 137 114 137 114
Recognition of share-based payments for the year 24 23 24 23
Share-based payments for options/shares granted in prior years 56 48 56 48
Share-based payments for options/shares granted in current year
11 5 11 5
Adjustment for forfeitures 8 10 8 10
Share-based payments reserve transferred toretained income for options that have vested from inception to date
(51) (40) (51) (40)
The above equity account represents cumulative share based payment charges that have been credited to equity net of transfers to retained income for options that have vested
Total capital reserves 198 169 161 137
notes to the financial statements for the year ended 29 March 2014
101PREVIOUS | CONTENTS | NEXT

ANNUAL FINANCIAL STATEMENTS 102PREVIOUS | CONTENTS | NEXT
11. Treasury share transactions
The foreign currency translation reserve comprises the cumulative translation adjustments arising on the consolidation of the foreign subsidiaries in Botswana, Nigeria and Ghana.
Refer to note 29 for details of the recognition of defined benefit fund actuarial gains and losses.
12. Foreign currency translation reserve
13. Defined benefit fund actuarial gains and losses
14. Reinsurance
The Company retails insurance products to customers. The prinicipal risk that the insurance cells face is that the actual claims and benefit payments, or the timing thereof, differ from expectations. This is influenced by the frequency of claims, severity of claims, actual benefits paid and subsequent development of long-term claims. Therefore, the objective of the cells is to ensure that sufficient reserves are available to cover these potential liabilities.
Group Company
R’m2014 2013 2014 2013
16 553 902 (2013: 18 856 474) ordinary shares in Mr Price Group Limited held by staff share trusts
(898) (791)
- Balance at beginning of the year (791) (685)
- Treasury shares acquired (365) (279)
- Treasury shares sold 263 178
- Mr Price Group Employees Share Investment Trust (note 9.6)
(5) (5)
Deficit on treasury share transactions (559) (373) (206) (193)
- Balance at beginning of the year (373) (260) (193) (173)
- Current year movement arising from the take-up of vested options
(186) (113) (13) (20)
Taxation relating to grants to share trusts 146 105 146 105
- Balance at beginning of the year 105 76 105 76
- Current year movement 41 29 41 29
Grants by Company to staff share trusts (1 386) (1 153)
- Balance at beginning of the year (1 153) (874)
- Grants made during the year (233) (279)
(1 311) (1 059) (1 446) (1 241)
Group
R’m2014 2013
Beginning of the year (16) (22)
Currency translation adjustments for the year (1) 6
End of the year (17) (16)
Group Company
R’m2014 2013 2014 2013
Beginning of the year (8) (10) (8) (10)
Current year actuarial gains 18 3 18 3
Deferred taxation thereon (5) (1) (5) (1)
End of the year 5 (8) 5 (8)
notes to the financial statements for the year ended 29 March 2014

ANNUAL FINANCIAL STATEMENTS 103PREVIOUS | CONTENTS | NEXT
% of Insured risk
Mr Price Group
Limited
Guardrisk Insurance Company
Limited
Customer Protection Plan 100 -
Funeral Plan 100 -
360 degrees Protection Plan 100 -
A2B Commuter Personal Accident Plan 100 -
Medinet Critical Illness and Hospitalisation Plan 100 -
14. Reinsurance (continued)
The main risks that the insurance cells are exposed to are as follows:
- Mortality risk: the risk of loss arising due to policyholder death experience differing from that expected;- Morbidity risk: the risk of loss arising due to policyholder health experience differing from that expected; - Expense risk: the risk of loss arising from expense experience differing from that expected; and- Policyholder decision risk: the risk of loss arising due to policyholder experiences (lapses and surrenders)
differing from that expected.
The risk structure per product is as follows:
Guardrisk Insurance Company Limited (Cell number 136)
The reinsurance assets and liabilities are made up of the following components:
Receivables are measured at amortised cost and the carrying amounts approximate their fair value.All balances are considered current.
Guardrisk Life Limited (Cell number 048)
Mr Price Group Limited bears 100% of the risk for all products except motor vehicle insurance where the aggregate excess and stop loss on own damage are insured through AIG.
Group and Company
R’m2014 2013
Reinsurance asset
Insurance float 1 1
Cash and cash equivalents 97 71
98 72
Group and Company
R’m2014 2013
Reinsurance liabilities
Unearned premium provision 1 1
Outstanding claims 4 4
IBNR reserve 11 9
Taxation liability 18 14
34 28
Movement in reinsurance liabilities
Outstanding claims 4 3
IBNR reserve 9 6
Taxation liability 14 8
Balance at beginning of the year 27 17
Increase in the year 6 10
Outstanding claims 4 4
IBNR reserve 11 9
Taxation liability 18 14
Balance at end of the year 33 27
Unearned premium provision
Balance at beginning of the year 1 1
Premium received 147 106
Premium recognised (147) (106)
Balance at end of the year 1 1
notes to the financial statements for the year ended 29 March 2014

ANNUAL FINANCIAL STATEMENTS 104PREVIOUS | CONTENTS | NEXT
15. Lease obligations
Group Company
R’m2014 2013 2014 2013
Straight line operating lease liability 226 213 218 207
Less: amounts due for settlement within 12 months (47) (34) (46) (33)
Total long-term portion of lease obligations 179 179 172 174
Group and Company
R’m2014
Impact on IBNR (4)
Group and Company
R’m2014
Impact on IBNR 4
2014 2013 2012 2011
Premium income (R'm) 147 106 71 48
Number of claims 3 769 2 318 2 043 2 038
Claim costs (R'm) 12 9 5 4
Claim costs as a percentage of premium income 8.2% 8.9% 7.5% 8.8%
14. Reinsurance (continued)
Sensitivity analysis
Reinsurance liabilities are subject to changes in variables that could affect the value of the liability due. The effect of any sensitivity is considered immaterial. Outstanding claims, unearned premium provision and the taxation liability are measured at amortised cost and are based on actual amounts due to third parties. The Incurred But Not Reported (IBNR) reserve is maintained in accordance with legislation governing financial service providers. The long term cell maintains an IBNR reserve equal to a claim factor (minimum 33%) applied to 3 months of net premuims (i.e. gross premuims less commissions and administration fees). The short-terms cells are required to maintain a solvency ratio equal to 25% of net premiums as a solvency reserve and an IBNR reserve equal to 7% of the annual risk premium. As these reserves are governed by legislation, only changes in such legislation would lead to the changes in the reserve. At year end no such changes were proposed by the Financial Services Board, however, the following sensitivity has been performed on the IBNR reserve:
Long-term cell reserve adjusted to be a claims factor (minimum 32%) applied to 2 months of net premiums. Short-term cell solvency reserve adjusted to equal 24% of net premiums and an IBNR equal to 6% of the annual risk premium.
Long-term cell reserve adjusted to be a claims factor (minimum 34%) applied to 4 months of net premiums. Short-term cell solvency reserve adjusted to equal 26% of net premiums and an IBNR equal to 8% of the annual risk premium.
During the year a dividend of R60 million (2013: R48.9 million) was paid by the cells to the Company.
Premium income and claims history:
notes to the financial statements for the year ended 29 March 2014
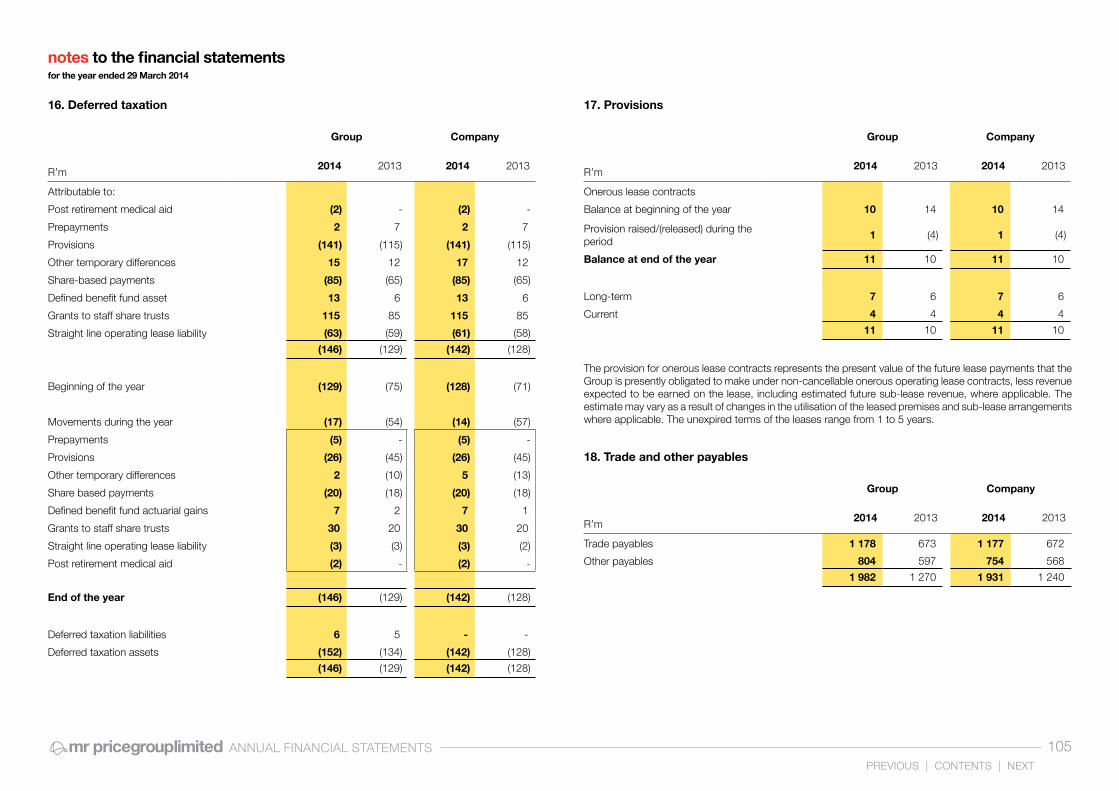
ANNUAL FINANCIAL STATEMENTS 105PREVIOUS | CONTENTS | NEXT
16. Deferred taxation 17. Provisions
18. Trade and other payables
Group Company
R’m2014 2013 2014 2013
Attributable to:
Post retirement medical aid (2) - (2) -
Prepayments 2 7 2 7
Provisions (141) (115) (141) (115)
Other temporary differences 15 12 17 12
Share-based payments (85) (65) (85) (65)
Defined benefit fund asset 13 6 13 6
Grants to staff share trusts 115 85 115 85
Straight line operating lease liability (63) (59) (61) (58)
(146) (129) (142) (128)
Beginning of the year (129) (75) (128) (71)
Movements during the year (17) (54) (14) (57)
Prepayments (5) - (5) -
Provisions (26) (45) (26) (45)
Other temporary differences 2 (10) 5 (13)
Share based payments (20) (18) (20) (18)
Defined benefit fund actuarial gains 7 2 7 1
Grants to staff share trusts 30 20 30 20
Straight line operating lease liability (3) (3) (3) (2)
Post retirement medical aid (2) - (2) -
End of the year (146) (129) (142) (128)
Deferred taxation liabilities 6 5 - -
Deferred taxation assets (152) (134) (142) (128)
(146) (129) (142) (128)
Group Company
R’m2014 2013 2014 2013
Onerous lease contracts
Balance at beginning of the year 10 14 10 14
Provision raised/(released) during the period
1 (4) 1 (4)
Balance at end of the year 11 10 11 10
Long-term 7 6 7 6
Current 4 4 4 4
11 10 11 10
Group Company
R’m2014 2013 2014 2013
Trade payables 1 178 673 1 177 672
Other payables 804 597 754 568
1 982 1 270 1 931 1 240
The provision for onerous lease contracts represents the present value of the future lease payments that the Group is presently obligated to make under non-cancellable onerous operating lease contracts, less revenue expected to be earned on the lease, including estimated future sub-lease revenue, where applicable. The estimate may vary as a result of changes in the utilisation of the leased premises and sub-lease arrangements where applicable. The unexpired terms of the leases range from 1 to 5 years.
notes to the financial statements for the year ended 29 March 2014
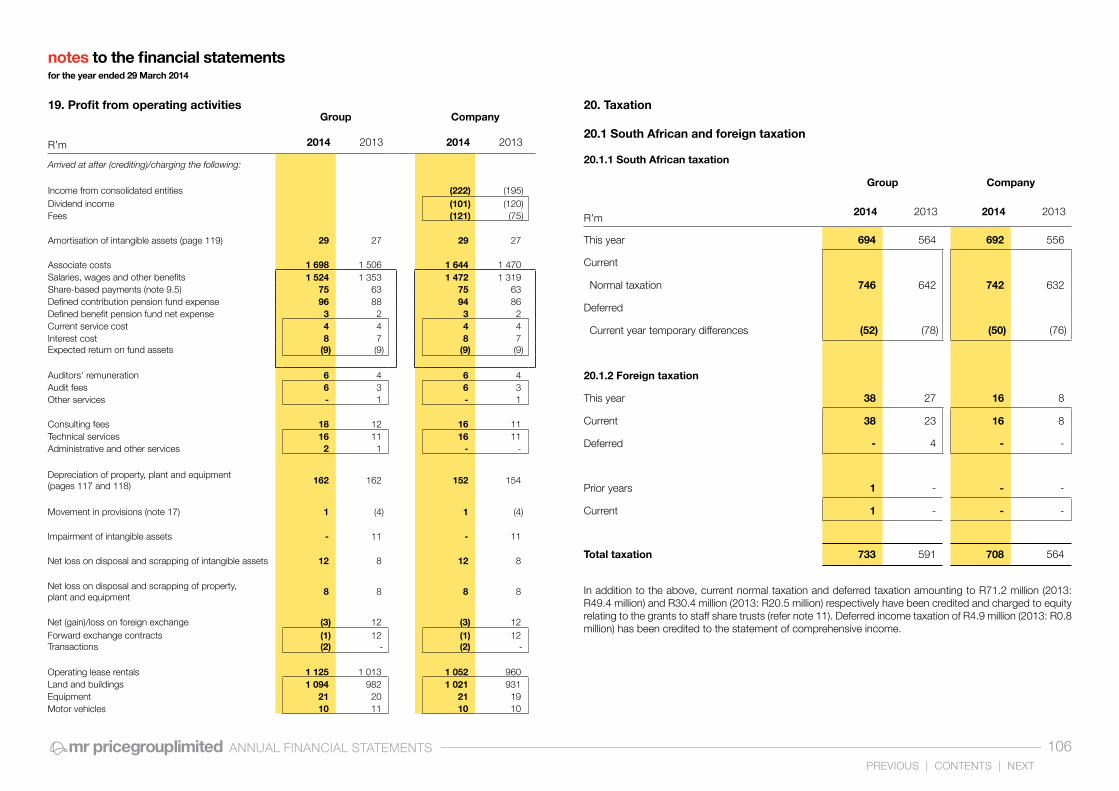
ANNUAL FINANCIAL STATEMENTS 106PREVIOUS | CONTENTS | NEXT
19. Profit from operating activitiesGroup Company
R’m 2014 2013 2014 2013
Arrived at after (crediting)/charging the following:
Income from consolidated entities (222) (195)Dividend income (101) (120)Fees (121) (75)
Amortisation of intangible assets (page 119) 29 27 29 27
Associate costs 1 698 1 506 1 644 1 470Salaries, wages and other benefits 1 524 1 353 1 472 1 319 Share-based payments (note 9.5) 75 63 75 63 Defined contribution pension fund expense 96 88 94 86 Defined benefit pension fund net expense 3 2 3 2 Current service cost 4 4 4 4 Interest cost 8 7 8 7 Expected return on fund assets (9) (9) (9) (9)
Auditors' remuneration 6 4 6 4 Audit fees 6 3 6 3 Other services - 1 - 1
Consulting fees 18 12 16 11 Technical services 16 11 16 11 Administrative and other services 2 1 - -
Depreciation of property, plant and equipment(pages 117 and 118)
162 162 152 154
Movement in provisions (note 17) 1 (4) 1 (4)
Impairment of intangible assets - 11 - 11
Net loss on disposal and scrapping of intangible assets 12 8 12 8
Net loss on disposal and scrapping of property,plant and equipment
8 8 8 8
Net (gain)/loss on foreign exchange (3) 12 (3) 12 Forward exchange contracts (1) 12 (1) 12 Transactions (2) - (2) -
Operating lease rentals 1 125 1 013 1 052 960 Land and buildings 1 094 982 1 021 931 Equipment 21 20 21 19 Motor vehicles 10 11 10 10
20. Taxation
20.1 South African and foreign taxation
20.1.1 South African taxation
Group Company
R’m2014 2013 2014 2013
This year 694 564 692 556
Current
Normal taxation 746 642 742 632
Deferred
Current year temporary differences (52) (78) (50) (76)
20.1.2 Foreign taxation
This year 38 27 16 8
Current 38 23 16 8
Deferred - 4 - -
Prior years 1 - - -
Current 1 - - -
Total taxation 733 591 708 564
In addition to the above, current normal taxation and deferred taxation amounting to R71.2 million (2013: R49.4 million) and R30.4 million (2013: R20.5 million) respectively have been credited and charged to equity relating to the grants to staff share trusts (refer note 11). Deferred income taxation of R4.9 million (2013: R0.8 million) has been credited to the statement of comprehensive income.
notes to the financial statements for the year ended 29 March 2014
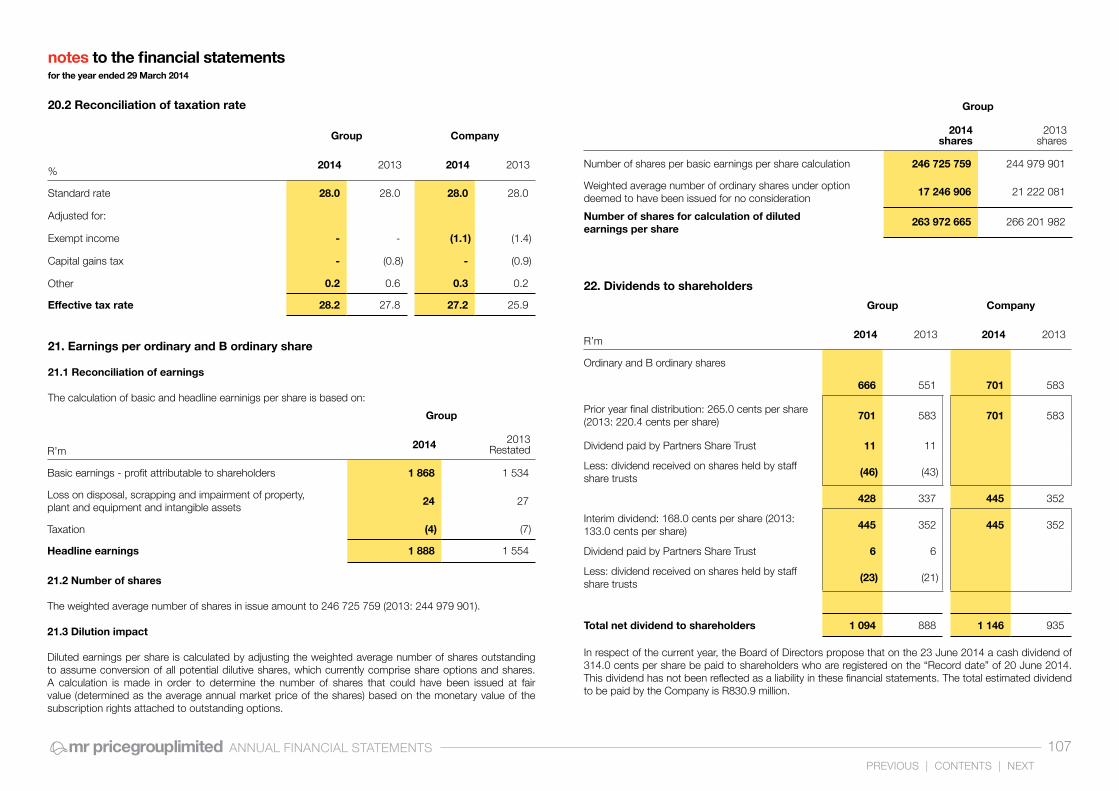
ANNUAL FINANCIAL STATEMENTS 107PREVIOUS | CONTENTS | NEXT
21. Earnings per ordinary and B ordinary share
21.1 Reconciliation of earnings
The calculation of basic and headline earninigs per share is based on:
20.2 Reconciliation of taxation rate
In respect of the current year, the Board of Directors propose that on the 23 June 2014 a cash dividend of 314.0 cents per share be paid to shareholders who are registered on the “Record date” of 20 June 2014. This dividend has not been reflected as a liability in these financial statements. The total estimated dividend to be paid by the Company is R830.9 million.
21.2 Number of shares
The weighted average number of shares in issue amount to 246 725 759 (2013: 244 979 901).
21.3 Dilution impact
Diluted earnings per share is calculated by adjusting the weighted average number of shares outstanding to assume conversion of all potential dilutive shares, which currently comprise share options and shares. A calculation is made in order to determine the number of shares that could have been issued at fair value (determined as the average annual market price of the shares) based on the monetary value of the subscription rights attached to outstanding options.
Group
R’m2014 2013
Restated
Basic earnings - profit attributable to shareholders 1 868 1 534
Loss on disposal, scrapping and impairment of property, plant and equipment and intangible assets
24 27
Taxation (4) (7)
Headline earnings 1 888 1 554
Group
2014shares
2013shares
Number of shares per basic earnings per share calculation 246 725 759 244 979 901
Weighted average number of ordinary shares under option deemed to have been issued for no consideration
17 246 906 21 222 081
Number of shares for calculation of dilutedearnings per share
263 972 665 266 201 982
22. Dividends to shareholders
Group Company
R’m2014 2013 2014 2013
Ordinary and B ordinary shares
666 551 701 583
Prior year final distribution: 265.0 cents per share (2013: 220.4 cents per share) 701 583 701 583
Dividend paid by Partners Share Trust 11 11
Less: dividend received on shares held by staff share trusts
(46) (43)
428 337 445 352
Interim dividend: 168.0 cents per share (2013: 133.0 cents per share) 445 352 445 352
Dividend paid by Partners Share Trust 6 6
Less: dividend received on shares held by staff share trusts
(23) (21)
Total net dividend to shareholders 1 094 888 1 146 935
Group Company
%2014 2013 2014 2013
Standard rate 28.0 28.0 28.0 28.0
Adjusted for:
Exempt income - - (1.1) (1.4)
Capital gains tax - (0.8) - (0.9)
Other 0.2 0.6 0.3 0.2
Effective tax rate 28.2 27.8 27.2 25.9
notes to the financial statements for the year ended 29 March 2014
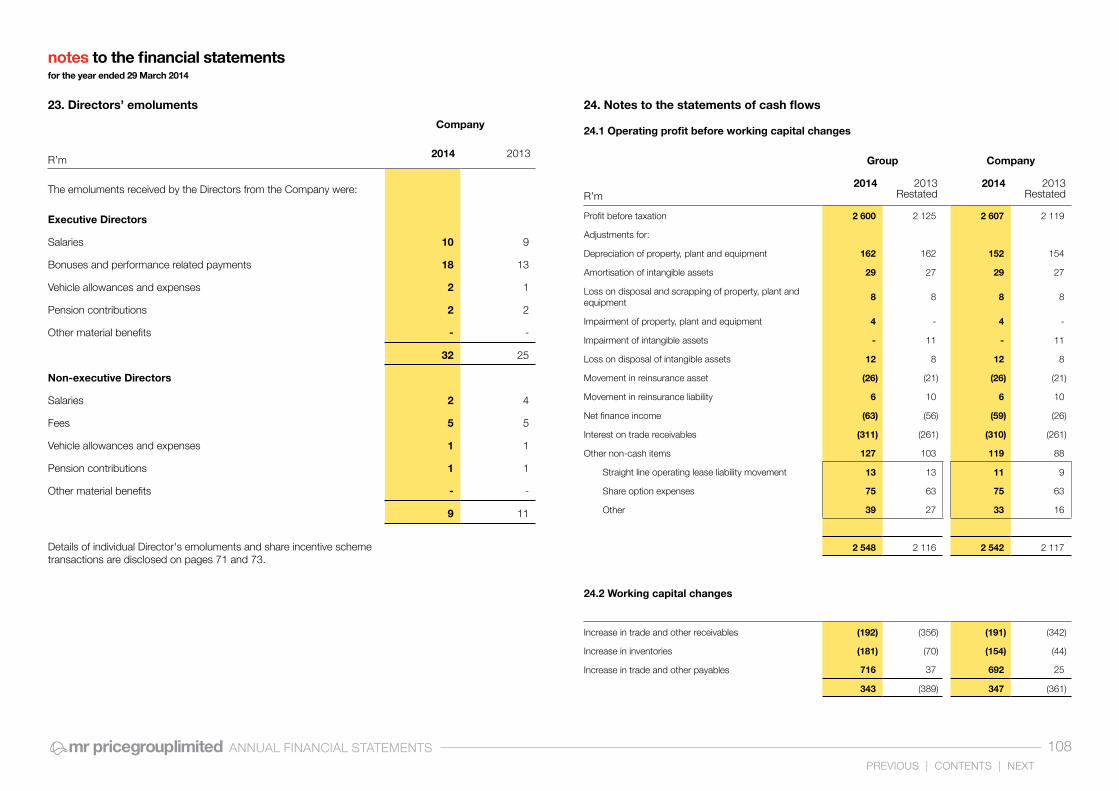
ANNUAL FINANCIAL STATEMENTS 108PREVIOUS | CONTENTS | NEXT
23. Directors’ emoluments 24. Notes to the statements of cash flows
24.1 Operating profit before working capital changes
24.2 Working capital changes
Company
R’m2014 2013
The emoluments received by the Directors from the Company were:
Executive Directors
Salaries 10 9
Bonuses and performance related payments 18 13
Vehicle allowances and expenses 2 1
Pension contributions 2 2
Other material benefits - -
32 25
Non-executive Directors
Salaries 2 4
Fees 5 5
Vehicle allowances and expenses 1 1
Pension contributions 1 1
Other material benefits - -
9 11
Details of individual Director's emoluments and share incentive scheme transactions are disclosed on pages 71 and 73.
Group Company
R’m2014 2013
Restated2014 2013
Restated
Profit before taxation 2 600 2 125 2 607 2 119
Adjustments for:
Depreciation of property, plant and equipment 162 162 152 154
Amortisation of intangible assets 29 27 29 27
Loss on disposal and scrapping of property, plant and equipment
8 8 8 8
Impairment of property, plant and equipment 4 - 4 -
Impairment of intangible assets - 11 - 11
Loss on disposal of intangible assets 12 8 12 8
Movement in reinsurance asset (26) (21) (26) (21)
Movement in reinsurance liability 6 10 6 10
Net finance income (63) (56) (59) (26)
Interest on trade receivables (311) (261) (310) (261)
Other non-cash items 127 103 119 88
Straight line operating lease liability movement 13 13 11 9
Share option expenses 75 63 75 63
Other 39 27 33 16
2 548 2 116 2 542 2 117
Increase in trade and other receivables (192) (356) (191) (342)
Increase in inventories (181) (70) (154) (44)
Increase in trade and other payables 716 37 692 25
343 (389) 347 (361)
notes to the financial statements for the year ended 29 March 2014

ANNUAL FINANCIAL STATEMENTS 109PREVIOUS | CONTENTS | NEXT
24.3 Taxation paid 24.4 Net inflows in respect of long-term receivables
24.5 Amounts owing to/(by) consolidated entities
24.6 Dividends to shareholders
Group Company
R’m2014 2013 2014 2013
Amounts unpaid at beginning of the year (82) (32) (83) (28)
Taxation 47 43 45 43
Deferred (129) (75) (128) (71)
Amounts charged to the income statements 733 591 708 564
Taxation 785 665 758 640
Deferred (52) (74) (50) (76)
Cash flow impact of change in accounting policy (4) (4)
Amounts charged to equity (36) (28) (36) (28)
Taxation (41) (49) (41) (49)
Deferred taxation 5 21 5 21
Amounts unpaid at end of the year (208) 82 (205) 83
Taxation (354) (47) (347) (45)
Deferred taxation 146 129 142 128
Amounts paid 403 613 380 591
Group Company
R’m2014 2013 2014 2013
Loan to accredited supplier 1 2 1 2
Net amounts received 1 2 1 2
Company
R’m2014 2013
Increase/(Decrease) in current amounts owing toconsolidated entities
2 (546)
(Decrease)/Increase in current amounts owing byconsolidated entities
(144) 307
(142) (239)
Group Company
R’m2014 2013 2014 2013
Dividends to ordinary and B ordinary shareholders 1 146 935 1 146 935
Less: dividends on shares held by staff share trusts (70) (64)
Add: dividends paid by Partners Share Trust 18 17
1 094 888 1 146 935
notes to the financial statements for the year ended 29 March 2014
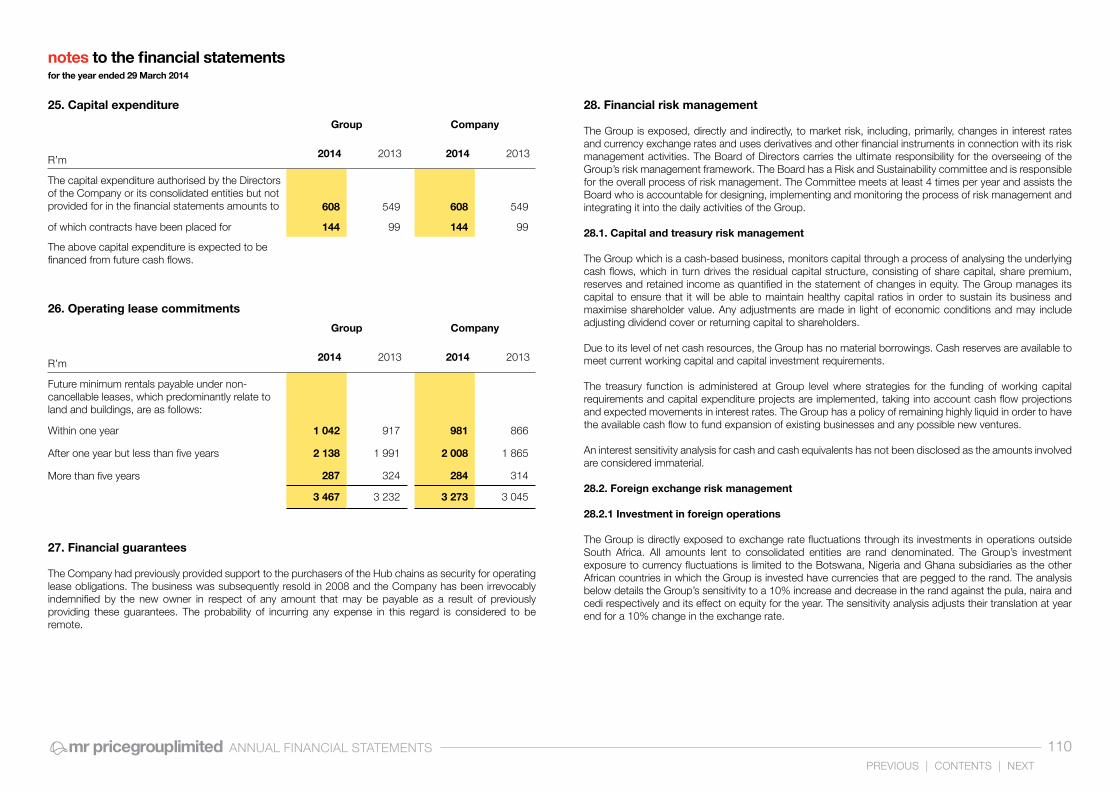
ANNUAL FINANCIAL STATEMENTS 110PREVIOUS | CONTENTS | NEXT
25. Capital expenditure
26. Operating lease commitments
27. Financial guarantees
The Company had previously provided support to the purchasers of the Hub chains as security for operating lease obligations. The business was subsequently resold in 2008 and the Company has been irrevocably indemnified by the new owner in respect of any amount that may be payable as a result of previously providing these guarantees. The probability of incurring any expense in this regard is considered to be remote.
28. Financial risk management
The Group is exposed, directly and indirectly, to market risk, including, primarily, changes in interest rates and currency exchange rates and uses derivatives and other financial instruments in connection with its risk management activities. The Board of Directors carries the ultimate responsibility for the overseeing of the Group’s risk management framework. The Board has a Risk and Sustainability committee and is responsible for the overall process of risk management. The Committee meets at least 4 times per year and assists the Board who is accountable for designing, implementing and monitoring the process of risk management and integrating it into the daily activities of the Group.
28.1. Capital and treasury risk management
The Group which is a cash-based business, monitors capital through a process of analysing the underlying cash flows, which in turn drives the residual capital structure, consisting of share capital, share premium, reserves and retained income as quantified in the statement of changes in equity. The Group manages its capital to ensure that it will be able to maintain healthy capital ratios in order to sustain its business and maximise shareholder value. Any adjustments are made in light of economic conditions and may include adjusting dividend cover or returning capital to shareholders.
Due to its level of net cash resources, the Group has no material borrowings. Cash reserves are available to meet current working capital and capital investment requirements.
The treasury function is administered at Group level where strategies for the funding of working capital requirements and capital expenditure projects are implemented, taking into account cash flow projections and expected movements in interest rates. The Group has a policy of remaining highly liquid in order to have the available cash flow to fund expansion of existing businesses and any possible new ventures.
An interest sensitivity analysis for cash and cash equivalents has not been disclosed as the amounts involved are considered immaterial.
28.2. Foreign exchange risk management
28.2.1 Investment in foreign operations
The Group is directly exposed to exchange rate fluctuations through its investments in operations outside South Africa. All amounts lent to consolidated entities are rand denominated. The Group’s investment exposure to currency fluctuations is limited to the Botswana, Nigeria and Ghana subsidiaries as the other African countries in which the Group is invested have currencies that are pegged to the rand. The analysis below details the Group’s sensitivity to a 10% increase and decrease in the rand against the pula, naira and cedi respectively and its effect on equity for the year. The sensitivity analysis adjusts their translation at year end for a 10% change in the exchange rate.
Group Company
R’m2014 2013 2014 2013
The capital expenditure authorised by the Directors of the Company or its consolidated entities but not provided for in the financial statements amounts to 608 549 608 549
of which contracts have been placed for 144 99 144 99
The above capital expenditure is expected to be financed from future cash flows.
Group Company
R’m2014 2013 2014 2013
Future minimum rentals payable under non- cancellable leases, which predominantly relate to land and buildings, are as follows:
Within one year 1 042 917 981 866
After one year but less than five years 2 138 1 991 2 008 1 865
More than five years 287 324 284 314
3 467 3 232 3 273 3 045
notes to the financial statements for the year ended 29 March 2014

ANNUAL FINANCIAL STATEMENTS 111PREVIOUS | CONTENTS | NEXT
28.2.1 Investment in foreign operations (continued)
28.2.2 Transactions in foreign currencies
Direct importing is done on a limited basis with transactions being covered by forward exchange contracts (FEC’s). FEC’s are used to address the Groups direct exposure to foreign currencies.
28.2.2 Transactions in foreign currencies (continued)
The contracts will mature within periods varying up to six months after year end and translates to R93.6 million (2013: R7.3 million) at the market rate of an equivalent contract at year end. With reference to these FEC’s, the analysis below details the Group’s sensitivity to a 10% increase and decrease in the rand against the dollar and its effect on income for the year assuming no change in retail selling prices. The sensitivity analysis includes outstanding FEC’s and adjusts their translation at year end for a 10% change in the exchange rate.
28.3 Credit risk management
Credit risk is concentrated principally in periodic short-term cash investments, in trade receivables and loans to consolidated entities. The Group deposits short-term cash surpluses only with major banks of high quality credit standing. The granting of credit to trade debtors is controlled with statistical scoring models and performance parameters which are reviewed on a regular basis. The maximum exposure in respect of trade receivables and the Group’s risk management policies regarding trade receivables are disclosed in note 8. The analysis below details the Group’s sensitivity to a 1% increase and decrease in the interest rate charged to debtors and its effect on income for the year.
Group
R’m2014 2013
Rate variance - pula +10% 4 2
-10% (4) (2)
Rate variance - naira +10% 2 -
-10% (2) (0)
Rate variance - cedi +10% 1 1
-10% (1) (1)
Group - total foreign exchange exposure +10% 7 3
-10% (7) (3)
Group Company
R’m2014 2013 2014 2013
At year end forward exchange contract commitments were:
Current liability US$'m 6 1 6 1
Exchange rate R/US$ - average contract rate R10.789 R8.811 R10.789 R8.811
Exchange rate R/US$ - year end closing rate R10.619 R9.243 R10.619 R9.243
Current liability ZMW'm 20 - 20 -
Exchange rate R/ZMW - average contract rate R0.539 R0.000 R0.539 R0.000
Exchange rate R/ZMW - year end closing rate R0.602 R0.000 R0.602 R0.000
Group Company
R’m2014 2013 2014 2013
Rate variance - US$ +10% (6) (1) (6) (1)
-10% 6 1 6 1
Rate variance - ZMW +10% (1) (1)
-10% 1 (1)
Group Company
R’m2014 2013 2014 2013
Rate variance +1% 17 14 17 14
-1% (17) (14) (17) (14)
notes to the financial statements for the year ended 29 March 2014

ANNUAL FINANCIAL STATEMENTS 112PREVIOUS | CONTENTS | NEXT
28.4 Liquidity management
The Group manages liquidity risk by maintaining adequate reserves, banking facilities and by continuously monitoring forecast and actual cash flows. The Group has significant cash reserves and minimal borrowings which enable it to borrow funds externally should it require to do so to meet any working capital or possible expansion requirements. As a consequence banking legislation which requires fees to be paid relative to the size of the facility, the Group has only entered into limited loan facility arrangements to the extent that fees are not payable. The year end position was a follows:
The table below details the Group’s expected maturity for its non-derivative financial liabilities:
The Group expects to meet its obligations from existing cash reserves and from operating cash flows.The Group’s derivative financial liabilities comprise FEC’s which are disclosed in note 28.2.2.
Based on the Group’s existing cash resources and expected future cash flows, there is no foreseeable need to enter into borrowings. Furthermore, due to the Group’s strong financial position, should further borrowings be required, the Group should be able to obtain any necessary funding within a short period, subject to bank approval.
Group Company
R’m2014 2013 2014 2013
Total facilities 445 445 445 445
Less: drawn down portion - - - -
Total undrawn banking facilities 445 445 445 445
Group (R’m)
On demand
Less than 3
months
3 months
to one year
3 months
to one year
One to five years
2014
Trade and other payables 676 1 200 106 - 1 982
2013
Trade and other payables 174 1 012 84 - 1 270
Company (R’m)
2014
Trade and other payables 658 1 168 104 - 1 931
2013
Trade and other payables 165 995 80 - 1 240 Group Company
R’m2014 2013 2014 2013
Borrowing powers
In terms of the Company’s Articles ofAssociation, borrowing powers at year end were limited to 150% of Group equity attributable to shareholders
5 884 4 964 5 884 4 964
Actual borrowings outside the Group at yearend were (6) - - -
At year end bank balances were 2 249 1 166 2 249 1 166
Net cash resources were 2 243 1 166 2 249 1 166
28.5 Fair value hierarchy
As at 29 March 2014 the Group held financial instruments measured at fair value in the form of FEC’s. All assets and liabilities for which fair value is measured or disclosed in the financial statements are categorised within the fair value hierarchy, described as follows, based on the lowest level input that is significant to the fair value measurement as a whole:
notes to the financial statements for the year ended 29 March 2014

ANNUAL FINANCIAL STATEMENTS 113PREVIOUS | CONTENTS | NEXT
28.5 Fair value hierarchy (continued)
- Level 1 — Quoted (unadjusted) market prices in active markets for identical assets or liabilities;- Level 2 — Valuation techniques for which the lowest level input that is significant to the fair value
measurement is directly or indirectly observable; and- Level 3 — Valuation techniques for which the lowest level input that is significant to the fair value
measurement is unobservable.
The fair value of forward exchange contracts is measured using Level 2 techniques. The significant inputs into the Level 2 fair value of forward exchange contracts are yield curves, market interest rates and market foreign exchange rates. There have been no transfers between the levels during the year (refer note 28.2.2).
Fair value of financial instruments The estimated fair values of recognised financial instruments approximate their carrying amounts.
29. Retirement benefits
29.1 Pension schemes
29.1.1 Membership
The funds are registered in terms of the Pension Funds Act and provide for pensions and related benefits for all permanent employees. Membership is compulsory after the first year of service. Membership details are disclosed in the Remuneration Report on page 66.
29.1.2 Contributions
In the case of the Group defined benefit fund, pensions are based on length of service and highest average annual salary earned over 2 years during the last 10 years of employment. The members are required to contribute to the funds mainly at the rate of 7.5% of their pensionable remuneration while the employer is required to contribute mainly at the rate of 13.7% and to the defined contribution funds mainly at the rate of 11.0% of pensionable remuneration. In the case of the defined benefit fund, the employer rate has been calculated based on the projected unit credit method.
29.1.3 Valuations
Defined benefit pension fundIn terms of the Pension Funds Act the defined benefit fund should be actuarially valued every three years. In the statutory valuation as at 31 December 2011, past service liabilities were determined by valuing all future payments expected to be made out of the fund in respect of benefits accrued up to the valuation date. The actuarial valuation of assets was R91.4 million and the liability for accrued benefits, including a solvency reserve of R13.9 million, was R88.7 million, resulting in a funding level of 103.1% and a distributable surplus of R2.8 million. The possible conversion of the fund’s benefit structure from defined benefit to defined contribution is currently being investigated. It is expected that the distributable surplus could be required to fund such a conversion and accordingly it has been retained in the employer surplus account. The valuation took into account the minimum benefits payable on a member’s exit from the fund after 1 January 2004, in terms of the Pension Funds Second Amendment Act of 2001. In the opinion of the actuary the fund was in a sound financial position.
29.1.3 Valuations (continued)
Group and Company
R’m2014 2013
The funded status of the defined benefit retirement fund, actuarially calculated annually at reporting date in terms of IAS 19, is as follows
Benefit obligation (78) (85)
Plan assets 123 105
Net benefit plan asset 45 20
The amounts recognised in the income statement are detailed in note 19.
The following main assumptions were used in performing the calculation:
• Discount rate - 10.00% per annum (2013: 8.90% per annum)
• Inflation - 7.00% per annum (2013: 6.60% per annum)
• Future salary increases - 8.00% per annum (2013: 7.60% per annum)
Movements in the present value of the defined benefit obligation in the current period were as follows:
Defined benefit obligation at beginning of the year 85 76
Current service cost 4 4
Member contributions 1 1
Interest cost 8 7
Actuarial (gain)/loss (15) 6
Benefits paid (4) (8)
Risk premiums (1) (1)
Defined benefit obligation at end of the year 78 85
notes to the financial statements for the year ended 29 March 2014

ANNUAL FINANCIAL STATEMENTS 114PREVIOUS | CONTENTS | NEXT
29.1.3 Valuations (continued)
The amounts for the current and previous four periods are as follows (R’m):
The valuation determined above is based on a number of assumptions, the defined benefit obligation could vary from the amounts disclosed above, depending on the extent to which actual experience differs from the assumption adopted.
The estimated defined benefit cost for 2015 financial year is as follows; a current service cost of R113.2 million (2013: R94.1 million), an expected return on plan assets of R12.4 million (2013: R 9.5 million) and an interest cost of R8.1 million (2013: R7.9 million).
Defined contribution fundsThe defined contribution funds are valuation exempt. The actuarial function remains present through an Enhanced Financial Assessment (EFA) process, which is a quarterly actuarial assessment that looks at the financial soundness of the Fund; and sets out the allocations of contributions to the Fund. The report includes a comparison of the total assets to the total liabilities of the Fund in order to determine the funding level. The most recent EFA reports as at 31 December 2013 concluded that the funding level of the Funds was within the tolerance levels set by the administrators.
29.2 Post retirement medical benefits
The obligation of the Group to pay medical aid contributions for members who have retired is no longer part of the conditions of employment for new associates. A limited number of pensioners and current associates who remain members of the defined benefit pension fund are entitled to this benefit. The entitlement to the benefit for current associates is dependent upon the associate remaining in service until retirement age. An actuarial valuation, in terms of IAS 19, of the Group’s liability at 31 March 2014 for this future benefit was undertaken. Valuations are undertaken every three years. The main assumptions used in performing these valuations are reviewed annually. Any detection of a material variation in a main assumption would give rise to a new valuation. The obligation for post retirement medical aid benefits is unfunded. The following main assumptions were used in performing the valuation at 31 March 2014, based on current membership: Health care cost inflation - 9.0% per annum Discount rate - 10.0% per annum Average retirement age - 62 years Continuation at retirement - 100%
Activity during the year was as follows:
Group and Company
R’m2014 2013
Movements in the present value of the plan assets in the current period were as follows:
Fair value of plan assets at beginning of the year 105 92 Expected return on assets 9 9 Contributions 5 4 Risk premiums (1) (1)Benefits paid (4) (8)Actuarial gain 8 9 Fair value of plan assets at end of the year 122 105
%
The estimated asset composition of the fair value of total plan assets is as follows:
Cash 16.3 12.6South African equities 41.3 44.4South African bonds 11.4 13.4South African property and other 5.4 4.9International assets 25.6 24.7
100.0 100.0
2014 2013 2012 2011 2010
Defined benefit obligation (78) (85) (76) (64) (58)
Plan assets 123 105 92 84 75
Net plan asset 45 20 16 20 17
Group and Company
R’m2014 2013
Benefit obligation at beginning of the year 16 15
Net increase in provision during the year 6 1
Benefit obligation at end of the year 22 16
notes to the financial statements for the year ended 29 March 2014
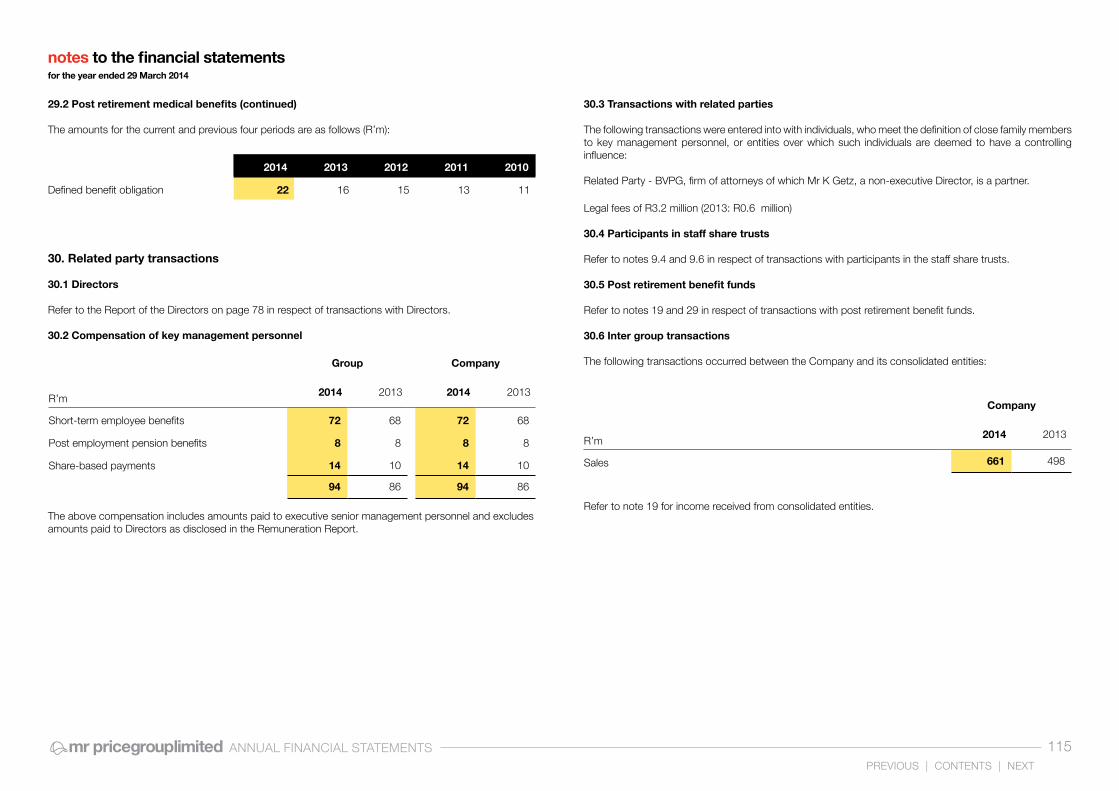
ANNUAL FINANCIAL STATEMENTS 115PREVIOUS | CONTENTS | NEXT
30. Related party transactions
30.1 Directors
Refer to the Report of the Directors on page 78 in respect of transactions with Directors.
30.2 Compensation of key management personnel
The above compensation includes amounts paid to executive senior management personnel and excludes amounts paid to Directors as disclosed in the Remuneration Report.
Group Company
R’m2014 2013 2014 2013
Short-term employee benefits 72 68 72 68
Post employment pension benefits 8 8 8 8
Share-based payments 14 10 14 10
94 86 94 86
30.3 Transactions with related parties
The following transactions were entered into with individuals, who meet the definition of close family members to key management personnel, or entities over which such individuals are deemed to have a controlling influence:
Related Party - BVPG, firm of attorneys of which Mr K Getz, a non-executive Director, is a partner.
Legal fees of R3.2 million (2013: R0.6 million)
30.4 Participants in staff share trusts
Refer to notes 9.4 and 9.6 in respect of transactions with participants in the staff share trusts.
30.5 Post retirement benefit funds
Refer to notes 19 and 29 in respect of transactions with post retirement benefit funds.
30.6 Inter group transactions
The following transactions occurred between the Company and its consolidated entities:
Refer to note 19 for income received from consolidated entities.
Company
R’m2014 2013
Sales 661 498
29.2 Post retirement medical benefits (continued)
The amounts for the current and previous four periods are as follows (R’m):
2014 2013 2012 2011 2010
Defined benefit obligation 22 16 15 13 11
notes to the financial statements for the year ended 29 March 2014

ANNUAL FINANCIAL STATEMENTS 116PREVIOUS | CONTENTS | NEXT
Apparel Home Central Services Eliminations Total
R’m 2014 2013 2014 2013 2014 2013 2014 2013 2014 2013
Revenue 11 413 9 758 4 290 3 893 253 237 (127) (144) 15 829 13 744
External 11 413 9 758 4 290 3 893 126 93 - - 15 829 13 744
Internal - - - - 127 144 (127) (144) - -
Profit from operating activities 2 102 1 725 591 492 (156) (148) - - 2 537 2 069
Net finance income 63 56
Profit before taxation 2 600 2 125
Taxation 733 591
Profit attributable to shareholders 1 867 1 534
Divisional assets 2 760 2 511 846 721 2 957 1 666 - - 6 563 4 898
Divisional liabilities 1 458 905 631 482 559 207 (7) (5) 2 641 1 589
Capital expenditure 127 174 62 45 216 119 - - 405 338
Depreciation and amortisation 86 89 33 38 72 62 - - 191 189
South Africa Other Africa Total
R’m 2014 2013 2014 2013 2014 2013
Revenue 14 822 13 026 1 007 718 15 829 13 744
Assets 6 092 4 596 471 302 6 563 4 898
Capital expenditure 386 326 19 12 405 338
31. Segmental reporting
For management purposes, the Group is organised into business units based on their products and services, and has 3 reportable segments as follows:
- The Apparel segment retails clothing, sportswear, footwear, sporting equipment and accessories; - The Home segment retails homewares; and- The Central Services segment provides services to the trading segments including information technology, internal audit, human resources, group real estate and finance.
Management monitors the operating results of its business units separately for the purpose of making decisions about resource allocation and performance assessment.Segment performance is evaluated based on operating profit or loss. Net finance income and income taxes are managed on a group basis and are not allocated to operating segments.
32. Geographical segments
notes to the financial statements for the year ended 29 March 2014

ANNUAL FINANCIAL STATEMENTS 117PREVIOUS | CONTENTS | NEXT
Analysis of the movement of owned property, plant and equipment
Furniture fittings equipment and vehicles Computer equipment Improvements to leasehold
premises Buildings Total
R’m2014 2013 2014 2013 2014 2013 2014 2013 2014 2013
Group
Net carrying amount at beginning of the year 544 450 70 42 11 11 35 37 660 540 Cost or carrying amount 1 274 1 079 174 134 41 39 39 39 1 528 1 291 Accumulated depreciation and impairment (730) (629) (104) (92) (30) (28) (4) (2) (868) (751)
Current year movementsAdditions 210 237 32 50 10 2 1 - 253 289 Disposals and scrapping (8) (7) - (1) - - (22) - (30) (8)Impairments (4) - - - - - - - (4) -Exchange differences 1 1 - - - - - 1 1 Depreciation (129) (137) (30) (21) (2) (2) (1) (2) (162) (162)
Net carrying amount at end of the year 614 544 72 70 19 11 13 35 718 660
Made up as follows:Net carrying amount 614 544 72 70 19 11 13 35 718 660 Cost or carrying amount 1 429 1 274 206 174 50 41 15 39 1 700 1 528 Accumulated depreciation and impairment (815) (730) (134) (104) (31) (30) (2) (4) (982) (868)
Company
Net carrying amount at beginning of the year 510 433 68 41 11 11 - - 589 485 Cost or carrying amount 1 233 1 061 171 131 30 28 - - 1 434 1 220 Accumulated depreciation and impairment (723) (628) (103) (90) (19) (17) - - (845) (735)
Current year movementsAdditions 192 215 32 49 10 2 - - 234 266 Disposals and scrapping (8) (7) - (1) - - - - (8) (8)Impairment (4) - - - - - - - (4) -Depreciation (122) (131) (29) (21) (1) (2) - - (152) (154)
Net carrying amount at end of the year 568 510 71 68 20 11 - - 659 589
Made up as follows:Net carrying amount 568 510 71 68 20 11 - - 659 589 Cost or carrying amount 1 369 1 233 202 171 40 30 - - 1 611 1 434 Accumulated depreciation and impairment (801) (723) (131) (103) (20) (19) - - (952) (845)
Details of building:
Remaining extent of Erf 4749 Bethlehem District, Bethlehem Province, Free State, in extent of 3538 square metres.
notes to the financial statements for the year ended 29 March 2014

Analysis of the movement of leased property, plant and equipment
Buildings
R’m2014 2013
Group and company
Net carrying amount at beginning and end of the year - -
Made up as follows:
Net carrying amount - -
Cost 27 27
Accumulated depreciation (27) (27)
notes to the fi nancial statements for the year ended 29 March 2014
ANNUAL FINANCIAL STATEMENTSPREVIOUS | CONTENTS | NEXT
118

ANNUAL FINANCIAL STATEMENTS 119PREVIOUS | CONTENTS | NEXT
Analysis of the movement of intangible assets
Computer software Customer lists Goodwill Trademarks Total
R’m2014 2013 2014 2013 2014 2013 2014 2013 2014 2013
Group
Net carrying amount at beginning of the year 98 82 1 14 6 6 - - 105 102 Cost or carrying amount 149 122 26 34 6 6 18 18 199 180 Accumulated amortisation and impairment (51) (40) (25) (20) - - (18) (18) (94) (78)
Current year movements Additions arising from external development/acquisition 141 41 - 2 - - - - 141 43 Additions arising from internal development 10 6 - - - - 10 6 Disposals (12) (8) - - - - - - (12) (8)Impairment - - - (11) - - - - - (11)Amortisation (28) (23) (1) (4) - - - - (29) (27)
Net carrying amount at end of the year 209 98 - 1 6 6 - - 215 105
Made up as follows: Net carrying amount 209 98 - 1 6 6 - - 215 105 Cost or carrying amount 263 149 26 26 6 6 18 18 313 199 Accumulated amortisation and impairment (54) (51) (26) (25) - - (18) (18) (98) (94)
Company
Net carrying amount at beginning of the year 98 82 1 14 1 1 - - 100 97 Cost or carrying amount 149 122 26 34 1 1 18 18 194 175 Accumulated amortisation and impairment (51) (40) (25) (20) - - (18) (18) (94) (78)
Current year movements Additions arising from external development/acquisition 139 41 - 2 - - - - 139 43 Additions arising from internal development 10 6 - - - - - - 10 6 Disposals (12) (8) - - - - - - (12) (8)Impairment - - - (11) - - - - - (11)Amortisation (28) (23) (1) (4) - - - - (29) (27)
Net carrying amount at end of the year 207 98 - 1 1 1 - - 208 100
Made up as follows: Net carrying amount 207 98 - 1 1 1 - - 208 100 Cost or carrying amount 261 149 26 26 1 1 18 18 306 194 Accumulated amortisation and impairment (54) (51) (26) (25) - - (18) (18) (98) (94)
The goodwill raised in the prior year relates to the acquisition of Associated Credit Specialists, a debt collection business.
notes to the financial statements for the year ended 29 March 2014

ANNUAL FINANCIAL STATEMENTS 120PREVIOUS | CONTENTS | NEXT
Issued capital Carrying value of shares Indebtedness lessimpairment provisions
R’mNotes 2014
Shares2013
Shares 2014 2013 2014 2013
Operating subsidiaries
Specialty Stores (Botswana) (Pty) Limited 1 100 100 - - 80 38
Mr Price (Lesotho) (Pty) Limited 2 1 000 1 000 - - 13 7
Mr Price Group (Namibia) (Pty) Limited 3 100 100 - - 94 35
Mr Price Chain Stores International Limited (Nigeria) 4 500 000 500 000 2 2 66 37
Mr Price Chain Stores International Limited (Ghana) 5 480 000 480 000 2 2 17 20
Millews Fashions (Johannesburg) (Pty) Limited 6 28 000 28 000 - - 6 34
Associated Credit Specialists (Pty) Limited 7 100 100 - - 6 1
MRP Mobile (Pty) Limited 8 100 - - - 8 -
Share Trusts
Mr Price Group Staff Share Trust and Share Purchase Scheme - -
Mr Price Group Employees Share Investment Trust - -
Mr Price Executive Director Share Trust 1 1
Mr Price Executive Share Trust 1 1
Mr Price Senior Management Share Trust 1 1
Mr Price General Staff Share Trust 3 1
Mr Price Partners Share Trust - -
Dormant subsidiaries
Raava Jewellers (Namibia) (Pty) Limited 100 100 1 1 - -
Hughes Extension 17 Township (Pty) Limited 100 100 - - - -
Total 5 5 296 176
financial interest in consolidated entitiesfor the year ended 29 March 2014
Notes:
1. Operates Mr Price Apparel, Mr Price Home, Miladys and Sheet Street stores in Botswana. 2. Operates Mr Price Apparel, Mr Price Home and Sheet Street stores in Lesotho.3. Operates Mr Price Apparel, Mr Price Home, Miladys, Sheet Street and Mr Price Sport stores in Namibia.4. Operates Mr Price Apparel stores in Nigeria.5. Operates Mr Price Apparel and Mr Price Home stores in Ghana.6. Develops and leases premises to Group operations.7. Recovers overdue debts from credit customers.8. Represents a 55% held subsidiary of the Company.
The Company owns 100% of the equity and preference share capital (where applicable) of all other subsidiaries and cell captives except for MRP Mobile (Pty) Ltd in which it holds 55% of the issued share capital with the remaining 45% being held by non-controlling interests.
121ADMINISTRATION & DEFINITIONS
definitions
AMPS Measure of through-the-door shoppers
B-BBEE Broad-Based Black Economic Empowerment
CAGR Compound annual growth rate
Comparable sales Like-for-like location store sales
Company Refers to Group
CRM Customer Relationship Management
DC Distribution Centre
DPS Dividends per share
dti The department of Trade and Industry
ERP Enterprise Resource Planning
ETI Ethical Trading Initiative
Gross margin Gross profit as a percentage of retail sales
Group Refers to Company
HCM Human Capital Management
HEPS Headline earnings per share
Inventory turn Cost of sales as a ratio of average inventories
JSE Johannesburg Stock Exchange
LSM Living Standard Measures
MPC Mr Price Group
Operting margin Profit from operating activities as a percentage of retail sales
PMO Price mark on
RedCap Sport RedCap Sport NPC, a registered Non-Profit and Public Benefit
Organisation.RedCap Foundation RedCap Foundation NPC, a registered Non-Profit and Public
Benefit Organisation.Return on average shareholder equity Headline earnings attributable to ordinary and B ordinary
shareholders as a percentage of average equity attributable to
shareholdersReturn on net worth (RONW) Profit attributable to shareholders as a percentage of equity
attributable to shareholdersReturn on operating assets Profit from operating activities as a percentage of average
equity attributable to shareholders, interest-bearing loan financeRLC Retail Liaison Committee
RSP Retail Selling Price
Sales density Retail sales per weighted average net square metre
SEDEX Supplier Ethical Data Exchange
company secretary and registered officeMrs HE GrosvenorUpper level, North Concourse, 65 Masabalala Yengwa Avenue, Durban, 4001.PO Box 912, Durban, 4000.
transfer secretariesComputershare Investor Services (Proprietary) Limited, 70 Marshall Street, Johannesburg, 2001.PO Box 61051, Marshalltown, 2107.
domicile and country of incorporationRepublic of South Africa
sponsorRand Merchant Bank
registration number1933/004418/06
independent auditorErnst & Young Inc.
address phone fax websites
Mr Price Apparel Upper level,
North Concourse,
65 Masabalala
Yengwa Avenue,
Durban, 4001
Private Bag X04,
Snell Parade,
Durban, 4074
031 310 8638 031 304 3358 mrp.commrp.com/ng
Mr Price Home 031 310 8809 031 328 4138 mrphome.com
Mr Price Sport 031 310 8545 031 306 9347 mrpricesport.com
Sheet Street 031 310 8300 031 310 8317 sheetstreet.co.za
RedCap Foundation 031 310 8242 031 328 4609 redcapfoundation.org
Corporate 031 310 8000 031 304 3725 mrpricegroup.com
Miladys 30 Station Drive,Durban, 4001PO Box 3562,Durban, 4000
031 313 5500 031 313 5620 miladys.co.za
Financial Services 380 Dr Pixley KaSeme Street, Durban, 4001PO Box 4996, Durban, 4000
031 367 3311 031 306 0164 mrpmoney.co.za
Whistleblowers PO Box 51006,Musgrave, 4062
0860 005 111 whistleblowing.co.za
Customer Care 0800 212 535
Account Services 0861 066 639
administration and contact details
PREVIOUS | CONTENTS