our total impact corporate sustainability annual update 2014 › assets › pdf ›...
TRANSCRIPT

PwC in the UK November 2014
Our total impactCorporate sustainability annual update 2014
www.pwc.co.uk/corporatesustainability

iCorporate sustainability annual update 2014www.pwc.co.uk/corporatesustainability
The photos in this reportCover One of the atria in our refurbished Embankment Place office – PwC / Hufton & CrowPage 1 Hot air balloon – NiCK / Getty ImagesPage 2 One of the atria in our refurbished Embankment Place office (‘Raising the bar in green buildings’) –
PwC / Hufton & Crow; A still from the animation that opened our ‘Think sustainability’ training (‘Embedding sustainability into our everyday work’) – PwC / Nice & Serious
Page 3 Cacao beans (‘Enhancing supply chain traceability for our clients’) – iStockPhoto; PwC volunteers (‘Supporting our communities, together’) – PwC
Page 5 Autumn forest – iStockPhotoPage 12 Motorway at night – Oliver ButterworthPage 18 London from the air, including our Embankment Place office in the bottom right, which achieved a
BREEAM ‘Outstanding’ rating for its environmental credentials this year – Jason Hawkes / Getty ImagesPage 26 PwC mentor Hannah Farrar Moffatt talks with Hao Jing Teng, a student from Harris Academy
Bermondsey, at our student mentoring celebration in May 2014 – PwC / Max GrizaardPage 28 Green spaces on the roof of our refurbished Embankment Place office, supporting biodiversity and offering
our people somewhere to relax and unwind – PwC / Hufton & CrowPage 31 Our new Embankment Place ‘tri-generator’, which runs on biofuels, significantly reducing our energy
carbon footprint – PwC / Hufton & CrowPage 42 Leaf detail – iStockPhoto 21898 Sustainability APU 2014

iiCorporate sustainability annual update 2014 www.pwc.co.uk/corporatesustainability
Contents
Highlights page 1
The year in brief page 2
An introduction from our chairman page 4
Context page 5
Five megatrends that are shaping our world page 6
Our purpose page 7
Our business strategy page 8
Our business model page 9
Creating value for our stakeholders page 11
About this year’s report page 12
Our sustainability strategy page 13
Our sustainability materiality matrix page 15
Independent assurance report page 16
Our performance page 18
How we measure our performance page 19
Responsible business – a catalyst for change page 20
Responsible business – quality and ethics page 22
Workplace and diversity page 24
Community engagement page 26
Environmental stewardship page 28
Our impact page 31
How we measure our impact page 32
Our economic impact page 34
Our tax impact page 36
Our social impact page 38
Our environmental impact page 40
Appendices page 42
Our sustainability scorecard page 43
Consulting our stakeholders page 50
External recognition page 52

iiiCorporate sustainability annual update 2014www.pwc.co.uk/corporatesustainability
Reading this report
Printing and storing this reportWe print very few copies of this report ourselves and, where we do, we ensure we use material sourced from responsibly managed forests, certified in accordance with the Forest Stewardship Council (FSC). The paper is manufactured to the ISO 14001 standard. All printing inks used are mineral oil-free, based on renewable raw materials and manufactured to ISO 14001 standards. The report is printed by a CarbonNeutral® company, registered to ISO 14001 and EMAS (Eco-Management & Audit Scheme).
If you need to print off a hard copy of the report yourself, please print it double-sided. If you’ve downloaded a copy, please take the time to save it somewhere memorable, to avoid the need for multiple downloads, which may increase the energy associated with storing the document.
Designed with you in mind This report has been designed to be as easy to read and navigate as possible.
• Landscape format: We know most people will open this report on their PC, tablet, or smartphone. So, we’ve used a landscape format to make it easier to view on screen. We hope this will improve your experience of reading it, but will also mean fewer people will need to print it out.
• Sign-posting: Each section is colour coded to make it easy to flick through the document quickly and find the information you want. Tabs in the top left of each page tell you which section you’re looking at.
• Moving around the report: If you’re reading the digital copy of the report, you can click on the tabs in the top left of the page to go straight to the relevant section. Clicking on the ‘home’ icon in the top right will take you to the contents page. And within the text, links to websites, email addresses and references to other sections of the report are highlighted, letting you know that they’re clickable.
Find out moreYou can find additional details on our sustainability agenda, including our risk and governance processes, more case studies and further information on all our programmes, on our website at pwc.co.uk/corporatesustainability. The site also includes a downloads centre, allowing you to pick and choose from a range of resources, including our previous annual updates, and combine them in a single, downloadable PDF.
Get in touchWe know we’ll only prosper if we’re meeting the needs of our stakeholders. We hope the changes we’ve made since last year make the report easier and more enjoyable to read and we’d welcome your thoughts on our progress and your ideas on areas where we could do more, or do things we could do differently.
Please contact [email protected], our Corporate Sustainability Director, if you have any comments or suggestions.
Hig
hlig
hts
Con
text
Our
repo
rtin
g
Our
per
form
ance
Our
impa
ct
App
endi
ces

HighlightsIn this section: Key points from our 2013-2014 programme, and our chairman’s introduction, talking about our long-standing commitment to sustainability.1

2Corporate sustainability annual update 2014 | Highlightswww.pwc.co.uk/corporatesustainability
Hig
hlig
hts
Con
text
Our
repo
rtin
g
Our
per
form
ance
Our
impa
ct
App
endi
ces
Last year saw continued progress towards our vision, and a focus on transformative initiatives, not only in our operations but also in the wider world.
The year in brief
September2013
November2013
January2014
December2013
Raising the bar in green buildingsWe fully reopened our headquarters in Embankment Place, London, after almost two years of refurbishment, and achieved the highest ever score under BREEAM, the world’s foremost environmental rating system for buildings. It joined our More London building – also rated ‘outstanding’ under BREEAM – and we’re applying the BREEAM principles in the ongoing upgrade of our regional offices.
The world’s first total impact reportIn late 2013, we launched our new Total Impact Measurement and Management (TIMM) framework at the UN General Assembly, and measured the total economic, tax, social and environmental impact of our business for the first time. The TIMM framework is the result of an ongoing collaboration with clients, economists, and environmental and social impact experts. It helps organisations achieve ‘good growth’ by better understanding the net impact of their activities – positive and negative. This year, we’re reporting our own total impact again.
Embedding sustainability into our everyday work During the year we implemented a number of programmes designed to raise awareness amongst our people of the social and environmental issues impacting our clients. For example, we ran sessions at our annual partner and director days on five key megatrends, and we developed an online training module to build a sustainability mind-set across the firm. Called ‘Think Sustainability’, the course was voted the best internal engagement project by the sustainability network 2degrees at their 2014 awards. By January 2014, over 90% of our people had completed the course, and more than half of those surveyed said they had applied the lessons to their work.
Introducing agile ways of workingGreater agility is essential to help us to tap into diverse talent pools, create a rewarding work experience for our people and grow our business. In December, we introduced an online resource – including tools, guidance and case studies – to support our people to work more flexibly.
Key
Our total impact: PwC UK 2014£4.14 billion(cf. 2013 £4.03 billion)
Bar size represents the magnitude of our impact
Green represents a positive contribution
Red represents a negative contribution
Grey lines represent impacts where we don’t yet have robust enough data to report
Direct
Direct
Indirect
Indirect
Induced
Induced
Definitions
Direct Impacts from business operationsIndirect Impacts through the effects on
organisations in our supply chain Induced Impacts through the spending by our
employees, or suppliers’ employees, in the wider economy
Social impact
Education£188m
Livelihoods
Health Empowerment
Community cohesion
Environmental im
pact
Other airemissions£16m
Waste£5m
Land use£31m
Water useand pollution£7m
Greenhousegases£49m
Tax impact
Peopletaxes£631m
Propertytaxes£76m
Productiontaxes£507m
Environmentaltaxes£4m
Profittaxes£331m
Econ
omic
impa
ct
Exports£0
Investment£118m
Profits£749m
Payroll£1,382m
Intangibles£45m
Bus
iness activities
Com
munities
EmployeesShareholders
Suppliers
Governmen
tsC
usto
mer
s

3Corporate sustainability annual update 2014 | Highlightswww.pwc.co.uk/corporatesustainability
Hig
hlig
hts
Con
text
Our
repo
rtin
g
Our
per
form
ance
Our
impa
ct
App
endi
ces
April2014
June2014
May2014Supporting our communities, togetherWe dedicated over 51,000 hours to volunteering this year, 53% of which were skills based. Our people also voted to select three ‘charities of the year’ to be supported by the PwC Foundation. Many of the activities organised as part of our annual, ‘One Firm One Day’ volunteering event in May raised money to support these organisations. Overall, we estimate that over 18,500 people benefitted from our community programmes.
Enhancing supply chain traceability for our clientsSupply chain traceability and resource scarcity are increasingly significant issues. This year we acquired GeoTraceability, a supply chain data and monitoring company that gathers information from raw material producers such as cocoa farmers and traces their products along the supply chain. GeoTraceability literally puts small-scale producers on the map and helps clients to manage them more effectively. It also enables better yields, helping to improve the overall supply of raw materials and lift smallholders out of poverty.
Shaping the tax system of the futureIn June, we launched a unique, multi-stakeholder campaign called ‘Paying for Tomorrow: Future Tax’ to investigate how the UK tax system could adapt to meet the needs of the modern and future economy. We’re asking stakeholder groups with different perspectives – citizens, business and students – to share their views and develop recommendations, which we’ll be consolidating to share with policy makers.
Largest ever research into women in the workplaceWe launched a ground-breaking study of the barriers women face in the workplace, in partnership with Opportunity Now, the campaign for gender diversity from Business in the Community. The project focused on women aged 28-40, which has been identified as a critical phase for career development.
Our international contributionAlso in May, we entered a strategic alliance with PwC Africa, following our successful and ongoing alliances in the Middle East and Europe. And, earlier in the year, the Climate & Development Knowledge Network (CDKN), which PwC has led since 2010, won a Climate Week Award for its ‘Legal Response Initiative’ (LRI). The LRI offers high quality, strategic legal services to low income countries, for free, to assist them in international climate change negotiations.
32 18,500 26% of new partners admitted were female – a record number
peoplein our communities benefitted from our people’s volunteering activities
% reduction in CO2e since our 2007 baseline – currently ahead of our 2017 target

4Corporate sustainability annual update 2014 | Highlightswww.pwc.co.uk/corporatesustainability
Hig
hlig
hts
Con
text
Our
repo
rtin
g
Our
per
form
ance
Our
impa
ct
App
endi
ces
An introduction from our chairman
We believe in doing the right thing for our clients, our people and our communities, using our skills to build a more sustainable future. That’s why our focus is on responsible, profitable growth.
During the last year, we have continued to transform and invest in our business, as highlighted in our 2014 Annual Report and our Transparency Report, which sets out how we meet our regulatory requirements and public interest obligations. In these documents, we describe our role in the economy and in the communities in which we operate.
However, it is also vital that we articulate our approach to our own sustainability for the long term, and how we contribute to a sustainable economy. We do so in this, our 2014 Corporate Sustainability Annual Update.
This year, we report on our campaigns relating to the five megatrends that are shaping the world around us and how we are guided by our purpose - ‘to build trust in society and solve important problems’; we describe our business model, and the key inputs to our business; we share our performance against our sustainability targets; and, following the launch of our Total Impact Measurement and Management methodology in 2013, we again share our 2014 ‘total impact’, monetising our
contribution to the economy, treasury, society and the environment, and comparing it to last year.
I’m pleased with the progress we’ve made, but there’s more to do, as sustainability continues to be at the heart of PwC and a fundamental part of how we run our business.
“We’re innovating and investing to ensure we stay relevant as our clients’ needs change. We’re leading the debate on the social, environmental and economic issues of our time. This enables us to deliver responsible, profitable growth.”
Ian Powell
Chairman & Senior Partner
pwc.co.uk/annualreport
pwc.co.uk/transparencyreport

ContextIn this section: Sustainability’s about connecting to the bigger picture – global megatrends, our purpose and our business model. Learn about the backdrop which has shaped our agenda.2

6Corporate sustainability annual update 2014 | Contextwww.pwc.co.uk/corporatesustainability
Hig
hlig
hts
Con
text
Our
repo
rtin
g
Our
per
form
ance
Our
impa
ct
App
endi
ces
40%46%
59%60%
81%
Clim
ate change & resource scarcity
Rapid urbanisation
Shift in global economic power
Demographic shifts
Technological advances
Five megatrends that are shaping our world
pwc.co.uk/megatrends
We live in turbulent times, where interdependent megatrends are accelerating the pace of change and volatility in our world and society, requiring greater innovation, agility, and resilience from businesses and governments alike.
CEOs across the globe are feeling the need to respond with new levels of leadership. In PwC’s 17th Annual Global CEO Survey, 75% of CEOs agreed that it’s important to satisfy societal needs (beyond those of investors, customers and employees) and to protect the interests of future generations.
Throughout 2013-14 PwC identified five key, long-term megatrends that are shaping the future world of our clients, and our own priorities:
• Climate change and resource scarcity: A more populous, urbanised and prosperous world will deplete basic resources such as food, energy and water, and make our planet less hospitable. Environmental sustainability will be imperative for success.
• Demographic and social change: A younger Africa, and an older world will require more agile economies and businesses, and more diverse workplaces.
• Rapid urbanisation: Ever increasing populations will demand new ‘city models’ that are smarter, more efficient and more resilient.
• A shift in global economic power: Successful economies will be predicated on parallel development of their economic, social, communication, political and environmental dimensions, not just GDP.
• Technological advances: Falling prices and faster time-to-market for new technologies will have both disruptive and transformative potential.
When two or more megatrends collide, they can give rise to disruptive states that challenge the very assumptions that have held the economy and society together for decades. The biggest impact of these collisions for us, as a business, is that they create unexpected risks and opportunities for our clients.
So, we’ve launched a campaign to raise awareness of them, and share our insight on what it means for different sectors, through our website and social media. And, we’re encouraging all of our people to debate these topics with the individuals and organisations they spend their time with, helping them to thrive in this new context.
Of course, these trends are also shaping the context for our own operations and – although the implications are not as pronounced for a professional services business as for some other organisations – we’ve taken them into account in how we adapt our business. This is particularly pertinent with regards security of energy supply and continuity planning for business travel, both of which will be increasingly affected by resource scarcity and climate change, as well as the changing role of technology in enabling us to meet our commercial goals. We describe how in the environmental performance and responsible business sections of this report.
In our 17th Annual Global CEO Survey, we asked the leaders of the world’s biggest companies what were the top three global trends they believed would transform their business over the next five years. The chart below shows the percentage naming specific megatrends.
The megatrends are already high on CEOs’ agendas

7Corporate sustainability annual update 2014 | Contextwww.pwc.co.uk/corporatesustainability
Hig
hlig
hts
Con
text
Our
repo
rtin
g
Our
per
form
ance
Our
impa
ct
App
endi
ces
Our purpose: To build trust in society and solve important problems
??????????? ???? ???????
???? ?? ?
This year, following debate involving all of our network firms1, we rearticulated our purpose, focusing on the area where our unique capabilities can meet the most critical needs of our stakeholders.
Our purpose – ‘To build trust in society and solve important problems’ – builds on our heritage of creating trust in the capital markets (by auditing financial accounts), and providing advice to help public, private and voluntary organisations be successful. We’ve now updated it to focus on the issues of the 21st century and a broader, long-term context. Our aim is that whilst it describes our work of today, it will also guide our decision-making and investment strategy of tomorrow, ensuring our ongoing relevance and leadership in the marketplace.
For example, today, the trust of the general public in many institutions is in decline. Yet, that trust is a vital ingredient of a functional modern society. We feel we can play a valuable role in restoring trust in business and in society: for several years, we’ve been investing in both research to enhance the understanding of trust drivers and in new ‘trust services’ that can help restore and enhance the psychological contract between different stakeholders.
One example is our assurance services, through which we aim to increase the level of trust placed not just in company accounts but in all kinds of information, systems and processes. We’re exploring new approaches to the measurement and audit of non-financial information (see page 20 & page 32). And, we’re developing ways to use technology to provide completely new levels of assurance and insight over huge data sets.
In parallel, our clients face global and local challenges arising from the megatrends set out on the previous page.
We’re investing in solutions to these important problems. We continue to build our Sustainability and Climate Change practice, advancing natural capital accounting and international development, for example. We’ve also expanded the capabilities of our Technology teams in key areas of cyber security, data analytics and digital business and launched a campaign to help clients capitalise on the digital revolution (worldinbeta.com).
But for our purpose to be effective, we need to embed it into our day to day behaviours and thinking. So we launched it internally earlier this year, encouraging our people to debate and explore it in online sessions with leaders around the world.
Moving forward, our purpose will influence our interactions with all our stakeholders, permeating our business strategy and choices. It will ensure our ongoing relevance as a pioneer, shaping the debate and driving change for positive economic, social and environmental impact.
1. PwC UK is a member of the PwC network of firms, which delivers assurance, tax and advisory services across 157 countries.

8Corporate sustainability annual update 2014 | Contextwww.pwc.co.uk/corporatesustainability
Hig
hlig
hts
Con
text
Our
repo
rtin
g
Our
per
form
ance
Our
impa
ct
App
endi
ces
Iconic
Our vision
Who we are
Performance goals
PwC Experience
Personal responsibility
Growth Profit QualityLeadingfirm
IconicOur ambition is to become the
iconic professional services firm, always front of mind, whenever
professional services are mentioned.
Who we areWho we are is the essence of
the culture at the heart of our firm. It brings our vision to life and sets out the behaviours we need to adopt individually and
collectively to make the ‘PwC Experience’ a reality.
Our key performance indicatorsLeading firm We want to be the leading professional services firm – number one in size and reputation.Growth We want to remain the leading firm by revenue and continue to grow responsibly and profitably. Profit We want to grow our profits, invest in our future and competitively reward our people. Quality Delivering an exceptional service and quality to our clients is an integral part of our strategy.
Our visionOne Firm – doing the right thing
for our clients, our people and our communities.
Performance goalsOur performance goals are how
we define the successful delivery of our business strategy. Delivery of our goals is measured through
our balanced scorecard.
PwC ExperienceTo achieve our goals and remain ahead, we need to offer our clients and our people a distinctive experience. We embed the PwC Experience behaviours in everything we do.
Personal responsibilityEveryone must take personal responsibility to play their part in delivering the firm’s strategy.
Our business strategy: Responsible, profitable growthOur business strategy (right) defines our long term strategic objectives. It brings together all the components required for us to compete effectively in the marketplace. It shows how our values and the behaviours of all our people will help deliver our performance goals, as measured by our balanced scorecard, and achieve our ambition and vision. Ultimately, we deliver on our purpose through our business strategy.
Our commercial strategy is supported by our sustainability strategy, which we set out on page 13.

9Corporate sustainability annual update 2014 | Contextwww.pwc.co.uk/corporatesustainability
Hig
hlig
hts
Con
text
Our
repo
rtin
g
Our
per
form
ance
Our
impa
ct
App
endi
ces
This year, we’ve developed a description of our business model to show how we create value for our stakeholders by delivering against our purpose.
We believe in walking the talk, and apply the same advice we give to others to ourselves. One such area is integrated reporting, where we’ve supported both the International Integrated Reporting Council (IIRC) and clients to explore new ways of describing business performance.
For the first time this year, we’ve set out our own business model, with its inputs and outputs, as recommended by the International Integrated Reporting Framework. We’ve chosen to share this here, in our sustainability report, as it links to our total impact assessment.
We have a diversified business with a wide range of clients across a variety of different industries. As a people-based organisation, our primary external input is human capital. We also draw on a bank of financial, intellectual and social capital we accumulate through our operations and we require some, relatively modest, environmental resources and manufactured assets to run our operations.
At the heart of our business model are four strategic processes (see panel, right),which create a virtuous circle of responsible, profitable growth.
Our business model
Our business model
1. Attracting and developing diverse talent We recruit, train, develop and motivate talent from diverse backgrounds, to create an agile workforce that can offer solutions for our clients and other stakeholders, focused on assurance, tax, deals and consulting services. Being a progressive employer that offers exceptional career and development opportunities gives us competitive advantage.
2. Creating exceptional insight and know-howWe anticipate market trends and identify areas where we can invest to ensure our points of view, methodologies, technology, and technical know-how address the risks and opportunities facing industries, our clients and society. Our partnership structure encourages a culture of entrepreneurship and innovation and we make the capture and sharing of knowledge a priority for all our people. When appropriate, we acquire companies with specific expertise that fills gaps in our existing portfolio.
3. Understanding client needs and opportunitiesWe spend time getting to really understand our clients, in the private, public and voluntary sectors, listening to them closely. We differentiate ourselves by focusing on the value they’re looking for, and having a strong, global network with deep roots and local knowledge wherever they need it. Our focus on trusted, collaborative partnerships extends to all our stakeholders, including our suppliers and community partners. It’s part of our culture and our common set of values, including personal responsibility and doing the right thing.
4. Harnessing technology and delivering distinctive solutionsWe assemble the right people and know-how to deliver a ‘One Firm’, distinctive service (the ‘PwC Experience’) to help our clients comply with regulations, manage and reduce risks, or seize new opportunities. Our solutions draw on talent from any of our lines of service, anywhere in the UK or from our network of territories around the world. Increasingly, we’re applying technology as a game changer, to create new solutions, or significantly enhance existing ones. This creates financial capital which is reinvested in the business, or distributed to our partners, whilst additional value is created for our other stakeholders.
Four strategic processesOur performance We report extensively on our business and financial performance in our Annual Report. It includes our full accounts and a balanced set of non-financial information.
However, stakeholders with an interest in sustainability often require more detailed information on issues which are not so central to our business that they need to appear in that publication. Instead, we’ve developed a dedicated sustainability scorecard that covers all the issues on our sustainability materiality matrix, for all three priority levels, so that we can provide transparent and comprehensive reporting to those interested in this aspect of our business. We report on these ‘outputs’ of our business in chapter 4 of this report.
Our impactOver the past two years, we’ve also started to estimate our impacts, converting them into monetary terms using our proprietary methodology – Total Impact Measurement and Management (TIMM). It’s helped us measure the relative scale of our economic, tax, social and environmental contributions – both positive and negative, and better understand and manage the trade-offs. You can read more in chapter 5.
Iconic
Our vision
Who we are
Performance goals
PwC Experience
Personal responsibility
Growth Profit QualityLeadingfirm

10Corporate sustainability annual update 2014 | Contextwww.pwc.co.uk/corporatesustainability
Hig
hlig
hts
Con
text
Our
repo
rtin
g
Our
per
form
ance
Our
impa
ct
App
endi
ces
Crea
ting
ex
ceptional insight & know-how
Und
erst
anding client needs & opportunities
Harne
ssin
g te
chnology & delivering distinctive solutions
Att
ract
ing and developing diverse talent
Our purposeTo build trust in society
and solve important problems
Our servicesAssurance Consulting
DealsTax
Financial capitalEquity from partners,
third party debt
Human capitalGraduates, school leavers,
experienced hires
Trusted relationships
Brand and reputation, stakeholder relationships,
licence to operate
Intellectual capitalTechnical and technological
expertise; proprietary tools & methodologies
Natural resourcesTravel, energy/supplies for offices
Physical assetsOffices, IT equipment
Business inputs
Four strategic processes
Our performanceBusiness strategy See Annual Report
Sustainability strategy See page 18 and page 43
Our impact on societySee page 31.
Our business modelAt a glance

11Corporate sustainability annual update 2014 | Contextwww.pwc.co.uk/corporatesustainability
Hig
hlig
hts
Con
text
Our
repo
rtin
g
Our
per
form
ance
Our
impa
ct
App
endi
ces
Our business creates value for many different stakeholders, in different ways.
We provide our clients with professional skills and services that help them achieve their goals, and our audit practice has an additional role in providing confidence to both shareholders of our clients and to our regulators in the quality of the corporate and financial information published by our clients. Of course, our people benefit from the jobs we provide – over 18,400 this year – and through the development opportunities we offer.
Beyond this narrow view of stakeholders, the Treasury receives taxes borne and collected by our business for the benefit of the nation, and our suppliers are boosted by our procurement of goods and services we require. Our communities benefit from the skills of our people, whom we encourage to volunteer as part of our engagement and leadership programmes.
At a more macro level, we make a significant contribution to the UK economy through the gross value added (GVA) from our operations, and from the spending of employees in our value chain in the economy.
Finally, our alumni provide talent for other businesses, and our thought capital and know-how make a contribution to business and society more generally.
Creating value for our stakeholders
Our operations also have negative impacts – on the environment – albeit small. Our programmes to reduce these are ongoing, and we have already made considerable progress, as described in the ‘Our performance’ section of this report, and in our sustainability scorecard. We remain committed to minimising the natural capital depletion arising from our operations, as quickly as practical.
We explain all our impacts in detail in chapter 5.
Consulting our stakeholdersWe wouldn’t exist without our stakeholders, so we listen carefully to their expectations – and views on how well we’re meeting them – as well as collaborating with them for deeper insight and mutual benefit.
We have well-established and comprehensive stakeholder engagement processes. We gather both qualitative and quantitative input, informing both our strategic direction and our day-to-day performance, and maximising the value of our contribution across all groups.
In mapping our stakeholders, we have, of course, identified those where we have a legal, commercial or moral responsibility to them – such as our regulators, clients and the communities around our offices. Others are also important because we depend on them to operate – such as our people and our suppliers, and we’re conscious of groups who may become clients or employees in future, such our alumni and graduates.
But we also value diverse perspectives on our business from less obvious stakeholder groups, who can highlight areas needing our attention or new opportunities. We proactively seek these through our interactions with media and NGOs that have an interest in our affairs, to understand both critical and favourable views.
Where desirable, we’ve established internal or external indicators to measure the coverage and quality of our engagement, and we report back to stakeholders on the results and actions we take.
Our sustainability scorecard highlights the results of major surveys we ran with our clients and our people during the year, and our stakeholder table outlines some of their comments.

3About this year’s reportIn this section: Find out about our sustainability strategy and how it’s shaped our approach to reporting.

13Corporate sustainability annual update 2014 | About this year’s reportwww.pwc.co.uk/corporatesustainability
Hig
hlig
hts
Con
text
Our
repo
rtin
g
Our
per
form
ance
Our
impa
ct
App
endi
ces
Our sustainability strategy
Bridget Jackson
Corporate Sustainability Director
pwc.co.uk/corporatesustainability
Given the scale and speed of the changes in the world around us, and the level of ambition inherent in our purpose, we see sustainability less as continuous improvement to business-as-usual, and more about our influence in the world. It’s about how all our business decisions can contribute to greater trust, and to solving important problems.
So, our sustainability strategy focuses on how we’re delivering on our purpose, under the umbrella of two strategic intents:
• Be a catalyst for change – using our knowledge, skills, voice, and relationships to make a difference, create change and have a lasting impact on the world around us.
privileged to have an incredible range of relationships and breadth of perspectives. This enables us to effectively convene stakeholders to engage in debate on deeply challenging topics, such as our 2014 #futuretax campaign to define principles that could underpin a reform of the global tax system and inform government policy.
But responsible business is also about the quality and integrity of our advice, so we continue to place great emphasis on maintaining an ethical culture, where our people take personal responsibility for their decisions and behaviours on a minute by minute basis, as well as equipping our people with the sustainability knowledge required for them to advise clients in a way that supports not just their short-term success, but their long term health too.
Workplace and diversity We depend on the quality of our people to deliver distinctive client service. Providing an environment in which they can give their best is fundamental to this aim. But we can only achieve it if we create a great place to work and have a culture that’s genuinely inclusive and respectful, as well as promoting wellbeing both at work and beyond. That’s why one of our core corporate sustainability objectives is to be a responsible employer. This means developing a diverse pool of talented people and creating a high performance culture, so that our people can shape careers which they value and that motivate them.
This is more than words. Over the past ten years, we’ve moved from our first diversity networks to a programme that is fully embedded into our core processes and measurement, complemented by innovative training and campaigns to challenge traditional perceptions and create new social norms that embrace and truly value difference.
• Do the right thing – playing our part on issues that are important to our stakeholders and central to our business – from the quality of our services and the diversity of our people, to our engagement with communities and our environmental footprint.
Our strategy’s founded on some guiding principles – upholding high professional standards, being transparent, trusted and fair, fostering a culture of partnership and collaboration, valuing the longer term consequences of our decisions, and leading by example to create a more sustainable future for everyone. And it comprises four focus areas, each of which enhances our reputation amongst our stakeholders, differentiating us and giving us competitive advantage:
• Responsible business • Workplace and diversity• Community engagement • Environmental stewardship
Responsible businessAs a professional services provider, we’re uniquely placed to help organisations across the globe reduce risk, seize opportunity and become more sustainable through the many services we provide every day. So, we invest in know-how that will transform the way organisations operate, bringing to market new ideas, practices and technologies that can help address the social and environmental issues inherent in the megatrends. Acquisitions of companies such as GeoTraceability – a software firm that enables the collection of social and environmental data from remote locations for better supply chain traceability and smallholder yields – is one such example: we hope to scale the impact of the technology through our market reach.
As a business which serves clients in every industry, and in the public, private and the voluntary sector, we’re also

14Corporate sustainability annual update 2014 | About this year’s reportwww.pwc.co.uk/corporatesustainability
Hig
hlig
hts
Con
text
Our
repo
rtin
g
Our
per
form
ance
Our
impa
ct
App
endi
ces
Community engagementOur PwC in the Community programme is designed to maximise our impact on behalf of our most significant community stakeholders, utilising our professional skills in a way that fits with our business goals. We aim to tackle current UK issues; use our extensive networks for the mutual benefit of our community partners and our people; use our regional network and share our knowledge to amplify our effectiveness; and apply our unique impact measurement skills to our community work. Our community activities are supported by The PwC Foundation, a registered charity set up with the aim of promoting social inclusion and sustainable development in UK.
We offer a portfolio of support which includes financial contributions, pro bono and discounted work and the volunteering of our people. This mix of activities offers our people a choice of ways to contribute so that as many of them as possible can benefit from the opportunities available.
We focus on developing long term relationships so that we can make a lasting difference, such as our six-year partnership with the School for Social Entrepreneurs to pioneer social change. And, we’re increasingly measuring both the business and social value of all our programmes to allow us to maximise the shared value.
Volunteering is also hugely attractive for our people, who value the opportunity to ‘give something back’ as part of their career.
Environmental stewardship As a professional services firm our reliance on natural capital is small compared with many other industries. But our clients, our people and other stakeholders still expect us to
minimise our impact, and as a responsible business whose operations ultimately rely on natural resources, we want to do everything we can. Environmental stewardship is one of our main sustainability objectives.
Addressing our impacts has been a journey of over a decade, in which we’ve moved from basic environmental policies and management systems, to a more advanced agenda which demonstrates ‘the art of the possible’ by setting new sustainability standards for buildings and creating new, sustainable business models, such as our closed loops for chip-fat to biofuel and office paper to paper towels. We’re proud to have piloted, and been early adopters of, several standards that have subsequently become the benchmark for many other organisations. We’ve offset our operational carbon emissions at the end of each year since 2007, to maintain our position of zero net CO2e emissions.
The rest of this report covers our progress and performance against each of these areas, and the impact we have on the economy, treasury, society and environment as a result.
Sustainability in our supply chainPutting our strategy into practice entails taking responsibility for the impacts along our value chain. So, over the last 18 months or so, we’ve refreshed our supplier sustainability programme to create a more strategic and formalised approach, proactively engaging our Top 100 suppliers for performance improvement.
We’ve focussed on greenhouse gas reductions, as our total impact analysis revealed that not only was this the most significant of our five environmental impacts, but that our supply chain or ‘indirect’ impact was 96 times greater than the ‘direct’ impact of our own operations. We’ve also embedded sustainability into contractual arrangements on a case by case basis to start to address our other environmental impacts, especially around waste and land use change.
It’s part of our culture to engage with our suppliers in the same respectful, supportive and collaborative way as all our stakeholders, and our strategy includes a focus on being fair to our suppliers and their employees who serve us.
This year, we’re including a supply chain sustainability section in our scorecard to track our progress.

15Corporate sustainability annual update 2014 | About this year’s reportwww.pwc.co.uk/corporatesustainability
Hig
hlig
hts
Con
text
Our
repo
rtin
g
Our
per
form
ance
Our
impa
ct
App
endi
ces
Our sustainability materiality matrix
Mat
erial
ity o
f iss
ues
to s
take
hold
ers
HIGH
LOW
LOW Materiality of issues to the business HIGH
2
3
4
13
1
5
14
15
16
7
119
17
18
6
810
19
20
12
21
Sustainability is such a broad topic, that it’s important for businesses to understand their top priorities and to align time, resources and investment accordingly. We developed our sustainability materiality matrix in 2011, based on surveys, interviews and desk research with our clients, our people, potential recruits, regulators and NGOs.
The matrix is aligned with our principal business and operational risks, informs our sustainability strategy and has shaped our approach to sustainability reporting. We concentrate on the highest priority items in our annual report, using this report and our corporate sustainability website to give a more detailed and comprehensive review of the issues. Over the years, we’ve developed metrics to help us measure our progress, as indicated in our scorecard.
We review and adjust the matrix each year, as the external and business context changes. This year, we’ve decided to increase the importance of ‘inclusion and diversity’ to reflect the growing advantage we gain from being a progressive employer, and the expectations of government around access to the profession. We’ve also increased the business importance of ‘training and development’ as we seek to embed sustainability in our services.
Of course, the issues material to a business will not usually change dramatically from one year to the next, but it’s now almost four years since we conducted our initial research on this topic with key stakeholder groups, and our business and the market have evolved considerably in that time. So we hope to undertake a more formal review with our stakeholders in FY15 and refresh our matrix in a future report, to make sure it still works as a useful tool to help us manage our sustainability agenda for the next few years.
Responsible business1. Quality & ethics2. Brand reputation3. Governance4. Information security5. Embedding sustainability into
services6. Reporting transparency7. Client selection policy8. Sustainability strategy9. Sustainability reporting10. Responsible procurement11. Stakeholder dialogue12. Benchmarking and awards
Workplace and diversity13. Talent attraction and retention14. Employee wellbeing15. Training and development16. Inclusion and diversity
Community engagement17. Community investment
Environmental stewardship18. Carbon emissions19. Environmental policy and
standards20. Waste and resource consumption21. Biodiversity

16Corporate sustainability annual update 2014 | About this year’s reportwww.pwc.co.uk/corporatesustainability
Hig
hlig
hts
Con
text
Our
repo
rtin
g
Our
per
form
ance
Our
impa
ct
App
endi
ces
Independent assurance reportAbout our assurance
Independent Assurance Report to the members of PricewaterhouseCoopers LLP on Sustainability DataWe have been engaged by PricewaterhouseCoopers LLP (hereafter ‘PwC’) to provide independent limited assurance on Selected Sustainability Data.
The Selected Sustainability Data included within the scope of our report is that which appears on the ‘Non-financial information’ pages of the Annual Reporting for the financial year ended 30 June 2014 and that marked with A in PwC UK’s sustainability scorecard, as set out in the
Corporate Sustainability Annual Performance Update and on PwC UK’s corporate sustainability website1.
It includes:
• all 2014 and baseline quality and ethics performance data• all 2014 workplace and diversity data, and baseline data
for the newly introduced KPIs within the workplace and diversity section (“employee sustainability expectations”)
• all 2014 community involvement and environmental performance data and associated baseline data
• data relating to let area and full time equivalent employees for 2014 used in performance related ratios (website only)
• UK and Channel Islands (i.e. excludes the Middle East).
The scope of our work does not extend to any other information, although assurance was gained in 2013 for all workplace and diversity, community and environment data presented, and in 2012 for all 2007 and 2012 environment and community data presented in that year. Details can be found in the assurance statements in the 2013 Corporate Sustainability Annual Update and the 2012 PwC Corporate Sustainability Annual Performance Update2, respectively.
This report has been prepared to assist PwC in reporting its corporate sustainability performance. We permit this report to be disclosed in the 2014 Corporate Sustainability Annual Update to enable the members to show they have addressed their governance responsibilities by obtaining a sustainability assurance report. To the fullest extent permitted by law, we do not accept or assume responsibility to anyone other than PwC and PwC’s members as a body, for our work, for this report, or for the opinions we have formed.
Respective responsibilities of members and independent assurance providerThe Executive Board – on behalf of the members – are responsible for establishing objective assessment and Reporting Criteria3 for preparing the Selected Sustainability Data, as well as the Corporate Sustainability Reporting and for the information and statements contained within it. They are responsible for establishing and maintaining appropriate systems of internal control from which the Selected Sustainability Data is derived, based on the Reporting Criteria.
Our responsibility, based on our procedures, is to express an independent conclusion on the Selected Sustainability Data as to whether anything has come to our attention which causes us to conclude that the Selected Sustainability Data is materially misstated.
Scope of our workWe conducted our review in accordance with International Standard on Assurance Engagements 3000 (Revised) – “Assurance Engagements other than Audits and Reviews of Historical Financial Information” issued by the International Auditing and Assurance Standards Board
Warwick Hunt
Chief Financial Officer & Executive Board Member
As in previous years, we’ve had our whole report assured. Having robust non-financial information gives us confidence in making business decisions and helps us to build trust with our stakeholders.And, as the leading provider of sustainability assurance to FTSE 100 companies we feel we should lead by example.
Our internal audit team assure all of the narrative and the data in our report, and they oversee a review of the TIMM data by an independent PwC expert. We also receive external limited assurance against the ISAE3000 standard from our financial auditor, Crowe Clark Whitehill (CCW) for the vast majority of performance data in our sustainability scorecard. Previously they’ve assured our workplace & diversity, community and environmental data. This year, they’ve also assured the quality and ethics section.

17Corporate sustainability annual update 2014 | About this year’s reportwww.pwc.co.uk/corporatesustainability
Hig
hlig
hts
Con
text
Our
repo
rtin
g
Our
per
form
ance
Our
impa
ct
App
endi
ces
(‘ISAE 3000’) and we have complied with the ICAEW Code of Ethics. To comply with those standards, our work was conducted by an independent specialist assurance team.
Our procedures consisted primarily of:
• Reviewing PwC’s material issues and reporting boundaries• Making enquiries of relevant members of management
at PwC• Evaluating the design of the systems of internal control for
capturing and reporting the source data • Performing sample tests on a selection of the data
prepared by PwC: this included 17 sites, selected on the basis of their inherent risk and materiality to PwC
• Analytically reviewing the data included within the scope of our report: this included limited substantive testing of the Selected Sustainability Data at corporate head office
• Assessing the disclosure and presentation of the Selected Sustainability Data for the intended stakeholders
In addition, we read all the information relating to sustainability in the 2014 Annual Report and the 2014 Corporate Sustainability Annual Update to assess whether there are any apparent material misrepresentations, misstatements or inconsistencies with the data we have reviewed. If we become aware of any of these, we consider the implications for this report.
Assurance gives the user confidence about the subject matter assessed against the reporting criteria. A limited assurance engagement is substantially less in scope than a reasonable assurance engagement under ISAE 3000. It does not include detailed testing of source data nor the operating effectiveness of processes and internal controls. In addition, there is not yet generally established practice
for evaluating and measuring sustainability data so it is important to read the assurance report in the context of the Reporting Criteria.
ConclusionOn the basis of our procedures nothing has come to our attention that causes us to conclude that the Selected Sustainability Data in the 2014 Annual Report and 2014 Corporate Sustainability Annual Update has not been prepared in all material respects in line with the Reporting Criteria.
Matthew Stallabrass
For and on behalf of Crowe Clark Whitehill LLP Chartered Accountants, London
30 October 2014
1 pwc.co.uk/corporatesustainability
2 pwc.co.uk/corporate-sustainability/downloads.jhtml
3 pwc.co.uk/corporate-sustainability/assurance.jhtml

4Our performanceIn this section: An update on our progress against our operational commitments and targets.

19Corporate sustainability annual update 2014 | Our performancewww.pwc.co.uk/corporatesustainability
Hig
hlig
hts
Con
text
Our
repo
rtin
g
Our
per
form
ance
Our
impa
ct
App
endi
ces
How we measure our performance
Given our level of ambition, putting our strategy into place is not a small undertaking, so we’ve embedded it into the appropriate parts of our business, with dedicated teams for each focus area, and coordination by our Corporate Sustainability team.
We keep track of our progress in two key ways: measuring our performance against metrics in our sustainability scorecard, and evaluating how well our programmes have advanced, through a series of ‘commitments’.
Metrics and targetsWe’ve established key performance indicators for each of the four focus areas outlined in our strategy (page 13), with published targets to hold ourselves accountable and track how we’re doing.
In some instances, we’ve set ambitious stretch goals for the mid-term, to provide the inspiration for teams to deliver a step-change in our performance. This is the case for some of the newer areas of the agenda, such as our environmental performance, where we’ve set five year targets to decouple our impacts from our business growth by 2017. But, as the risk to our business arising from environmental impacts is relatively low, and as the investment schedule associated with the programme of real estate or other infrastructure improvements rather uneven, we prefer to let the teams determine interim targets and monitor them internally.
Issues relating to our people are so critical to our business, though, that we’ve set both long- and short-term targets, to ensure we’re driving change quickly, against a backdrop of ambitious, mid term goals.
In other key areas, such as our community programmes, we’ve
set ‘threshold’ targets, aiming to maintain our performance above a certain level over a number of years. These reflect the high performance we achieve in these areas and are set at what is, in our view, the level our business should aim to sustain on an ongoing basis.
Periodically, we introduce new metrics and update targets to ensure alignment with our strategy.
CommitmentsTo ensure we have a robust change programme in place, we also publish the key initiatives we plan to implement. Over the following pages, we’ve set out these commitments in a separate table for each area of our sustainability strategy. The progress we’ve made against each one is indicated using the symbols shown in the table on the right of this page.1
We track and review our sustainability programme with both the Corporate Sustainability Governance Group2 and the Executive Board throughout the year.
1. In the commitment tables, all years relate to our financial year (July to June) rather than the calendar year.
2. For full details of our sustainability governance, see our website: pwc.co.uk/corporatesustainability
Symbols used in this section to indicate progress against our commitments
Symbol Meaning
N New commitment this year
Not started
In progress
Complete
Ongoing commitment: no end date

20Corporate sustainability annual update 2014 | Our performancewww.pwc.co.uk/corporatesustainability
Hig
hlig
hts
Con
text
Our
repo
rtin
g
Our
per
form
ance
Our
impa
ct
App
endi
ces
Our performanceResponsible business – a catalyst for change
Kevin Ellis
Managing Partner & Executive Board Member
pwc.co.uk/futuretax
pwc.com/inspiringtrust
pwc.co.uk/totalimpact
Being a ‘catalyst for change’ for our clients and our wider profession is a critical component of our strategy. It’s how we bring our purpose to life and a key part of being a responsible business. This year we’ve continued to lead the debate, and to invest in new solutions for business, government and society. And, since our responsibility extends to our supply chain too, we’ve also introduced metrics and targets relating to our supplier sustainability programme.
Helping to shape tomorrow’s tax system We’ve always supported measures to improve tax transparency and maintain an efficient and effective fiscal system. An important part of being a market leader is facilitating debate. This year we launched a campaign – Paying for Tomorrow: Future Tax – to explore how the UK tax system could meet the needs of a modern economy and support a fairer society.
We’re building debate through three key events, which we’re opening to stakeholders with a wide range of viewpoints. In June, we brought together a ‘citizens’ jury’ – 22 members of the public from different walks of life – for two days of deliberation about principles for a new system, before presenting their conclusions to an expert panel, including representatives from government. We convened a ‘business jury’ too, involving senior figures from a cross-section of UK businesses, and are running a competition for students – tomorrow’s workforce. We’ll bring together the combined outputs in a report, outlining what tax reform could look like.
Measuring new forms of valueAs stakeholders look for wider indicators of value to complement financial accounting, we continue to explore innovative ways to measure environmental and social impact. During the year, we refined our proprietary Total Impact Measurement & Management (TIMM) framework, applying it to our own business, and with clients in a wide range of industries. We’re part of a consortium working with Defra and England’s Natural Capital Committee to develop an accounting framework for businesses to report natural capital assets. And, we’ve worked with Kew’s Millennium Seed Bank to determine the value of breeding more productive seed varieties for some of the world’s priority crops in order to help meet the needs of a growing global population.
“One of the most interesting reform initiatives for many years.”Antony Hilton, The Evening Standard, on PwC’s Paying for Tomorrow: the Future of Tax campaign
IN SUMMARY n We use our know-how to develop new services that build trust in society and solve important problems
n We’ve launched a unique, multi-stakeholder initiative to look at options for reforming the UK tax system
n We’ve extended our pioneering work in the measurement of social and environmental value
n We’re developing a new assurance approach to provide greater insight and confidence in non-financial information
21Corporate sustainability annual update 2014 | Our performancewww.pwc.co.uk/corporatesustainability
Hig
hlig
hts
Con
text
Our
repo
rtin
g
Our
per
form
ance
Our
impa
ct
App
endi
ces
Our commitments: A catalyst for change
Date set End date Commitment Progress
New 2015 Complete the next stages of our #futuretax campaign, and share findings N
New 2015 Expand the TIMM team to ensure we can meet market demand N
New 2015 Explore the potential of new assurance models N
New 2015 Examine options for improving average supplier payment days N
Inspiring trust through insightOur audit practice is a vital part of our business, and continues to play a critical role in maintaining trust in the capital markets. But investors and other stakeholders are looking for broader perspectives into how organisations create value, and today’s assurance model doesn’t always fit with reporting approaches for less mature, non-financial information.
We’ve developed a concept which allows assurers to apply their expertise and professional judgement in a different way, providing more subjective insight. It gives an indication of the maturity of the data, and the processes and controls in place for it, so that stakeholders can decide for themselves how much reliance to place on data reported. Download our report or join the debate on our website at pwc.com/inspiringtrust.
Harnessing technology Given the significant number of clients who tell us that technological advances will impact their business in the next five years, we’ve also strengthened our capability in technology, exploring how we can utilise it to solve client and societal problems. We’ve acquired Mokum, a technology consultancy, and GeoTraceability, a start up that uses software to provide better understanding of supply chains; we’ve created Halo, a technology platform that analyses the reliability of information used to drive key business decisions by quickly identifying exceptions and unusual patterns in huge data sets and honing in on areas for further investigation; and we’ve boosted our cyber security, data analytics and digital business.
In June, we launched a campaign to raise awareness of how technology is shaping our world (worldinbeta.com).
“Instead of an audit report being a trust-producing product, the audit process should become a trust-producing practice…and bring into consideration all aspects of the organisation’s value – economic, social and environmental.”‘Enlightening Professions? A vision for audit and a better society’, published by Audit Futures and RSA 2020 Public Services in conjunction with the ICAEW, 2014
Responsible procurement We aim to be responsible throughout our value chain – across our interactions with both our clients and our suppliers. Our supply chain sustainability strategy is underpinned by a holistic set of metrics covering social and environmental issues. We report on our environmental performance later in this report, but are pleased with progress on other issues, too.
This year, the number of key suppliers completing our sustainability survey jumped from 25% to 54%, well on our way towards our 2017 target of 80%. The number of key suppliers with sustainability in their contractual arrangements also rose from 32% in 2013, to 40% this year, as part of our ongoing programme to achieve 80% by 2017.
As a ‘fair customer’, we seek to agree commercial payment terms with our suppliers and, providing performance is in accordance with these terms, to pay promptly. Excluding amounts invoiced by overseas PwC member firms, our target, on average, is to make payment in less than 30 days. This year, we achieved 26 days (see our supply chain scorecard), and we’ll keep our processes under review in the coming year.
22Corporate sustainability annual update 2014 | Our performancewww.pwc.co.uk/corporatesustainability
Hig
hlig
hts
Con
text
Our
repo
rtin
g
Our
per
form
ance
Our
impa
ct
App
endi
ces
Our performanceResponsible business – quality and ethics
Client advocacy and net promoter score
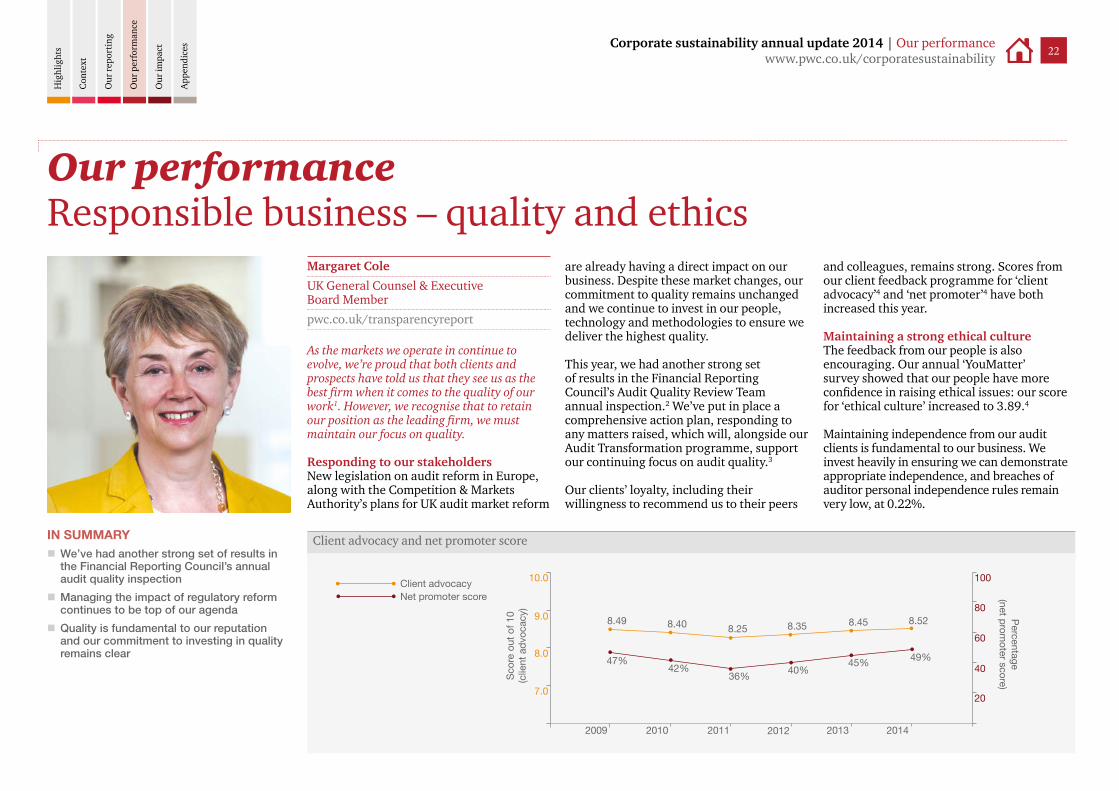
Margaret Cole
UK General Counsel & Executive Board Member
pwc.co.uk/transparencyreport
As the markets we operate in continue to evolve, we’re proud that both clients and prospects have told us that they see us as the best firm when it comes to the quality of our work1. However, we recognise that to retain our position as the leading firm, we must maintain our focus on quality.
Responding to our stakeholdersNew legislation on audit reform in Europe, along with the Competition & Markets Authority’s plans for UK audit market reform
are already having a direct impact on our business. Despite these market changes, our commitment to quality remains unchanged and we continue to invest in our people, technology and methodologies to ensure we deliver the highest quality.
This year, we had another strong set of results in the Financial Reporting Council’s Audit Quality Review Team annual inspection.2 We’ve put in place a comprehensive action plan, responding to any matters raised, which will, alongside our Audit Transformation programme, support our continuing focus on audit quality.3
Our clients’ loyalty, including their willingness to recommend us to their peers
7.0
8.0
9.0
10.0
2009 2010 2011 2012 2013 2014
20
40
60
80
100
2007
Scor
e ou
t of 1
0
Client advocacyNet promoter score
(clie
nt a
dvoc
acy) Percentage
(net promoter score)
47%42%
36% 40%45% 49%
8.45 8.528.358.258.408.49
and colleagues, remains strong. Scores from our client feedback programme for ‘client advocacy’4 and ‘net promoter’4 have both increased this year.
Maintaining a strong ethical cultureThe feedback from our people is also encouraging. Our annual ‘YouMatter’ survey showed that our people have more confidence in raising ethical issues: our score for ‘ethical culture’ increased to 3.89.4
Maintaining independence from our audit clients is fundamental to our business. We invest heavily in ensuring we can demonstrate appropriate independence, and breaches of auditor personal independence rules remain very low, at 0.22%.
IN SUMMARY n We’ve had another strong set of results in the Financial Reporting Council’s annual audit quality inspection
n Managing the impact of regulatory reform continues to be top of our agenda
n Quality is fundamental to our reputation and our commitment to investing in quality remains clear

23Corporate sustainability annual update 2014 | Our performancewww.pwc.co.uk/corporatesustainability
Hig
hlig
hts
Con
text
Our
repo
rtin
g
Our
per
form
ance
Our
impa
ct
App
endi
ces
Our commitments: Quality & ethics
Date set End date Commitment Progress
2013 2014 Undergo the triennial ISO 27001 recertification for our information security management system
2013 2014 Launch a new tool to help reinforce quality process compliance from the early stages of engagements (across all lines of service) in a much more consistent way
2013 2014 Develop and roll out an online, firm-wide, sustainability training course, to further enhance the quality of our client work by highlighting longer term social and environmental considerations
New 2015 Develop and implement a consistent quality review and quality management system across our business
N
Our dismissals for misconduct also remain low, with only eight of our people affected in 2014.
Ensuring information securityWe’re party to significant amounts of commercially sensitive and personal data and so it’s critical that we maintain effective processes to protect it. This year we’ve been re-certificated to the latest standard on Information Security under ISO/IEC 27001: 2013 and we completed 19 days of information security audits with only two minor non-conformities identified, which are being addressed.
Encouraging our people to ‘think sustainability’To help our people better understand the implications of social and environmental issues in their work, we rolled out our ‘Think Sustainability’ training this year. Of the 94% of our people who completed this course, over half of those surveyed confirmed that it led to them adopting more sustainable behaviour.
1. The Brand Health Survey benchmarks PwC on a range of criteria and provides data in relation to our immediate competitors. It’s commissioned by PwC and conducted every two years by a third-party research agency.
2. frc.org.uk/Our-Work/Publications/Audit-Quality-Review/Audit-Quality-Inspection-Report-May-2014-Pricewate.pdf
3. This year, metrics relating to audit quality are included in our Transparency Report.
4. See our quality and ethics scorecard.

24Corporate sustainability annual update 2014 | Our performancewww.pwc.co.uk/corporatesustainability
Hig
hlig
hts
Con
text
Our
repo
rtin
g
Our
per
form
ance
Our
impa
ct
App
endi
ces
Our performanceWorkplace and diversity
Gaenor Bagley
Head of People, Community and Sustainability & Executive Board Member
Our clients operate in a rapidly changing environment (see page 6). They expect us to bring the best people, in the right teams, to deliver the value they’re looking for. It’s critical that we draw our people from diverse pools of talent, equip them with exceptional know-how and create an environment in which they can perform at their best.
Attracting and developing diverse talentWe recruited over 2,700 people this year, including a range of experienced hires, graduates, school leavers and interns. To improve access to the profession, we extended our Higher Apprenticeship scheme, offering 108 roles for 2014-5, and introduced a work experience programme for sixth-form students.
We’ve also established a range of diversity programmes in recent years to develop a strong pipeline of female talent. This year we significantly exceeded our target of 20% for the proportion of women joining the partnership – it doubled to 32% – and we’ve increased the target for next year to 30%. The proportion of our senior management who are female rose as well, to 23%.
We’ve pioneered this agenda externally as
well, with ‘Project 28-40’, a major piece of research carried out in partnership with Opportunity Now, providing practical guidance for businesses on how to maximise the potential of their female workforce.
Our proportion of new female hires dipped slightly this year, from 42% to 40%, missing our target of 43%. But, over 90 women joined our ‘Shadow a Female Leader’ programme, and we’re launching our third Open Minds campaign next year, designed to support the development of inclusive leaders. We hope these measures will bear fruit in the future.
We’re also putting in place programmes to strengthen our Black and Minority Ethnic (BME) diversity. This year, we increased the BME proportion of our new hires by 3% to 26% but our senior management BME dropped from 3% to 2%. We’re now asking recruiters to provide mixed shortlists of candidates, and are aiming to increase diversity among our trained interviewers and interview panels.
Finally, it’s important that our pay policies and practices are fair, so we conduct regular Equal Pay Reviews across the business, including by gender, ethnicity and different working patterns. In FY14 our ‘single figure gender pay gap’ was 15.1%,1 which compares favourably with 19.7% for the UK economy.2 When adjusted to account for the fact that we have more men than women at our
IN SUMMARY n Our long-term success depends on our ability to attract, develop and retain a diverse talent pool
n This year, we’ve doubled the proportion of women joining the partnership to 32%
n We launched a new capability framework – ‘the PwC Professional’ to reinforce leadership amongst all our people
n We launched a flexible working toolkit and innovative approach to help people manage their wellbeing
New hires
women
women
women
New
par
tners
Seni
or m
anagement
40%
32%
23%

25Corporate sustainability annual update 2014 | Our performancewww.pwc.co.uk/corporatesustainability
Hig
hlig
hts
Con
text
Our
repo
rtin
g
Our
per
form
ance
Our
impa
ct
App
endi
ces
Our commitments: Workplace
Date set End date Commitment Progress
2013 Ongoing Continue to change behaviours to become a more open-minded, inclusive and diverse organisation
2013 Ongoing Integrate resilience materials into core training
2013 2014 Develop an ‘Agile Ways of Working’ toolkit to support our people in building more flexibility into their ways of working
New 2015 Develop and deliver third Open Minds diversity campaign, on inclusive leadership
N
New 2015 Set gender and ethnicity targets at each grade to build future pipeline
N
New 2015 Further our diversity and equality agenda by conducting another equal pay review
N
New 2015 Establish a method of measuring social mobility of graduate intake N
New 2015 Develop web-based resilience training to improve access to the course for teams working off-site
N
most senior grades, the gap was 2.5%.We’re continuing to take action to close this.
Developing our peopleOne of the reasons we’re an attractive employer is because of the opportunities we offer for professional development. Formal training is one element of this, and our spending per head on learning and development has increased by 12% this year as we’ve enhanced our non-technical skills training. In part, we’ve done this by launching ‘The PwC Professional’, our global leadership capability framework, focusing on five key capabilities which are central to developing the leaders of tomorrow and delivering the PwC Experience: leadership, business acumen, global acumen and building and maintaining strong relationships, as well as our core technical skills. We’re now using the framework to recruit, develop and assess our people.
Enhancing the wellbeing of our peopleOur people need to be healthy to be at their best, so this year we launched our ‘Don’t be a Boiling Frog’ resilience training, equipping individuals and teams to better manage their stress levels.
Our people value flexibility in their work to help them achieve more balance in their lives, so we’ve also introduced an ‘Agile Ways of Working’ toolkit, offering guidance, tools and case studies to support different ways of
working. We’re at the early stages of rollout, so we’re not yet seeing the results in our work-life balance metric (which remains flat, missing its target), although absence has fallen from 3.2% to 3.1%.
Our engagement score has also risen this year, from 3.98 to 4.0. We aim to maintain it above 4.0. Our voluntary turnover metric is on track, but high potential retention has slipped slightly, from 90% to 88%. Graduate retention rose by 1% but we missed the target of 83%. Retention remains a priority, so we’ll be reviewing our strategy over the coming year.
“It’s about time we brought working practices bang up to date with the needs and choices of our modern families.” Deputy Prime Minister Nick Clegg, who attended the launch of The Right to Request, at PwC’s Embankment Place Office, June 2014
1. This figure doesn’t take into account objective factors such as grade, location or performance level.
2. Source: ONS Annual Survey of Hours and Earnings, December 2013.
For some years we’ve tracked our people’s perceptions of how well we do against their expectations of our social and environmental responsibility. We’ve now decided to publish both metrics in our scorecard, as part of our enhanced stakeholder reporting and we’ve set targets to maintain the scores above 4.0, to help us maintain focus on them. Scores for both have improved again this year and remain well above 4.0.
What our people think

26Corporate sustainability annual update 2014 | Our performancewww.pwc.co.uk/corporatesustainability
Hig
hlig
hts
Con
text
Our
repo
rtin
g
Our
per
form
ance
Our
impa
ct
App
endi
ces
Our performanceCommunity engagement
firestation.pwc.co.uk
pwc.co.uk/socialchange
We’ve continued to focus our portfolio of community initiatives on creating value for our communities, our people and our business. We know it’s important to our people for them to be able to give something back so we offer a variety of ways for them to do so, including financial and ‘in kind’ contributions, pro bono and discounted work programmes and a range of volunteering opportunities.
Giving to charityWe’ve always supported charitable causes, but this year we asked our people to vote for three partner charities to support via the PwC Foundation, a not-for-profit organisation we set up to oversee our donations to charity. They chose the Alzheimer’s Society, Groundwork and the National Literacy Trust to join two charities already supported by the Foundation: the Beyond Food Foundation and Wellbeing of Women. In parallel, we launched our ‘Race for £3 million’ initiative to raise funds for the Foundation, and which formed the basis of our annual firmwide volunteering event, ‘One Firm One Day’.
In addition to supporting our communities financially, as a professional services firm, we can also contribute a lot by sharing our skills. We’ve steadily built up the volume of our people participating in volunteering programmes, and we’re now at a stage where, typically, around a third of our people (i.e. more than 5,000) participate in some sort of supported volunteering each year. However, as we discovered in 2012, this volume is difficult to maintain without ongoing support, so we’ve introduced a new, ongoing, minimum target of 50,000 volunteering hours
per year. We’ve also set a target for at least 50% of our volunteering to be skills-based.
This year, over 5,600 people volunteered a total of more than 51,000 working hours, up 14% from 2013. The increased focus on raising funds has meant that the proportion of our volunteering that is skills-based dropped to 53%, although it’s still above the 50% we want to achieve each year. Our overall community contribution this year was valued at £6.4 million.1
Collaborating for successWe continue to support social enterprises, providing mentors and social impact measurement training. Membership of our Social Entrepreneurs’ Club has grown to more than 220 this year – close to our target of 250 by 2017. And we published a review of our five-year partnership with the School for Social Entrepreneurs, highlighting lessons learned. Our own social enterprise, Brigade, based at the Firestation in London Bridge, has had another strong year, with fifteen more
IN SUMMARY n Our community programme is designed to maximise the impact of our activities for our community partners and our business
n This year, we launched a £3m fundraising initiative to support charities through the PwC Foundation
n Our support for social entrepreneurs (SE) has grown and matured: there are now 222 members of our SE Club
n We’re close to reaching our target of 25 schools supported through our innovative ‘Whole Schools’ programme
n Our impact measurement is enabling us to measure both beneficiaries and the benefits of our programmes
5,600of our people volunteered during working hours in 2014
18,500people benefited from our volunteering activities in 2014

27Corporate sustainability annual update 2014 | Our performancewww.pwc.co.uk/corporatesustainability
Hig
hlig
hts
Con
text
Our
repo
rtin
g
Our
per
form
ance
Our
impa
ct
App
endi
ces
Impact of our volunteering programmes on beneficiaries4
Business awareness 8.47
8.38
8.33
7.95
8.18
7.35
Job readiness
Confidence / self esteem
Motivation
Skills development
Aspiration
Impact (rated out of 10)20 4 6 8 10
apprentices joining the programme run by the Beyond Food Foundation, bringing the total to 60, since 2011.
Education is a significant focus of our community work, and we’ve expanded our ‘Whole Schools’ initiative to 22 schools this year. The programme supports students, teachers and governors of schools such as Harris Academy Bermondsey and Immanuel College in Bradford. We aim to help 25 schools achieve national academic standards by 2017.2
We’ve also extended the range of community partners we’re working with this year. We have 14 PwC BeyondMe3 ‘syndicates’ supporting different organisations, and we’re founding members of the Step Up to Serve campaign, which aims to increase the levels of youth volunteering.
Making an impactUnderstanding the effectiveness of our programmes remains a key objective. We’ve extended our business and social value measurement, surveying nearly 2,000 volunteers and over 650 beneficiaries of our volunteering this year. The responses show
that we’re making a real difference to those we support (see chart). We’re using our impact measurement to drive change in our programmes, too, as outlined in our Theatreworks case study.5 Finally, we’ve estimated the number of people benefiting from our volunteering programmes for the second year: they’ve risen to 18,500 – more than the number of our own people.
1. Measured according to London Benchmarking Group (LBG) guidelines. This excludes a significant amount of work undertaken for charities and social enterprises which doesn’t meet LBG criteria.
2. For England and Wales, we use the government benchmark of the number of students achieving five or more GCSEs (or equivalent) at grades A*-C. For Scotland, we use the percentage achieving SCQF Level 4.
3. Previously known as ‘Young Philanthropy’.
4. Based on 687 surveys, between 1 July 2013 and 30 June 2014. Participants were asked to rate the degree to which they agreed with the statements in post-activity surveys, such as, “After this experience, I feel more prepared for the world of work” (assessing job-readiness). For this graph, n=687.
5. Theatreworks is a programme we undertake in Manchester with the Royal Exchange Theatre and one of our community partner schools, Our Lady’s RC High School – pwc.co.uk/theatreworks.
Our commitments: Community engagement
Date set End date Commitment Progress
2013 Ongoing Continue our journey towards quantifying the social and business impact of our community work
2013 2017 Further develop understanding of beneficiaries, to enable us to report not just on the numbers, but also the extent of our impact on them
2013 2017 Roll out our social value surveys for all of our volunteering activities
2013 2017 Increase membership of the Social Entrepreneurs Club to 250 & extend our services and support to maximise the value to participants
2013 2017 Maximise the benefits of our schools programme through a new ‘Whole School’ approach for 25 schools
New 2017 Raise £3m for chosen PwC Foundation charities N
“This has developed into a great partnership. It’s been a real contributor in moving Immanuel College to become the fastest improving school in Bradford.” Jane Tiller, Head Teacher Immanuel College, Bradford

28Corporate sustainability annual update 2014 | Our performancewww.pwc.co.uk/corporatesustainability
Hig
hlig
hts
Con
text
Our
repo
rtin
g
Our
per
form
ance
Our
impa
ct
App
endi
ces
Our performanceEnvironmental stewardship
Energy consumption
2007
20
40
60
80
10082
76
63 64 60 59 56 52
2008 2009 2010 2011 2012 2013 2014 2017
2007
milli
on k
Wh
Energy consumption2017 target
41
As a services business, our operations require limited natural resources. But our clients expect us, as a responsible business, to manage our environmental impact, and it engages our people, whilst helping to reduce operating costs and risks, too. We’re continually innovating to improve our performance and achieve the stringent targets we’ve set ourselves.
Investing in sustainable buildings to reduce our carbon footprintA key challenge in moving to a low carbon economy is dealing with old building stock, but our newly refurbished London headquarters, Embankment Place, shows the art of the possible. After a retrofit lasting almost two years, this year it achieved the world’s highest ever rating of 96.31% under BREEAM.1
We’ve applied many of the technologies and lessons from our More London office – itself rated ‘Outstanding’ under the same system. Central to this is the tri-generator, which runs on recycled cooking oil: we collaborated with our biofuel supplier and London South Bank University to refine it to the required standard. The tri-generator can produce around 60% of the building’s peak electricity requirements and 20% of the heating load, and emits approximately 40% less carbon than a typical equivalent. We expect that the investment we made in achieving the BREEAM outstanding rating will pay for itself in around four years, and
IN SUMMARY n We achieved the highest ever score under the BREEAM rating system for sustainable buildings for our retrofit of our headquarters in London
n Our operational carbon emissions fell 4%, putting us slightly ahead of our 2017 target
n Emissions from flights dominate our carbon footprint, but the uptake of online meetings has accelerated significantly as we promote alternatives to travel: we’ve set a new target to triple current usage by 2017
n We achieved the ‘triple crown’ of Carbon Trust standards for carbon, water and waste – one of the first three organisations to do so
n We offset all of our scope 1, 2 and 3 emissions reported for the year

29Corporate sustainability annual update 2014 | Our performancewww.pwc.co.uk/corporatesustainability
Hig
hlig
hts
Con
text
Our
repo
rtin
g
Our
per
form
ance
Our
impa
ct
App
endi
ces
Carbon emissions: total and business travel
Our waste: a breakdown
2007
20
40
60
80
100
68 6654 50
58 62 58 5768
88 84 859592
8693
114108
2008 2009 2010 2011 2012 2013 2014 2017
120
2007
Tonn
es o
f CO
2e (0
00s)
Total emissions 2017 target (total)2017 target (business travel)Business travel
2017 target (total)
2007
1,000
2,000
3,000
4,000
5,000
2,922
2,008 2,027
3,026
3,6453,401
3,100
4,054 3,998
2008 2009 2010 2011 2012 2013 2014 2017
2007
Tonn
es
Total Incineration LandfillRecycling
it’s helped us reduce our scope 1 and 2 carbon emissions by 7.5% in the last year.
Tackling travel Our success in reducing emissions associated with energy means that our travel now accounts for 67% of our total footprint, much of it in client-related flights. Our 2017 target is to continue to grow the business while holding travel emissions flat against our 2007 baseline. We’re currently exceeding our target, at 16% below 2007 levels, partially as aircraft fleets become more efficient, and our routes and class of flights change. We continue to promote alternatives to travel, and this year saw our use of online meetings grow by 202% to 3.22 meetings per person, per year. We’ve set a new, ambitious target to more than triple this, to ten meetings per person, by 2017.
Reducing consumption and wasteWe also continue to focus on reducing paper and water consumption, as well as our waste, to help decouple our impacts from our growth. We have a target to reduce all three – paper, waste and water – by 50% by 2017. This year, paper consumption increased slightly against 2013 levels, but we’re still just ahead of our reduction target for 2017. We remain ‘zero waste to landfill’, and this year reduced the amount of waste we generate by 31%, leaving us ahead of our 2017 50% reduction target. However, much of this reduction is from improvements in

30Corporate sustainability annual update 2014 | Our performancewww.pwc.co.uk/corporatesustainability
Hig
hlig
hts
Con
text
Our
repo
rtin
g
Our
per
form
ance
Our
impa
ct
App
endi
ces
Our commitments: Environmental stewardship
Date set End date Commitment Progress
2013 2014 Refine and extend our online meetings campaign
2013 Ongoing Apply the technologies and lessons learned so far from energy and water reduction to other, regional offices in our estate
2013 Ongoing Analyse our suppliers’ responses to the CDP as well as our own questionnaire, and identify opportunities to address our indirect impacts
2013 Ongoing Look for opportunities with suppliers to further improve waste, recycling rates and recycled content of materials we purchase
New 2015 Develop and rollout a programme to help achieve our 2017 goal of 100% recycling of our waste
N
New 2015 Embed our online meetings messaging into the resilience/wellbeing programme
N
Paper and water
2007
200
400
600
800
1,000
206 183 183 183 186 163 141 140
409 415 422509
697649
589
844777
2008 2009 2010 2011 2012 2013 2014 2017
2007
Tonn
es
Paper procured 2017 target (paper)2017 target (water)Water supply
103
the way we measure recycled paper, which have shown we are generating less of this type of waste than we previously thought. Because paper makes up a large part of our overall waste, the drop has had a knock-on effect on our recycling rate, which has fallen from 74% to 68%. Water use remained flat this year at 32% below our 2007 baseline.
Having achieved the Carbon Trust Standard for carbon this year for the third time, we also became one of the first three organisations to achieve the new Carbon Trust ‘triple crown’ of standards for carbon, water and waste.
Carbon neutralityWe’ve offset our operational carbon emissions, as reported in each financial year, since 2007. Our offsets support a range of projects from renewable energy, to REDD+ projects in biodiversity ‘hotspots’ in Indonesia and Madagascar, which focus on working with local communities to reduce deforestation, aware that land use is one of our significant environmental impacts (see page 40).
Engaging our suppliersOur suppliers play a key role in helping us to meet our environmental targets, so we’re focusing on integrating relevant
sustainability criteria into the commercial arrangements with our key suppliers2 – 40% now have them in place. And in our first year of CDP supply chain membership, 54% of our key suppliers responded, with 39% reporting GHG reduction targets. We’re on track to meet the respective targets for each of these, by 2017 (see page 49).
1. Rated against the 2008 offices version, post-construction stage. BREEAM is the world’s leading design and assessment method for sustainable buildings.
2. Our c. top 100 suppliers, prioritised by spend and relevance.
“PwC has encouraged us to measure our energy, set targets, and work hard to meet those targets as our results will be published. ” Guy Nixon, CEO of Go Native (PwC Supplier Sustainability Survey, June 2014)

Our impactIn this section: Here, we report on our ‘total impact’ for 2014 and the change since last year. 5

32Corporate sustainability annual update 2014 | Our impactwww.pwc.co.uk/corporatesustainability
Hig
hlig
hts
Con
text
Our
repo
rtin
g
Our
per
form
ance
Our
impa
ct
App
endi
ces
How we measure our impact
pwc.com/totalimpact
For the second year, we’ve used our unique Total Impact Measurement & Management (TIMM) framework to monetise our economic, tax, social and environmental impacts. It’s one of the ways we’re strengthening our reporting to provide greater transparency for our stakeholders, and improving the information we use for decision making.
Why do we need TIMM?We live in a time of significant change, as reflected by the five megatrends we outlined earlier in this report. A growing global population is placing increasing and unsustainable demands on finite resources. In parallel, societal and investor expectations of ‘responsible businesses’ have increased.
These changes are already affecting corporate decision-making and reporting, but until now, it’s been hard to quantify and monetise social and environmental impacts, leaving them stranded outside traditional accounting and return on investment decisions. Yet, more than 93% of CEOs we surveyed1 said that measuring both their financial and non-financial performance would enable them to better identify and manage their risks. We developed our TIMM framework in response to this need.
TIMM helps private and public sector leaders to understand how different activities contribute to the economy, the environment and society. It provides a more complete assessment of how value is generated (or potentially destroyed) in both the short and long term, helping decision makers to consider the net impact of their actions, beyond financial results. Some of our clients have already recognised the potential of evaluating their total impact, including companies in travel and tourism, fashion, chemicals, utilities,
consumer goods, and mining. You can see examples of how it’s being used on our website, at pwc.com/totalimpact.
PwC UK’s 2014 total impactThe TIMM model, as applied to PwC UK’s impacts this year (next page), shows business activities at the centre, surrounded by the stakeholders who are affected by our operations. Each of our impacts is then represented around the outside of the ‘wheel’, with the value indicated by the size of the bar. The impacts are grouped into four areas, each comprising five indicators:
1. Economic impact 2. Tax impact 3. Social impact 4. Environmental impact
We estimate that our impacts this year total £4.12 billion, 62% more than our revenue and up 3% since 2013. A breakdown by indicator can be seen on the next page, where it’s noticeable that we have a significant positive economic (£2,275m), tax (£1,544m) and social (£188m) impact, with relatively small negative environmental impacts (£109m). More details on our impacts across each of the four quadrants can be found on the subsequent pages.
TIMM is a relatively new framework, and this year we’ve refined the methodologies used to estimate our impact. It’s resulted in a number of changes,2 so we’ve recalculated all of last year’s figures for comparability (our revised total impact figure for 2013 is now £4,002m). As we’ve improved the measurement of our impacts, we’ve also increased the granularity of our reporting, by splitting the breakdown of our impacts into the three categories of direct, indirect and induced (shown by the shading on each bar). This shows
that our indirect and induced impact, together, amplify our total impact by 76%.
We acknowledge that TIMM does not yet account for all our impacts3. For example, our social impact calculation currently only estimates part of our direct impacts, as we’ve chosen only to include those where we’re confident in the robustness of our data and assumptions. We also don’t currently include any impact for the actions our clients take as a result of our engagements.
Nevertheless, our total impact analysis has already permeated the business, helping to embed integrated thinking. It’s given us a concept and language that helps ensure consideration of the social, environmental, and tax implications alongside the financial business case as we manage our day to day operations. And it’s helped us focus our activities to decouple business growth from our environmental footprint.
1. PwC’s 17th Annual Global CEO survey: pwc.com/gx/en/sustainability/publications/total-impact-measurement-management/ceo-survey.jhtml
2. Updates in 2014 to improve accuracy:a. Tax and economic quadrants now use UK input output tables instead of
WIOD conversion tables, as they provide more specificity. b. Expanded scope of tax quadrant to include taxes paid by suppliers as a
result of our purchases, and taxes paid by our employees/partners and the employees of our suppliers on their spending in the economy.
c. Updated 2013 environmental figures for latest DEFRA conversion factors and latest scientific papers on social cost of environmental impacts.
3. 2014 results include all direct, indirect and induced impacts for all economic, tax, and environmental indicators. Social impact calculation currently limited to direct impacts only (see social impact section). All figures refer to impacts before any estimates of the ‘counter factual’ (i.e. what the impact might have been if PwC didn’t exist).
4. [On chart – next page] ‘Exports’ refers to the potential macro-economic costs or benefits resulting from the impact of the organisation’s activities on a country’s balance of payments. In the case of PwC LLP’s operations in the UK, no such impact is expected.

33Corporate sustainability annual update 2014 | Our impactwww.pwc.co.uk/corporatesustainability
Hig
hlig
hts
Con
text
Our
repo
rtin
g
Our
per
form
ance
Our
impa
ct
App
endi
ces
Our total impact 2013-2014
Key
Our total impact: PwC UK 2014£4.12 billion(cf. 2013 £4.00 billion)
Bar size represents the magnitude of our impact
Green represents a positive contribution
Red represents a negative contribution
Grey lines represent impacts where we don’t yet have robust enough data to report
Direct
Direct
Indirect
Indirect
Induced
Induced
Definitions
Direct Impacts from business operationsIndirect Impacts through the effects on
organisations in our supply chain Induced Impacts through the spending by our
employees, or suppliers’ employees, in the wider economy
Social impact
Education£188m(2013: £184m)
Livelihoods
Health Empowerment
Community cohesion
Environmental im
pact
Other airemissions£16m(2013: £16m)
Waste£5m(2013: £5m)
Land use£31m(2013: £31m)
Water useand pollution£7m(2013: £7m)
Greenhousegases£49m(2013: £46m)
Tax impact
Peopletaxes£630m(2013: £624m)
Propertytaxes£76m(2013: £79m)
Productiontaxes£480m(2013: £463m)
Environmentaltaxes£4m(2013: £4m)
Profittaxes£354m
(2013: £337m)
Econ
omic
impa
ct
Exports4
£0(2013: £0m)
Investment£116m
(2013: £111m)
Profits£736m
(2013: £724m)
Payroll£1,380m
(2013: 1,331m)
Intangibles£43m
(2013: £40m)
Bus
iness activities
£
Com
munities
EmployeesShareholders
Suppliers
Governmen
tsC
usto
mer
s

34Corporate sustainability annual update 2014 | Our impactwww.pwc.co.uk/corporatesustainability
Hig
hlig
hts
Con
text
Our
repo
rtin
g
Our
per
form
ance
Our
impa
ct
App
endi
ces
Our economic impact 2014 (cf. 2013)
Our economic impact: £2,275m
IN SUMMARY n Our 2014, UK total economic impact has increased by £68m (3.1%) since 2013 and now totals almost £2.3bn
n For the second year, our total economic impact forms the greatest part (55%) of our total contribution to the UK economy
n 90% (£61m) of the increase relates to higher direct impacts as we grow: of this, direct payroll is responsible for the lion’s share (£42m) as we’ve increased the number and skills of our employees to meet growing market demand. Enhanced profitability contributes another £14m
Economic impact refers to the contribution to the economy through Gross Value Added (GVA). It incorporates the consequences of the direct, indirect, and induced impacts of five indicators – profits, payroll, investments, intangibles, and exports.
Our economic impact is driven largely by the jobs we create and profits we make, with 61% of our total economic impact being attributable to payroll and 32% to profits. As shown by the dark green shading on the economic indicators, over half of this is derived from our direct operations. The rest arises from our procurement (our indirect impacts), or as induced impacts – spending by our people, or by the employees of our suppliers, in the economy (known as the ‘multiplier effect’).
The net year on year change for our total
economic impact is +3%, rising from £2,207m to £2,275m. It’s a direct result of our strategy to continue to employ more people and to invest in our current workforce as we grow our business. Our talent pool now stands at a record number of over 16,300.
We also made some new investments in the year – in the refurbishment of our headquarters and in IT Transformation that will enhance our productivity – but the scale remains small.
Impact: £1,380m (+3.7% cf. 2013)Direct: £702m; Indirect £223m; Induced £455mAs a people-business, our single largest contribution results from our direct spend on our employees, which was 6% higher in 2014 than the year before as we increased the number and skills of our employees to meet growing market demand. In addition, our spending on suppliers resulted in them paying their employees an estimated £223m. The portion of our induced impacts associated with payroll was another £455m.
Bar size represents the magnitude of our impact
Green represents a positive contribution
Direct Indirect Induced
Red represents a negative contribution
Direct Indirect Induced
Key
Econ
omic
impa
ct
Exports£0
(2013: £0m)
Investment£116m
(2013: £111m)
Profits£736m
(2013: £724m)
Payroll£1,380m
(2013: 1,331m)
Intangibles£43m
(2013: £40m)
Payroll
Impact: £736m (+1.6% cf. 2013)Direct: £431m; Indirect £140m; Induced £165m Our business has continued to grow, and its success makes a contribution to the economy through our direct profits, which are
Profits

35Corporate sustainability annual update 2014 | Our impactwww.pwc.co.uk/corporatesustainability
Hig
hlig
hts
Con
text
Our
repo
rtin
g
Our
per
form
ance
Our
impa
ct
App
endi
ces
How our economic impacts compare with last year
-10 -8 -6% variance FY13-FY14
-4 -2 0 +2 +4 +6 +8 +10
Payroll+3.7%
Net economicimpact+3.1%
Profits+1.6%
Investment+4.2%
Intangibles+6.4%
Exports0%
Impact: £116m (+4.2% cf. 2013)Direct: £27m; Indirect £30m; Induced £59mA smaller part of our economic contribution comes from the investments we make in physical assets such as real estate and IT equipment. This year, while the indirect and induced impacts have remained flat, we’ve seen a 14% increase in our direct impacts as we invest in our offices to ensure they are a great place to work or receive clients, and have the highest environmental credentials, reducing our dependence on natural capital.
Impact £43m (+6.4% cf. 2013) This year saw an increase in our ‘intangibles’ impact. It primarily reflects the impact of depreciation of computer software we purchased in 2013 as part of our IT transformation. We have not split out the components, as the scale of this impact is too small to warrant it.
Impact £0m (no change cf. 2013) ‘Exports’ refers to the potential macro-economic costs or benefits resulting from the impact of the organisation’s activities on a country’s balance of payments. In the case of PwC LLP’s operations in the UK, no such impact is expected.
Investment
Intangibles
Exports
distributed to our partners. Changes in the mix of goods and services we purchased in 2013 reduced our supplier profit impacts slightly, whilst our induced profit impacts added another £165m.

36Corporate sustainability annual update 2014 | Our impactwww.pwc.co.uk/corporatesustainability
Hig
hlig
hts
Con
text
Our
repo
rtin
g
Our
per
form
ance
Our
impa
ct
App
endi
ces
Bar size represents the magnitude of our impact
Green represents a positive contribution
Direct Indirect Induced
Red represents a negative contribution
Direct Indirect Induced
Key
Tax impact
Peopletaxes£630m(2013: £624m)
Propertytaxes£76m(2013: £79m)
Productiontaxes£480m(2013: £463m)
Environmentaltaxes
£4m(2013: £4m)
Profittaxes£354m(2013: £337m)
Our tax impact: £1,544m
Our tax impact 2014 (cf. 2013)IN SUMMARY n We’ve updated the methodology for this component of TIMM. It now captures all of our tax impacts including the indirect and induced tax effects
n Our 2014, UK total tax impact has increased by £37m (2.5%), since 2013 and now totals almost £1.54bn
n Most of this (64%) arises from our direct tax contribution (shown in dark green) and relates to taxes on people, as well as production and profit. These total just under a billion pounds (£984m)
Tax impact is the overall contribution of an organisation to the public finances – direct, indirect and induced. It includes taxes on profits, people, production, and property, as well as environmental taxes. The tax impacts are separate from, and additional to, our economic impacts.
As a business, we make a positive contribution to the UK economy through the taxes arising from our business. For several years, we’ve aggregated the taxes we pay and collect on behalf of government, using PwC’s Total Tax Contribution (TTC) approach, and reported them in our Annual Report. Last year was the first time we reported on our total impact, in this sustainability report, and we used our TTC figures as a proxy for our total tax impact.
This year, we’ve refined our methodology to include the taxes borne and collected by our suppliers, associated with the production of goods and services we purchase from them (indirect taxes). We’ve also included the taxes borne and collected as a result of spending in the economy by our employees and those of our suppliers (induced taxes). For comparability, we’ve recalculated our 2013 tax impact figures and restated them in this report, to align with the new methodology.
In 2014, our total fiscal impacts totalled £1,544m, up 2.5% on 2013. This corresponds to an additional 68% contribution on top of

37Corporate sustainability annual update 2014 | Our impactwww.pwc.co.uk/corporatesustainability
Hig
hlig
hts
Con
text
Our
repo
rtin
g
Our
per
form
ance
Our
impa
ct
App
endi
ces
Profits Taxes Impact: £354m (+5.2% cf. 2013)Direct: £276m; Indirect £27m; Induced £51mPeople Taxes Impact: £630m (+1.0% cf. 2013)Direct: £377m; Indirect £105m; Induced £148mA large proportion of our fiscal impact comes from the taxes we pay and collect on behalf of our people – including PAYE and national insurance – as well as the taxes our partners pay on their profits. Shaded dark green in our chart, these taxes total £653m, and represent 42% of our total tax impact. Our indirect and induced contribution from people and profit taxes constitute a further 20% of our total tax impact, with most of the rest arising from production taxes (see below).
We’ve seen a 5% increase this year in our total profit taxes linked to the increased profitability of our business. The overall amount of tax our people pay has risen by 0.3%, despite payroll costs rising by 6.3% – the difference reflecting recent Government changes to the rates and thresholds of people taxes.
Profits taxes and people taxes
Impact: £480m (+3.7% cf. 2013)Direct: £312m; Indirect £62m; Induced £106mWe also contribute through taxes relating to the services we provide (production taxes). These include the net VAT collected as a result of the services we sell, and insurance
Impact: £76m (-4.0% cf. 2013)Our operations incur property taxes (Stamp Duty, business rates), albeit relatively low in comparison to other tax impacts. They have fallen 4% this year as we continue to consolidate our real estate portfolio, occupying fewer, newer offices.
Impact: £3.7m (-9.3% cf. 2013)Given the nature of our business, we use little natural capital and our environmental taxes (Vehicle Excise Duty, Carbon Reduction Commitment, and Congestion Charge) are very small in comparison to our other impacts. Our environmental taxes have decreased by 9.3% this year as we continue to streamline our property portfolio, invest in more energy efficient offices and seek to eliminate unnecessary travel.
Production taxes
Property taxes
Environmental taxes
How our tax impacts compare with last year
-10 -8 -6% variance FY13-FY14
-4 -2 0 +2 +4 +6 +8 +10
Profit taxes+5.2%
Net tax impact+2.5%
People taxes+1.0%
Production taxes+3.7%
Property taxes-4.0%
Environmental taxes-9.3%
our economic impacts. The increase has largely been driven by the enhanced financial performance of our business this year, which flows into each of our impact indicators.
premium tax and air passenger duty on our purchases. We’ve seen a 3.7% increase in our production taxes this year, primarily as a result of our business continuing to grow with the recovering economy.

38Corporate sustainability annual update 2014 | Our impactwww.pwc.co.uk/corporatesustainability
Hig
hlig
hts
Con
text
Our
repo
rtin
g
Our
per
form
ance
Our
impa
ct
App
endi
ces
Bar size represents the magnitude of our impact
Green represents a positive contribution
Direct Indirect Induced
Red represents a negative contribution
Direct Indirect Induced
Grey lines represent impacts where we don’t yet have robust enough data to report
Key
Social impact
Education£188m(2013: £184m)
Livelihoods
HealthEmpowerment
Community cohesion
Our social impact: £188m
Our social impact 2014 (cf. 2013)IN SUMMARY n Our main social impact is the incremental GVA generated from people who train with us and go on to work in the economy at large
n So far, we’ve measured this for just our accountants, with a value of £188m in the UK this year
n We continue to advance our methodology for evaluating our community impacts: we’re now measuring the outcomes of our programmes, but establishing how much is due to PwC’s activities remains challenging
Impact: £188m (+2.3% cf. 2013)As a leading professional services firm, large numbers of people join us for the excellent education opportunities we offer. Acquiring and developing talent is key to our business model and the quality of our services, so we place a lot of emphasis on training our people. In particular, we have large intakes of students from universities and schools each year. They undergo professional skills training with us, gaining technical know-how as accountants, actuaries and other advisors. Over 600 people gained accounting qualifications with us this year.
We aim to retain as many of them as possible, but some use their skills as a springboard for a career in finance or other functional roles in companies across the UK and the world. Typically, our alumni have an increased earning power due to their professional
Education
Social impact incorporates the consequences of business activities on society through outcomes such as livelihoods, health, education, empowerment and community cohesion.
At present the only social impact which we’ve quantified is our contribution to education in the UK. We currently don’t have the data required to measure and value the other impacts reliably. Instead, we aim to explore and develop the indicators in future years.

39Corporate sustainability annual update 2014 | Our impactwww.pwc.co.uk/corporatesustainability
Hig
hlig
hts
Con
text
Our
repo
rtin
g
Our
per
form
ance
Our
impa
ct
App
endi
ces
qualifications which, in turn, generates incremental earnings over the course of their working lives.
In 2014, our education impact equated to just over £188.3m, up £4.3m compared with 2013 as a result of the higher number of graduates we successfully trained in 2014.
Not all of our people are accountants. Our consultants and other professionals benefit from development opportunities too, but we haven’t valued them yet. We have, however, updated our methodology to incorporate the higher state retirement age and restated our 2013 impact (£184m versus £174m).
How our social impacts compare with last year
-10 -8 -6% variance FY13-FY14
-4 -2 0 +2 +4 +6 +8 +10
Education+2.3%
Net social impact+2.3%
Future social valueTIMM is pioneering new ways of measuring value, and we have more to do to measure our full social impact, especially in relation to the training we provide to all our people. In addition, our community activities create value for the areas around our offices, so we’re developing ways to measure the social value of our volunteering.
As a next step in our measurement, we’ve estimated and reported on the number of beneficiaries for the second time this year, as well as developing methodologies to help us better understand how value is created by our major programmes. For example, our ‘Whole Schools’ volunteering programme helps improve the life chances of children in underperforming schools, so its impact would fall predominantly under the ‘livelihoods’ indicator of the social impact quadrant.
Similarly, our work with those at risk of, or already homeless – helping them get back into employment via our social enterprise restaurant, Brigade – would be a positive livelihood impact, although we’re not currently able to put an exact value on it: the annual cost to the public purse of a homeless person has been estimated by government but calculating attribution (what happened as a result of PwC’s actions) and estimating the counterfactual (what would have happened if PwC had not taken action) remain challenging.
The impacts arising from our support for social enterprises, on the other hand, where we provide training and mentoring, will depend on the particular
issue – social or environmental – that their organisation is designed to tackle.
Meanwhile, the PwC Foundation supports specific charities with long term, strategic partnerships, each delivering different benefits: our contribution to health charities Wellbeing of Women and the Alzheimer’s Society would have a positive impact on health in society, whilst the National Literacy Trust would ultimately result in education or livelihood improvements. Our programmes with Groundwork seek to drive environmental improvements by reducing waste and enhancing biodiversity in the UK, so would result in positive impacts in our environmental quadrant.
We know that even if we could measure our community impacts, they’d be dwarfed by our economic contribution, but in some ways we need to look outwards to determine appropriate benchmarks for our community work. What is the scale of our contribution to charities or social enterprises relative to their income and existing access to skills such as those we can offer? And how does measuring the value of the programmes help these organisations to secure additional funds, by better articulating their goals and investment readiness, for example?
Still, with a view to further understanding how we can monetise our impacts, we’re looking to conduct a full social impact valuation on one of our biggest programmes in the coming months and hope to share the findings in next year’s report.

40Corporate sustainability annual update 2014 | Our impactwww.pwc.co.uk/corporatesustainability
Hig
hlig
hts
Con
text
Our
repo
rtin
g
Our
per
form
ance
Our
impa
ct
App
endi
ces
IN SUMMARY n The total environmental impact of PwC UK remains small (£109m) relative to other impacts
n The biggest contributors are greenhouse gas emissions and other air pollution (60%), and land use impacts (29%)
n In 2014, our total environmental impact increased 3.5%, mostly due to a higher social cost of carbon1
n Only 0.2% of our environmental impact is ‘direct’: we’ve reduced it again this year, by 16% as we continue to improve our buildings. Indirect impacts are just short of 100 times bigger, highlighting the importance of our supplier sustainability programme
n Induced impacts represent 79% of our total environmental impact, 364 times bigger than our direct impacts: we’re considering options to reduce them
The TIMM framework enables us to value our negative environmental impacts by assessing the impact on society of our greenhouse gas (GHG) emissions, air emissions, land use, water pollution and use, and waste generation. It includes our direct, indirect and induced impacts.
Measuring our total environmental impactAs a professional services firm, our direct environmental impact is small when compared to many other industries, but we make a concerted effort to minimise it all the same. It’s part of being a responsible business.
To date, most of our focus has been on decoupling the impacts directly associated with our operations from the growth of our business. Our total impact analysis, however, emphasises the scale of our indirect and induced impacts – 21% and 79% of the total respectively. We’re now considering how we can positively influence these, too.
Tackling our indirect and induced impacts Our indirect impacts are those arising from our supply chain, so we’ve reinvigorated our approach to our procurement. Over the past two years, we’ve engaged our ‘top 100’ suppliers on sustainability2, and GHGs in particular, as detailed in the environmental performance section of this report.
However, TIMM has shown that our largest environmental impact is ‘induced’ – a result of general spending in the economy by our people and employees of our suppliers. Given that this induced impact is 364 times bigger than our direct environmental impacts, and almost four times bigger than our supply chain impacts – we’re planning to evaluate options for supporting employees who want to reduce their personal impact.
Our environmental impact 2014 (cf. 2013)
Bar size represents the magnitude of our impact
Green represents a positive contribution
Direct Indirect Induced
Red represents a negative contribution
Direct Indirect Induced
Key Environmental im
pact
Other airemissions£16m(2013: £16m)
Waste£5m(2013: £5m)
Land use£31m(2013: £31m)
Water useand pollution£7m(2013: £7m)
Greenhousegases£49m(2013: £46m)
Our environmental impact: £109m

41Corporate sustainability annual update 2014 | Our impactwww.pwc.co.uk/corporatesustainability
Hig
hlig
hts
Con
text
Our
repo
rtin
g
Our
per
form
ance
Our
impa
ct
App
endi
ces
-10 -8 -6% variance FY13-FY14
-4 -2 0 +2 +4 +6 +8 +10
Greenhouse gases+4.9%
Net environmental impact+3.5%
Other air emissions+2.5%
Waste+2.5%
Land use+2.4%
Water use and pollution+2.3%
How our environmental impacts compare with last year
Impact: £31.3m (+2.4% cf. 2013)Direct: £0.002m; Indirect £4.1m; Induced £27.1mMost of our land use impact occurs outside our operations, but we still want to do the right thing in the land we have influence over. This year, we installed a new living wall, herb garden and insect-friendly borders on the terraces at our newly refurbished Embankment Place office.
Our indirect impact is primarily driven as a result of the land use footprint of the food we consume when in our offices or staying in hotels while working for our clients. Our induced impacts arise largely from the consumption of food by our people, and our suppliers’ people, in their personal lives. Combined, these mean that land use is our second largest environmental impact, so we’re evaluating how we can reduce it in future.
Impact: £48.5m (+4.9% cf. 2013)Direct: £0.2m; Indirect £12.1m; Induced £36.2mAs a service-based business, it’s little surprise that GHGs (£49m) account for the majority of our environmental impact. In our own operations, most of this comes from the energy we use in our buildings and from travel to our clients. So we have programmes in place to help us to reduce our footprint from both, and are on track to meet our targets. We also want to influence our indirect and induced impacts (see page 40).
Impact: £16.3m (+2.5% cf. 2013)Direct: £0.005m; Indirect £3.5m; Induced £12.8mFor our business, air emissions are generated largely from the same activities that cause GHGs – burning fossil fuels for energy, transportation etc. so they are tackled as part of our GHG reduction programmes.
Impact: £5.5m (+2.5% cf. 2013)Direct: £0.043m; Indirect £1.9m; Induced £3.5mWaste is our smallest environmental impact but we’ve still set ambitious targets to address it, because our people and other stakeholders expect it of us as a responsible business. We’ve already rolled out recycling in all our offices and are now collaborating with our suppliers to further reduce our waste and achieve our ambitious 2017 target of 100% recycling.
Impact: £7.2m (+2.3% cf. 2013)Direct: £0.012m; Indirect £1m; Induced £6.2mOur business doesn’t require large amounts of water, with most of our impact occurring as induced impacts, albeit still small. We focus our efforts on an investment programme to reduce its consumption in our offices as we enhance our real estate portfolio.
1. Environmental impacts are converted into monetary value using a ‘social cost of carbon’ which reflects all the scientific evidence available at the time, but generally increases year on year, as the impacts become more extreme and more certain.
2. Our c. top 100 suppliers, prioritised by spend and relevance.
Land useGreenhouse gases
Air emissions
Waste
Water use and pollution

6AppendicesIn this section: All our detailed sustainability metrics set out side by side with year on year trends and progress against targets for fingertip information, plus a summary of our awards and our stakeholder dialogue.

43Corporate sustainability annual update 2014 | Appendiceswww.pwc.co.uk/corporatesustainability
Hig
hlig
hts
Con
text
Our
repo
rtin
g
Our
per
form
ance
Our
impa
ct
App
endi
ces
Our sustainability scorecard(1)
Financial resultsUnits 2014 2013 Base Base year
Financial(2)
RevenueUK revenue(3) £ million 2,539 2,436 2,079 (2007)ProfitPartner profits(4) £ thousand per partner 873 821 778 (2007)Distributable partner profits(4) £ thousand per partner 722 711UK tax contributionTaxes paid/payable £ million 405 390 387 (2011)
Includes partner tax & NIC payable on current year distributable profits
£ million 258 257 265 (2011)
Taxes collected £ million 579 570 463 (2007)
1. All data in the scorecard excludes Middle East. All metrics are firmwide and cover all lines of service.2. All sections of the scorecard marked with A have had their 2014 data assured. For full details on the assurance of our financial data, please see our Annual Report at
pwc.co.uk/annualreport. For details on the assurance of our sustainability data, please see our assurance statement on page 16.3. Excludes Channel Islands.4. Profits are now calculated before the effect of partner and corporation tax. 2013 has been restated using the new method.
A

44Corporate sustainability annual update 2014 | Appendiceswww.pwc.co.uk/corporatesustainability
Hig
hlig
hts
Con
text
Our
repo
rtin
g
Our
per
form
ance
Our
impa
ct
App
endi
ces
Our sustainability scorecardQuality & ethics
Units Ongoing target 2014 2013 Base Base year
Quality & ethicsQuality
Client advocacy(1) Score out of 10 - 8.52 8.45 8.49 (2009)Net promoter score(2) Percentage - 49% 45% 47% (2009)EthicsEthical culture(3) Score out of 5 4.00 3.89 3.87 3.87 (2013)Dismissals for misconduct(4) Number - 8 9 14 (2011)IndependenceBreaches of external auditor independence regulations(5)
Percentage 0.00% 0.22% 0.22% 0.24% (2012)
Information security(6)
ISO 27001: major nonconformities Number 0 0 0 0 (2011)ISO 27001: minor nonconformities Number - 2 1 10 (2011)
1. Based on direct client feedback to the question: “Based on your overall experience of PwC, how likely is it that you would recommend PwC to a peer or colleague looking for similar services?” Measured out of 10, with 10 being the highest score. Prior years restated as client feedback via online surveys and telephone interviews included in 2014.
2. Uses the same survey question as ‘client advocacy’, taking the number of promoters (giving a score of 9 or 10) minus the number of detractors (giving a score of 0 to 6), expressed as a percentage.
3. Results are derived from the firmwide staff Youmatter survey question: “At PwC, I feel comfortable discussing or reporting ethical issues and concerns without fear of negative consequences”. Scored out of 5. A score of 4 or above corresponds to a response of ‘agree’ or ‘strongly agree’.
4. Data covers all permanent UK staff. Excludes dismissals for failed exams and missed performance standards.5. Breaches of the auditor personal independence regulations reported to the regulator, as a percentage of FTE. Prior year data restated to reflect updated measurement method.6. A major nonconformity is a situation that raises significant doubt about the ability of the firm’s information security management system to achieve its intended policy and
objectives. A minor nonconformity is a single identified lapse which would not in itself raise significant doubt as to the capability of the firm’s information security management system to achieve its intended policy and objectives.
A

45Corporate sustainability annual update 2014 | Appendiceswww.pwc.co.uk/corporatesustainability
Hig
hlig
hts
Con
text
Our
repo
rtin
g
Our
per
form
ance
Our
impa
ct
App
endi
ces
Our sustainability scorecardWorkplace & diversity
Units2017
target2015
target 2014 2013 Base Base year
Workplace & diversityTalent attraction and retentionPeople engagement score(1) Score out of 5 >4.00 >4.00 4.00 3.98 3.97 (2007)Graduate retention (3 years) Percentage 85% 83% 79% 78% 82% (2010)High potential retention Percentage 95% 90% 88% 90% 89% (2012)Voluntary turnover Percentage 12-15% 12-15% 13% 12% 14% (2008)Employee sustainability expectations(1)
Social responsibility Score out of 5 >4.00 >4.00 4.12 4.08 4.01 (2010)Environmental responsibility Score out of 5 >4.00 >4.00 4.04 4.01 3.79 (2010)Inclusion and diversityNew hire diversity: gender – women Percentage 50% 44% 40% 42% 41% (2009)New hire diversity: ethnicity – BME(2) Percentage 30% 26% 26% 23% 21% (2009)Partner admissions: women(3) Percentage >30% 30% 32% 16% 16% (2007)Senior management diversity: gender – women(4) Percentage 30% 20% 23% 22% 17% (2011)Senior management diversity: ethnicity – BME(2,4) Percentage - - 2% 3% 3% (2011)Employee wellbeingAbsence through sickness Percentage <3.5% <3.5% 3.1% 3.2% 3.3% (2009)Work-life balance(1) Score out of 5 3.80 3.65 3.53 3.53 3.67 (2008)Learning and developmentSpend on learning and development(5) £ per FTE - - 1,501 1,342 913 (2010)
1. Results are derived from the firmwide staff Youmatter survey. A score of 4 or above corresponds to a response of ‘agree’ or ‘strongly agree’. 2. BME: Black and minority ethnic.3. The partner admissions metric has been restated for all years to include direct partner hires.4. ‘Senior management’ refers to the top leadership roles within the business.5. Prior year data restated to reflect updated measurement method.
A

46Corporate sustainability annual update 2014 | Appendiceswww.pwc.co.uk/corporatesustainability
Hig
hlig
hts
Con
text
Our
repo
rtin
g
Our
per
form
ance
Our
impa
ct
App
endi
ces
Our sustainability scorecardCommunity involvement
Units Ongoing target 2014 2013 Base Base year
Community involvementFinancial contributionCommunity contribution (cash, time & in-kind)(1,2) £ million - 6.4 7.1 4.3 (2007)Employee involvementTime spent volunteering Working hours >50,000 51,535 45,386 37,400 (2007)Skills-based volunteering Percentage of hours >50% 53% 80% 58% (2011)Volunteering during working hours Number of occasions - 6,503 5,320 2,900 (2007)Volunteering during working hours Number of people - 5,663 4,069 4,226 (2011)Payroll giving participation Percentage of staff - 3.4% 3.2% 3.5% (2011)BeneficiariesBeneficiaries: direct(3) No. of people - 18,500 15,113 19,559 (2012)
1. Measured according to London Benchmarking Group (LBG) principles, including calculating in-kind contributions on an engagement basis.2. A significant amount of work undertaken for charities and social enterprises is excluded from these figures because it does not meet LBG recording criteria. 3. Beneficiary numbers have been rounded down to provide a prudent representation of activity.
A

47Corporate sustainability annual update 2014 | Appendiceswww.pwc.co.uk/corporatesustainability
Hig
hlig
hts
Con
text
Our
repo
rtin
g
Our
per
form
ance
Our
impa
ct
App
endi
ces
Units 2017 target Progress 2014 2013 2007 base
Environment – carbonCarbon emissions(1)
Scope 1 Gas Tonnes CO2e - -44% 2,765 3,483 4,906Oil Tonnes CO2e - -97% 14 0 480Biodiesel Tonnes CO2e - 300% 4 3 0Fugitive emissions(2) Tonnes CO2e - 41% 305 388 217
Scope 1 subtotal Tonnes CO2e - -45% 3,088 3,874 5,603Scope 2 Renewable sources(3) Tonnes CO2e - -49% 11,764 12,392 22,974
Non-renewable sources Tonnes CO2e - 44% 3,696 3,790 2,572
Scope 2 subtotal Tonnes CO2e - -39% 15,460 16,182 25,546Scope 3 Air – client facing(4,5) Tonnes CO2e - 59% 44,547 44,903 28,084
Air – non client facing(4,5) Tonnes CO2e - -85% 4,039 4,885 27,762Road(5,6) Tonnes CO2e - -33% 5,724 5,563 8,504Rail(5) Tonnes CO2e - -31% 2,359 2,518 3,425
Business travel subtotal inc WTT(4,5) Tonnes CO2e 0% -16% 56,669 57,869 67,775Fuel & energy upstream emissions(7) Tonnes CO2e - -35% 4,611 4,632 7,065Material consumption Tonnes CO2e - -38% 4,388 5,080 7,077Waste(8) Tonnes CO2e - -84% 85 106 543
Scope 3 subtotal Tonnes CO2e - -20% 65,753 67,687 82,460
TOTAL EMISSIONS (Scope 1, 2 & 3) Tonnes CO2e -25% -26% 84,301 87,743 113,609TOTAL EMISSIONS INTENSITY (Scope 1, 2 & 3) Tonnes CO2e/£m revenue -35% 33 36 55
1. Calculated using Defra conversion factors (May 2013).2. Data for landlord-operated offices have been estimated on the basis of office area, as have all data
between 2007 and 2011.3. Grid electricity supplied under a Climate Change Levy exempt ‘green tariff’.4. Air and associated carbon emissions restated to reflect new Defra emission factors which include
radiative forcing (resulting in almost a 90% uplift).
5. Restated to include well to tank (WTT) conversion factors as per new Defra guidelines. 6. Mileage data for company cars, private cars and electric pool vehicles. Excludes hire car, taxi and
bus data.7. Fuel and energy upstream emissions added as per new Defra guidelines. Includes WTT &
transmission and distribution (T&D) emission factors.8. In 2014 we improved the way we measure our paper waste. The change has resulted in a significant
drop in our figures for recycling and total waste.
Our sustainability scorecardEnvironment – carbon
A

48Corporate sustainability annual update 2014 | Appendiceswww.pwc.co.uk/corporatesustainability
Hig
hlig
hts
Con
text
Our
repo
rtin
g
Our
per
form
ance
Our
impa
ct
App
endi
ces
Units 2017 target Progress 2014 2013 2007 base
Environment – consumptionBusiness travelAir Million km - 5% 148 143 141Road(1) Million km - -31% 24 23 35Rail Million km - -19% 42 38 52Online meetings Meetings hosted per FTE 10 2,187% 3.22 1.07 0.14(2)
EnergyElectricity Million kWh - -35% 35 35 54Gas/Oil/Biodiesel Million kWh - -39% 17 21 28
TOTAL ENERGY Million kWh -50% -37% 52 56 82
Resource consumptionPaper procured Tonnes -50% -51% 415 409 844Water supply m3 (k) -50% -32% 140 141 206
Waste(3)
Landfill Tonnes -100% -100% 0 0 587Incineration to energy Tonnes - -54% 642 773 1,408Recycling Tonnes - -34% 1,366 2,149 2,059
TOTAL WASTE Tonnes -50% -50% 2,008 2,922 4,054
Recycling performanceRecycling as a percentage of total waste Percentage - - 68% 74% 51%
1. Mileage data for company cars, private cars and electric pool vehicles. Excludes hire car, taxi and bus data.2. 2010 data shown as earliest year available. Prior year data restated to reflect updated measurement method.3. In 2014 we improved the way we measure our paper waste. The change has resulted in a significant drop in our figures for recycling and total waste.
Our sustainability scorecardEnvironment – consumption
A

49Corporate sustainability annual update 2014 | Appendiceswww.pwc.co.uk/corporatesustainability
Hig
hlig
hts
Con
text
Our
repo
rtin
g
Our
per
form
ance
Our
impa
ct
App
endi
ces
Our sustainability scorecardSupply chain(1)
Units 2017 target 2014 2013 Base Base year
Supply chain
Supplier engagementKey suppliers assessed by PwC sustainability survey Percentage 80 54 25 25 (2013)Key suppliers reporting to CDP(2) Percentage 80 54 - 54 (2014)
Commercial integrationKey suppliers with sustainability in commercial arrangements(3) Percentage 80 40 32 32 (2013)Key suppliers reporting GHG reduction targets to CDP(2) Percentage 75 39 - 39 (2014)
Responsible procurementPwC average supplier payment days(4) Number of days <30 26 29 29 (2013)
1. ‘Key suppliers’ refers to top 100 or so contracted suppliers, prioritised each year by spend and relevance.2. Based on responses to the 2013 CDP supply chain survey, our first year of participation.3. Based on inclusion of relevant sustainability criteria in ‘request for proposals’ (RFP) documents or contracts.4. Calculated as the average number of days taken by the UK-based entities in the PricewaterhouseCoopers LLP Group to pay supplier invoices (excluding those from PwC
network firms), from receipt of invoice at our accounts payable processing centre.
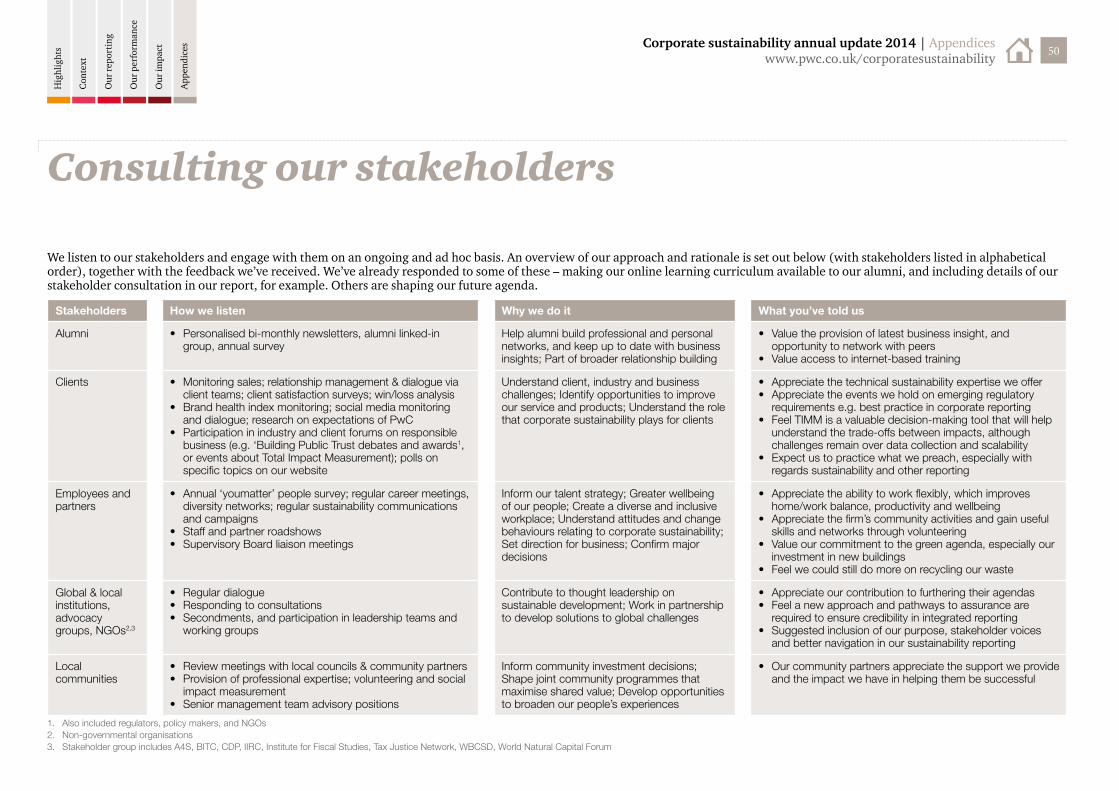
50Corporate sustainability annual update 2014 | Appendiceswww.pwc.co.uk/corporatesustainability
Hig
hlig
hts
Con
text
Our
repo
rtin
g
Our
per
form
ance
Our
impa
ct
App
endi
ces
Stakeholders How we listen Why we do it What you’ve told us
Alumni • Personalised bi-monthly newsletters, alumni linked-in group, annual survey
Help alumni build professional and personal networks, and keep up to date with business insights; Part of broader relationship building
• Value the provision of latest business insight, and opportunity to network with peers
• Value access to internet-based training
Clients • Monitoring sales; relationship management & dialogue via client teams; client satisfaction surveys; win/loss analysis
• Brand health index monitoring; social media monitoring and dialogue; research on expectations of PwC
• Participation in industry and client forums on responsible business (e.g. ‘Building Public Trust debates and awards1, or events about Total Impact Measurement); polls on specific topics on our website
Understand client, industry and business challenges; Identify opportunities to improve our service and products; Understand the role that corporate sustainability plays for clients
• Appreciate the technical sustainability expertise we offer• Appreciate the events we hold on emerging regulatory
requirements e.g. best practice in corporate reporting • Feel TIMM is a valuable decision-making tool that will help
understand the trade-offs between impacts, although challenges remain over data collection and scalability
• Expect us to practice what we preach, especially with regards sustainability and other reporting
Employees and partners
• Annual ‘youmatter’ people survey; regular career meetings, diversity networks; regular sustainability communications and campaigns
• Staff and partner roadshows• Supervisory Board liaison meetings
Inform our talent strategy; Greater wellbeing of our people; Create a diverse and inclusive workplace; Understand attitudes and change behaviours relating to corporate sustainability; Set direction for business; Confirm major decisions
• Appreciate the ability to work flexibly, which improves home/work balance, productivity and wellbeing
• Appreciate the firm’s community activities and gain useful skills and networks through volunteering
• Value our commitment to the green agenda, especially our investment in new buildings
• Feel we could still do more on recycling our waste
Global & local institutions, advocacy groups, NGOs2,3
• Regular dialogue • Responding to consultations• Secondments, and participation in leadership teams and
working groups
Contribute to thought leadership on sustainable development; Work in partnership to develop solutions to global challenges
• Appreciate our contribution to furthering their agendas• Feel a new approach and pathways to assurance are
required to ensure credibility in integrated reporting• Suggested inclusion of our purpose, stakeholder voices
and better navigation in our sustainability reporting
Local communities
• Review meetings with local councils & community partners• Provision of professional expertise; volunteering and social
impact measurement• Senior management team advisory positions
Inform community investment decisions; Shape joint community programmes that maximise shared value; Develop opportunities to broaden our people’s experiences
• Our community partners appreciate the support we provide and the impact we have in helping them be successful
We listen to our stakeholders and engage with them on an ongoing and ad hoc basis. An overview of our approach and rationale is set out below (with stakeholders listed in alphabetical order), together with the feedback we’ve received. We’ve already responded to some of these – making our online learning curriculum available to our alumni, and including details of our stakeholder consultation in our report, for example. Others are shaping our future agenda.
1. Also included regulators, policy makers, and NGOs 2. Non-governmental organisations3. Stakeholder group includes A4S, BITC, CDP, IIRC, Institute for Fiscal Studies, Tax Justice Network, WBCSD, World Natural Capital Forum
Consulting our stakeholders

51Corporate sustainability annual update 2014 | Appendiceswww.pwc.co.uk/corporatesustainability
Hig
hlig
hts
Con
text
Our
repo
rtin
g
Our
per
form
ance
Our
impa
ct
App
endi
ces
Stakeholders How we listen Why we do it What you’ve told us
Media • News releases and results announcements; conferences and roundtables; continuing conversations with journalists; social media discussion
Openly communicating our performance and strategy; Managing our reputation; Sharing our success stories, thought leadership and insight into public and business concerns, as well as discussing our response to responsible business issues
• Recognise PwC for being engaged in the debate about business issues, for our proactivity and our responsiveness to media requests
Policy makers • Consultations on and issuance of standards; participation in round tables or other forums; advisory panel positions
• Dialogue and input to new policy on responsible business issues e.g. (2014) social mobility and apprentices, poverty premium, ‘good growth’, tax reform, natural capital
Help inform policies; Provide new insight through collaborative exchange; Create a more responsible business environment
• Feel we make a positive contribution to the debate
Regulators • Responding (PwC, or our Public Interest Body) to inquiries inspections and reviews
• Proactive engagement on expectations and concerns
Ensure compliance with existing regulations; Help shape new policies, regulations and standards, to co-create a better regulatory landscape
• Value our contribution to the regulatory agenda; • Recognise our emphasis on quality through systems and
controls, and have identified area for further focus
Shareholders • Meetings with shareholder representatives on topics of mutual interest
• Secretariat to the CRUF (Corporate Reporting Users Forum)
Act as a responsible member of the corporate reporting community; Understand perceptions of whether/how our services add value to the investment community, and possible improvements
• Perceive us as having an active and responsive shareholder engagement programme
• There’s more to do on evolving our new-style ISA 700 audit reports
Students • Recruitment events, publications and webcasts, surveys, online employability training; paid work experience and internships
Understand career motivations and job search behaviours of students, & perceptions of PwC; Informing candidates about career choices to widen talent pool & access to our professions
• Appreciate our efforts to extend the diversity of our recruitment
• Feel it’s important to give something back to the community via the workplace
Suppliers • Tendering process, formal supplier assessments, key supplier sustainability workshops, regular conversations with individual suppliers
Understand supplier concerns; Mutual support to enhance quality of service and sustainability standards in our supply chain; Identify opportunities to collaborate on innovative solutions for sustainability
• Many of Top 100 suppliers appreciate the impetus arising from our engagement on sustainability performance improvement
• Keen to collaborate for greenhouse gas reductions

52Corporate sustainability annual update 2014 | Appendiceswww.pwc.co.uk/corporatesustainability
Hig
hlig
hts
Con
text
Our
repo
rtin
g
Our
per
form
ance
Our
impa
ct
App
endi
ces
We’ve been an accredited UK Living Wage Employer since the scheme’s introduction in 2011. This applies to all of our staff and those of our suppliers who work permanently at our sites across the UK.
We’re one of only a handful of organisations to achieve the Chartered Institute of Purchasing & Supply (CIPS) Platinum accreditation, in recognition of world class supply chain management.
External recognitionAwardsParticipating in awards and indices is a useful way for us to benchmark our performance and gain valuable feedback from third parties so that we can continue to improve. It also helps our stakeholders to gauge how we’re doing against our ambitions.
We’ve retained our 2013 Platinum Big Tick rating in Business in the Community’s Corporate Responsibility index, which assesses how well companies are driving responsible business practices across their organisations.
Having achieved Business in the Community’s CommunityMark in 2011, we’ve retained the status again this year. This is the UK’s only national standard for community engagement.
We won the 2degrees award for best internal engagement with our online training course, ‘Think Sustainability’. This helps our people and contractors to consider the sustainability implications of their work.
Building on our strong showing at the BusinessGreen Leaders Awards in recent years, the global head of our Sustainability & Climate Change practice was a finalist in the ‘Leader of the Year’ category this year.
Our newly refurbished office at Embankment Place has achieved the BREEAM Outstanding rating, with the highest ever score. It joins our More London office which achieved the Outstanding rating in 2012.
Having achieved the Carbon Trust Standard for the third time in 2013, we were one of the first organisations to achieve the new Carbon Trust ‘triple crown’ of certificates for good carbon, water and waste management.
For a record 11th year running we’ve been voted the UK’s Top Graduate Employer by final year students, in The Times Top 100 Graduate Employers 2014 survey.
We’ve been recognised as one of The Times top 50 organisations where women want to work, for the eighth year, recognising our commitment to increasing the diversity of our business.
We achieved gold status in Race for Opportunity’s benchmarking survey this year, for demonstrating a clear strategic commitment to racial and gender equality.
We’ve been listed again as one of the UK’s top 100 employers in Stonewall’s Workplace Equality Index 2014 – the definitive list of Britain’s most lesbian, gay and bisexual friendly workplaces.
CommunityMark
BREEAM Offices 2008Cert: BREEAM
0050-5099

53Corporate sustainability annual update 2014 | Appendiceswww.pwc.co.uk/corporatesustainability
Hig
hlig
hts
Con
text
Our
repo
rtin
g
Our
per
form
ance
Our
impa
ct
App
endi
ces
External recognitionStandardsWe use recognised standards to help us review and continually improve key processes related to important aspects of our business. We’re currently certified to the standards listed here.
EMS532263
OHS565375EIMS581339
ENMS563396
BCMS545975 IS569854FS579606


The scope of this reportUnless otherwise stated, this report covers the operations of PricewaterhouseCoopers LLP (‘PwC UK’) during the firm’s 2014 financial year, which ran from 1 July 2013 to 30 June 2014.
About PwCPwC UK helps organisations and individuals create the value they’re looking for. We’re a member of the PwC network of firms in 157 countries with more than 195,000 people committed to delivering quality in assurance, tax and advisory services.
About this publicationThis publication has been prepared for general guidance on matters of interest only, and does not constitute professional advice. You should not act upon the information contained in this publication without obtaining specific professional advice. No representation or warranty (express or implied) is given as to the accuracy or completeness of the information contained in this publication, and, to the extent permitted by law, PricewaterhouseCoopers LLP, its members, employees and agents do not accept or assume any liability, responsibility or duty of care for any consequences of you or anyone else acting, or refraining to act, in reliance on the information contained in this publication or for any decision based on it.
© 2014 PricewaterhouseCoopers LLP. All rights reserved. In this document, “PwC” refers to the UK member firm, and may sometimes refer to the PwC network. Each member firm is a separate legal entity. Please see pwc.com/structure for further details.

Stay informedYou can keep up to date with all the latest news about sustainability at PwC through a range of communication channels:
Follow our blogpwc.blogs.com/sustainability
Follow us on twitter @PwC_UK @PwCclimateready #futuretax #megatrends #totalimpact
Online Access our insights or lessons learned: pwc.co.uk/sustainability pwc.co.uk/corporatesustainability (download centre) pwc.co.uk/megatrends worldinbeta.com
Subscriptions and updatesSubscribe to our regular sustainability publications:
• Global Green Policy Insights pwc.com/gx/en/tax/newsletters/global-green-policy-insights
• Resilience pwc.com/gx/en/governance-risk-compliance-consulting-services/subscribe.jhtml
• Megatrends http://image.edistribution.pwc.com/lib/fe9d13707566057876/m/1/email-alerts-megatrends.html
Email us at [email protected] to be notified when our annual sustainability report is published.