ousehold travel urveys – some proposed...
TRANSCRIPT

1
STANDARDS FOR HOUSEHOLD TRAVEL SURVEYS – SOME PROPOSED IDEAS Peter R. Stopher, Institute of Transport Studies, The University of Sydney, Australia Chester G. Wilmot, Department of Civil and Environmental Engineering and Louisiana Transportation Research Center, Louisiana State University, Baton Rouge, LA, USA Cheryl Stecher, The Franklin Hill Group, Santa Monica, CA, USA and Rahaf Alsnih, Institute of Transport Studies, The University of Sydney, Australia
Abstract Household travel surveys continue to be a mainstay of transport planning and modelling efforts. With rising costs of many surveys, and the critical need for good quality data, questions are raised with increasing frequency on how best to obtain a quality survey that also provides comparable data to other household travel surveys. To try to provide some useful answers to these questions, the National Cooperative Highway Research Program sponsored a research project to develop and recommend standards for household travel surveys that would assist in maintaining a minimum standard of quality in such surveys and that would lead to greater comparability across surveys. In this paper, the state of practice with respect to specifying standards for surveys in general is reviewed. Standards for household travel surveys are found to be non-existent, while those for any type of social survey are found to be uncommon, and to deal with only a few aspects of surveys. In this research effort, over sixty possible areas for standards have been identified, of which more than forty are expected to be developed before the research is complete. This paper describes the results of work on about fourteen of these areas of standards and guidance. A number of proposed standards are outlined, including details of the analysis that, in some instances, has led to the proposals. These proposals have been developed in the North American context, but may also offer potential for other countries, especially in Europe, Australia, and New Zealand. The standards are also intended to be helpful to those who are responsible for developing requests for proposals to undertake household travel surveys, but who lack the level of knowledge and experience to be certain what to request. A number of potential standards are discussed in the paper. The first ones have to do with the initial design phases of a survey, including when a pilot survey or pretest should be done, how to determine a sample size for a pretest or pilot survey, and what is involved in comparing alternative designs within a pilot survey. The second area concerns the instrument design, and addresses such areas as the core set of questions that should be included in any household travel survey, standardising the categories for answers, and developing standard question wordings for certain questions, such as income. A third area includes issues such as the time of day to begin and end a survey, how to report time of day, how to handle answering machines and repeated requests for call backs, reducing incorrect reporting of non-mobility, proxy reporting, and specifications concerning mailing materials. The final area considered in this paper is that of coding of survey results, including missing values, coding complex variables like activities, and computing response rates. Illustrations are provided, where possible, of the consequences of not having standards and the difficulties and loss of quality that have arisen in

2
past surveys. It is concluded that household travel survey quality could be enhanced significantly by adoption of standards in all of the areas discussed in this paper.
1. Introduction Household travel surveys continue to be a mainstay of transport planning and modelling efforts. With rising costs of many surveys, and the critical need for good quality data, questions are raised with increasing frequency on how best to obtain a quality survey that also provides comparable data to other household travel surveys. Standards for household travel surveys are non-existent, while those for any type of social survey are uncommon, and deal with only a few aspects of surveys.
A number of potential standards are discussed in this paper. The first ones have to do with the initial design phases of the survey. The second area concerns the instrument design, while the third area deals with issues of survey methodology. The final area considered in this paper is that of coding of survey results. 2. Design Phases of the Survey
2.1 Incentives Incentives may be offered to induce respondents to complete the survey. A review of recent practice shows that less than one quarter of transport surveys in the 1990s used incentives. Incentives have ranged from a gift to a significant payment of money ($10 and more per household, particularly for GPS surveys, where incentives as high as $50 have been offered). Some are offered only to those completing the survey, while others are offered to all potential respondents. The general survey literature ranks monetary preincentives as the most effective, followed by nonmonetary preincentives, and then by any form of postincentive: satisfying self-interest is a powerful factor influencing survey participation (Zmud, 2003). The transport profession appears to remain generally unaware of this and post-1995 surveys have still offered postincentives, and nonmonetary incentives. However, it remains unclear how much of an effect incentives have on response rates from surveys, because different incentives have also been accompanied by differences in such areas as survey design, survey publicity, survey technique, etc. There are only two known cases in which comparisons have been made of incentives for the same instrument and same population, both of which occurred in pilot tests (Stopher, 1992; Goldenberg et al., 1995). In these cases, incentives improved response rates, although other design changes also occurred and may have affected the results. Kalfs and van Evert (2003) discuss the use of incentives as a means to reduce unit non-response. It has been found that response rates to postal surveys can be increased significantly if incentives are offered in advance (Kalfs and van Evert, 2003; Dillman, 1991). They also note that financial remuneration generally works better than other incentives, such as gifts, although gifts tailored to specific target populations, or gifts that are related to the survey objectives are an exception to this rule. Importantly Kalfs and van Evert (2003) note that if the value of the incentive is too high, it will have an adverse effect on response; people may believe that they are being bribed and the social standard of reciprocity is abandoned. Dillman (1978) has explained that these results come about because people will respond if the psychological costs

3
and benefits are in balance. However, reciprocity may also be aided by interviewers who know that they can do something nice for respondents and are more likely to be assuring and convincing in their approach to potential respondents. They are more passively persuasive. The value of incentives can be shown through an hypothetical example. Suppose that, without incentives, 40% of recruited households will respond, while 50% will respond with an incentive. Suppose that a final sample is required of 3,500 households. With a 40% response rate, this will require 8,750 households to be recruited, while the 45% response rate will require 7,000 households to be recruited. Assuming that recruited households that do not respond cost approximately $25 per household, the non-incentive recruitment will cost $43,750 more than the incentive-based recruitment. The cost of a $1 per person incentive will be on the order of $18,500, representing a savings of $25,250, with further savings from a less-biased response of 50% compared to 40%. Furthermore, these figures are very conservative, because anecdotal reports suggest that response rates may increase by 10 to 25 percent with incentives, and the estimated cost of a recruitment that fails to yield a survey could be much higher. Among the standards proposed are that incentives should be:
1. Offered in all personal travel surveys, unless a pilot survey is able to demonstrate clearly that a final response rate in excess of 90 percent can be achieved without any incentive,
2. Offered only as pre-completion incentives, i.e., they are offered to all recruited units of the sample, and are not conditioned on completion of the survey,
3. Indicated as being offered for completion and return of the survey instruments, or completion of the survey task,
4. Monetary in form, except where local laws or ordinances prohibit offering money. In such cases, a small gift should be offered,
5. Small and on the order of $1-$2 per person, and 6. Offered to each individual and not to the household as an entity.
Alternative incentives should be tested in a pilot survey, so as to establish whether a particular population will be responsive to specific incentives.
2.2 Requirements for Pretests or Pilot Surveys Pretests and pilot surveys are the process of testing various aspects of the survey on a small sample of the population, prior to fielding the main survey. The intention of pretests and pilot surveys is to determine whether or not everything in the intended survey will work and produce the expected results. In some instances, pretests or pilot surveys may be conducted to compare two or more methods for some element of the survey process, and to determine which to choose. In other cases, there is no comparison test involved, although it may be anticipated that some refinements to elements of the survey process will result. It is worthwhile to distinguish between a pilot survey and a pretest because the two terms are used interchangeably in the transport profession. An initial proposed standard is that the same terminology be adopted as used in the survey profession generally: Pilot Survey – a complete run through of the entire survey process, including drawing the sample, conducting the survey, coding the data, and performing basic analysis of

4
the data. A pilot survey is conducted on a small sample of the same population that will be sampled for the main survey. Pretest – a test of any element, or sequence of elements of a survey, but comprising less than full survey execution. Any aspect of survey design and implementation may be subjected to a pretest. Pretests may also be used to compare alternatives for an element or elements of a survey. Reviews of various travel surveys showed that conducting pilot surveys and pretests is not common practice. Evidence shows that when pretests or pilot surveys are conducted, they almost always lead to changes and improvements in the survey instrument, or procedures. Such surveys also avoid situations in which data are collected at considerable cost, only to be found to be inadequate for the intended task. Pilots and pretests should be conducted if there is no prior knowledge of important aspects of the survey, and to enable further improvement in the survey design, especially if a large sample is to be drawn from an unknown field (Yates, 1965; Cochran, 1963; Kish, 1967). In summary, pilot surveys are helpful because they: • Provide information on the various components of variability within the subject population, • Enhance the development of fieldwork procedures, • Enable testing of the questionnaires, • Enable training of the interviewers, • Provide a basis to estimate costs of the actual survey, and • Enable determining the most effective type and size of sampling unit (Yates, 1965). In the literature it is not specified that pilot surveys must be undertaken. However, statements clearly indicate that pilot surveys should be considered essential unless there is considerable prior survey research experience with the subject population. It is also stated that large scale surveys need pilot surveys. While large scale is never defined in these texts, the type of survey usually undertaken in a metropolitan region, where the sample is several thousand households, probably meets the implied definition of a large-scale survey. It is recommended, therefore, that one or more pretests and/or one or more pilot surveys should be an essential step in ALL transport surveys, unless there are specific circumstances that render such a step unnecessary and unlikely to produce useful information. There are limited circumstances under which a pilot survey or pretest could be considered unnecessary. A full pilot survey is unnecessary only when the survey being conducted is essentially unchanged from one that has been conducted successfully in the past on the same population. In the event that a survey is to be conducted that will use a previous design, but where minor modifications are required to the survey instruments, procedures, or sampling, a full pilot survey may not be needed, but pretests of the changed elements are needed. In any survey in which interviewers will interact with respondents, the pilot survey or pretest should include listening in to interviewers to determine how they interact with potential respondents, how well they keep to the script of the survey, and whether the script causes difficulties in conversational style. There should also be a debriefing with interviewers or

5
observers in the pilot survey or pretest, to determine whether or not difficulties were experienced in handling survey procedures, questionnaires or other materials, scripts, etc.
2.3 Sample Sizes for Pretests and Pilot Surveys It seems likely that the sample sizes needed for true pretests would be able to be done effectively with a very small sample of households. For pilot surveys, it would seem likely that a larger sample should normally be necessary. There are no clear statistical procedures for determining the sizes of samples for pretests and pilot surveys. Clearly, the first issue must be one of what it is desired to learn from conducting the pretest or pilot survey. Kish (1967) notes that “If the pilot study is too small, its results are useless, because they are less dependable than the expert guesses we can obtain without it.” (p.51). Dillman (2000) suggests that a pilot survey should have a sample size of 100 to 200 respondents in general, and notes that the size may be larger than this, if resources allow. He also states that “…entering data from 100-150 respondents allows one to make reasonably precise estimates as to whether respondents are clustering into certain categories of questions.” (p.147). To avoid any possibility of compromising the main survey, the main sample should be drawn first. Then the pretest samples and pilot survey sample can be drawn from those households not included in the main survey. There is a problem, of course, in this if one of the purposes of the pretest or pilot survey is to gauge nonresponse levels and determine the size of the needed recruitment sample. In this case, the potential to bias the sample is probably unavoidable. In all other cases, however, the pretest and pilot samples should be drawn after the main survey sample. In those cases where this cannot be done, great care should be taken to draw the pretest or pilot survey samples in a completely random process and to exclude all attempted households, irrespective of outcome from further consideration in the main sample. It is recommended that the main sample should be drawn first, and the pilot survey or pretest sample drawn only from those households or persons who were not drawn for the main sample. Second, it is recommended that no pretest or pilot survey should use a sample of less than 30 completed households or respondents, and that the largest sample that can be afforded should be used. 3. Survey Instrument Design
3.1 Minimum Question Specification Achieving a set of minimum questions or a list of core survey questions (Pratt, 2003), will enable the development of standard variables and categories, allow for uniformity and hence comparability across data sets, and ensure that essential data are always collected. Another benefit of this process is that the value of data already collected will increase, while the cost of implementing the standard proposed remains minimal. Examining seven metropolitan data sets, household items were best represented followed by activity items and personal items. Vehicular items were very poorly represented. This clearly illustrates the need for a set of minimum questions because this is an important area for which data should be collected.

6
A household item identifying racial and cultural background has not been suggested previously. However, despite the controversy associated with asking questions about this item, it should be included in the list. According to Pratt (2003), information on race is required to define the sample population and to conduct interviews; matching interviewers to respondents may increase response rates for CATI surveys. The data gathered on this characteristic of the household may provide insight as to why certain journeys and activities are made. Cultural differences are important to acknowledge before, during, and after the data analysis process especially from an environmental justice perspective. Decisions emanating from unbiased data should take into account travel patterns and needs of particular minority groups and hence address the environmental justice objective: no person or group of people shall be subjected to a disproportionate share of adverse environmental impacts resulting from a development in urban infrastructure or other policy outcome (U.S. Environmental Protection Agency, 1995). Information on household income, a characteristic on which people are reluctant to give information, is important to collect because it may explain the use of certain transport modes, for example, and why particular activities are undertaken. Table 1 provides the recommended minimum question specification. Table 1: Recommended Minimum Question Specifications Category Ref. Item Description
H1 Location Home address or home position in geographic terms H2 Type of Building Detached, semi-detached, terraced, flat, etc. H3 Household Size Number of household members H4 Relationships Matrix of relationships between all members of the household H5 Income Indication of total household income (gross, annual) from all sources H6 Number of Vehicles Summary of number of vehicles from vehicle data H7 Housing tenure Own or rent status
Household
H8 Re-contact Willingness to be contacted again for further surveys, etc. P1 Gender P2 Year of Birth (Preferable to requesting age) P4 Paid Jobs Number of paid positions and hours worked at each in the past week P6 Job Classification Employee, self-employed, student, unemployed, retired, not
employed, etc. P7 Driving License Whether or not a current drivers license is held P8 Non-mobility Indication of why no out-of-home activity was performed on a
survey day including work-at-home days P10 Education Level Highest level of education achieved P11 Handicap Types of mobility handicap, both temporary and permanent
Personal
P12 Race2 Defined as currently measured in the U.S. Census V3 Body Type E.g., car, van, RV, SUV, etc. V4 Year of Production V5 Ownership of
Vehicle Household/person, lease, institution
V6 Use of Vehicle Main user of vehicle
Vehicle
V7 Fuel used in vehicle Gasoline, diesel, LPG, etc. A1 Start Time3 A2 Activity or Purpose
Activity
A3 Location Where the activity was performed, unless traveling
1 All surveys to use the U.S. Census Bureau definition of Race. 2 All surveys would use the US Census Bureau definition of Race. 3 Only start time needs to be ascertained in a time-use or activity survey, because, by definition, the start time of an activity is the end time of the previous activity. Only the last activity should need an end time. In a trip-based survey, start and end time should be included.

7
A4 Means of Travel If activity is travel, what mode(s) was used (including specifying if a car passenger or driver)
A5 Mode Sequence Unless collected as fully segmented data A6 Group Size Number of persons traveling with respondent as a group A7 Group Membership Number of persons in the group who live in respondent’s household A8 Costs Total amount spent on tolls, fares and respondent’s share
A9 Parking Amount spent to park
3.2 Standardization of Categories This item is concerned with establishing standards for the categories, used to describe the variables that evolved from minimum question specification. There appears to be considerable merit in setting standards for categories of those questions that are included in the minimum specifications, as well as also considering standard categories for some of the questions that are not specified within the minimum, but which may be included in many surveys. Probably, the most important of these are income, race, employment status, building/dwelling type, relationships among household members, modes of travel, mobility handicaps, education levels, and activities. Lack of standardization in these categories makes it extremely difficult to make comparisons between surveys and also may preclude some elements of transfer of models from one location to another, as a result of inconsistent categorisation. Furthermore, many of these variables are also supplemented from the Census, so that consistency with census definitions is also important. Across seven data sets examined, variables that described household income, type of dwelling, type of activity, means of travel, and employment status had conflicting and overlapping categories. The U.S. Bureau of the Census currently defines income in $2,500 steps from $0 through $100,000, and then defines a single group in excess of $100,000. In most personal travel surveys, it is not necessary to define income to this level of disaggregation. However, steps of $10,000 from $0 through $100,000 could be considered to represent a necessary minimum standard. This would allow comparability among personal transport surveys, as well as comparability to the Decennial Census and any other surveys that use the same income categories. Income, however, does pose additional problems that result from inflation and economic growth. This means that incomes in the group from $20,000 to $25,000 represent something different in 1995 than they do in 2001. The way in which this might be handled is addressed later in this paper. While comparing the seven data sets, the variable that described the building/dwelling type also posed significant problems. It was not known whether the definition of townhouse was the same across the data sets because in one data set townhouse was grouped with condominium, and in another data set townhouse was grouped with duplex and triplex type housing. The use of condominium is inappropriate, because it is not a housing type but rather a type of ownership. Clearly this demonstrates the need for a universal definition to be adopted. To devise standard categories, seven international statistical agencies’ definitions, for the specific variables, were looked at and compared with the seven data sets as well as two other survey definitions. The extensive list of proposed category standards is too lengthy to be given here. Standardisation of the activities to be included in designs that provide an activity list would also be useful and has been requested by some professionals involved in transport

8
surveys. The grouping of activities into common trip purpose-related categories is also an element of this aspect of standardisation.
3.3 Creation of ID Numbers Each completed survey requires an unique identification number. In addition, if data are retained on incomplete households, then all contacted households require an unique identification number. The primary issue with respect to identification numbers is that the numbers should permit ready retrieval of specific records, and should provide an unique identification for each unit in the survey. There is also the potential to provide some additional information through the identification number, such as the membership in a specific sampling category, thereby permitting easy checking of the sampling progress during the survey and ready identification for purposes of expansion and weighting after the survey is completed. In some CATI programs, a new ID number is assigned each time that a call attempt or reminder is made and some surveys assign ID numbers only to completed households and not to incomplete households. These procedures should be avoided in personal travel surveys. It would be helpful if all personal travel surveys used the same procedures for assigning identification numbers to survey units and information encoded into the ID number would be consistently done in all surveys. Consistency would allow standard processing software to be set up that would utilize the information in the ID number. There are two procedures that should ideally be used for creating ID numbers. The first is to create the ID number by starting with a number indicating the day of the week on which the diary was started (e.g., 1 for Monday, 2 for Tuesday, etc.). The second, third, fourth and fifth digits would consist of the date of recruitment of the household. Thus, a household recruited on March 15, 2002, with a diary day of Friday would have an ID number that would begin with 50315. The remainder of the number would be a sequential number that can optionally be sequenced through the entire survey or restarted on each day of the survey. In the former case, if the above household was the 1,537th household recruited since the beginning of the survey, and if the total number of households to be recruited exceeds 9,999, the household ID number would be 5031501537. In the latter case, if this household was the 38th household recruited on that day, and no day would have more than 150 households recruited, the ID number might be 50315038. The second procedure, where stratified samples are drawn, is to use the initial digits to indicate the stratum to which the household belongs, and the remainder of the number to be a sequential number assigned as each interview or contact is completed. Suppose a survey is undertaken in which households are stratified by county of residence, household size, and vehicle ownership. The household of the previous example is drawn from the county that is coded 3, is a 4-person household with 2 cars. The ID number could be either 34201537 or 342038. In surveys where different sources are used to generate the sample, a digit in the ID number may be used to indicate the source of the sampling unit, e.g., RDD or a bus intercept survey. Thus, in the previous example, if the household had been obtained through RDD, and this is coded as 1 for the first digit, the ID number would become 134201537 or 1342038. Similarly,

9
if the date-based ID number was adopted, then the ID number would be either 15031501537 or 150315038. On balance, we recommend adoption of the stratification-based ID number, and use of the date-based ID number only for surveys where sampling is performed by simple random sampling, or systematic sampling.
4. Survey Methodology
4.1 Mailing Materials Most surveys involve some activity of mailing materials to respondents, whether this is just an initial contact letter telling about the survey to be done, recruitment materials, or the full survey form. There is anecdotal evidence to suggest that the materials mailed to households, as well as materials for households to mail back, have an effect on response rates. However, this has not been proven statistically. Both the survey profession and the direct mail advertising industry are facing the problem of declining response rates. Although some survey practitioners maintain that the appearance of mailing materials is of considerable importance for households to take a survey seriously, this has not been statistically proven (Dillman, 2000). However, this is not the case in the direct mail advertising business, where industry publications and journals have devoted a fair amount of space to discussing the benefits of appearance (Graham, 2002; Selzer and Garrison, 2002; Cavusgil and Elvey-Kirk, 1998; Vriens et al., 1998). Figure 1 depicts the interrelationships between the motivating constructs to response behaviour and their operationalisation. These appear to be the basis for the following set of questions: • Does the mailing have eye appeal? Will the recipient take it seriously or will the recipient
discard it in the same way as cheap and poorly-presented junk mail? (envelope type, personalization)
• Does the mailing create the right impression with regard to content and origin of the enclosed content? (source, envelope type, postage)
• How is the material being mailed to the recipient? Are the materials being mailed out as bulk mail, or rather first class or express mail? (postage, envelope type)
• How easy is it for the recipient to respond? Does the package contain a prepaid return envelope? Does the survey participant have the opportunity to respond in any other form, e.g. faxback forms, web-interface or a toll-free number? (follow-up, postage)
Those listed above are all well described by Dillman (1978, 2000). For example, letterhead stationary is important because it is integrated with personalisation and this may evoke feelings of importance. It is also mentioned in the relevant literature as the phenomenon of reciprocity (Zmud, 2003; Kalfs and van Evert, 2003) and is believed to have a positive effect on response rates. Appearance of the mailing package should be not confused with marketing material: it should not be overly colourful, so as to be confused with “junk mail”. However, Dillman (2000) has suggested that unusual packaging will draw attention to the package, but states that the colour of the outer envelope should be white or off white. Postage stamps should be unique or commemorative (not bulk mail or pre-printed bulk-mail) because this reinforces personalisation and heightens the novelty motivator (Dillman, 1978; Cavusgil and Elvey-Kirk,

10
1998). This is also the case for stamped return envelopes and this is interrelated with the convenience motivator (Dillman, 2000; Cavusgil and Elvey-Kirk, 1998). The following guidelines with regard to format and appearance of mailing materials seem appropriate and would not generate significant additional cost. • Stamped return envelope, ideally with instructions on which materials need to be mailed
back; • Large white envelope, with the address printed directly onto the envelope, rather than
address labels; • Recognisable return address and indication of the contents of the envelope – at least the
survey name; • Postage stamps, especially commemorative stamps, rather than the use of a franking
machine or pre-printed bulk mail.
4.2 Caller ID Caller ID, Caller Line Identification, and Caller Display are different names for the service provided by many telephone companies to allow the customer to see the telephone number, and sometimes the directory listing, of the person calling. Call Blocking allows telephone customers automatically to block incoming telephone calls that do not permit the display of a telephone number. A recent industry survey estimated that 41 percent of all households in the United States subscribed to Caller ID (American Teleservices Association, 2002). According to this study, 57 percent of households between 18 and 24 years subscribed to Caller ID, and of those 25-34, 54 percent subscribed. Only 26 percent of those 65 or older subscribed.

11
Figure 1: Motivators of Mail Survey Response Behaviour and their Operationalisation Source: Cavusgil and Elvey-Kirk (1998)
One of the primary uses of Caller ID is for households to screen out unwanted telephone calls by simply ignoring calls that do not display a known number or identity of the caller. In one telephone company study, nearly 70 percent of the company’s Caller ID users reported that they considered the ability to screen calls the most important attribute of Caller ID, and 15 percent said they had not answered their phones based on information displayed on their Caller ID screen (Southwestern Bell Telephone, 1998). A more recent study (Tuckel and O’Neill, 2001) showed similar findings, with 33.2 percent of households reporting they were “frequent screeners.” It has been suggested that any impact call screening does have on response rates could be improved if the Caller ID were to display the name of the agency commissioning the survey, or even a name of state government, or other entity involved in funding or commissioning the survey. In a study by Link and Oldendick (1999) the authors concluded that their survey was helped, at least marginally, by being identified as either “university” or “state government.” However, in most cases, having the government/public agency’s name sponsoring the travel survey displayed under caller id would not be fruitful because most government agencies
Underlying Motivators of Mail Survey Response Behavior Operationalization
1. Net individual benefit
Appeal
Personalisation
Incentive
2. Societal Outcome Source
Promised Anonymity
3. Commitment
Prenotification
Cut-off Date Notification
Follow up
4. Novelty
Envelope Type
Cover Letter Form or postscript
Questionnaire (format, colour,
5. Convenience
Postage
Home versus work address
Identify the “Informed Population” 6. Expertise
Key Primary Motivator Secondary Motivator

12
cannot accommodate such re-routing for security and legal reasons. In addition, it is not a given that a specific Caller ID listing would consistently be displayed to all respondents. The listing displayed depends on the respondent’s service level and equipment (not all display names along with number) and the vagaries of the long-distance telephone routing system. Many telephone companies offer their customers a service referred to as “Privacy Manager” that gives customers the option of electronically blocking the receipt of calls that are either not from a list of approved telephone numbers, or do not provide a telephone number. Table 2 below shows the percentage of eligible telephone numbers that were placed in disposition category “Scope Undetermined” due to Privacy Manager devices and answering machines or voice mail in the six-month period from March through August, 2002. Table 2: Percentage of Unresolved Telephone Numbers Due to Privacy Manager and Answering Machines/Voice Mail
MARCH, 2002
APRIL, 2002
MAY, 2002
JUNE, 2002
JULY, 2002
AUGUST,
2002
SIX MONT
H TOTA
L
PERCENT OF
ELIGIBLE NUMBERS
Telephone Numbers Dialled 3,511 3,645 3,871 3,559 3,512 3,339 Eligible Numbers (Total Numbers Dialled minus Out-of-Scope Numbers)
2,778 2,834 3,006 2,953 2,622 2,450 16,643
Scope Undetermined Due To: Answering Machine 331 355 473 438 82 50 1,729 10.4% Privacy Manager 52 36 34 12 23 13 170 1.0%
Source: Bureau of Transportation Statistics, 2002. The percentage of telephone numbers that were categorized as “Scope Undetermined”, due to the use of Privacy Manager devices, was 1.0 percent in a six-month period. While we were unable to find data regarding the characteristics of households that use Privacy Manager devices, the distribution has to reflect those who purchase Caller ID, since Caller ID is a prerequisite for Privacy Manager. Thus the households that could not be reached in the BTS survey due to Privacy Manager were more likely to be disproportionately composed of younger persons. In light of the general decline in telephone survey response rates, it is incumbent upon legitimate survey researchers to provide any information that may encourage responses from the full range of households. We recommend that a Caller ID be provided by the entity conducting the telephone calls, whether a contracted survey firm, university, or government agency, because existing data indicate that providing any ID at all may assist response rates more than being unrecognized. However, after careful review, we have concluded that there are no standards that can be recommended regarding Caller ID listings.
4.3 Time of Day to Begin and End Reporting Surveys use various different times at which to start and end the time for a 24-hour (or longer) diary. The aim is usually to choose a time that is expected to interrupt relatively little travel, so that respondents will not be put in the awkward situation of trying to respond about travel that had started before the start time of the diary. A standard for the time of day to begin and end

13
reporting is more a convenience to make surveys clearly compatible and comparable, and probably has little overall effect on survey quality. However, some diaries fail to specify start and end times, or only a start time and not an end time, leading to problems as to the actual period of reporting. Ideally, start and end times should be selected so that there is little likelihood of beginning and ending in the middle of travel, or any other activity other than sleeping. Average hourly traffic volumes from highways and roads in North America, as well as in Great Britain and Australia suggest that the lowest volumes consistently occur between 3 a.m. and before 4 a.m. A review of recent data sets in the U.S. generally confirms that the optimal time to start a diary is between 2 a.m. and 4 a.m. Figure 2 and Figure 3 show the distribution of trip start and end times from six recent surveys. Table 3 provides a summary of the information for the hours from midnight to 4 a.m. From this it is clear that the hour from 2 a.m. to 3 a.m. has the lowest percentage of both trip starts and trip ends. Therefore, a start time between 2 a.m. and 3 a.m. will have the least chance of intercepting a trip in progress.
Trip Start Times For Merged Files (weighted)
0
0.5
1
1.5
2
2.5
3
3.5
trip time
perc
ent
Figure 2: Trip Start Times for Merged and Weighted Files Table 3: Percentages of Trips Starting and Ending in the Early Morning Hours
NYC Phoenix DFW OKI SEF SLC Merged Trip Times Star
t End Star
t End Star
t End Star
t End Star
t End Star
t End Star
t End
12:01-1:00am
0.5 0.6 0.2 0.2 0.5 0.7 0.2 0.1 0.4 0.3 0.3 0.4 0.3 0.4
1:01-2:00am
0.2 0.2 0.1 0.2 0.2 0.2 0.1 0.1 0.1 0.1 0.1 0.2 0.1 0.2
2:01-3:00am
0 0.1 0.1 0.1 0.1 0.2 0.3 0.1 0.1 0.1 0.03 0.1 0.1 0.1
3:01-4:00am
0.1 0.1 0.3 0.2 0.1 0.1 0.3 0.1 0.2 0.1 0.1 0.1 0.2 0.1
Total 0.8 1.0 0.7 0.7 0.9 1.2 0.9 0.4 0.8 0.6 0.5 0.8 0.7 0.8

14
Trip End Times For Merged Files (Weighted)
0
0.5
1
1.5
2
2.5
3
3.5
trip time
perc
ent
Figure 3: Trip End Times for Merged and Weighted Files
Start and end times for 24 hour diaries should be 03:00 a.m. to 02:59a.m. In the case of diaries that cover more than one day, end times are extended by 24 hours for each additional day.
4.4 Proxy Reporting Proxy reporting in a travel survey is the reporting of one person on behalf of another. Sometimes it is necessary to perform proxy reporting because the person in the household is too young to answer the questions themselves, individuals are temporarily incapacitated due to illness or injury, or they are permanently incapable of answering questions due to language difficulties or mental incapacity. However, beyond these cases, proxy reporting also occurs when participants feel little commitment to the survey or the survey is conducted in such a manner as to make individual participation less of a requirement than is desirable. This latter condition occurs, for example, when data are retrieved by telephone and the person answering the telephone is encouraged by other members of the household, or is forced by their absence or refusal to talk on the telephone, to provide the information required. Thus, while proxy reporting is unavoidable in some cases, it is also dependent on survey design and the method of survey execution. Proxy reporting is known to bias reported data (Greaves, 2000; Richardson, Ampt, and Meyburg, 1995, p. 49). Analysing data from the 1995 Nationwide Personal Transportation Survey (NPTS), Greaves (2000) (see Table 4) found that among persons over the age of 13 (children were not permitted to report their own travel in the survey), those that completed a diary and reported their own trips had, on average, trip rates that were 21 percent higher than those who completed a diary but had someone else report the data. Among those who did not complete a diary, self-reported trip rates were 63 percent higher than those using proxy reporting. However, of even greater significance was the fact that these differences were not consistent among the different trip purposes; in some cases proxy reporting produced higher trip rates than self reporting. For trip purposes involving regular trip activity such as work and

15
school trips, proxy reporting tended to overestimate the trip rate while the more spontaneous or discretionary trips such as non-home-based trips were severely underestimated. Thus, while proxy reporting displays a clear impact at the aggregate level, its impact is even larger at the disaggregate level. More proxy reporting is likely to lead to less accuracy in the data. Accuracy is an important component of data quality and, therefore, the incidence of proxy reporting can be used as a measure of data quality of the data set. To use this as a measure of data quality, the definition, measurement, and interpretation of proxy reporting must be standardised. That is, a common understanding of what proxy reporting is, how it is measured, and how the results are interpreted, must be formulated so that a consistent expression of this measure can be generated in each data set. Table 4: Proxy Reporting of Persons over 14 years of Age in NPTS 95
Who completed the diary? Self Other No one No diary Missing Total
Yes 8,497 4,022 3,178 1,873 38 17,608 Proxy interview? No 41,154 3,831 10,605 7,938 116 63,644
Total 49,651 7,853 13,783 9,811 154 81,252
The information necessary to define whether a report is a proxy report or not must be included in the data. Because there is relatively little incentive for a respondent to falsify information on, for example, a question on who prepared the information being reported, it would seem advantageous to include questions that allow identification of proxy reporting in all types of surveys. There is also a need to evaluate the levels of proxy reporting produced. That is, how are levels of proxy reporting to be interpreted in terms of data quality? Beside the necessary proxy reporting for children and those unable to participate in the survey at the time, the tolerable level of proxy reporting among other household members needs to be specified. Looking at the analysis of the NPTS data, it is clear that even a relatively moderate level of proxy reporting (22%) can induce large errors in certain trip purposes. At the same time, not all capable respondents are likely to participate. Diehard refusals are probably better handled using proxy information than spend a disproportionate amount of effort to convert the individual, or forego all information on the individual entirely.
In defining a proxy report, the first requirement is to determine whether the individual is someone who could provide their own information or not. Only those who potentially can report their own information should be included in defining the level of proxy reporting in the data. The second requirement is to establish whether the information reported was furnished by the respondent or not. That is, the criterion which distinguishes proxy reporting from self reporting is who prepared the information and not who reported it. If the data which is reported has been prepared, or recorded, by the subject, then it is self-reported irrespective of whether that person actually reports the information or not and irrespective of whether the information was prepared in advance, involved writing it down, or was generated spontaneously at the time of data collection. When it is not known who prepared or recorded the data transmitted, the case is omitted from the calculation of the level of proxy reporting in the data. Using the example of the NPTS 95 data shown in the table above, the number of proxy reports would be 4,022+3,178+1,873+3,831, or 12,904 out of the 81,098 cases for which the source of the

16
information is known. Thus, using the above definition, the level of proxy reporting in the NPTS 95 data is 15.9 percent (12,904/81,098). To interpret the values of proxy reporting, the ranges shown in Table 4 are suggested. These have been established subjectively considering the values obtained from the NPTS 95 data. It is suggested that the following ranges be adopted to provide a broad indication of the quality of the data as it is affected by proxy reporting:
Proxy reporting percentage 0 – 10% Good quality Proxy reporting percentage 10 – 20% Acceptable quality Proxy reporting percentage > 20% Poor quality
5. Coding of Survey Results
5.1 Missing Values, Use of Zero There is considerable variability in how missing data are recorded in transport surveys, and even variability within the same survey. There is no agreement among recent household surveys on what to use for flagging missing values, and other aspects of setting coded values for non-numeric data. It is not uncommon to find that codes are left blank if the response is missing. This is unfortunate when zero is a legitimate response, because it becomes impossible in most computer analyses to distinguish between a blank and a zero in a numeric field. In statistical packages, missing values can be declared and are replaced in internal data sets with the missing data code of the package. However, in ASCII data files that are usually the ones stored for archives and provided to other agencies and individuals, these missing data codes may vary from variable to variable within one survey. Several standards are recommended. These standards must be adopted together as a group, because adoption of some without others will actually increase ambiguities in the data.
1. No blanks standard – Blanks should never be a legitimate code, and all data fields must contain alphanumeric data.
2. Missing data standard – Missing data, whether as the result of a respondent refusal, an indication that the respondent does not know the answer, or a legitimate skip of the question, must receive a coded numeric value. These values should be to fill the available space with 9s for refusal. In the event that there is a legitimate value from filling the space with 9s, then the field width should be increased by one digit and filled with 9s for missing. For “don’t know” responses, the field should be filled with 9s, except for the units digit, which should be 8. For legitimate skips or non-applicability of a question, the same procedure should be followed, except that the last digit should be 7. Thus, for a question with a single digit response that is no greater than 6, the three missing values would be 7, 8, and 9. For a single-digit response that has legitimate responses of 7 or more, and for two-digit responses where values greater than 96 are not legitimate, the missing values would be 97, 98, and 99. For a question requiring a two-digit response, where a value greater than 96 is possible, or for a three-digit response where values greater than 996 are not legitimate, the missing values would be 997, 998, and 999.
3. Correspondence between numeric values and codes standard – In any question where a legitimate response could be zero, the code for that response will be the

17
number zero (0). This will normally apply to any question requesting a count of elements, where a count of zero is possible.
4. Coding the number of person trips reported – In all personal travel surveys that seek to ascertain trip-making behaviour of individuals, the person record must contain a count of the number of trips reported by the individual. In this variable, a count of 0 is to be used only to indicate the response that the person did not travel on the diary day. If no travel information was provided, then the value coded should be all 9s.
5. Coding binary variables – The principal binary variables in personal travel surveys are yes/no responses, and responses to gender. For questions to which the response is either “yes” or “no,” the response of “yes” is coded as 1 and the response of “no” is coded as 0 (zero). For response to the gender question, “male” is 1 and “female” is 2.
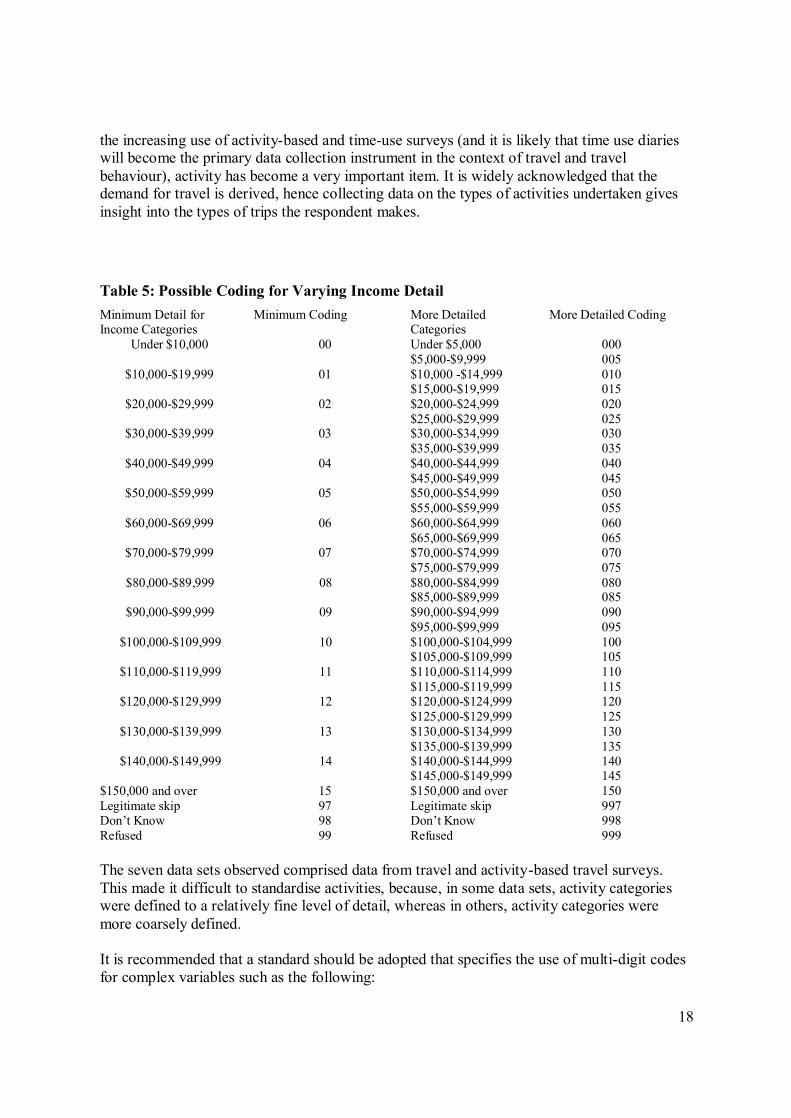
5.2 Coding Complex Variables This item is concerned with how to code the responses to certain types of questions that involve categories that may vary from survey to survey, depending on the level of detail required for a specific survey. Among the questions that fit within this item are income and activity. There are a number of complex variables, where it would be useful to adopt a standard for the values used to report the data. This would enhance comparability of surveys and remove potential ambiguities. It is also contingent on standardising response categories to certain questions. These proposed standards should be developed not only for any appropriate questions in the minimum question specifications, but also for additional questions that may be used in many travel surveys. Because the specification of standard categories may result in specifying a minimum set of categories, it is important to consider the impacts of this on coding. For example, suppose that a minimum standard is set that income should be coded in $10,000 steps up to $150,000, some agencies may elect to code income at a more detailed level. A possible way to handle this and the coding would be to set up the coding as shown in Table 5. Similar flexible codes could be devised for other cases. The value of this scheme is that aggregation of the detailed codes to the minimum coding is possible by just dropping the last digit of the code. In most statistical programs, this could be achieved by dividing the code by 10 and truncating the result to an integer. This appears to be a desirable way to handle setting minimum detail in categories and consistent coding of the categories into numeric codes. Table 5 explains how income should be categorized in order to overcome the problem of incomparability. Codes should be set up in such a way as to allow varying levels of aggregation, depending on the needs of any particular survey. In general, this can be done by setting up multi-digit codes, where appropriate, in which the first one or two digits represent the coarsest level of aggregation that would be used, the next digit provides greater disaggregation, and a further digit (if applicable) could provide even greater disaggregation. As shown in Table 5, it would also be possible, over time, to add further categories at the high end, indicating incomes in further $10,000 increments, while an additional digit can be used to provide disaggregation to as fine a level of detail as every $1,000. This would also help accommodate inflationary effects on income. As previously mentioned, activity is another complex variable item. Until now, most travel surveys did not adequately account for activities undertaken by the respondent. However, with
18
the increasing use of activity-based and time-use surveys (and it is likely that time use diaries will become the primary data collection instrument in the context of travel and travel behaviour), activity has become a very important item. It is widely acknowledged that the demand for travel is derived, hence collecting data on the types of activities undertaken gives insight into the types of trips the respondent makes.
Table 5: Possible Coding for Varying Income Detail Minimum Detail for Income Categories
Minimum Coding More Detailed Categories
More Detailed Coding
Under $5,000 000 Under $10,000 00 $5,000-$9,999 005 $10,000 -$14,999 010 $10,000-$19,999 01 $15,000-$19,999 015 $20,000-$24,999 020 $20,000-$29,999 02 $25,000-$29,999 025 $30,000-$34,999 030 $30,000-$39,999 03 $35,000-$39,999 035 $40,000-$44,999 040 $40,000-$49,999 04 $45,000-$49,999 045 $50,000-$54,999 050 $50,000-$59,999 05 $55,000-$59,999 055 $60,000-$64,999 060 $60,000-$69,999 06 $65,000-$69,999 065 $70,000-$74,999 070 $70,000-$79,999 07 $75,000-$79,999 075 $80,000-$84,999 080 $80,000-$89,999 08 $85,000-$89,999 085 $90,000-$94,999 090 $90,000-$99,999 09 $95,000-$99,999 095 $100,000-$104,999 100 $100,000-$109,999 10 $105,000-$109,999 105 $110,000-$114,999 110 $110,000-$119,999 11 $115,000-$119,999 115 $120,000-$124,999 120 $120,000-$129,999 12 $125,000-$129,999 125 $130,000-$134,999 130 $130,000-$139,999 13 $135,000-$139,999 135 $140,000-$144,999 140 $140,000-$149,999 14 $145,000-$149,999 145
$150,000 and over 15 $150,000 and over 150 Legitimate skip 97 Legitimate skip 997 Don’t Know 98 Don’t Know 998 Refused 99 Refused 999 The seven data sets observed comprised data from travel and activity-based travel surveys. This made it difficult to standardise activities, because, in some data sets, activity categories were defined to a relatively fine level of detail, whereas in others, activity categories were more coarsely defined. It is recommended that a standard should be adopted that specifies the use of multi-digit codes for complex variables such as the following:
19
1. Income 2. Activity 3. Relationship 4. Race 5. Disability 6. Employment status 7. Education level 8. Type of dwelling 9. Housing tenure 10. Vehicle manufacturer 11. Vehicle body type 12. Means of travel Details of these recommendations are again too lengthy for this paper but are included in the final report of the project.
5.3 Validation Statistics Validation is the process of verifying the accuracy of collected data by repeating the data collection process with a sample of households already surveyed. It is used primarily among interview-based surveys where its function is to determine whether the interviewer actually conducted the interview and whether the information obtained is accurate (Cambridge Systematics, 1996, p. 6-171). However, it can also be used in self-administered questionnaires in which case the validation survey then usually involves a face-to-face or telephone interview to check the quality and completeness of data (Richardson, Ampt, and Meyburg, 1995, p. 241). Validation surveys revolve around who was involved in the survey and often include a few questions to try to assess the accuracy of reported travel. They are always conducted by someone different to the one who conducted the survey initially and they should be conducted while the initial survey is in progress so that problems identified can be remedied before further harm is caused to the survey. The goal of validation surveys is to establish and maintain quality in travel surveys. Validation surveys achieve this by putting interviewers on notice that their work will be reviewed from time to time, and lapses in quality can then be remedied before they cause too much damage. Validation surveys are not to be confused with error checking that is usually conducted at the time of data collection. With CATI surveys, logic and consistency checks can be conducted on the fly. With other forms of data retrieval, checks are usually conducted soon after the information is recovered. Error checking is performed in virtually every travel survey while validation surveys are rarely conducted. From a random selection of nine recent studies, all conducted error checking but only one conducted a validation survey. Validation surveys are not popular because of the time and effort involved and the need to explain why it is necessary to interview each respondent again. However, the mere fact that interviewers know that validation surveys will be conducted is often enough to discourage them from being lax in the execution of the survey, or, in extreme cases, of falsifying information (Richardson, Ampt and Meyburg 1995, p. 248). A second advantage is that validation surveys provide data that can be used to assess the quality of the data. It is this aspect of validation surveys that is investigated in this section.

20
In order to use statistics from validation surveys to assess the quality of the survey, a common set of statistics must be selected and defined for use among all surveys, and the values the statistics attain must be interpretable by users as indicating good or poor quality of data. Questions that are often asked in a validation survey include whether the respondent completed the initial survey, whether a proxy provided the information in those cases where the respondent did not complete the survey, and some information regarding the trip activity of the respondent on the survey day. Also, it is not customary to repeat the questions verbatim from the earlier survey but, rather, to express them in different terms and not to ask for detail that the respondent has difficulty in recalling. Therefore, it is important that the actual respondent be involved in the validation survey and not a proxy whenever possible. The question should be phrased as if further information is being sought rather than that the purpose is to verify the integrity of the data gathered earlier. It is suggested that the following set of core questions be included in every validation survey conducted: 1. Did you complete the initial survey? (yes or no). If “yes”, go to question 3 below. If “no”,
go to the second question below. 2. Did someone else complete the survey for you with your acquiescence? (yes or no). If
“yes” go to question 3 below. If “no” terminate the validation survey. 3. Select a trip at random from the respondents reported trips and note the duration of the
activity at end of the selected trip (i.e. the time between time of arrival at the destination of the selected trip and the time of departure on the next trip). Ask the respondent to recall the trip in question and the time spent at the destination.
The first question answered in the affirmative identifies those respondents that reported their own information (i.e., “self-reporters”). Among those that are not “self-reporters”, the second question distinguishes between legitimate proxy reporting and information that was falsified by the interviewer. The falsified cases are set aside and not analysed further. The third question establishes a measure of the accuracy of the non-falsified data by comparing the duration of the activity at the end of the selected trip as reported in the initial interview with that reported in the validation survey. The deviation of the initial values about the reported values in the validation survey can be used as a measure of accuracy or reliability of the data. A convenient measure of the deviation of values from a set of reference values is given by the root-mean-square-error (RMSE). The percentage root-mean-square-error, as defined below, provides a dimensionless measure of the average “error” or deviation of the values of the same data item obtained on two separate occasions:
100.1%1
2
2
21∑=
−=
n
i i
ii
ttt
nRMSE
where, t1i = time duration of destination activity in first survey. t2i = time duration of destination activity in second (validation) survey.

21
n = number of self-reported and proxy-reported observations of duration of destination activity in validation survey.
The percent RMSE provides a value that can be compared among data sets and that can be set as a standard or a requirement in a travel survey. Interpretation of what is an acceptable value for this statistic must be made subjectively. In summary, it is recommended that the three questions above be asked during every validation survey and that the following statistics be derived from that data:
1. Proportion of falsified responses in the data. 2. Proportion of non-falsified responses that are proxy responses. 3. Percentage RMSE of non-falsified responses.
The tolerable limits that should be set on each of these statistics is a matter that must be decided by the agency commissioning each travel survey. Falsification of data by interviewers is likely to receive a low tolerance but anecdotal evidence suggests that it does exist and that under pressure to reach certain goals, interviewers will develop very innovative ways in which to introduce such data. Statistical analysis of reported data is often used to detect the lack of randomness, and particularly the change in the relationship among variables, that characterises falsified data (Richardson, Ampt, and Meyburg, 1995, p. 248-249). Often, validation surveys will be restricted to cases identified through such analysis.
5.4 Number of Missing Values The number of missing values in a data set is a measure of how much information was not collected. If expressed as a proportion of the total number of data items in the data set, it serves as a measure of the relative information content of the data. Thus, it could be used as a measure of data quality. It is important to define what a missing data item is and what it is not. Common coding practice is to distinguish between non-responses that are refusals, those where a respondent does not know the answer to the question, and those in which a response would not be applicable. Among these categories, only responses where a respondent either refuses or is unable to provide an answer are truly missing values. Responses that are found to be erroneous, either by being beyond reason, or inconsistent with other values, should also be counted as missing values. Thus, the number of missing values in a data set must be established after the data cleaning exercise, in which illogical and inconsistent data item values can be identified, but also where otherwise missing data item values can be filled with valid responses by re-contacting the respondent and getting new data. The need for standards arises from the fact that no common practice exists with respect to the definition of missing values and how they may be measured to give an overall assessment of missing information in a data set. Standardising these aspects of missing data measurement will allow setting of minimum standards that would be universally understood and would allow comparison among data sets using a common measure of assessment. It is recommended that missing values be defined as data items where respondents have either provided erroneous information or where they have failed to provide a response because they refuse to divulge the information or they are unable to provide an answer to the question

22
because they do not know the correct answer. Given this definition of missing values, it is further recommended that a missing value index be calculated which is the proportion of missing data items among all the data items in the data set. That is, the following missing data index is recommended:
=
=
=
=
∑∑
∑∑
==
==
applicable not is response a if 0n respondent to applicable is i variable to response a if 1
x
otherwise 0
missing is n respondent for i variable if 1 x
Index Value MissingMVIwhere
x
x
MVI
ni
ni
I
ini
N
n
I
ini
N
n
,
*,
1,
1
1
*,
1
,
6. Conclusion Clearly some sort of guidance needs to be given in relation to design phases of travel surveys, travel survey instrument design, conducting travel surveys and the coding of travel survey results. These issues may apply equally to surveys in general and the benefits of these standards far outweigh the costs involved in implementation. In this paper, fourteen items in travel surveys were described. Recommendations and standards for each item were listed along with justifications for the proposed standards. Standards will not only make travel survey results comparable, but will enable the collection of more useful data in terms of quality, by developing better survey instruments. Good survey design should lead to a reduction in the problematic number of non-responses, a burning issue in all fields of research. References American Teleservices Association, Consumer Research Study, May 2002. http://www.ataconnect.org/htdocs/facts/index..htm Bureau of Transportation Statistics, Omnibus Household Survey, Results, August 2002, July 2002, June 2002, May 2002, April 2002, March 2002. http://www.bts.gov/omnibus/household/2002/july/month_specific_information.pdf Cambridge Systematics (1996) “Travel Survey Manual.” U.S. Department of Transportation and U.S. Environmental Protection Agency 564 pp. Cavusgil, S.T., and L.A. Elvey-Kirk (1998), “Mail Survey Response Behavior; A Conceptualization of Motivating Factors and an Empirical Study”, European Journal of Marketing, Vol.32, No. 11/12, pp 1165-1192. Cochran, W.G., (1963), Sampling Techniques, John Wiley & Sons, New York.

23
Dillman, D.A. (1978), Mail and Telephone Surveys; the Total Design Method, New York: Wiley. Dillman, D.A. (1991), “The Design and Administration of Mail Surveys,” Annual Review of Sociology, 17, 225-249. Dillman, D.A.. (2000), “Mail and Internet Surveys; The Tailored Design Method”, Second Edition, John Wiley and Sons. Goldenberg, L., C. Stecher and K. Cervenka (1995), “Choosing a Household-Based Survey Method: Results of the Dallas-Fort Worth Pretest,” paper presented to Fifth National Conference on Transportation Planning Methods Applications, Seattle, Washington, April 17-21, 1995. Graham, J.R. (2002), “Improving Direct Mail”, Agency Sales, Vol. 32, Issue 1, pp 47-50. Greaves, S.P. (2000), Simulation Household Travel Survey Data for Metropolitan Areas, Unpublished Ph.D. Dissertation, Department of Civil and Environmental Engineering, Louisiana State University, Baton Rouge, Louisiana. Kalfs, N. and H. van Evert (2003), “Nonresponse in Travel Surveys”, in Stopher, P.R. and P.M. Jones, Transport Survey Quality and Innovation, Elsevier Press, pp. 567-586. Kish, L. (1967), Survey Sampling, John Wiley & Sons, New York. Link, M.W. and R.W. Oldendick (1999), “Call Screening: Is it Really a Problem for Survey Researchers?” Public Opinion Quarterly, Vol. 63:577-589. NPTS (2001), “Documentation for the 1990 NPTS Datasets,” Derived from the 1990 NPTS User's Guide for the Public Use Tape and the 1990 Public Use Tapes http://www-cta.ornl.gov/npts/1990/index.html Date of ref: Oct 30 2001. Pratt, J.H. (2003), “Survey Instrument Design” in Stopher, P.R. and P.M. Jones (eds) Transport Survey Quality and Innovation, Elsevier, Pergamon Press. Richardson, A.J. (2000), “Behavioural Mechanisms of Non-Response in Mailback Travel Surveys,” paper presented to the Transportation Research Board, 79th Annual Meeting, January 9-13; Washington, D.C. Richardson, A.J., E.S. Ampt and A.H. Meyburg, (1995). Survey Methods for Transport Planning. Eucalyptus Press, University of Melbourne, Parkville, Australia. Roads and Traffic Authority New South Wales (2000), Vehicle Information Form. Selzer, J.M., and Garrison, E.K.(2002), “Beyond Junk Mail”, Advisor Today, Vol. 97, Issue 8, p. 86.

24
Southwestern Bell Telephone, NewsCenter, 1998. http://www.swbell.com/About/NewsCenter/ShowRelease/0,1018,533,00.html?NID=1998 Stopher, P.R. (1992), “Use of an Activity-Based Diary to Collect Household Travel Data,” Transportation, Vol. 19, pp.159-176. Tooley, M. (1996), “Incentives and Rates of Return for Travel Surveys,” Transportation Research Record No.1551, pp. 67-73. Tuckel, P. and H. O’Neill (2001), “The Vanishing Respondent in Telephone Surveys,” Paper presented at the annual conference of the American Association for Public Opinion Research, May, Montreal, Canada. U.S. Bureau of the Census (1999), Appendix A. Definitions; http://www.census.gov/hhes/www/housing/ahs99/apendixa.pdf. Date of ref. Oct. 2002. U.S. Bureau of the Census (2001), Summary Tape File 3 Technical Documentation; http://www.census.gov/td/stf3/append_b.html. Date of ref. Oct. 2002. U.S. Bureau of the Census (2002), Current Population Survey (CPS)- Definitions and Explanations; http://www.census.gov/population/www/cps/cpsdef.html. Date of ref. Oct. 2002. U.S. Environmental Protection Agency (1995), Summary of the Environmental Justice Movement; http://es.epa.gov/program/iniative/justice/ej-ovrvw.html. Date of ref. Oct. 2002. Vriens, M., van der Scheer, H.R., Hoekstra, J.C., and Bult, J.R. (1998) “ Conjoint Experiments for Direct Mail Response Optimization”, European Journal of Marketing, Vol. 32, No.3/4, pp 323-339. Yates, F. (1965), Sampling Methods for Censuses and Surveys, Charles Griffin and Co. Ltd., London. Zmud, J. (2003), “Designing Instruments to Improve Response”, in Stopher, P.R. and P.M. Jones, Transport Survey Quality and Innovation, Elsevier Press, pp. 89-108.