outbreaks are driving new cases
TRANSCRIPT

OUTBREAKS ARE DRIVING NEW CASES• During the past week, 35 new outbreaks with 200 cases have been
identified.• This is a 169% increase in the number of reported outbreaks and a 96%
increase in outbreak-associated cases compared to last week.• Settings where outbreaks occurred:
• Camps• Child day cares• Religious services• Restaurants


White House Gating Criteria as of April 24
Region COVID-like Illness
Cases Hospitalizations
STATE Plateau Increasing Increasing
Region 1 (New Orleans) Plateau Increasing Plateau
Region 2 (Baton Rouge) Plateau Increasing Increasing
Region 3 (South Central) Plateau Decreasing Decreasing
Region 4 (Acadiana) Plateau Increasing Increasing
Region 5 (Southwest) Plateau Decreasing Decreasing
Region 6 (Central) Plateau Increasing Plateau
Region 7 (Shreveport/Bossier)
Plateau Increasing Increasing
Region 8 (Monroe) Increasing Increasing Increasing
Region 9 (Northshore) Plateau Increasing Decreasing
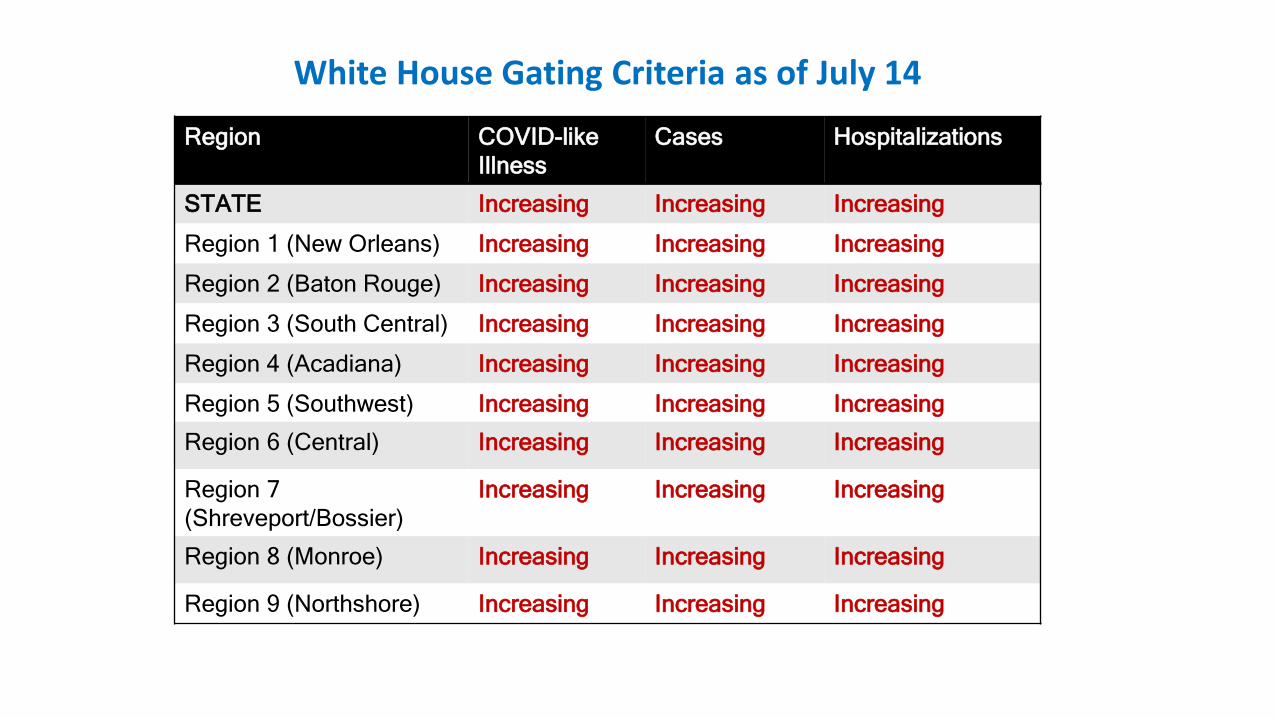
White House Gating Criteria as of July 14
Region COVID-like Illness
Cases Hospitalizations
STATE Increasing Increasing Increasing
Region 1 (New Orleans) Increasing Increasing Increasing
Region 2 (Baton Rouge) Increasing Increasing Increasing
Region 3 (South Central) Increasing Increasing Increasing
Region 4 (Acadiana) Increasing Increasing Increasing
Region 5 (Southwest) Increasing Increasing Increasing
Region 6 (Central) Increasing Increasing Increasing
Region 7 (Shreveport/Bossier)
Increasing Increasing Increasing
Region 8 (Monroe) Increasing Increasing Increasing
Region 9 (Northshore) Increasing Increasing Increasing


[placeholder for slide sharing death and/or stats – making the case that vast majority of cases/deaths have been among the unvaccinated]

0
100
200
300
400
500
600
700
800
900
3/31
/202
04/
7/20
204/
14/2
020
4/21
/202
04/
28/2
020
5/5/
2020
5/12
/202
05/
19/2
020
5/26
/202
06/
2/20
206/
9/20
206/
16/2
020
6/23
/202
06/
30/2
020
7/7/
2020
7/14
/202
07/
21/2
020
7/28
/202
08/
4/20
208/
11/2
020
8/18
/202
08/
25/2
020
9/1/
2020
9/8/
2020
9/15
/202
09/
22/2
020
9/29
/202
010
/6/2
020
10/1
3/20
2010
/20/
2020
10/2
7/20
2011
/3/2
020
11/1
0/20
2011
/17/
2020
11/2
4/20
2012
/1/2
020
12/8
/202
012
/15/
2020
12/2
2/20
2012
/29/
2020
1/5/
2021
1/12
/202
11/
19/2
021
1/26
/202
12/
2/20
212/
9/20
212/
16/2
021
2/23
/202
13/
2/20
213/
9/20
213/
16/2
021
3/23
/202
13/
30/2
021
4/6/
2021
4/13
/202
14/
20/2
021
4/27
/202
15/
4/20
215/
11/2
021
5/18
/202
15/
25/2
021
6/1/
2021
6/8/
2021
6/15
/202
16/
22/2
021
6/29
/202
17/
6/20
217/
13/2
021
Coun
t of R
epor
ted
Case
s/De
aths
Week-End Date
New Nursing Home Resident COVID-19 Cases by Week
First Vaccine Clinics Began
Second Vaccine Clinics Began
Third Vaccine Clinics Began

[placeholder for (3) pronged public health guidance graphic Gov office put together]

Shot at a million
• Placeholder