outcome measures in clinical trials for multiple sclerosis · depends on the aim of the study....
TRANSCRIPT

REVIEW ARTICLE
Outcome Measures in Clinical Trials for Multiple Sclerosis
Caspar E. P. van Munster1 • Bernard M. J. Uitdehaag1
Published online: 9 February 2017
� The Author(s) 2017. This article is published with open access at Springerlink.com
Abstract Due to the heterogeneous nature of the disease, it
is a challenge to capture disease activity of multiple scle-
rosis (MS) in a reliable and valid way. Therefore, it can be
difficult to assess the true efficacy of interventions in
clinical trials. In phase III trials in MS, the traditionally
used primary clinical outcome measures are the Expanded
Disability Status Scale and the relapse rate. Secondary
outcome measures in these trials are the number or volume
of T2 hyperintense lesions and gadolinium-enhancing T1
lesions on magnetic resonance imaging (MRI) of the brain.
These secondary outcome measures are often primary
outcome measures in phase II trials in MS. Despite several
limitations, the traditional clinical measures are still the
mainstay for assessing treatment efficacy. Newer and
potentially valuable outcome measures increasingly used
or explored in MS trials are, clinically, the MS Functional
Composite and patient-reported outcome measures, and on
MRI, brain atrophy and the formation of persisting black
holes. Several limitations of these measures have been
addressed and further improvements will probably be
proposed. Major improvements are the coverage of addi-
tional functional domains such as cognitive functioning
and assessment of the ability to carry out activities of daily
living. The development of multidimensional measures is
promising because these measures have the potential to
cover the full extent of MS activity and progression. In this
review, we provide an overview of the historical back-
ground and recent developments of outcome measures in
MS trials. We discuss the advantages and limitations of
various measures, including newer assessments such as
optical coherence tomography, biomarkers in body fluids
and the concept of ‘no evidence of disease activity’.
Key Points
Capturing disease activity in multiple sclerosis (MS)
trials is a challenge and traditional outcome
measures all have clear limitations.
Newer measures are being developed and
increasingly used in trials.
Multidimensional outcome measures are promising
because they have the potential to capture the full
extent of disease activity by assessing various
functional domains relevant for MS.
1 Background
Multiple sclerosis (MS) has a female predominance and
typically develops at young age with a peak incidence
between 20 and 40 years [1]. Clinically, it is characterized
by a large variability of symptoms arising from focal
inflammation of the central nervous system that may occur
at various points in time. Symptoms generally last for
several days to weeks, but occasionally persist for many
months, with subsequent full or partial recovery. These
periods are referred to as relapses. Radiologically, MS is
characterized by typical white matter lesions that are best
visualized with magnetic resonance imaging (MRI). The
& Caspar E. P. van Munster
1 Department of Neurology, Amsterdam Neuroscience, VUmc
MS Center Amsterdam, VU University Medical Center, De
Boelelaan 1117, 1081 Amsterdam, The Netherlands
CNS Drugs (2017) 31:217–236
DOI 10.1007/s40263-017-0412-5

occurrence of clinical relapses or new white matter lesions
on MRI is used to estimate disease activity.
Demonstrating dissemination in time and place, clinical or
radiological, is the core feature of the diagnostic criteria [2].
The occurrence of relapses is the dominant clinical
picture in the vast majority of patients during the earlier
disease stages and is defined as relapsing-remitting MS
(RRMS). If a patient only experienced a single episode
with clinical symptoms, it is referred to as a clinically
isolated syndrome (CIS). Relapses eventually subside and
the disease course often evolves to a slow worsening of
symptoms, leading to disability accrual (i.e. disease pro-
gression). When there is a disease progression independent
from relapses, this is referred to as secondary-progressive
MS (SPMS). Approximately 15% of patients have slowly
progressive disease from onset without evident relapses
and are categorized as primary-progressive MS
(PPMS).The first effective immunomodulatory treatments
were the injectables interferon-b and glatiramer acetate that
were introduced in the 1990s [3]. After a decade, the more
potent natalizumab (in 2004) and the first oral drug fin-
golimod (in 2010) were introduced. More recently
approved treatments include teriflunomide, dimethylfu-
murate, alemtuzumab and daclizumab. Ocrelizumab and
cladribine are expected to be approved in the near future. In
the phase III trials of these treatments, the outcome mea-
sures used to evaluate efficacy were relapse rate, disability
worsening and MRI [formation of new T2 hyperintense
lesions [T2HL] or gadolinium-enhancing T1 lesions
(GdT1L)]. These measures have been generally accepted as
measures of (short-term) treatment effects.
Clearly, treatment options in MS are rapidly expanding
and are applied in patients with different clinical pheno-
types. It is therefore important to have clear, comprehen-
sive and universally accepted outcome measures. For this
purpose, an outcome measure has to be valid, reliable and
responsive. In practical terms this means it must measure
what it intends to measure, it should be free of measure-
ment errors and able to detect true change of performance
(due to disease activity or progression) [4]. Furthermore, it
needs to capture clinically relevant changes and ideally has
predictive value.
Unfortunately, standardized definitions of outcome
measures in MS research are lacking, for which there are
several explanations. First, the clinical disease expression
and course are highly variable, which hampers defining a
uniform concept of disability in MS [5–7]. There is wide
variation between patients concerning relapse frequency
(including seasonal variation [8]) and accrual of (relapse-
related) disability. Also, patients may present with virtually
all neurological symptoms that exhibit an age-dependent
distribution (Table 1) [7]. Moreover, the extent to which
symptoms contribute to overall disability is variable. This
may be more dependent on the location of the lesion than
on the size or activity. For example, a severe persisting
hemiparesis may have a greater impact on disability than a
mild sensory deficit, while both may result from patho-
logically comparable lesions. In fact, lesions may occur
subclinically without causing disability worsening [9].
Another difficulty is that disability often accumulates
slowly. Consequently, long-term follow-up is needed to
assess treatment effect, which makes trials time-consuming
and expensive. Lastly, disability is influenced by con-
founding factors that may not be directly related to disease
activity (e.g. fatigue, mood disturbances, deconditioning,
spasticity and side effects of medication) [10].
With all these difficulties in mind, we aim to provide a
non-systematical comprehensive overview of clinical and
paraclinical outcome measures that are used in clinical
research of MS (summarized in Table 2). We elaborate on
traditional and newer measures such as brain atrophy,
optical coherence tomography (OCT), biomarkers in body
fluids and the concept of ‘no evidence of disease activity’
(NEDA). We highlight the most important advantages,
limitations and caveats of these measures.
2 Clinical Outcome Measures
Outcome measures can be generic or disease-specific,
physician- or patient-based, direct or indirect, and may
cover all or specific aspects of MS. Various clinical out-
come measures are available, assessing different disease
characteristics. Which characteristics are important largely
Table 1 Distribution of patients (%) by presenting clinical symptoms and age of onset [7]
Age at onset of
MS (years)
Optic
neuritis
Diplopia
or vertigo
Acute motor
symptoms
Insidious motor
symptoms
Balance or
limb ataxia
Sensory
symptoms
\20 23 18 6 4 14 46
20–29 23 12 7 6 11 52
30–39 13 11 7 14 15 44
40–49 9 17 3 31 13 33
C50 6 13 4 47 11 32
MS multiple sclerosis
218 C. E. P. van Munster, B. M. J. Uitdehaag

depends on the aim of the study. Here, we first describe the
traditional measures Expanded Disability Status Scale
(EDSS) and relapses. Subsequently, the more recently
developed Multiple Sclerosis Functional Composite
(MSFC) will be discussed. Finally, we elaborate on patient-
reported outcome measures (PROMs) as these patient-
based measures are increasingly being used in MS trials.
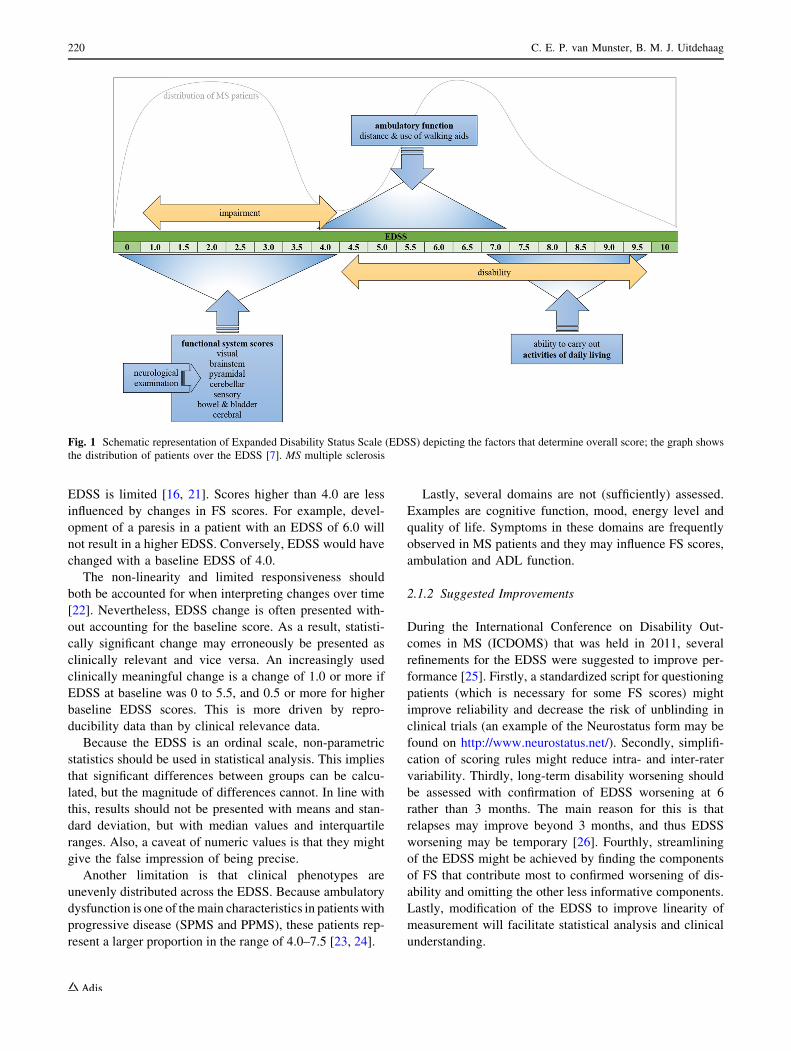
2.1 The Expanded Disability Status Scale
The EDSS intends to capture disability of MS patients based
on neurological examination by describing symptoms and
signs in eight functional systems (FS). Furthermore, it
encompasses ambulatory function and the ability to carry out
activities of daily living (ADL). An overall score can be
given on an ordinal scale ranging from 0 (normal neuro-
logical examination) to 10 (death due to MS). Scores from 0
to 4.0 are determined by FS scores, which means that in this
range the EDSS is essentially a measure of impairment.
Scores from 4.0 higher basically address disability. Ambu-
latory function and the use of walking aids heavily determine
the range of 4.0–7.0, and scores between 7.0 and 9.5 are
largely determined by the ability to carry out ADL. A
schematic representation of the EDSS is given in Fig. 1.
In clinical trials of MS, the EDSS is the most widely
used outcome measure to determine disability worsening
and define relapse-related change in neurological function.
Furthermore, it is used as an inclusion criterion and to
characterize study populations. The value of the EDSS as a
surrogate outcome measure for future disability is limited
[11–15].
2.1.1 Limitations and Caveats
Despite general acceptance of the EDSS, there are many
limitations and caveats (summarized in Table 3) [16]. First
of all, EDSS holds high intra- and inter-rater variability
[10, 11, 17–19]. This can be explained by the subjective
nature of the neurological examination itself on which the
EDSS is largely based, particularly in the lower EDSS
range. Also, complex and ambiguous scoring rules for the
FS probably explain some of the variability.
Non-linearity of the EDSS is another limitation (visu-
alized in Fig. 1). The staying time in the middle scores is
shortest and this results in a bimodal distribution with
peaks at 1.0–3.0 and 6.0–7.0 [7, 20]. It means that the rate
of progression as assessed by the EDSS varies depending
on baseline score. Furthermore, responsiveness of the
Table 2 Primary, secondary and exploratory outcome measures in phase III trials for MS
Primary outcome measures
Clinical Expanded Disability Status Scale (EDSS): 3 or 6 months confirmed disability worsening or improvement
Relapses: annualized relapse rate, time to second relapse (conversion to clinically definite MS)
Secondary outcome measures
Clinical MS Functional Composite (MSFC): timed 25-foot walk test, nine-hole peg test, paced auditory serial addition task
or symbol digit modalities test
Paraclinical T2-hyperintense lesions
Gadolinium-enhancing T1 lesions
Whole brain atrophy
Exploratory outcome measures
Clinical As candidate component of MSFC: low-contrast letter acuity test
Patient-reported outcome measures: e.g. quality of life, depression and anxiety, fatigue, specific functional domains
Paraclinical—imaging Volumetric measures of specific structures (e.g. thalamus, upper cervical cord area)
Persisting black holes
Functional MRI for analysis of functional connectivity
Diffusion tensor imaging to examine brain tissue integrity
Magnetization transfer ratio MRI as a marker for brain myelin content
Optical coherence tomography
Paraclinical—biomarkers Biomarkers in body fluids: in CSF or blood
Composite No evidence of disease activity (NEDA): typically covering (confirmed) EDSS progression, relapse rate and
formation of MRI lesions; whole brain volume increasingly included (i.e. ‘NEDA-4’)
Electronic devices Assess MS system, Glove analyzer, accelerometers, etc.
CSF cerebrospinal fluid, MRI magnetic resonance imaging, MS multiple sclerosis
Outcome Measures in MS Clinical Trials 219
EDSS is limited [16, 21]. Scores higher than 4.0 are less
influenced by changes in FS scores. For example, devel-
opment of a paresis in a patient with an EDSS of 6.0 will
not result in a higher EDSS. Conversely, EDSS would have
changed with a baseline EDSS of 4.0.
The non-linearity and limited responsiveness should
both be accounted for when interpreting changes over time
[22]. Nevertheless, EDSS change is often presented with-
out accounting for the baseline score. As a result, statisti-
cally significant change may erroneously be presented as
clinically relevant and vice versa. An increasingly used
clinically meaningful change is a change of 1.0 or more if
EDSS at baseline was 0 to 5.5, and 0.5 or more for higher
baseline EDSS scores. This is more driven by repro-
ducibility data than by clinical relevance data.
Because the EDSS is an ordinal scale, non-parametric
statistics should be used in statistical analysis. This implies
that significant differences between groups can be calcu-
lated, but the magnitude of differences cannot. In line with
this, results should not be presented with means and stan-
dard deviation, but with median values and interquartile
ranges. Also, a caveat of numeric values is that they might
give the false impression of being precise.
Another limitation is that clinical phenotypes are
unevenly distributed across the EDSS. Because ambulatory
dysfunction is one of themain characteristics in patients with
progressive disease (SPMS and PPMS), these patients rep-
resent a larger proportion in the range of 4.0–7.5 [23, 24].
Lastly, several domains are not (sufficiently) assessed.
Examples are cognitive function, mood, energy level and
quality of life. Symptoms in these domains are frequently
observed in MS patients and they may influence FS scores,
ambulation and ADL function.
2.1.2 Suggested Improvements
During the International Conference on Disability Out-
comes in MS (ICDOMS) that was held in 2011, several
refinements for the EDSS were suggested to improve per-
formance [25]. Firstly, a standardized script for questioning
patients (which is necessary for some FS scores) might
improve reliability and decrease the risk of unblinding in
clinical trials (an example of the Neurostatus form may be
found on http://www.neurostatus.net/). Secondly, simplifi-
cation of scoring rules might reduce intra- and inter-rater
variability. Thirdly, long-term disability worsening should
be assessed with confirmation of EDSS worsening at 6
rather than 3 months. The main reason for this is that
relapses may improve beyond 3 months, and thus EDSS
worsening may be temporary [26]. Fourthly, streamlining
of the EDSS might be achieved by finding the components
of FS that contribute most to confirmed worsening of dis-
ability and omitting the other less informative components.
Lastly, modification of the EDSS to improve linearity of
measurement will facilitate statistical analysis and clinical
understanding.
Fig. 1 Schematic representation of Expanded Disability Status Scale (EDSS) depicting the factors that determine overall score; the graph shows
the distribution of patients over the EDSS [7]. MS multiple sclerosis
220 C. E. P. van Munster, B. M. J. Uitdehaag

Whatever its limitations, the EDSS will probably con-
tinue to be the main disability measure for the near future
because of the vast experience with it and the possibility of
making historical comparisons. Until we have better
alternatives, clinical assessment can be improved by using
the EDSS in conjunction with other measures.
2.2 Relapses
The other traditional outcome measure is assessment of
relapses. By consensus, a relapse has been defined as new
or worsening neurological symptoms that are objectified on
neurological examination in the absence of fever and last
for more than 24 h, and have been preceded by a period of
clinical stability of at least 30 days, with no other expla-
nation than MS [27, 28].
The relationship between number of relapses and dis-
ability worsening is not completely clear, although con-
clusions may be drawn from natural history studies.
Various of these studies showed that relapses early in the
course of MS were associated with long-term disability and
increased risk of conversion to SPMS, which probably
Table 3 Limitations, caveats and improvements for clinical outcome measures
Limitations and caveats Improvements
Expanded Disability Status Scale (EDSS)
High intra- and inter-observer variability
Non-linearity (bimodal distribution)
Limited responsiveness
Necessity to use non-parametric statistics (ordinal scale)
Uneven distribution of relapsing–remitting and progressive patients
Several functional domains not assessed
Accounting for baseline score when determining change (e.g. change
C1.0 with baseline score 0–5.5, and C0.5 for higher baseline scores)
Determining disability worsening with confirmation of the EDSS
progression after at least 6 months
Using standardized scripts for questioning patients (improving
reliability and decreasing risk of unblinding)
Simplification of scoring rules (decreasing variability)
Streamlining by stripping components of the functional systems that
are less informative
Modification to improve linearity and facilitate statistical analysis
Relapses
Strong subjectivity
Recovery of signs or symptoms before confirmation of relapse
Recall bias of patient and observer bias of examiner
Newly reported symptoms not always clearly depicted in change of the
EDSS
Identification largely depends on patient reporting it
Higher relapse rate prior to inclusion: over-reporting to fulfil inclusion
criteria, high relapse rate inclusion criterion leading to decrease of
relapse rate because of regression to the mean, placebo effect,
decrease of relapse due to natural course of MS
Confirming a relapse by another examiner
Increasing number of visits to identify more relapses
Multiple Sclerosis Functional Composite (MSFC)
Moderate reliability, sensitivity and responsiveness of the PASAT
The PASAT often disliked by patients, requirement of mathematical
ability and ceiling effect
Several important functional domains are not assessed
Lack of a clear dimension of the overall score (resulting in difficult
interpretability)
Z scores are influenced by results of the reference population and
obscure the meaning of crude scores
Replacing the PASAT with the symbol digit modalities test
Adding the low-contrast letter acuity test (covering visual domain)
Adding other functional domains
Determining minimal clinically relevant changes of the Z scores and
confirming change after 6 months
Determining clinical relevance
Keeping elements separated instead of combining them into a single
score
Patient-reported outcome measures (PROM)
Unblinded nature
Potential expectance bias
Assessment of quality of life may be influenced by multiple factors
Possible response shift over time
Weighing of individual questions appropriately
Using (computer) adaptive testing to reduce test length and improve
tolerability
MS multiple sclerosis, PASAT paced auditory serial addition task
Outcome Measures in MS Clinical Trials 221

relates to faster disability worsening [29–32]. However,
superimposed relapses in the progressive phase did not lead
to faster disability worsening [33].
Treatment effects on relapses are confined to the change
in annualized relapse rate or time to second relapse (i.e.
conversion to clinically definite MS) [34]. Treatment effect
on relapses gives a fair reflection of short-term efficacy.
2.2.1 Limitations and Caveats
There are several caveats when using relapses as an out-
come measure (summarized in Table 3). First of all,
identification of a relapse is subjective. Ensuring perfect
blinding for treatment is therefore essential. To limit sub-
jectivity, a second assessment can be performed to objec-
tify the relapse. The problem with this approach is that
symptoms or signs may already have recovered, and recall
bias of the patient and observer bias from the examiner
may influence the second assessment [35].
Another caveat is that identification of a relapse largely
depends on a patient reporting new symptoms. When a
patient only reports new symptoms on scheduled visits and
not spontaneously, the established relapse rate will be
lower than in reality. In fact, increasing the number of
visits in a trial period may increase the relapse rate [36].
An interesting phenomenon is that relapse rate is often
remarkably high prior to inclusion into trials. Various
explanations may be given for this [37, 38]. First of all,
relapses in the preceding period of a trial are usually
determined retrospectively and patients may over-report
the exact number to qualify for inclusion. Secondly, the
inclusion criterion of relapse rate is often high, meaning
that only patients with very active disease are included. As
a consequence, it can be expected that the relapse rate of
these patients will decrease towards a disease average
during the trial (i.e. regression to the mean). Thirdly,
patients participating in a trial may do better merely
because of a placebo effect or better comprehensive care
during the trial. Lastly, during the natural course of MS the
relapse rate will eventually decrease, independent of
treatment [39]. These factors may obscure the interpreta-
tion of absolute relapse rate reduction in treatment trials.
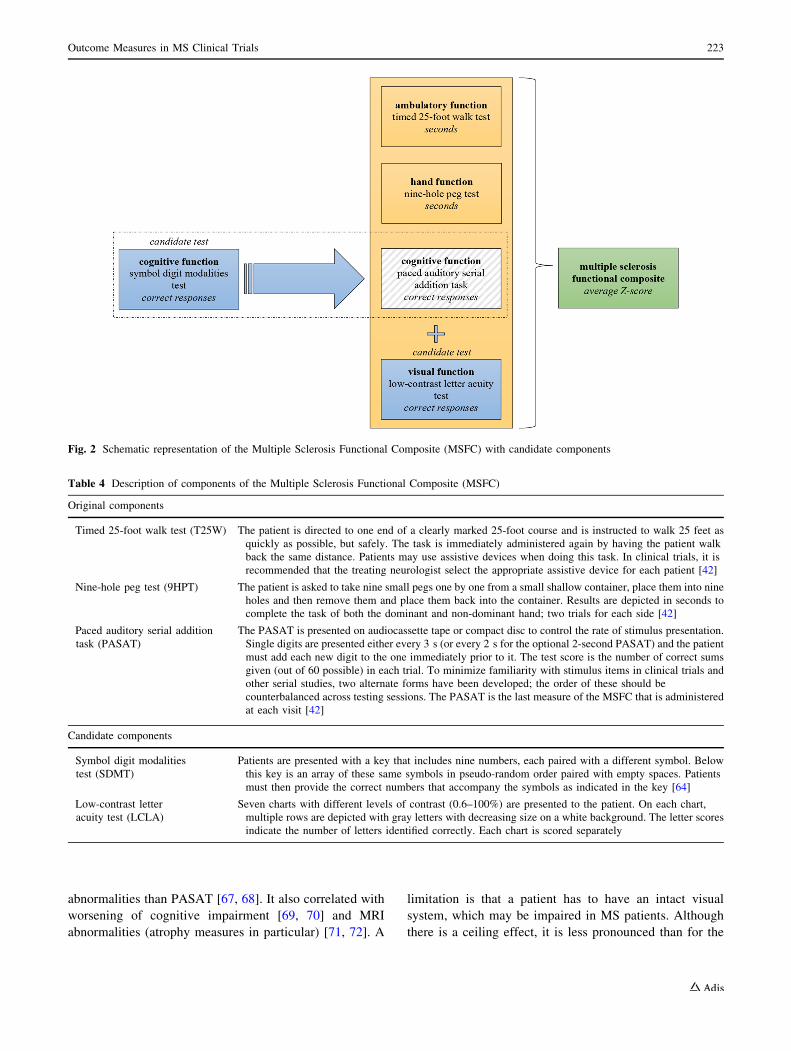
2.3 The Multiple Sclerosis Functional Composite
Because of the limitations of the EDSS and assessment of
relapses, the MSFC was developed to improve clinical
assessment [40, 41]. It was introduced in the early 1990s, a
time when the first effective treatments were introduced. In
contrast with the EDSS, the MSFC covers three functional
domains: ambulatory, hand and cognitive function (a
schematic summary is given in Fig. 2). The results of the
tests that assess these domains are depicted in an interval
scale (seconds or number of correct responses) and can be
converted to a Z score that is based on values of a reference
population [42]. An overall score can be calculated by
averaging the Z score of the subtests.
The MSFC has been extensively evaluated. The overall
score of MSFC correlated strongly with EDSS [43] and
subtest scores did moderately [40]. Also, change of MSFC
correlated with EDSS change and relapse rate [40, 44, 45].
Furthermore, it was predictive of conversion from RRMS
to SPMS [44]. Concerning the relation with MRI abnor-
malities, MSFC correlated with white matter lesion load
and various atrophy measures [46–48]. Lastly, correlations
with several PROMs [43, 49–51], employment status [52]
and driving performance [53] were found.
2.3.1 The Original Components
Ambulatory function is tested with the timed 25-foot walk
test (T25W, explained in Table 4). The T25W is a reliable
test for patients with more severe gait impairment, because
it primarily assesses walking speed. Assessing walking
speed seems clinically relevant, because it relates to the
capacity to perform outdoor activities important in daily
life [54]. For patients with mild gait impairment, the T25W
may not be sensitive enough to detect abnormalities and
because of that has a floor/ceiling effect [55]. For these
patients, it may be more appropriate to assess walking
endurance with longer walking distances; for example,
with a 6-minute walking test [56].
Hand function is tested with the nine-hole peg test
(9HPT, explained in Table 4). A change of 9HPT corre-
lated with long-term disability [57].
The paced auditory serial addition task (PASAT,
explained in Table 4) was originally included to cover the
cognitive domain [58]. It measures processing speed and
working memory, both of which are frequently affected
functions in MS patients [59]. The test has moderate reli-
ability and sensitivity for detection of cognitive impair-
ment, and has limited responsiveness to change [60].
Furthermore, it requires a certain mathematical ability and
has a clear ceiling effect [49, 61]. Finally, it is often dis-
liked by patients because the time limit induces stress.
2.3.2 Candidate Components
A candidate cognitive test that may replace the criticized
PASAT is the symbol digit modalities test (SDMT,
explained in Table 4) [62, 63]. It measures information
processing speed. The advantages of the SDMT are that it
is easily administered, better tolerated by patients (proba-
bly because there is no time pressure) [64] and more robust
and reliable than the PASAT [65, 66]. Moreover, the
SDMT correlated more strongly with white matter
222 C. E. P. van Munster, B. M. J. Uitdehaag
abnormalities than PASAT [67, 68]. It also correlated with
worsening of cognitive impairment [69, 70] and MRI
abnormalities (atrophy measures in particular) [71, 72]. A
limitation is that a patient has to have an intact visual
system, which may be impaired in MS patients. Although
there is a ceiling effect, it is less pronounced than for the
Fig. 2 Schematic representation of the Multiple Sclerosis Functional Composite (MSFC) with candidate components
Table 4 Description of components of the Multiple Sclerosis Functional Composite (MSFC)
Original components
Timed 25-foot walk test (T25W) The patient is directed to one end of a clearly marked 25-foot course and is instructed to walk 25 feet as
quickly as possible, but safely. The task is immediately administered again by having the patient walk
back the same distance. Patients may use assistive devices when doing this task. In clinical trials, it is
recommended that the treating neurologist select the appropriate assistive device for each patient [42]
Nine-hole peg test (9HPT) The patient is asked to take nine small pegs one by one from a small shallow container, place them into nine
holes and then remove them and place them back into the container. Results are depicted in seconds to
complete the task of both the dominant and non-dominant hand; two trials for each side [42]
Paced auditory serial addition
task (PASAT)
The PASAT is presented on audiocassette tape or compact disc to control the rate of stimulus presentation.
Single digits are presented either every 3 s (or every 2 s for the optional 2-second PASAT) and the patient
must add each new digit to the one immediately prior to it. The test score is the number of correct sums
given (out of 60 possible) in each trial. To minimize familiarity with stimulus items in clinical trials and
other serial studies, two alternate forms have been developed; the order of these should be
counterbalanced across testing sessions. The PASAT is the last measure of the MSFC that is administered
at each visit [42]
Candidate components
Symbol digit modalities
test (SDMT)
Patients are presented with a key that includes nine numbers, each paired with a different symbol. Below
this key is an array of these same symbols in pseudo-random order paired with empty spaces. Patients
must then provide the correct numbers that accompany the symbols as indicated in the key [64]
Low-contrast letter
acuity test (LCLA)
Seven charts with different levels of contrast (0.6–100%) are presented to the patient. On each chart,
multiple rows are depicted with gray letters with decreasing size on a white background. The letter scores
indicate the number of letters identified correctly. Each chart is scored separately
Outcome Measures in MS Clinical Trials 223
PASAT. All points considered, the SDMT is probably a
good replacement for the PASAT.
When the MSFC was developed, no data on suit-
able tests to assess visual function were available. In the
past decade, various visual outcome measures for MS
research have been studied [73]. Of these, the low-contrast
letter acuity test (LCLA, explained in Table 4) may be a
good candidate to add to the MSFC [74]. Results correlated
with clinical phenotypes, MRI abnormalities and PROMs
for visual impairment and quality of life (which supports
clinical relevance) [75, 76]. Moreover, some clinical trials
showed treatment effect on the LCLA in the active group
compared with placebo [77].
2.3.3 Limitations and Caveats
There are several limitation and caveats of the MSFC
(summarized in Table 3). A frequently postulated objection
to the MSFC is that the overall score lacks a clear
dimension, which hinders interpretability and therefore
appears to be difficult for the interpreter to get familiar
with the score. In other words, it is difficult to form a
‘mental picture’ of it [78]. This difficulty may be addressed
by keeping the elements of the MSFC score separated
instead of combining them into a single score. Nonetheless,
comparison of subtest results between studies remains
impossible due to the Z scores that obscure the meaning of
crude scores.
Another problem is that results from the reference group
strongly influence the Z scores of patients [79]. With that,
assessing changes in time is problematic, because the
overall score is influenced by variability between time
points of both the reference and patient group. Conse-
quently, it is impossible to determine if change is a result of
statistical variance or true progression of disability [38].
A potential solution to some of the statistical caveats of
Z scores might be to determine the minimal clinically
relevant change [21, 80]. This means that change should be
confirmed on a subsequent time point, preferably at 6
months (because of possible disability improvement after a
relapse). This approach has been tested in a clinical trial
dataset [45]. Sensitivity of worsening was found to be
similar between MSFC and EDSS, and it correlated with
other clinical and MRI outcome measures. However, the
downside of this approach is that it will hamper sensitivity
to change, which is of particular importance in patients
with severe disability.
Despite its disadvantages, the MSFC is an appealing
alternative for the EDSS. It can be performed within 20
minutes, covers three domains, has good intra- and inter-
rater reliability and it results in a score on a continuous
scale. The MSFC has been used as the primary outcome in
a treatment trial in SPMS [49]. While MSFC progression
was slowed, treatment effects were not observed with the
EDSS. If the components are applied in a sensible way, the
MSFC may be used as the primary endpoint in future
clinical trials.
2.4 Patient-Reported Outcome Measures
A PROM is defined as ‘‘any report of a patient’s health
condition that comes directly from the patient, without
interpretation of the patient’s response by a clinician or
anyone else’’ [81].
A PROM may provide valuable insight into the patient
perspective of a treatment or matter of interest. For
example, treatment success for a patient might be more
influenced by adverse events than a physician perceives or
deduces from other outcome measures. Furthermore, it
may detect clinically meaningful changes and leave out
changes with no clinical relevance. A PROM can assess
perceived efficacy, side effects, depression and anxiety,
fatigue, mobility, quality of life, ability to carry out ADL,
sexual dysfunction and symptoms specific for MS. A list of
PROMs that are being used in MS research is presented in
Table 5 [82–105].
PROMs that assess the ability to carry out ADL may be
of particular value. They are able to demonstrate clinical
relevance of MS-specific outcome measures. For example,
one study found a correlation between the EDSS and a
42-item ADL scale that was mostly driven by impairment
of mobility [106]. Another advantage is that measuring
ADL activity allows comparison between studies of MS as
well as other diseases. Currently, no MS-specific ADL
measures are available. Nevertheless, PROMs that were
developed for stroke patients (Ranking scale [107, 108] and
Bartel index [109]) were used in some MS trials [110, 111].
There are several limitations of PROMs (summarized in
Table 3). Among these are their unblinded nature and
potential expectance bias. Also, questionnaires assessing
quality of life are prone to being influenced by more than
just disability. Other factors that are commonly seen in MS
patients contribute as well (e.g. fatigue, depression, anxiety
and physical comorbidities) [112]. Also, the individual
questions should be weighted appropriately. Summing up
all the subscores assumes equal importance which is gen-
erally not the case. Lastly, PROMs are prone to response
shift over time [113]. Response shift occurs when a patient
answers an item differently from their previous responses
due to a change of internal standards, values or conceptu-
alization of the purposed domain (e.g. quality of life).
Typically, PROMs are fixed in length and all patients
have to fill in the complete questionnaire. The number of
questions that have to be answered can be reduced with
computer adaptive testing [114]. It leads the patient
through an iterative process in which the answer to a
224 C. E. P. van Munster, B. M. J. Uitdehaag

question determines what question is presented next. For
example, if a patient is fully dependent on a wheelchair, a
question about climbing stairs is irrelevant. With these
methods, patients’ tolerability for a questionnaire may be
improved.
3 Paraclinical Outcome Measures
Numerous paraclinical outcome measures are available and
could be used as adjunct to clinical measures to obtain
information on treatment efficacy. Some are potentially
valuable (e.g. cerebrospinal fluid [CSF], visual evoked
potentials) while others are less suitable (e.g. brainstem
auditory evoked potentials) [115]. Here, we shortly discuss
the value of white matter pathology as detected on MRI.
Subsequently, we will elaborate on newer outcome mea-
sures, such as brain atrophy, persisting black holes (PBH),
OCT and biomarkers in body fluids.
3.1 Magnetic Resonance Imaging
3.1.1 White Matter Pathology
MRI is sensitive to detect, characterize and quantify lesions
in the white matter. It plays a fundamental role in the
McDonald diagnostic criteria for MS to demonstrate dis-
semination in time and space in addition to clinical signs
[2]. Radiological dissemination in space is defined as
having at least one lesion in at least two typical (for MS)
areas in the central nervous system. Dissemination in time
is determined when at least one new lesion is demonstrated
on a follow-up MRI, or if one asymptomatic gadolinium-
enhancing and one non-enhancing lesion are demonstrated
on the initial MRI.
The MAGNIMS workgroup recently proposed a revi-
sion of these criteria allowing even earlier diagnosis with
MRI [116]. The value of MRI as a diagnostic tool is
principally the high sensitivity to detect (past) disease
activity. Formation of new T2HL and GdT1L may occur
subclinically and are thus more frequently seen than clin-
ical relapses [9, 117]. The moderate correlation of T2HL
load with relapse rate [26, 118] and disability [119, 120] is
possibly related to this phenomenon. Nevertheless, white
matter pathology has predictive value for the clinical dis-
ease course. For example, patients with a CIS and a high
T2HL load at baseline had an increased risk of reaching an
EDSS of 3.0 [121]. Also, the presence of two or more
GdT1L in patients treated with interferon-b predicted
EDSS worsening at 15 years [122].
Because of the high sensitivity for detecting disease
activity, MRI has been widely accepted as a secondary
endpoint in clinical trials. Moreover, demonstrating effi-
cacy on MRI lesions is crucial in the development of
immunomodulatory treatments. Treatment effects on MRI
could also act as a surrogate endpoint for clinical disease
activity. A study supported this by showing that treatment
effect on MRI activity explained[80% of the variance of
treatment effect on relapse rate [123]. Other studies con-
firmed this by showing the related MRI effects on relapse
rate and accumulation of disability worsening (up to 16
years) [124–126].
These classical MRI parameters largely depict (past)
neuroinflammation in MS. However, the neurodegenerative
aspect of MS is being increasingly studied with MRI. One
reason for this is that with the current therapy we are now
able to suppress neuroinflammation effectively, but the
ultimate goal of therapy is prevention of neuronal tissue
loss or, in the long run, to stimulate neuronal repair.
Table 5 Patient-reported outcome measures that are used in MS
research
Measure
Quality of life
MS Quality of Life-54 [103]
MS Quality of Life Inventory [86]
European Quality of Life-5D [87]
Health Utilities Index Mark 3 [87]
World Health Organization Quality of Life Brief Form [100]
Sickness Impact Profile [83]
Life Satisfaction Questionnaire [96]
Hamburg Quality of Life Questionnaire in MS [91]
Quality of Life Index [85]
Leeds MS Quality of Life Scale [90]
Disability and Impact Profile [101]
The MS International Quality of Life Questionnaire [102]
Functional Assessment of MS [84]
Depression and anxiety
Beck Depression Inventory [82]
Patient Health Questionnaire-9 [95]
Hospital Anxiety and Depression Scale [94]
Fatigue
Modified Fatigue Impact Scale [89]
Fatigue Impact Scale for Daily Use [88]
Single functional domain
MS Walking Scale-12 [93]
Arm Function in MS Questionnaire [98]
Visual Function Questionnaire-25 [99]
Multiple domains
Short Form-36 [104]
MS Impact Scale-29 [92]
Guy’s Neurological Disability Scale [97]
MS Impact Profile [105]
MS Multiple sclerosis
Outcome Measures in MS Clinical Trials 225

Another reason is that neuropathological and MRI tech-
niques have improved our insight into the underlying
neurodegenerative processes of MS [127]. Consequently,
measures that reflect these processes are more frequently
used as secondary outcome measures. The most widely
used neurodegenerative MRI measures are atrophy and
PBH.
3.1.2 Atrophy
Brain volume loss in MS patients occurs considerable
faster than in healthy people: 0.5–1.0% versus 0.1–0.3%
brain volume loss per year [128, 129]. Atrophy may be
found throughout the disease course, even in the early
phases [130]. Remarkably, the atrophy rate of gray matter
structures accelerates in patients with SPMS to 14-fold that
of healthy persons [131]. Virtually all gray matter struc-
tures are affected, although variation exists between clini-
cal phenotypes [132].
Brain volume can be visualized in various ways. The
somewhat older measures assess loss of brain volume
indirectly by measuring corpus callosum size [133],
bicaudate ratio [72] and ventricular volumes [72, 133].
Also, whole brain volume can be measured directly with
conventional MRI [72, 128]. Nowadays, segmentation of
the brain into white and gray matter compartments or
specific gray matter structures is possible and several
automated methods reduced processing time [134–136].
The relationship between atrophy measures and clinical
signs has been extensively investigated. Whole brain and
gray matter atrophy correlated strongly with disability and
cognitive impairment, both cross-sectionally and longitu-
dinally [132]. These correlations existed throughout the
disease course and clinical phenotypes. Atrophy of gray
matter structures may even be more closely related to
clinical signs than white matter lesions or whole brain
atrophy [137]. Atrophy of several structures correlated
remarkably strongly with certain clinical symptoms. For
example, cerebellar gray matter atrophy correlated strongly
with cerebellar symptoms and hand function [138], upper
cervical cord area with ambulatory dysfunction [139], and
hippocampal atrophy with memory deficits [140]. Thala-
mic volume showed a remarkably firm correlation with
cognitive impairment [141]. Also, various atrophy mea-
sures showed predictive value for future disability and
cognitive impairment [137, 142–144].
Furthermore, spinal cord volumes can be assessed, for
which the upper cervical cord area is often used. Several
studies showed a correlation between spinal cord volume
loss and clinical disability [144–146]. It has also been
correlated with long-term disability [147].
An extensive summary of clinical trials that used brain
atrophy as a secondary endpoint may be found elsewhere
[148, 149]. Noteworthy is a recent meta-analysis that
showed that 75% of the variance of treatment effect on
disability was explained by whole brain atrophy and T2HL
[150]. Another meta-analysis found evidence that whole
brain atrophy in patients that received immunomodulatory
treatment was lower than in the placebo group [151].
Although volumetric measurements are appealing out-
come measures, there are some caveats and limitations.
Firstly, atrophy accumulates very slowly, which generally
means that longer follow-up is needed to detect significant
changes. Clearly, this accounts particularly for treatment
effects on smaller structures, such as thalamic volume.
Secondly, the short-term effect of immunosuppression on
brain tissue may cause a decrease in brain volume due to
resolution of inflammation. This volume loss is not a sign
of neurodegeneration, because there is no loss of neuronal
tissue. This is often referred to as ‘pseudo-atrophy’.
Importantly, this effect may last up to 1 year after initiation
of treatment [152, 153]. Thirdly, various physiological
variations in the content of the intra- and extra-cellular
compartments affect volumetric measurements [154].
Lastly, factors that are not MS-specific (such as dehydra-
tion, alcohol use, smoking, genetic variation, comorbidities
and age) may influence brain volume [154].
3.1.3 Persisting Black Holes
Another MRI marker for neurodegeneration is formation of
PBH. These lesions are often defined as non-enhancing
T2HL with persisting signal intensity between that of the
gray matter and the CSF on T1-weighted scans [155].
Approximately 30–40% of active T2HL will eventually
evolve into PBH within 6–12 months [156]. The underly-
ing neuropathology of PBH is severe and irreversible tissue
damage [156]. Accumulation of PBH is associated with
accrual of disability [157, 158]. Furthermore, the PBH load
correlated with disability worsening over 10 years [159].
Some clinical trials found significant effects of treatment
on the formation of PBH [160–163].
Several more advanced MRI techniques are potentially
valuable outcome measures, although they need further
research to clarify the exact relevance. Examples are
functional MRI for analysis of functional connectivity
[164], diffusion tensor imaging to examine brain tissue
integrity [165] and magnetization transfer ratio MRI as a
marker for brain myelin content [166, 167].
3.2 Optical Coherence Tomography
The retina can be visualized non-invasively, safely and fast
with OCT. This technique uses the reflection of near infra-
red light on the retina. Different layers of the retina can be
distinguished on high-resolution images. It has been proven
226 C. E. P. van Munster, B. M. J. Uitdehaag

to be valuable in quantifying pathology in these layers,
although the exact underlying pathophysiological processes
of these findings are largely unclear [168, 169].
Most findings of the research with OCT in MS point to
neurodegenerative changes such as axonal loss and neu-
ronal soma shrinkage [170]. Therefore, OCT is a good
candidate outcome measure to assess treatment effect on
neurodegeneration, which makes it an attractive tool in
progressive MS trials. For this purpose, the retinal nerve
fibre layer (RNFL) is of particular interest. The thickness of
this layer may be decreased following optic neuritis
[171, 172], but also decreases more slowly in patients
without prior optic neuritis [171, 173]. The latter may
indicate ongoing neurodegeneration. Furthermore, RNFL
thickness correlated with cerebral atrophy measures
[174, 175] and with axonal loss in the anterior visual
pathway [176, 177].
Clinically, thinning of the RNFL correlated with worse
performance on the LCLA (explained in Table 4)
[171, 178], and a reduced visual quality of life [179].
Correlations of RNFL thickness with EDSS were less
consistent [180, 181]. In a recent large multicenter study of
patients without prior optic neuritis, persons with a RNFL
thickness in the lowest tertile at baseline had double the
risk of disability worsening in 2 years compared with the
other tertiles [182]. The risk further increased with a longer
follow-up. The clinical relevance of other layers, such as
macular volume [183] and retinal ganglion-cell/inner
plexiform layer thickness [184, 185], is less clear.
The advantage of OCT over MRI is that it is technically
easier and widely accessible. When using a predefined
scanning protocol, it has good reliability [186]. Neverthe-
less, further research is needed before OCT can be
implemented as an outcome measure. This is particularly
the case for longitudinal data of the various layers.
3.3 Biomarkers in Body Fluids
Both MRI and OCT allow detection of neuroinflammation
and neurodegeneration at various time points, but have
limited sensitivity to detect ongoing processes. Biomarkers
in body fluids, such as CSF and blood, might be more
useful for this purpose. Although it is beyond the scope of
this review to discuss this topic thoroughly (it was recently
reviewed elsewhere [187]), a few biomarkers are worth
mentioning.
There are several potentially valuable CSF biomarkers
that might give a real-time reflection of ongoing neurode-
generation. A biomarker that reflects axonal injury is
neurofilament. This protein is a major component of the
axonal cytoskeleton and is released following neuronal
damage [188]. Neurofilament levels in CSF are generally
raised in MS patients, particularly during an acute relapse
[189, 190]. Furthermore, increased levels were associated
with worse EDSS [190], faster disability worsening in 15
years [191], gadolinium-enhancing lesion load [192] and
atrophy (of the brain and spinal cord) in 15 years [193].
Neurofilament levels were also responsive to treatment
with fingolimod [194] and natalizumab [195], and therefore
might be biomarkers for treatment effect.
Other proteins of the axonal cytoskeleton that can be
measured in CSF are actin [196, 197] and tubulin
[197, 198]. Proteins that indicate ongoing disease activity
are sphingolipids (component of the myelin sheet) [199],
glial fibrillary acidic protein (GFAP) [200], S100B [200]
and Chitinase 3-like proteins [201].
Compared with CSF, blood is generally less well studied
for biomarkers, but clearly has the advantage that it is
much easier to obtain. As in CSF, neurofilament in the
blood might act as a biomarker for neurodegeneration.
Neurofilament levels predicted recovery of spinal cord
lesions [202], and higher concentrations were associated
with faster conversion to definite MS and more cerebral
lesions [203]. Another biomarker that is used to determine
bioactivity of interferon-b is myxovirus-resistance protein
A (MxA). It also seems to be indicative of recent and future
disease activity [204, 205]. Lastly, various small noncoding
microRNAs are potentially valuable for predicting disease
course and treatment response [187].
The exact value of these biomarkers as outcome mea-
sures will have to be determined. If clinically meaningful,
they will probably be used in combination with other
measures. They may be particularly useful to assess treat-
ment effects in trials with progressive MS, because iden-
tification of progression or neurodegenerative changes
remains very challenging.
4 No Evidence of Disease Activity
The concept of a ‘disease-activity-free status’ as the ulti-
mate treatment goal has been used in other medical con-
ditions, including cancer and inflammatory diseases such as
rheumatoid arthritis. It implies the absence of measurable
disease activity. This concept has been translated to NEDA
and is used in more recent MS trials as a secondary out-
come measure [206, 207]. It is essentially a multidimen-
sional measure that typically covers (confirmed) EDSS
progression, relapse rate and formation of MRI lesions
(T2HL or GdT1L). However, any parameter related to
disease activity may be added.
A recent study in a cohort of RRMS patients found that
NEDA at 2 years had a positive predictive value for
absence of disability progression at 7 years of 78% [207].
Furthermore, the predictive value of NEDA was greater
than each of the individual components. Other studies also
Outcome Measures in MS Clinical Trials 227
showed that combinations of clinical and MRI parameters
had better predictive value for disability progression than
individual measures [125, 150, 208–210]. For example, a
recent meta-analysis found that treatment effect on T2HL
and brain volume combined explained 75% of the variance
of disability progression in 2 years, and this was signifi-
cantly higher than predictive values of the MRI measures
individually [150].
In clinical practice, NEDA-like models are used to
identify responders and non-responders to treatment.
Examples are the Modified Rio Score [211] and the
Canadian Treatment Optimization Recommendation
Model [35]. Such tools need to have good long-term pre-
dictive power for disability, before a treatment decision can
be based on them.
When using NEDA as an outcome measure to assess
treatment efficacy, it is important to consider the timing of
assessment. The reason for this is that a treatment needs to
have had enough time to become effective. This can be
illustrated by the finding that 70% of patients had NEDA 2
years after initiating treatment with natalizumab with
baseline assessment after 1 year, compared with 51%
NEDA with a baseline at initiation of therapy [212]. For
alemtuzumab timing is different, because the true treatment
effect starts after the second infusion cycle, 1 year after the
initial course [213]. This issue has implications when
determining if NEDA can be a valid outcome measure for
disability in the long run.
Although NEDA seems an appealing outcome mea-
sure in some ways, it is not yet clear which (functional)
domains are important to include and when or how fre-
quently these should be assessed. It should, for example,
reflect what is important in daily life for patients.
Therefore, including a PROM seems indispensable.
Also, markers for neurodegeneration should be involved
when tissue loss is considered to be the ultimate treat-
ment goal. Therefore, brain volume is increasingly added
to NEDA (referred to as NEDA-4) [214]. However,
adding more assessments likely reduces the number of
patients fulfilling NEDA, and may raise the bar to a too-
high level resulting in the rejection of highly active, but
not perfect, interventions.
Taken together, NEDA will continue to evolve while
evidence accumulates about what are valuable outcome
measures. Standardization of timing and functional sub-
domains are imperative for comparison between studies.
5 Future Perspectives
The number and quality of outcome measures is increasing,
and with that the assessment of treatment efficacy will
improve over the coming years. Until new measures are
validated and generally accepted, the traditional outcome
measures of EDSS and relapse rate will remain primary
endpoints in clinical trials. However, it is very unlikely that
these measures are sufficient to fully assess treatment
efficacy. Eventually, measures that more explicitly capture
multiple dimensions (e.g. MSFC and NEDA) will probably
become the new standard. They are particularly useful to
detect infrequent events (e.g. relapses) or small changes
(e.g. brain atrophy and disability worsening) under treat-
ment, which is increasingly important with highly effective
therapy. The same accounts for treatment of progressive
disease (SPMS and PPMS), in which small and gradual
treatment effects can be expected. Moreover, multidimen-
sional measures might decrease duration and size of clin-
ical trials. The caveats of multidimensional measures that
have to be taken into account are summarized in Table 6
[25].
In addition to improvement of existing outcome mea-
sures, innovative techniques such as electronic devices and
mobile device applications are potentially valuable. They
allow, for instance, multiple or continuous assessment
which might give a more adequate picture of a patient’s
ability or disability and the impact of the disease on daily
living.
Several electronic devices are under development to
assess disability. An example of this is the Assess MS
system that uses an infra-red camera to register movements
of upper and lower limbs, trunk and ambulation for auto-
matic quantification of these movements. Results from a
pilot study in MS are promising and these preliminary
results are currently being validated with a new high-res-
olution camera [215]. Another device that has been
developed is the Glove analyzer system, which is able to
record data from finger movements to assess hand and arm
function [216]. Also, accelerometers are potentially useful
tools to measure mobility automatically [217]. Apart from
other attractive aspects, electronic devices are free of intra-
rater variability.
Mobile device applications are increasingly being used
in the medical field and are also potentially useful in
assessing outcomes in MS trials. Applications can be easily
distributed and accessible for everyone with a smart phone.
They can be used in several ways; for example, for
assessing a PROM on a regular basis—up to several times
per day. Also, applications may be connected online with
investigators to get real-time access to or feedback from a
patient’s status. This may decrease the number of visits
needed or could help decide whether or not face-to-face
contact with a patient is needed. In past years, healthcare
‘hackathons’ (i.e. an acronym of HACKers marATHONS)
were organized to stimulate development and integration of
medical devices and mobile device applications [218, 219].
However, many of these applications need rigorous
228 C. E. P. van Munster, B. M. J. Uitdehaag

scientific validation before they may be considered as
outcome measures in clinical trials.
6 Conclusions
To conclude, assessing outcome in clinical trials in MS is
not straightforward and is therefore a challenging field.
Although much has been achieved the past decades, ‘old
habits die hard’ and traditional measures will probably
remain the standard in the near future. When more
advanced measures have proven their value, they need to
earn general acceptance by healthcare providers and
especially regulatory agencies. In the end, only multidi-
mensional measures will allow full coverage of disease
activity and progression of MS and are thus best suited to
assessing treatment efficacy in MS trials.
Acknowledgements The authors wish to thank M.M.P. Wijnen for
carefully reading the manuscript.
Compliance with Ethical Standards
Funding No funding was received for the preparation of this review.
Open access was funded by the VU University Medical Center,
Amsterdam, as part of the COMPACT agreement between Springer
and the Association of Dutch Universities and Academy Institutes.
Conflicts of interest CEPvM has received travel support from
Novartis Pharma AG, Sanofi Genzyme and Teva Pharmaceuticals,
and honoraria for lecturing and consulting from Biogen-Idec and
Merck Serono. BMJU has received consultation fees from Biogen-
Idec, Novartis Pharma AG, EMD Serono, Teva Pharmaceuticals,
Sanofi Genzyme and Roche. The Multiple Sclerosis Centre Amster-
dam has received financial support for research from Biogen-Idec,
Merck Serono, Novartis Pharma AG, and Teva Pharmaceuticals.
Open Access This article is distributed under the terms of the
Creative Commons Attribution-NonCommercial 4.0 International
License (http://creativecommons.org/licenses/by-nc/4.0/), which per-
mits any noncommercial use, distribution, and reproduction in any
medium, provided you give appropriate credit to the original
author(s) and the source, provide a link to the Creative Commons
license, and indicate if changes were made.
References
1. Compston A. McAlpine’s multiple sclerosis. 4th ed. Philadel-
phia: Churchill Livingstone Elsevier; 2005.
2. Polman CH, Reingold SC, Banwell B, Clanet M, Cohen JA,
Filippi M, et al. Diagnostic criteria for multiple sclerosis: 2010
revisions to the McDonald criteria. Ann Neurol. 2011;69(2):
292–302. doi:10.1002/ana.22366.
3. McGraw CA, Lublin FD. Interferon beta and glatiramer acetate
therapy. Neurotherapeutics. 2013;10(1):2–18. doi:10.1007/
s13311-012-0163-4.
4. Mokkink LB, Terwee CB, Patrick DL, Alonso J, Stratford PW,
Knol DL, et al. The COSMIN study reached international con-
sensus on taxonomy, terminology, and definitions of measure-
ment properties for health-related patient-reported outcomes.
J Clin Epidemiol. 2010;63(7):737–45. doi:10.1016/j.jclinepi.
2010.02.006.
5. Compston A, Coles A. Multiple sclerosis. Lancet. 2008;372
(9648):1502–17. doi:10.1016/S0140-6736(08)61620-7.
6. Lublin FD, Reingold SC. Defining the clinical course of mul-
tiple sclerosis: results of an international survey. National
Multiple Sclerosis Society (USA) Advisory Committee on
Clinical Trials of New Agents in Multiple Sclerosis. Neurology.
1996;46(4):907–11.
7. Weinshenker BG, Bass B, Rice GP, Noseworthy J, Carriere W,
Baskerville J, et al. The natural history of multiple sclerosis: a
geographically based study. I. Clinical course and disability.
Brain. 1989;112(Pt 1):133–46.
8. Jin Y, de Pedro-Cuesta J, Soderstrom M, Stawiarz L, Link H.
Seasonal patterns in optic neuritis and multiple sclerosis: a meta-
analysis. J Neurol Sci. 2000;181(1–2):56–64.
9. Barkhof F. The clinico-radiological paradox in multiple scle-
rosis revisited. Curr Opin Neurol. 2002;15(3):239–45.
10. Amato MP, Fratiglioni L, Groppi C, Siracusa G, Amaducci L.
Interrater reliability in assessing functional systems and dis-
ability on the Kurtzke scale in multiple sclerosis. Arch Neurol.
1988;45(7):746–8.
11. Ebers GC, Heigenhauser L, Daumer M, Lederer C, Nose-
worthy JH. Disability as an outcome in MS clinical trials.
Neurology. 2008;71(9):624–31. doi:10.1212/01.wnl.00003
13034.46883.16.
12. Freedman MS. Long-term follow-up of clinical trials of multiple
sclerosis therapies. Neurology. 2011;76(Suppl 1):S26–34.
doi:10.1212/WNL.0b013e318205051d.
13. Goodin DS, Traboulsee A, Knappertz V, Reder AT, Li D,
Langdon D, et al. Relationship between early clinical charac-
teristics and long term disability outcomes: 16 year cohort study
(follow-up) of the pivotal interferon beta-1b trial in multiple
Table 6 Limitations and caveats of multidimensional measures
Interpretation may not be straightforward, particularly if clinical relevance of (some) components are not immediately obvious
An overall score lacks a clear dimension, which complicates the interpretability of the score
Components should be normalized or weighted without obscuring the clinical meaning
Components may shift in opposite directions (improvement vs harm) which might obscure interpretation of treatment efficacy
Components should capture the expected (biological) effects of the intervention under investigation
Increasing the number of components not necessarily increases sensitivity
Redundant components might cause a large change in the composite score in patients that have symptoms in that domain, while the change
may be smaller or absent in patients with symptoms in other domains
Increasing sensitivity to change does not necessarily lead to higher sensitivity for treatment effects
Dichotomization of the results (e.g. ‘no evidence of disease activity’) will inherently cause loss of information
Outcome Measures in MS Clinical Trials 229

sclerosis. J Neurol Neurosurg Psychiatry. 2012;83(3):282–7.
doi:10.1136/jnnp-2011-301178.
14. Liu C, Blumhardt LD. Disability outcome measures in thera-
peutic trials of relapsing-remitting multiple sclerosis: effects of
heterogeneity of disease course in placebo cohorts. J Neurol
Neurosurg Psychiatry. 2000;68(4):450–7.
15. Rudick RA, Lee JC, Cutter GR, Miller DM, Bourdette D,
Weinstock-Guttman B, et al. Disability progression in a clinical
trial of relapsing-remitting multiple sclerosis: eight-year follow-
up. Arch Neurol. 2010;67(11):1329–35. doi:10.1001/archneurol.
2010.150.
16. Hobart J, Freeman J, Thompson A. Kurtzke scales revisited: the
application of psychometric methods to clinical intuition. Brain.
2000;123(Pt 5):1027–40.
17. Francis DA, Bain P, Swan AV, Hughes RA. An assessment of
disability rating scales used in multiple sclerosis. Arch Neurol.
1991;48(3):299–301.
18. Goodkin DE, Cookfair D, Wende K, Bourdette D, Pullicino P,
Scherokman B. Inter- and intrarater scoring agreement using
grades 1.0 to 3.5 of the Kurtzke Expanded Disability Status
Scale (EDSS). Multiple Sclerosis Collaborative Research
Group. Neurology. 1992;42(4):859–63.
19. Noseworthy JH, Vandervoort MK, Wong CJ, Ebers GC, The
Canadian Cooperation MS Study Group. Interrater variability
with the Expanded Disability Status Scale (EDSS) and Func-
tional Systems (FS) in a multiple sclerosis clinical trial. Neu-
rology. 1990;40(6):971–5.
20. Weinshenker BG, Rice GP, Noseworthy JH, Carriere W, Bas-
kerville J, Ebers GC. The natural history of multiple sclerosis: a
geographically based study. 4. Applications to planning and
interpretation of clinical therapeutic trials. Brain. 1991;114(Pt
2):1057–67.
21. Hobart J, Blight AR, Goodman A, Lynn F, Putzki N. Timed
25-foot walk: direct evidence that improving 20% or greater is
clinically meaningful in MS. Neurology. 2013;80(16):1509–17.
doi:10.1212/WNL.0b013e31828cf7f3.
22. Whitaker JN, McFarland HF, Rudge P, Reingold SC. Outcomes
assessment in multiple sclerosis clinical trials: a critical analysis.
Mult Scler. 1995;1(1):37–47.
23. Heesen C, Bohm J, Reich C, Kasper J, Goebel M, Gold SM.
Patient perception of bodily functions in multiple sclerosis: gait
and visual function are the most valuable. Mult Scler.
2008;14(7):988–91. doi:10.1177/1352458508088916.
24. Sutliff MH. Contribution of impaired mobility to patient burden
in multiple sclerosis. Curr Med Res Opin. 2010;26(1):109–19.
doi:10.1185/03007990903433528.
25. Cohen JA, Reingold SC, Polman CH, Wolinsky JS, International
Advisory Committee on Clinical Trials in Multiple S. Disability
outcome measures in multiple sclerosis clinical trials: current
status and future prospects. Lancet Neurol. 2012;11(5):467–76.
doi:10.1016/S1474-4422(12)70059-5.
26. Lublin FD, Baier M, Cutter G. Effect of relapses on develop-
ment of residual deficit in multiple sclerosis. Neurology.
2003;61(11):1528–32.
27. McDonald WI, Compston A, Edan G, Goodkin D, Hartung HP,
Lublin FD, et al. Recommended diagnostic criteria for multiple
sclerosis: guidelines from the International Panel on the diag-
nosis of multiple sclerosis. Ann Neurol. 2001;50(1):121–7.
28. Poser CM, Paty DW, Scheinberg L, McDonald WI, Davis FA,
Ebers GC, et al. New diagnostic criteria for multiple sclerosis:
guidelines for research protocols. Ann Neurol. 1983;13(3):
227–31. doi:10.1002/ana.410130302.
29. Debouverie M, Pittion-Vouyovitch S, Louis S, Guillemin F,
Group L. Natural history of multiple sclerosis in a population-
based cohort. Eur J Neurol. 2008;15(9):916–21. doi:10.1111/j.
1468-1331.2008.02241.x.
30. Eriksson M, Andersen O, Runmarker B. Long-term follow up of
patients with clinically isolated syndromes, relapsing-remitting
and secondary progressive multiple sclerosis. Mult Scler.
2003;9(3):260–74.
31. Scalfari A, Neuhaus A, Degenhardt A, Rice GP, Muraro PA,
Daumer M, et al. The natural history of multiple sclerosis: a
geographically based study 10: relapses and long-term dis-
ability. Brain. 2010;133(Pt 7):1914–29. doi:10.1093/brain/
awq118.
32. Tremlett H, Yousefi M, Devonshire V, Rieckmann P, Zhao Y,
Neurologists UBC. Impact of multiple sclerosis relapses on
progression diminishes with time. Neurology.
2009;73(20):1616–23. doi:10.1212/WNL.0b013e3181c1e44f.
33. Confavreux C, Vukusic S, Moreau T, Adeleine P. Relapses
and progression of disability in multiple sclerosis. N Engl J
Med. 2000;343(20):1430–8. doi:10.1056/NEJM200011163
432001.
34. Sormani MP, Signori A, Siri P, De Stefano N. Time to first
relapse as an endpoint in multiple sclerosis clinical trials. Mult
Scler. 2013;19(4):466–74. doi:10.1177/1352458512457841.
35. Freedman MS, Selchen D, Arnold DL, Prat A, Banwell B,
Yeung M, et al. Treatment optimization in MS: Canadian MS
Working Group updated recommendations. Can J Neurol Sci.
2013;40(3):307–23.
36. Thygesen P. Evaluation of drug treatment of disseminated
sclerosis. Ugeskr Laeger. 1965;127(45):1448–50.
37. Uitdehaag BM, Barkhof F, Coyle PK, Gardner JD, Jeffery DR,
Mikol DD. The changing face of multiple sclerosis clinical trial
populations. Curr Med Res Opin. 2011;27(8):1529–37. doi:10.
1185/03007995.2011.591370.
38. Uitdehaag BM. Clinical outcome measures in multiple sclerosis.
Handb Clin Neurol. 2014;122:393–404. doi:10.1016/B978-0-
444-52001-2.00016-9.
39. Confavreux C, Aimard G, Devic M. Course and prognosis of
multiple sclerosis assessed by the computerized data processing
of 349 patients. Brain. 1980;103(2):281–300.
40. Cutter GR, Baier ML, Rudick RA, Cookfair DL, Fischer JS,
Petkau J, et al. Development of a multiple sclerosis functional
composite as a clinical trial outcome measure. Brain.
1999;122(Pt 5):871–82.
41. Rudick R, Antel J, Confavreux C, Cutter G, Ellison G, Fischer J,
et al. Recommendations from the national multiple sclerosis
society clinical outcomes assessment task force. Ann Neurol.
1997;42(3):379–82. doi:10.1002/ana.410420318.
42. Fischer J, Jak AJ, Kniker JE, Rudick R. Administration and
scoring manual, revised. New York, Demos Vermande; 2001.
43. Miller DM, Rudick RA, Cutter G, Baier M, Fischer JS. Clinical
significance of the multiple sclerosis functional composite:
relationship to patient-reported quality of life. Arch Neurol.
2000;57(9):1319–24.
44. Rudick RA, Cutter G, Baier M, Fisher E, Dougherty D, Wein-
stock-Guttman B, et al. Use of the Multiple Sclerosis Functional
Composite to predict disability in relapsing MS. Neurology.
2001;56(10):1324–30.
45. Rudick RA, Polman CH, Cohen JA, Walton MK, Miller AE,
Confavreux C, et al. Assessing disability progression with the
multiple sclerosis functional composite. Mult Scler.
2009;15(8):984–97. doi:10.1177/1352458509106212.
46. Fisher E, Rudick RA, Cutter G, Baier M, Miller D, Weinstock-
Guttman B, et al. Relationship between brain atrophy and dis-
ability: an 8-year follow-up study of multiple sclerosis patients.
Mult Scler. 2000;6(6):373–7.
47. Hofstetter L, Naegelin Y, Filli L, Kuster P, Traud S, Smieskova
R, et al. Progression in disability and regional grey matter
atrophy in relapsing-remitting multiple sclerosis. Mult Scler.
2014;20(2):202–13. doi:10.1177/1352458513493034.
230 C. E. P. van Munster, B. M. J. Uitdehaag
48. Kalkers NF, Bergers L, de Groot V, Lazeron RH, van Wal-
derveen MA, Uitdehaag BM, et al. Concurrent validity of the
MS Functional Composite using MRI as a biological disease
marker. Neurology. 2001;56(2):215–9.
49. Cohen JA, Cutter GR, Fischer JS, Goodman AD, Heidenreich
FR, Kooijmans MF, et al. Benefit of interferon b-1a on MSFC
progression in secondary progressive MS. Neurology.
2002;59(5):679–87.
50. Costelloe L, O’Rourke K, McGuigan C, Walsh C, Tubridy N,
Hutchinson M. The longitudinal relationship between the
patient-reported Multiple Sclerosis Impact Scale and the clini-
cian-assessed Multiple Sclerosis Functional Composite. Mult
Scler. 2008;14(2):255–8. doi:10.1177/1352458507081274.
51. Ozakbas S, Cagiran I, Ormeci B, Idiman E. Correlations
between multiple sclerosis functional composite, expanded dis-
ability status scale and health-related quality of life during and
after treatment of relapses in patients with multiple sclerosis.
J Neurol Sci. 2004;218(1–2):3–7. doi:10.1016/j.jns.2003.09.015.
52. Honarmand K, Akbar N, Kou N, Feinstein A. Predicting
employment status in multiple sclerosis patients: the utility of
the MS functional composite. J Neurol. 2011;258(2):244–9.
doi:10.1007/s00415-010-5736-8.
53. Shawaryn MA, Schultheis MT, Garay E, Deluca J. Assessing
functional status: exploring the relationship between the multi-
ple sclerosis functional composite and driving. Arch Phys Med
Rehabil. 2002;83(8):1123–9.
54. Kempen JC, de Groot V, Knol DL, Polman CH, Lankhorst GJ,
Beckerman H. Community walking can be assessed using a
10-metre timed walk test. Mult Scler. 2011;17(8):980–90.
doi:10.1177/1352458511403641.
55. Goldman MD, Motl RW, Scagnelli J, Pula JH, Sosnoff JJ,
Cadavid D. Clinically meaningful performance benchmarks in
MS: timed 25-foot walk and the real world. Neurology.
2013;81(21):1856–63. doi:10.1212/01.wnl.0000436065.97642.
d2.
56. Goldman MD, Marrie RA, Cohen JA. Evaluation of the six-
minute walk in multiple sclerosis subjects and healthy controls.
Mult Scler. 2008;14(3):383–90. doi:10.1177/13524585070
82607.
57. Kragt JJ, van der Linden FA, Nielsen JM, Uitdehaag BM, Pol-
man CH. Clinical impact of 20% worsening on Timed 25-foot
Walk and 9-hole Peg Test in multiple sclerosis. Mult Scler.
2006;12(5):594–8.
58. Gronwall DM. Paced auditory serial-addition task: a measure of
recovery from concussion. Percept Mot Skills.
1977;44(2):367–73. doi:10.2466/pms.1977.44.2.367.
59. Chiaravalloti ND, DeLuca J. Cognitive impairment in multiple
sclerosis. Lancet Neurol. 2008;7(12):1139–51. doi:10.1016/
S1474-4422(08)70259-X.
60. Nagels G, Geentjens L, Kos D, Vleugels L, D’Hooghe MB, Van
Asch P, et al. Paced visual serial addition test in multiple scle-
rosis. Clin Neurol Neurosurg. 2005;107(3):218–22. doi:10.1016/
j.clineuro.2004.11.016.
61. Cohen JA, Cutter GR, Fischer JS, Goodman AD, Heidenreich
FR, Jak AJ, et al. Use of the multiple sclerosis functional
composite as an outcome measure in a phase 3 clinical trial.
Arch Neurol. 2001;58(6):961–7.
62. Benedict RH, Duquin JA, Jurgensen S, Rudick RA, Feitcher J,
Munschauer FE, et al. Repeated assessment of neuropsycho-
logical deficits in multiple sclerosis using the Symbol Digit
Modalities Test and the MS Neuropsychological Screening
Questionnaire. Mult Scler. 2008;14(7):940–6. doi:10.1177/
1352458508090923.
63. Ontaneda D, LaRocca N, Coetzee T, Rudick R, Force NMT.
Revisiting the multiple sclerosis functional composite: pro-
ceedings from the National Multiple Sclerosis Society (NMSS)
Task Force on Clinical Disability Measures. Mult Scler.
2012;18(8):1074–80. doi:10.1177/1352458512451512.
64. Walker LA, Cheng A, Berard J, Berrigan LI, Rees LM, Freed-
man MS. Tests of information processing speed: what do people
with multiple sclerosis think about them? Int J MS Care.
2012;14(2):92–9. doi:10.7224/1537-2073-14.2.92.
65. Benedict RH. Effects of using same- versus alternate-form
memory tests during short-interval repeated assessments in
multiple sclerosis. J Int Neuropsychol Soc. 2005;11(6):727–36.
doi:10.1017/S1355617705050782.
66. Sonder JM, Burggraaff J, Knol DL, Polman CH, Uitdehaag BM.
Comparing long-term results of PASAT and SDMT scores in
relation to neuropsychological testing in multiple sclerosis. Mult
Scler. 2014;20(4):481–8. doi:10.1177/1352458513501570.
67. Papadopoulou A, Muller-Lenke N, Naegelin Y, Kalt G, Bend-
feldt K, Kuster P, et al. Contribution of cortical and white matter
lesions to cognitive impairment in multiple sclerosis. Mult Scler.
2013;19(10):1290–6. doi:10.1177/1352458513475490.
68. Yu HJ, Christodoulou C, Bhise V, Greenblatt D, Patel Y, Serafin
D, et al. Multiple white matter tract abnormalities underlie
cognitive impairment in RRMS. Neuroimage. 2012;59(4):
3713–22. doi:10.1016/j.neuroimage.2011.10.053.
69. Benedict RH, Cookfair D, Gavett R, Gunther M, Munschauer F,
Garg N, et al. Validity of the minimal assessment of cognitive
function in multiple sclerosis (MACFIMS). J Int Neuropsychol
Soc. 2006;12(4):549–58.
70. Portaccio E, Goretti B, Zipoli V, Iudice A, Pina DD, Malen-
tacchi GM, et al. Reliability, practice effects, and change indices
for Rao’s Brief Repeatable Battery. Mult Scler.
2010;16(5):611–7. doi:10.1177/1352458510362818.
71. Benedict RH, Bruce JM, Dwyer MG, Abdelrahman N, Hussein
S, Weinstock-Guttman B, et al. Neocortical atrophy, third ven-
tricular width, and cognitive dysfunction in multiple sclerosis.
Arch Neurol. 2006;63(9):1301–6. doi:10.1001/archneur.63.9.
1301.
72. Benedict RH, Weinstock-Guttman B, Fishman I, Sharma J, Tjoa
CW, Bakshi R. Prediction of neuropsychological impairment in
multiple sclerosis: comparison of conventional magnetic reso-
nance imaging measures of atrophy and lesion burden. Arch
Neurol. 2004;61(2):226–30. doi:10.1001/archneur.61.2.226.
73. Balcer LJ, Miller DH, Reingold SC, Cohen JA. Vision and
vision-related outcome measures in multiple sclerosis. Brain.
2015;138(Pt 1):11–27. doi:10.1093/brain/awu335.
74. Balcer LJ, Baier ML, Cohen JA, Kooijmans MF, Sandrock AW,
Nano-Schiavi ML, et al. Contrast letter acuity as a visual
component for the Multiple Sclerosis Functional Composite.
Neurology. 2003;61(10):1367–73.
75. Wu GF, Schwartz ED, Lei T, Souza A, Mishra S, Jacobs DA,
et al. Relation of vision to global and regional brain MRI in
multiple sclerosis. Neurology. 2007;69(23):2128–35. doi:10.
1212/01.wnl.0000278387.15090.5a.
76. Balcer LJ, Frohman EM. Evaluating loss of visual function in
multiple sclerosis as measured by low-contrast letter acuity.
Neurology. 2010;74(Suppl 3):S16–23. doi:10.1212/WNL.
0b013e3181dbb664.
77. Balcer LJ, Galetta SL, Calabresi PA, Confavreux C, Giovannoni
G, Havrdova E, et al. Natalizumab reduces visual loss in patients
with relapsing multiple sclerosis. Neurology. 2007;68(16):
1299–304. doi:10.1212/01.wnl.0000259521.14704.a8.
78. Uitdehaag BM, Ader HJ, Roosma TJ, de Groot V, Kalkers NF,
Polman CH. Multiple sclerosis functional composite: impact of
reference population and interpretation of changes. Mult Scler.
2002;8(5):366–71.
79. Fox RJ, Lee JC, Rudick RA. Optimal reference population for
the multiple sclerosis functional composite. Mult Scler.
2007;13(7):909–14. doi:10.1177/1352458507076950.
Outcome Measures in MS Clinical Trials 231

80. Schwid SR, Goodman AD, McDermott MP, Bever CF, Cook
SD. Quantitative functional measures in MS: what is a reliable
change? Neurology. 2002;58(8):1294–6.
81. Food and Drug Administration. Guidance for industry: patient-
reported outcome measures: use in medical product develop-
ment to support labeling claims. http://www.fdagov/downloads/
drugs/guidancecomplianceregulatoryinformation/guidances/ucm
193282pdf. December 2009.
82. Beck AT, Ward CH, Mendelson M, Mock J, Erbaugh J. An
inventory for measuring depression. Arch Gen Psychiatry.
1961;4:561–71.
83. Bergner M, Bobbitt RA, Carter WB, Gilson BS. The Sickness
Impact Profile: development and final revision of a health status
measure. Med Care. 1981;19(8):787–805.
84. Cella DF, Dineen K, Arnason B, Reder A, Webster KA, Kara-
batsos G, et al. Validation of the functional assessment of
multiple sclerosis quality of life instrument. Neurology.
1996;47(1):129–39.
85. Ferrans CE, Powers MJ. Quality of life index: development and
psychometric properties. ANS Adv Nurs Sci. 1985;8(1):15–24.
86. Fischer JS, LaRocca NG, Miller DM, Ritvo PG, Andrews H,
Paty D. Recent developments in the assessment of quality of life
in multiple sclerosis (MS). Mult Scler. 1999;5(4):251–9.
87. Fisk JD, Brown MG, Sketris IS, Metz LM, Murray TJ, Stadnyk
KJ. A comparison of health utility measures for the evaluation of
multiple sclerosis treatments. J Neurol Neurosurg Psychiatry.
2005;76(1):58–63. doi:10.1136/jnnp.2003.017897.
88. Fisk JD, Doble SE. Construction and validation of a fatigue
impact scale for daily administration (D-FIS). Qual Life Res.
2002;11(3):263–72.
89. Fisk JD, Pontefract A, Ritvo PG, Archibald CJ, Murray TJ. The
impact of fatigue on patients with multiple sclerosis. Can J
Neurol Sci. 1994;21(1):9–14.
90. Ford HL, Gerry E, Tennant A, Whalley D, Haigh R, Johnson
MH. Developing a disease-specific quality of life measure for
people with multiple sclerosis. Clin Rehabil. 2001;15(3):
247–58.
91. Gold SM, Heesen C, Schulz H, Guder U, Monch A, Gbadamosi
J, et al. Disease specific quality of life instruments in multiple
sclerosis: validation of the Hamburg Quality of Life Question-
naire in Multiple Sclerosis (HAQUAMS). Mult Scler. 2001;7(2):
119–30.
92. Hobart J, Lamping D, Fitzpatrick R, Riazi A, Thompson A. The
Multiple Sclerosis Impact Scale (MSIS-29): a new patient-based
outcome measure. Brain. 2001;124(Pt 5):962–73.
93. Hobart JC, Riazi A, Lamping DL, Fitzpatrick R, Thompson AJ.
Measuring the impact of MS on walking ability: the 12-Item MS
Walking Scale (MSWS-12). Neurology. 2003;60(1):31–6.
94. Honarmand K, Feinstein A. Validation of the Hospital Anxiety
and Depression Scale for use with multiple sclerosis patients.
Mult Scler. 2009;15(12):1518–24. doi:10.1177/13524585093
47150.
95. Kroenke K, Spitzer RL, Williams JB. The PHQ-9: validity of a
brief depression severity measure. J Gen Intern Med.
2001;16(9):606–13.
96. Melin R, Fugl-Meyer KS, Fugl-Meyer AR. Life satisfaction in
18- to 64-year-old Swedes: in relation to education, employment
situation, health and physical activity. J Rehabil Med.
2003;35(2):84–90.
97. Mokkink LB, Knol DL, Uitdehaag BM. Factor structure of
Guy’s Neurological Disability Scale in a sample of Dutch
patients with multiple sclerosis. Mult Scler. 2011;17(12):
1498–503. doi:10.1177/1352458511413098.
98. Mokkink LB, Knol DL, van der Linden FH, Sonder JM,
D’Hooghe M, Uitdehaag BM. The Arm Function in Multiple
Sclerosis Questionnaire (AMSQ): development and validation
of a new tool using IRT methods. Disabil Rehabil. 2015. doi:10.
3109/09638288.2015.1027005.
99. Mowry EM, Loguidice MJ, Daniels AB, Jacobs DA, Markowitz
CE, Galetta SL, et al. Vision related quality of life in multiple
sclerosis: correlation with new measures of low and high con-
trast letter acuity. J Neurol Neurosurg Psychiatry.
2009;80(7):767–72. doi:10.1136/jnnp.2008.165449.
100. Ozakbas S, Akdede BB, Kosehasanogullari G, Aksan O, Idiman
E. Difference between generic and multiple sclerosis-specific
quality of life instruments regarding the assessment of treatment
efficacy. J Neurol Sci. 2007;256(1–2):30–4. doi:10.1016/j.jns.
2007.01.080.
101. Pfennings L, Cohen L, Ader H, Polman C, Lankhorst G, Smits
R, et al. Exploring differences between subgroups of multiple
sclerosis patients in health-related quality of life. J Neurol.
1999;246(7):587–91.
102. Simeoni M, Auquier P, Fernandez O, Flachenecker P, Stecchi S,
Constantinescu C, et al. Validation of the Multiple Sclerosis
International Quality of Life questionnaire. Mult Scler.
2008;14(2):219–30. doi:10.1177/1352458507080733.
103. Vickrey BG, Hays RD, Harooni R, Myers LW, Ellison GW. A
health-related quality of life measure for multiple sclerosis. Qual
Life Res. 1995;4(3):187–206.
104. Ware JE Jr, Sherbourne CD. The MOS 36-item short-form
health survey (SF-36). I. Conceptual framework and item
selection. Med Care. 1992;30(6):473–83.
105. Wynia K, Middel B, van Dijk JP, de Ruiter H, de Keyser J,
Reijneveld SA. The Multiple Sclerosis impact Profile (MSIP).
Development and testing psychometric properties of an ICF-
based health measure. Disabil Rehabil. 2008;30(4):261–74.
doi:10.1080/09638280701256868.
106. Cohen RA, Kessler HR, Fischer M. The Extended Disability
Status Scale (EDSS) as a predictor of impairments of functional
activities of daily living in multiple sclerosis. J Neurol Sci.
1993;115(2):132–5.
107. Farrell B, Godwin J, Richards S, Warlow C. The United King-
dom transient ischaemic attack (UK-TIA) aspirin trial: final
results. J Neurol Neurosurg Psychiatry. 1991;54(12):1044–54.
108. Rankin J. Cerebral vascular accidents in patients over the age of
60. II. Prognosis. Scott Med J. 1957;2(5):200–15.
109. Mahoney FI, Barthel DW. Functional evaluation: The Barthel
index. Md State Med J. 1965;14:61–5.
110. Airlie J, Baker GA, Smith SJ, Young CA. Measuring the impact
of multiple sclerosis on psychosocial functioning: the develop-
ment of a new self-efficacy scale. Clin Rehabil.
2001;15(3):259–65.
111. Smith SJ, Young CA. The role of affect on the perception of
disability in multiple sclerosis. Clin Rehabil. 2000;14(1):50–4.
112. Berrigan LI, Fisk JD, Patten SB, Tremlett H, Wolfson C, Warren
S, et al. Health-related quality of life in multiple sclerosis: direct
and indirect effects of comorbidity. Neurology. 2016. doi:10.
1212/WNL.0000000000002564.
113. Sprangers MA, Schwartz CE. Integrating response shift into
health-related quality of life research: a theoretical model. Soc
Sci Med. 1999;48(11):1507–15.
114. Cappelleri JC, Jason Lundy J, Hays RD. Overview of classical
test theory and item response theory for the quantitative
assessment of items in developing patient-reported outcomes
measures. Clin Ther. 2014;36(5):648–62. doi:10.1016/j.
clinthera.2014.04.006.
115. van Munster ETL. Klinische en paraklinische parameters in het
verloop van multiple sclerose. Thesis. 1991.
116. Filippi M, Rocca MA, Ciccarelli O, De Stefano N, Evangelou N,
Kappos L, et al. MRI criteria for the diagnosis of multiple
sclerosis: MAGNIMS consensus guidelines. Lancet Neurol.
2016;15(3):292–303. doi:10.1016/S1474-4422(15)00393-2.
232 C. E. P. van Munster, B. M. J. Uitdehaag

117. McDonald WI, Miller DH, Thompson AJ. Are magnetic reso-
nance findings predictive of clinical outcome in therapeutic
trials in multiple sclerosis? The dilemma of interferon-beta. Ann
Neurol. 1994;36(1):14–8. doi:10.1002/ana.410360106.
118. Fisniku LK, Brex PA, Altmann DR, Miszkiel KA, Benton CE,
Lanyon R, et al. Disability and T2 MRI lesions: a 20-year fol-
low-up of patients with relapse onset of multiple sclerosis.
Brain. 2008;131(Pt 3):808–17. doi:10.1093/brain/awm329.
119. Brex PA, Ciccarelli O, O’Riordan JI, Sailer M, Thompson AJ,
Miller DH. A longitudinal study of abnormalities on MRI and
disability from multiple sclerosis. N Engl J Med.
2002;346(3):158–64. doi:10.1056/NEJMoa011341.
120. O’Riordan JI, Gawne Cain M, Coles A, Wang L, Compston DA,
Tofts P, et al. T1 hypointense lesion load in secondary pro-
gressive multiple sclerosis: a comparison of pre versus post
contrast loads and of manual versus semi automated threshold
techniques for lesion segmentation. Mult Scler. 1998;4(5):
408–12.
121. Tintore M, Rovira A, Rio J, Otero-Romero S, Arrambide G, Tur
C, et al. Defining high, medium and low impact prognostic
factors for developing multiple sclerosis. Brain. 2015;138(Pt
7):1863–74. doi:10.1093/brain/awv105.
122. Bermel RA, You X, Foulds P, Hyde R, Simon JH, Fisher E,
et al. Predictors of long-term outcome in multiple sclerosis
patients treated with interferon beta. Ann Neurol.
2013;73(1):95–103. doi:10.1002/ana.23758.
123. Sormani MP, Bonzano L, Roccatagliata L, Cutter GR, Mancardi
GL, Bruzzi P. Magnetic resonance imaging as a potential sur-
rogate for relapses in multiple sclerosis: a meta-analytic
approach. Ann Neurol. 2009;65(3):268–75. doi:10.1002/ana.
21606.
124. Dobson R, Rudick RA, Turner B, Schmierer K, Giovannoni G.
Assessing treatment response to interferon-b: is there a role for
MRI? Neurology. 2014;82(3):248–54. doi:10.1212/WNL.
0000000000000036.
125. Sormani MP, Bonzano L, Roccatagliata L, Mancardi GL,
Uccelli A, Bruzzi P. Surrogate endpoints for EDSS worsening in
multiple sclerosis. A meta-analytic approach. Neurology.
2010;75(4):302–9. doi:10.1212/WNL.0b013e3181ea15aa.
126. Sormani MP, Stubinski B, Cornelisse P, Rocak S, Li D, De
Stefano N. Magnetic resonance active lesions as individual-level
surrogate for relapses in multiple sclerosis. Mult Scler.
2011;17(5):541–9. doi:10.1177/1352458510391837.
127. Geurts JJ, Barkhof F. Grey matter pathology in multiple scle-
rosis. Lancet Neurol. 2008;7(9):841–51. doi:10.1016/S1474-
4422(08)70191-1.
128. Kalkers NF, Ameziane N, Bot JC, Minneboo A, Polman CH,
Barkhof F. Longitudinal brain volume measurement in multiple
sclerosis: rate of brain atrophy is independent of the disease
subtype. Arch Neurol. 2002;59(10):1572–6.
129. Miller DH, Barkhof F, Frank JA, Parker GJ, Thompson AJ.
Measurement of atrophy in multiple sclerosis: pathological
basis, methodological aspects and clinical relevance. Brain.
2002;125(Pt 8):1676–95.
130. Henry RG, Shieh M, Okuda DT, Evangelista A, Gorno-Tempini
ML, Pelletier D. Regional grey matter atrophy in clinically
isolated syndromes at presentation. J Neurol Neurosurg Psy-
chiatry. 2008;79(11):1236–44. doi:10.1136/jnnp.2007.134825.
131. Fisher E, Lee JC, Nakamura K, Rudick RA. Gray matter atrophy
in multiple sclerosis: a longitudinal study. Ann Neurol.
2008;64(3):255–65. doi:10.1002/ana.21436.
132. van Munster CE, Jonkman LE, Weinstein HC, Uitdehaag BM,
Geurts JJ. Gray matter damage in multiple sclerosis: impact on
clinical symptoms. Neuroscience. 2015;303:446–61. doi:10.
1016/j.neuroscience.2015.07.006.
133. Simon JH, Jacobs LD, Campion MK, Rudick RA, Cookfair DL,
Herndon RM. A longitudinal study of brain atrophy in relapsing
multiple sclerosis. The Multiple Sclerosis Collaborative
Research Group (MSCRG). Neurology. 1999;53(1):139–48.
134. Ashburner J, Friston KJ. Voxel-based morphometry—the
methods. Neuroimage. 2000;11(6 Pt 1):805–21. doi:10.1006/
nimg.2000.0582.
135. Fischl B, Dale AM. Measuring the thickness of the human
cerebral cortex from magnetic resonance images. Proc Natl
Acad Sci USA. 2000;97(20):11050–5. doi:10.1073/pnas.
200033797.
136. Smith SM, Zhang Y, Jenkinson M, Chen J, Matthews PM,
Federico A, et al. Accurate, robust, and automated longitudinal
and cross-sectional brain change analysis. Neuroimage.
2002;17(1):479–89.
137. Fisniku LK, Chard DT, Jackson JS, Anderson VM, Altmann
DR, Miszkiel KA, et al. Gray matter atrophy is related to long-
term disability in multiple sclerosis. Ann Neurol.
2008;64(3):247–54. doi:10.1002/ana.21423.
138. Anderson VM, Fisniku LK, Altmann DR, Thompson AJ, Miller
DH. MRI measures show significant cerebellar gray matter
volume loss in multiple sclerosis and are associated with cere-
bellar dysfunction. Mult Scler. 2009;15(7):811–7. doi:10.1177/
1352458508101934.
139. Lycklama G, Thompson A, Filippi M, Miller D, Polman C,
Fazekas F, et al. Spinal-cord MRI in multiple sclerosis. Lancet
Neurol. 2003;2(9):555–62.
140. Sicotte NL, Kern KC, Giesser BS, Arshanapalli A, Schultz A,
Montag M, et al. Regional hippocampal atrophy in multiple
sclerosis. Brain. 2008;131(Pt 4):1134–41. doi:10.1093/brain/
awn030.
141. Houtchens MK, Benedict RH, Killiany R, Sharma J, Jaisani Z,
Singh B, et al. Thalamic atrophy and cognition in multiple
sclerosis. Neurology. 2007;69(12):1213–23. doi:10.1212/01.
wnl.0000276992.17011.b5.
142. Calabrese M, Filippi M, Rovaris M, Bernardi V, Atzori M,
Mattisi I, et al. Evidence for relative cortical sparing in benign
multiple sclerosis: a longitudinal magnetic resonance imaging
study. Mult Scler. 2009;15(1):36–41. doi:10.1177/
1352458508096686.
143. Rocca MA, Mesaros S, Pagani E, Sormani MP, Comi G, Filippi
M. Thalamic damage and long-term progression of disability in
multiple sclerosis. Radiology. 2010;257(2):463–9. doi:10.1148/
radiol.10100326.
144. Valsasina P, Rocca MA, Horsfield MA, Absinta M, Messina R,
Caputo D, et al. Regional cervical cord atrophy and disability in
multiple sclerosis: a voxel-based analysis. Radiology.
2013;266(3):853–61. doi:10.1148/radiol.12120813.
145. Lukas C, Sombekke MH, Bellenberg B, Hahn HK, Popescu V,
Bendfeldt K, et al. Relevance of spinal cord abnormalities to
clinical disability in multiple sclerosis: MR imaging findings in
a large cohort of patients. Radiology. 2013;269(2):542–52.
doi:10.1148/radiol.13122566.
146. Rocca MA, Valsasina P, Damjanovic D, Horsfield MA, Mesaros
S, Stosic-Opincal T, et al. Voxel-wise mapping of cervical cord
damage in multiple sclerosis patients with different clinical
phenotypes. J Neurol Neurosurg Psychiatry. 2013;84(1):35–41.
doi:10.1136/jnnp-2012-303821.
147. Kearney H, Rocca MA, Valsasina P, Balk L, Sastre-Garriga J,
Reinhardt J, et al. Magnetic resonance imaging correlates of
physical disability in relapse onset multiple sclerosis of long
disease duration. Mult Scler. 2014;20(1):72–80. doi:10.1177/
1352458513492245.
148. De Stefano N, Airas L, Grigoriadis N, Mattle HP, O’Riordan J,
Oreja-Guevara C, et al. Clinical relevance of brain volume
Outcome Measures in MS Clinical Trials 233
measures in multiple sclerosis. CNS Drugs. 2014;28(2):147–56.
doi:10.1007/s40263-014-0140-z.
149. Ziemssen T, Derfuss T, de Stefano N, Giovannoni G, Palavra F,
Tomic D, et al. Optimizing treatment success in multiple scle-
rosis. J Neurol. 2016;263(6):1053–65. doi:10.1007/s00415-015-
7986-y.
150. Sormani MP, Arnold DL, De Stefano N. Treatment effect on
brain atrophy correlates with treatment effect on disability in
multiple sclerosis. Ann Neurol. 2014;75(1):43–9. doi:10.1002/
ana.24018.
151. Tsivgoulis G, Katsanos AH, Grigoriadis N, Hadjigeorgiou GM,
Heliopoulos I, Kilidireas C, et al. The effect of disease modi-
fying therapies on brain atrophy in patients with relapsing-
remitting multiple sclerosis: a systematic review and meta-
analysis. PLoS One. 2015;10(3):e0116511. doi:10.1371/journal.
pone.0116511.
152. Bermel RA, Bakshi R. The measurement and clinical relevance
of brain atrophy in multiple sclerosis. Lancet Neurol.
2006;5(2):158–70. doi:10.1016/S1474-4422(06)70349-0.
153. Zivadinov R, Reder AT, Filippi M, Minagar A, Stuve O, Lass-
mann H, et al. Mechanisms of action of disease-modifying agents
and brain volume changes in multiple sclerosis. Neurology.
2008;71(2):136–44. doi:10.1212/01.wnl.0000316810.01120.05.
154. Giorgio A, Battaglini M, Smith SM, De Stefano N. Brain atro-
phy assessment in multiple sclerosis: importance and limita-
tions. Neuroimaging Clin N Am. 2008;18(4):675–86. doi:10.
1016/j.nic.2008.06.007.
155. van Waesberghe JH, van Walderveen MA, Castelijns JA,
Scheltens P, Lycklama a Nijeholt GJ, Polman CH, et al. Patterns
of lesion development in multiple sclerosis: longitudinal
observations with T1-weighted spin-echo and magnetization
transfer MR. AJNR Am J Neuroradiol. 1998;19(4):675–83.
156. van Walderveen MA, Kamphorst W, Scheltens P, van Waes-
berghe JH, Ravid R, Valk J, et al. Histopathologic correlate of
hypointense lesions on T1-weighted spin-echo MRI in multiple
sclerosis. Neurology. 1998;50(5):1282–8.
157. van Walderveen MA, Barkhof F, Hommes OR, Polman CH,
Tobi H, Frequin ST, et al. Correlating MRI and clinical disease
activity in multiple sclerosis: relevance of hypointense lesions
on short-TR/short-TE (T1-weighted) spin-echo images. Neu-
rology. 1995;45(9):1684–90.
158. Truyen L, van Waesberghe JH, van Walderveen MA, van
Oosten BW, Polman CH, Hommes OR, et al. Accumulation of
hypointense lesions (‘‘black holes’’) on T1 spin-echo MRI cor-
relates with disease progression in multiple sclerosis. Neurol-
ogy. 1996;47(6):1469–76.
159. Giorgio A, Stromillo ML, Bartolozzi ML, Rossi F, Battaglini M,
De Leucio A, et al. Relevance of hypointense brain MRI lesions
for long-term worsening of clinical disability in relapsing mul-
tiple sclerosis. Mult Scler. 2014;20(2):214–9. doi:10.1177/
1352458513494490.
160. FilippiM,RovarisM,RoccaMA,SormaniMP,Wolinsky JS,Comi
G, et al. Glatiramer acetate reduces the proportion of new MS
lesions evolving into ‘‘blackholes’’.Neurology. 2001;57(4):731–3.
161. Filippi M, Rocca MA, Pagani E, De Stefano N, Jeffery D,
Kappos L, et al. Placebo-controlled trial of oral laquinimod in
multiple sclerosis: MRI evidence of an effect on brain tissue
damage. J Neurol Neurosurg Psychiatry. 2014;85(8):851–8.
doi:10.1136/jnnp-2013-306132.
162. Dalton CM, Miszkiel KA, Barker GJ, MacManus DG, Pepple
TI, Panzara M, et al. Effect of natalizumab on conversion of
gadolinium enhancing lesions to T1 hypointense lesions in
relapsing multiple sclerosis. J Neurol. 2004;251(4):407–13.
doi:10.1007/s00415-004-0332-4.
163. Barkhof F, van Waesberghe JH, Filippi M, Yousry T, Miller
DH, Hahn D, et al. T(1) hypointense lesions in secondary
progressive multiple sclerosis: effect of interferon beta-1b
treatment. Brain. 2001;124(Pt 7):1396–402.
164. Schoonheim MM, Meijer KA, Geurts JJ. Network collapse and
cognitive impairment in multiple sclerosis. Front Neurol.
2015;6:82. doi:10.3389/fneur.2015.00082.
165. Rovaris M, Gass A, Bammer R, Hickman SJ, Ciccarelli O, Miller
DH, et al. Diffusion MRI in multiple sclerosis. Neurology. 2005;
65(10):1526–32. doi:10.1212/01.wnl.0000184471.83948.e0.
166. Tortorella C, Viti B, Bozzali M, Sormani MP, Rizzo G, Gilardi
MF, et al. A magnetization transfer histogram study of normal-
appearing brain tissue in MS. Neurology. 2000;54(1):186–93.
167. Schmierer K, Tozer DJ, Scaravilli F, Altmann DR, Barker GJ,
Tofts PS, et al. Quantitative magnetization transfer imaging in
postmortem multiple sclerosis brain. J Magn Reson Imaging.
2007;26(1):41–51. doi:10.1002/jmri.20984.
168. Gabilondo I, Martinez-Lapiscina EH, Martinez-Heras E, Fraga-
Pumar E, Llufriu S, Ortiz S, et al. Trans-synaptic axonal
degeneration in the visual pathway in multiple sclerosis. Ann
Neurol. 2014;75(1):98–107. doi:10.1002/ana.24030.
169. Saidha S, Syc SB, Ibrahim MA, Eckstein C, Warner CV, Farrell
SK, et al. Primary retinal pathology in multiple sclerosis as
detected by optical coherence tomography. Brain. 2011;134(Pt
2):518–33. doi:10.1093/brain/awq346.170. Green AJ, McQuaid S, Hauser SL, Allen IV, Lyness R. Ocular
pathology in multiple sclerosis: retinal atrophy and inflamma-
tion irrespective of disease duration. Brain. 2010;133(Pt
6):1591–601. doi:10.1093/brain/awq080.
171. Talman LS, Bisker ER, Sackel DJ, Long DA Jr, Galetta KM,
Ratchford JN, et al. Longitudinal study of vision and retinal
nerve fiber layer thickness in multiple sclerosis. Ann Neurol.
2010;67(6):749–60. doi:10.1002/ana.22005.
172. Petzold A, de Boer JF, Schippling S, Vermersch P, Kardon R,
Green A, et al. Optical coherence tomography in multiple
sclerosis: a systematic review and meta-analysis. Lancet Neurol.
2010;9(9):921–32. doi:10.1016/S1474-4422(10)70168-X.
173. Herrero R, Garcia-Martin E, Almarcegui C, Ara JR, Rodriguez-
Mena D, Martin J, et al. Progressive degeneration of the retinal
nerve fiber layer in patients with multiple sclerosis. Invest Oph-
thalmol Vis Sci. 2012;53(13):8344–9. doi:10.1167/iovs.12-10362.
174. Siger M, Dziegielewski K, Jasek L, Bieniek M, Nicpan A,
Nawrocki J, et al. Optical coherence tomography in multiple
sclerosis: thickness of the retinal nerve fiber layer as a potential
measure of axonal loss and brain atrophy. J Neurol.
2008;255(10):1555–60. doi:10.1007/s00415-008-0985-5.
175. Saidha S, Sotirchos ES, Oh J, Syc SB, Seigo MA, Shiee N, et al.
Relationships between retinal axonal and neuronal measures and
global central nervous system pathology in multiple sclerosis.
JAMANeurol. 2013;70(1):34–43. doi:10.1001/jamaneurol.2013.
573.
176. Trip SA, Schlottmann PG, Jones SJ, Altmann DR, Garway-
Heath DF, Thompson AJ, et al. Retinal nerve fiber layer axonal
loss and visual dysfunction in optic neuritis. Ann Neurol.
2005;58(3):383–91. doi:10.1002/ana.20575.
177. Parisi V, Manni G, Spadaro M, Colacino G, Restuccia R, Marchi
S, et al. Correlation between morphological and functional
retinal impairment in multiple sclerosis patients. Invest Oph-
thalmol Vis Sci. 1999;40(11):2520–7.
178. Henderson AP, Altmann DR, Trip AS, Kallis C, Jones SJ,
Schlottmann PG, et al. A serial study of retinal changes fol-
lowing optic neuritis with sample size estimates for acute neu-
roprotection trials. Brain. 2010;133(9):2592–602. doi:10.1093/
brain/awq146.
179. Sakai RE, Feller DJ, Galetta KM, Galetta SL, Balcer LJ. Vision
in multiple sclerosis: the story, structure-function correlations,
and models for neuroprotection. J Neuroophthalmol.
2011;31(4):362–73. doi:10.1097/WNO.0b013e318238937f.
234 C. E. P. van Munster, B. M. J. Uitdehaag

180. Naismith RT, Tutlam NT, Xu J, Shepherd JB, Klawiter EC,
Song SK, et al. Optical coherence tomography is less sensitive
than visual evoked potentials in optic neuritis. Neurology.
2009;73(1):46–52. doi:10.1212/WNL.0b013e3181aaea32.
181. Jeanjean L, Castelnovo G, Carlander B, Villain M, Mura F,
Dupeyron G, et al. Retinal atrophy using optical coherence
tomography (OCT) in 15 patients with multiple sclerosis and
comparison with healthy subjects. Rev Neurol (Paris).
2008;164(11):927–34. doi:10.1016/j.neurol.2008.03.008.
182. Martinez-Lapiscina EH, Arnow S, Wilson JA, Saidha S, Pre-
iningerova JL, Oberwahrenbrock T, et al. Retinal thickness
measured with optical coherence tomography and risk of dis-
ability worsening in multiple sclerosis: a cohort study. Lancet
Neurol. 2016;15(6):574–84. doi:10.1016/S1474-4422(16)000
68-5.
183. Burkholder BM, Osborne B, Loguidice MJ, Bisker E, Frohman
TC, Conger A, et al. Macular volume determined by optical
coherence tomography as a measure of neuronal loss in multiple
sclerosis. Arch Neurol. 2009;66(11):1366–72. doi:10.1001/
archneurol.2009.230.
184. Walter SD, Ishikawa H, Galetta KM, Sakai RE, Feller DJ,
Henderson SB, et al. Ganglion cell loss in relation to visual
disability in multiple sclerosis. Ophthalmology. 2012;119(6):
1250–7. doi:10.1016/j.ophtha.2011.11.032.
185. Oberwahrenbrock T, Ringelstein M, Jentschke S, Deuschle K,
Klumbies K, Bellmann-Strobl J, et al. Retinal ganglion cell and
inner plexiform layer thinning in clinically isolated syndrome.
Mult Scler. 2013;19(14):1887–95. doi:10.1177/13524585134
89757.
186. Pierro L, Gagliardi M, Iuliano L, Ambrosi A, Bandello F.
Retinal nerve fiber layer thickness reproducibility using seven
different OCT instruments. Invest Ophthalmol Vis Sci.
2012;53(9):5912–20. doi:10.1167/iovs.11-8644.
187. Teunissen CE, Malekzadeh A, Leurs C, Bridel C, Killestein J.
Body fluid biomarkers for multiple sclerosis–the long road to
clinical application. Nat Rev Neurol. 2015;11(10):585–96.
doi:10.1038/nrneurol.2015.173.
188. Petzold A, Tisdall MM, Girbes AR, Martinian L, Thom M,
Kitchen N, et al. In vivo monitoring of neuronal loss in trau-
matic brain injury: a microdialysis study. Brain. 2011;134(Pt
2):464–83. doi:10.1093/brain/awq360.
189. Malmestrom C, Haghighi S, Rosengren L, Andersen O, Lycke J.
Neurofilament light protein and glial fibrillary acidic protein as
biological markers in MS. Neurology. 2003;61(12):1720–5.
190. Kuhle J, Plattner K, Bestwick JP, Lindberg RL, Ramagopalan
SV, Norgren N, et al. A comparative study of CSF neurofilament
light and heavy chain protein in MS. Mult Scler.
2013;19(12):1597–603. doi:10.1177/1352458513482374.
191. Petzold A. The prognostic value of CSF neurofilaments in
multiple sclerosis at 15-year follow-up. J Neurol Neurosurg
Psychiatry. 2015;86(12):1388–90. doi:10.1136/jnnp-2014-
309827.
192. Burman J, Zetterberg H, Fransson M, Loskog AS, Raininko R,
Fagius J. Assessing tissue damage in multiple sclerosis: a bio-
marker approach. Acta Neurol Scand. 2014;130(2):81–9. doi:10.
1111/ane.12239.
193. Petzold A, Steenwijk MD, Eikelenboom JM, Wattjes MP, Uit-
dehaag BM. Elevated CSF neurofilament proteins predict brain
atrophy: a 15-year follow-up study. Mult Scler. 2016;22(9):
1154–62. doi:10.1177/1352458516645206.
194. Kuhle J, Disanto G, Lorscheider J, Stites T, Chen Y, Dahlke F,
et al. Fingolimod and CSF neurofilament light chain levels in
relapsing-remitting multiple sclerosis. Neurology. 2015;84(16):
1639–43. doi:10.1212/WNL.0000000000001491.
195. Gunnarsson M, Malmestrom C, Axelsson M, Sundstrom P,
Dahle C, Vrethem M, et al. Axonal damage in relapsing multiple
sclerosis is markedly reduced by natalizumab. Ann Neurol.
2011;69(1):83–9. doi:10.1002/ana.22247.
196. Doussau F, Augustine GJ. The actin cytoskeleton and neuro-
transmitter release: an overview. Biochimie. 2000;82(4):353–63.
197. Semra YK, Seidi OA, Sharief MK. Heightened intrathecal
release of axonal cytoskeletal proteins in multiple sclerosis is
associated with progressive disease and clinical disability.
J Neuroimmunol. 2002;122(1–2):132–9.
198. Downing KH. Structural basis for the interaction of tubulin with
proteins and drugs that affect microtubule dynamics. Annu Rev
Cell Dev Biol. 2000;16:89–111. doi:10.1146/annurev.cellbio.16.
1.89.
199. Checa A, Khademi M, Sar DG, Haeggstrom JZ, Lundberg JO,
Piehl F, et al. Hexosylceramides as intrathecal markers of
worsening disability in multiple sclerosis. Mult Scler.
2015;21(10):1271–9. doi:10.1177/1352458514561908.
200. Petzold A, Eikelenboom MJ, Gveric D, Keir G, Chapman M,
Lazeron RH, et al. Markers for different glial cell responses in
multiple sclerosis: clinical and pathological correlations. Brain.
2002;125(Pt 7):1462–73.
201. Hinsinger G, Galeotti N, Nabholz N, Urbach S, Rigau V,
Demattei C, et al. Chitinase 3-like proteins as diagnostic and
prognostic biomarkers of multiple sclerosis. Mult Scler.
2015;21(10):1251–61. doi:10.1177/1352458514561906.
202. Kuhle J, Gaiottino J, Leppert D, Petzold A, Bestwick JP,
Malaspina A, et al. Serum neurofilament light chain is a bio-
marker of human spinal cord injury severity and outcome.
J Neurol Neurosurg Psychiatry. 2015;86(3):273–9. doi:10.1136/
jnnp-2013-307454.
203. Disanto G, Adiutori R, Dobson R, Martinelli V, Dalla Costa G,
Runia T, et al. Serum neurofilament light chain levels are
increased in patients with a clinically isolated syndrome.
J Neurol Neurosurg Psychiatry. 2016;87(2):126–9. doi:10.1136/
jnnp-2014-309690.
204. van der Voort LF, Vennegoor A, Visser A, Knol DL, Uitdehaag
BM, Barkhof F, et al. Spontaneous MxA mRNA level predicts
relapses in patients with recently diagnosed MS. Neurology.
2010;75(14):1228–33. doi:10.1212/WNL.0b013e3181f6c556.
205. van der Voort LF, Visser A, Knol DL, Oudejans CB, Polman
CH, Killestein J. Lack of interferon-beta bioactivity is associ-
ated with the occurrence of relapses in multiple sclerosis. Eur J
Neurol. 2009;16(9):1049–52. doi:10.1111/j.1468-1331.2009.
02649.x.
206. Lublin FD. Disease activity free status in MS. Mult Scler Relat
Disord. 2012;1(1):6–7. doi:10.1016/j.msard.2011.08.001.
207. Rotstein DL, Healy BC, Malik MT, Chitnis T, Weiner HL.
Evaluation of no evidence of disease activity in a 7-year lon-
gitudinal multiple sclerosis cohort. JAMA Neurol.
2015;72(2):152–8. doi:10.1001/jamaneurol.2014.3537.
208. Sormani MP, De Stefano N. Defining and scoring response to
IFN-beta in multiple sclerosis. Nat Rev Neurol.
2013;9(9):504–12. doi:10.1038/nrneurol.2013.146.
209. Popescu V, Agosta F, Hulst HE, Sluimer IC, Knol DL, Sormani
MP, et al. Brain atrophy and lesion load predict long term dis-
ability in multiple sclerosis. J Neurol Neurosurg Psychiatry.
2013;84(10):1082–91. doi:10.1136/jnnp-2012-304094.
210. Filippi M, Preziosa P, Copetti M, Riccitelli G, Horsfield MA,
Martinelli V, et al. Gray matter damage predicts the accumulation
of disability 13 years later in MS. Neurology. 2013;81(20):
1759–67. doi:10.1212/01.wnl.0000435551.90824.d0.
211. Sormani MP, Rio J, Tintore M, Signori A, Li D, Cornelisse P,
et al. Scoring treatment response in patients with relapsing
multiple sclerosis. Mult Scler. 2013;19(5):605–12. doi:10.1177/
1352458512460605.
212. Havrdova E, Galetta S, Hutchinson M, Stefoski D, Bates D,
Polman CH, et al. Effect of natalizumab on clinical and
Outcome Measures in MS Clinical Trials 235

radiological disease activity in multiple sclerosis: a retrospective
analysis of the Natalizumab Safety and Efficacy in Relapsing-
Remitting Multiple Sclerosis (AFFIRM) study. Lancet Neurol.
2009;8(3):254–60. doi:10.1016/S1474-4422(09)70021-3.
213. Menge T, Stuve O, Kieseier BC, Hartung HP. Alemtuzumab: the
advantages and challenges of a novel therapy in MS. Neurology.
2014;83(1):87–97. doi:10.1212/WNL.0000000000000540.
214. Kappos L, De Stefano N, Freedman MS, Cree BA, Radue EW,
Sprenger T, et al. Inclusion of brain volume loss in a revised
measure of ‘no evidence of disease activity’ (NEDA-4) in
relapsing-remitting multiple sclerosis. Mult Scler. 2016;22(10):
1297–305. doi:10.1177/1352458515616701.
215. DSouza M, Burggraaff J, Steinheimer S, Kontschieder P, Mor-
rison C, Dorn J et al. Accuracy of depth-sensing recordings in
classifying Expanded Disability Status Scale subscores of motor
dysfunction in patients with multiple sclerosis. American
Academy of Neurology (AAN) poster presentation. 2016.
216. Bonzano L, Sormani MP, Tacchino A, Abate L, Mancardi GL,
Uccelli A. Validation of a new quantitative and objective tool
for the assessment of hand motor disability in multiple sclerosis.
Mult Scler. 2011;17 (suppl 10):43.
217. Weikert M, Suh Y, Lane A, Sandroff B, Dlugonski D, Fernhall
B, et al. Accelerometry is associated with walking mobility, not
physical activity, in persons with multiple sclerosis. Med Eng
Phys. 2012;34(5):590–7. doi:10.1016/j.medengphy.2011.09.005.
218. Busby B, Lesko M, Federer L. Closing gaps between open
software and public data in a hackathon setting: user-centered
software prototyping. F1000 Res. 2016;5:672. doi:10.12688/
f1000research.8382.2.
219. Walker A, Ko N. Bringing medicine to the digital age via
hackathons and beyond. J Med Syst. 2016;40(4):98. doi:10.
1007/s10916-016-0461-1.
236 C. E. P. van Munster, B. M. J. Uitdehaag