outcomesofbasicversusadvancedlifesupportforout-of … · our primary approach was to use propensity...
TRANSCRIPT
Outcomes of Basic Versus Advanced Life Support for Out-of-HospitalMedical EmergenciesPrachi Sanghavi, PhD; Anupam B. Jena, MD, PhD; Joseph P. Newhouse, PhD; and Alan M. Zaslavsky, PhD
Background: Most Medicare patients seeking emergency med-ical transport are treated by ambulance providers trained in ad-vanced life support (ALS). Evidence supporting the superiority ofALS over basic life support (BLS) is limited, but some studiessuggest ALS may harm patients.
Objective: To compare outcomes after ALS and BLS in out-of-hospital medical emergencies.
Design: Observational study with adjustment for propensityscore weights and instrumental variable analyses based oncounty-level variations in ALS use.
Setting: Traditional Medicare.
Patients: 20% random sample of Medicare beneficiaries fromnonrural counties between 2006 and 2011 with major trauma,stroke, acute myocardial infarction (AMI), or respiratory failure.
Measurements: Neurologic functioning and survival to 30 days,90 days, 1 year, and 2 years.
Results: Except in cases of AMI, patients showed superior unad-justed outcomes with BLS despite being older and having morecomorbidities. In propensity score analyses, survival to 90 daysamong patients with trauma, stroke, and respiratory failure washigher with BLS than ALS (6.1 percentage points [95% CI, 5.4 to
6.8 percentage points] for trauma; 7.0 percentage points [CI, 6.2to 7.7 percentage points] for stroke; and 3.7 percentage points[CI, 2.5 to 4.8 percentage points] for respiratory failure). Patientswith AMI did not exhibit differences in survival at 30 days but hadbetter survival at 90 days with ALS (1.0 percentage point [CI, 0.1to 1.9 percentage points]). Neurologic functioning favored BLSfor all diagnoses. Results from instrumental variable analyseswere broadly consistent with propensity score analyses fortrauma and stroke, showed no survival differences between BLSand ALS for respiratory failure, and showed better survival at alltime points with BLS than ALS for patients with AMI.
Limitation: Only Medicare beneficiaries from nonrural countieswere studied.
Conclusion: Advanced life support is associated with substan-tially higher mortality for several acute medical emergenciesthan BLS.
Primary Funding Source: National Science Foundation,Agency for Healthcare Research and Quality, and National Insti-tutes of Health.
Ann Intern Med. doi:10.7326/M15-0557 www.annals.orgFor author affiliations, see end of text.This article was published online first at www.annals.org on 13 October2015.
The predominant response to out-of-hospital medi-cal emergencies by ambulance providers in the
United States is advanced life support (ALS) rather thanbasic life support (BLS). Advanced life support accountsfor 65% of emergency medical care among Medicarebeneficiaries (1) and even more among patients withhigh-acuity conditions, such as stroke. Ambulancecrews using ALS are trained and equipped to providesophisticated care on site (“stay and play”), whereasBLS emphasizes rapid transport to the hospital, so BLSambulance crews provide only minimal treatment at thescene (“scoop and run”) (2–4). Whereas ALS providerscan use invasive interventions, such as endotracheal in-tubation for airway management and intravenous cath-eters for drug and fluid delivery, BLS providers usenoninvasive interventions, such as bag valve masks forrespiratory support. The ALS providers spend moretime at the scene on average (3, 5–7) and receivehigher reimbursement (8).
Despite the predominance of ALS, the sparse exist-ing evidence does not support its value. Prior studies,mostly from outside the United States, show evidenceof similar or longer survival associated with BLS (2–5, 7,9–16). But with few exceptions, these studies are lim-ited by small sample sizes and lack of adjustment forkey confounders. The World Health Organization hasadvised countries without ALS not to implement it for
trauma until there is greater evidence of its benefits(17, 18).
Because a randomized trial comparing ALS withBLS is unlikely, we conducted a large-scale observa-tional study to compare survival and neurologic out-comes between Medicare beneficiaries with majortrauma, stroke, acute myocardial infarction (AMI), or re-spiratory failure who received ALS versus BLS prehos-pital care.
METHODSStudy Overview
We began by comparing unadjusted survival andneurologic functioning between patients receiving BLSand ALS. We then used 2 methodological approachesto address measured and unmeasured confounding.
See also:
Celebrating the ACP Centennial: From the AnnalsArchive . . . . . . . . . . . . . . . . . . . . . . . . . . . . . . . . . . 718Editorial comment . . . . . . . . . . . . . . . . . . . . . . . . . 721
Web-OnlySupplement
This online-first version will be replaced with a final version when it is included in the issue. The final version may differ in small ways.
Annals of Internal Medicine ORIGINAL RESEARCH
www.annals.org Annals of Internal Medicine 681
Downloaded From: http://annals.org/ by a Ohio State Univ User on 10/14/2015
Our primary approach was to use propensity scoreweights to balance ALS and BLS distributions of ob-served characteristics, thus comparing outcomes be-tween patients with similar characteristics who usedALS versus BLS. This analysis focused on within-countycomparisons and removed confounding by observedvariables, but it could still be confounded by unob-served differences between the 2 groups. In an addi-tional instrumental variable analysis, we estimatedcounty ALS penetration rates for each focal diagnosisgroup using data from other diagnoses and comparedoutcomes in counties with higher and lower rates toestimate the effects of ALS.
DataWe analyzed claims between 1 January 2006 and 2
October 2011 from a 20% random sample of Medicarefee-for-service beneficiaries who lived in nonrural coun-ties and were transported to a hospital for out-of-hospital trauma, stroke, AMI, or respiratory failure(Appendixes 1 and 2 of the Supplement, available atwww.annals.org). Approximately 89% of Medicare ben-eficiaries who received emergency transport to a hos-pital for these conditions lived in nonrural counties (Ap-pendix 1 of the Supplement). We identified groundemergency ambulance rides by Healthcare CommonProcedure Coding System codes (Appendix 3 of theSupplement). We linked 96% of ambulance rides to in-patient and outpatient claims by matching on benefi-ciary identification number and service date.
We linked each observation to validated deathdates and demographic data in the Medicare Denomi-nator and Beneficiary Summary Files and chronic med-ical conditions in the Chronic Conditions Data Ware-
house File. We used demographic data for ZIP codetabulation areas in 2009 (19) and county-level demo-graphic and health information from the Area HealthResources Files (20).
Using claims data from the year before the emer-gency event, we calculated combined Charlson–Elixhauser comorbidity scores (21). For trauma cases,we computed New Injury Severity Scores from hospitalclaim diagnosis codes (Appendix 4 of the Supplement)(22). We generated risk-adjusted hospital quality scoresbased on nonemergent surgical survival (Appendix 5 ofthe Supplement).
Sample ConstructionOur study included all patients who were seen as
either inpatients or outpatients after ambulance trans-port. We based patient diagnoses on hospital-assignedInternational Classification of Diseases, Ninth Revision,Clinical Modification, diagnosis codes rather thanambulance-assigned codes, which are probably lessaccurate. The Supplement provides flowcharts for thesample construction of each diagnosis group (Appen-dix Figure 1 to Appendix Figure 4 of the Supplement)and the diagnosis codes used to define the sample(Appendix 2 of the Supplement).
Among trauma patients, we focused on majortrauma, defined as a New Injury Severity Score greaterthan 15 (7% of scored cases) (23, 24), which comprised79 687 patients (BLS, 30 919; ALS, 48 768). Samplesizes for the other diagnoses were 119 989 patients forstroke (BLS, 19 985; ALS, 100 004), 114 469 for AMI(BLS, 14 434; ALS, 100 035), and 82 530 for respiratoryfailure (BLS, 9502; ALS, 73 028).
Identification of ALS and BLS ServicesWe identified whether a patient received BLS or
ALS using the Healthcare Common Procedure CodingSystem code on the ambulance claim. Although pro-vider training, local protocols, and clinical interventionsare not recorded, the ambulance provider level indi-cates the set of interventions and transport times thatare characteristic of that level.
Of note, even if ALS providers delivered only BLSinterventions, Medicare allows billing at the ALS level ifassessment by ALS-trained providers was considerednecessary at dispatch. On the basis of telephone inter-views about cardiac arrest with emergency medical ser-vices officials in 45 states, we established that symp-toms, such as chest pain or difficulty breathing (whichgenerally precede the conditions we studied other thantrauma), would result in BLS dispatch only if ALS wereunavailable within a reasonable amount of time be-cause of travel distance, attendance at another call, ora staffing shortage. Although we did not ask abouttrauma-related conditions in our interviews, we believethe higher proportion of BLS patients in trauma relativeto other diagnosis groups reflects more emphasis ondispatch of the nearest ambulance. Given the high se-verity of the medical conditions under study, the policyof allowing ALS billing if ALS was considered necessaryat dispatch, and reimbursement differences betweenBLS and ALS, it is unlikely that the BLS patients in our
EDITORS' NOTES
Context
Although advanced life support (ALS) is the predomi-nant means of providing care to patients requiringemergency medical transportation, whether outcomesafter ALS are better than those after basic life support(BLS) is not known.
Contribution
In this national study of patients requiring emergencytransport to a hospital for any of several common diag-noses, neurologic function and survival was better afterBLS in analyses that controlled for differences amongthe patients and differences among counties in theirutilization of ALS versus BLS.
Caution
The available data cannot provide all the clinical detailsof the care required or provided.
Implication
Compared with BLS, ALS may be associated with worseoutcomes after emergency medical transport.
This online-first version will be replaced with a final version when it is included in the issue. The final version may differ in small ways.
ORIGINAL RESEARCH Outcomes of Basic Versus Advanced Life Support
682 Annals of Internal Medicine www.annals.org
Downloaded From: http://annals.org/ by a Ohio State Univ User on 10/14/2015

sample were actually treated by providers trained inALS.
Outcome MeasuresOur primary outcome measures were survival at 30,
90, 365, and 730 days after ambulance transport. Wealso created an indicator for poor neurologic function-ing based on the presence of International Classifica-tion of Diseases, Ninth Revision, Clinical Modification,diagnosis codes for anoxic brain injury (348.1), coma(700.01), persistent vegetative state (780.03), or braindeath (348.82); from this information, we inferred Ce-rebral Performance Categories 4 and 5 (25).
Statistical AnalysisWe compared unadjusted survival between ALS
and BLS. To address confounding due to observablepatient, hospital, and geographic characteristics, wecompared outcomes between ALS and BLS using pro-pensity score–based balancing weights (Appendix 6 ofthe Supplement). For each diagnosis, we first modeledthe probability that a beneficiary received ALS usinglogistic regression as a function of the type of pickuplocation (for example, residence or outdoor scene);mileage from the pickup location to a hospital; countyof residence; and a range of individual and ZIP codecharacteristics, including local hospital quality (Appen-
dixes 5 to 7 of the Supplement). From these models,we derived weights (26) that balanced the BLS and ALSdistributions over the observed set of covariates andcompared weighted BLS and ALS outcomes. A key as-sumption in this analysis is that balance over observedcovariates also applies to potential unobserved con-founders, especially severity. This assumption is plausi-ble because, with the exception of trauma, BLS provid-ers would generally be dispatched only when ALSproviders are unavailable, so the decision to dispatchALS providers may not be correlated with unobservedillness severity. For trauma, we included a severity mea-sure in the analysis. Further, because the weighted dis-tributions of ALS and BLS are balanced over counties,distributions of county-level characteristics, whetherobserved or unobserved, were balanced in this analy-sis.
We also conducted another analysis that reliedsolely on variation in ALS penetration across counties(Figure 1) and thus did not need to assume that thewithin-county distribution of unobserved illness severityis similar for ALS and BLS patients. We predicted theprobability of ALS use for each patient as a function ofALS rates in the county for patients with other diagno-ses. This approach estimated survival differences be-
Figure 1. Country-level ALS penetration rates for major trauma.
0.25
0.50
0.75
ALS penetration rate
These rates are for a standardized population with major trauma but are not derived from characteristics of trauma patients. Rather, they arepredicted from rates of ALS use in other diagnosis groups in each county. ALS = advanced life support.
This online-first version will be replaced with a final version when it is included in the issue. The final version may differ in small ways.
Outcomes of Basic Versus Advanced Life Support ORIGINAL RESEARCH
www.annals.org Annals of Internal Medicine 683
Downloaded From: http://annals.org/ by a Ohio State Univ User on 10/14/2015
tween ALS and BLS using only variation in county-levelrates of ALS use that are presumptively driven by localambulance supply and dispatch protocols common toall included diagnoses rather than by unobserved ill-ness severity of persons in the focal diagnosis. We ad-justed estimates with the same covariates we used inthe propensity score analysis.
This latter approach formally constitutes an instru-mental variable analysis (27–29) (Appendix 8 of theSupplement). In effect, it uses the varying penetra-tion of ALS across counties to implement a quasi-experimental design that compares patients who aretreated with ALS in high-penetration counties becausean ALS ambulance was available at the time of theirhealth event with observably similar patients in low-penetration counties who are treated with BLS becauseno ALS ambulance was reasonably available at the timeof the event (27). This approach requires the assump-tion that county variation in ALS use for other condi-tions is correlated with an individual patient's likelihoodof receiving ALS but is otherwise uncorrelated with thatpatient's clinical outcome. Because this analysis usesbetween-county variation in ALS penetration ratherthan within-county variation in the type of ambulancedispatched, the size of the estimated differences is notthe same as in the propensity score analyses and theprecision is less.
We did a falsification analysis to test the assump-tion that the rate of ALS use in a county is not associ-ated with the quality of hospital care, which may inde-pendently influence outcomes (30). To do so, werepeated the instrumental variable analysis with an out-come of risk-adjusted nonemergency inpatient surgicalmortality and, separately, an outcome of risk-adjustednonemergency intensive care unit mortality, both ofwhich are unlikely to be affected by ALS penetration ina county if ALS penetration is not correlated with unob-served quality of hospital care.
In both the propensity score and instrumental vari-able analyses, we compared BLS and ALS outcomeswith 5%-level t tests. We plotted Kaplan–Meier survivalcurves, which were censored at the end of our data.Finally, we did prespecified subgroup analyses oftrauma patients who experienced falls (Appendix 2 ofthe Supplement), the most common external causeof trauma (75% of patients), and patients with relativelylow (16 to 24) and high (25 to 75) injury severity scores.The Supplement gives modeling details (Appendixes 6to 8 of the Supplement) and multiple sensitivity analy-ses (Appendixes 9 to 16 of the Supplement).
The research protocol was approved by Institu-tional Review Boards at Harvard University and the Na-tional Bureau of Economic Research. Analyses weredone using SAS, version 9.3 (SAS Institute); R, version3.0.2 (R Foundation for Statistical Computing); andStata, version 13.1 (StataCorp).
Role of the Funding SourceThe National Science Foundation, Agency for
Healthcare Research and Quality, and National Insti-
tutes of Health played no role in design, conduct, orreporting of the study.
RESULTSPatient Characteristics
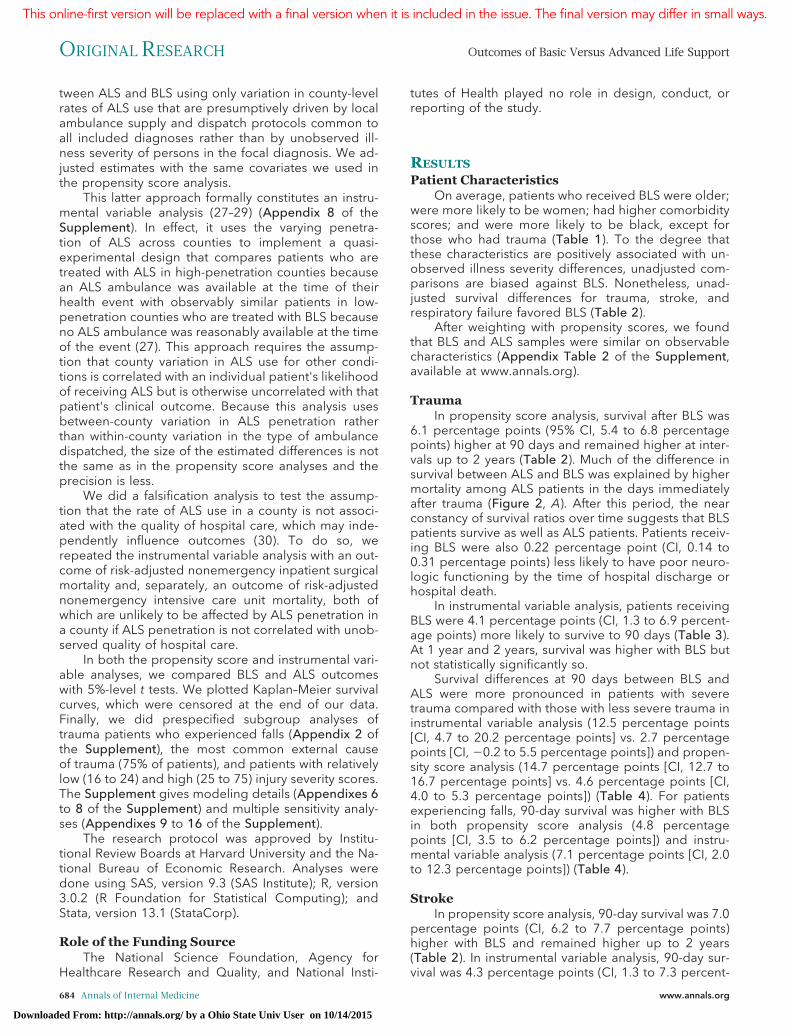
On average, patients who received BLS were older;were more likely to be women; had higher comorbidityscores; and were more likely to be black, except forthose who had trauma (Table 1). To the degree thatthese characteristics are positively associated with un-observed illness severity differences, unadjusted com-parisons are biased against BLS. Nonetheless, unad-justed survival differences for trauma, stroke, andrespiratory failure favored BLS (Table 2).
After weighting with propensity scores, we foundthat BLS and ALS samples were similar on observablecharacteristics (Appendix Table 2 of the Supplement,available at www.annals.org).
TraumaIn propensity score analysis, survival after BLS was
6.1 percentage points (95% CI, 5.4 to 6.8 percentagepoints) higher at 90 days and remained higher at inter-vals up to 2 years (Table 2). Much of the difference insurvival between ALS and BLS was explained by highermortality among ALS patients in the days immediatelyafter trauma (Figure 2, A). After this period, the nearconstancy of survival ratios over time suggests that BLSpatients survive as well as ALS patients. Patients receiv-ing BLS were also 0.22 percentage point (CI, 0.14 to0.31 percentage points) less likely to have poor neuro-logic functioning by the time of hospital discharge orhospital death.
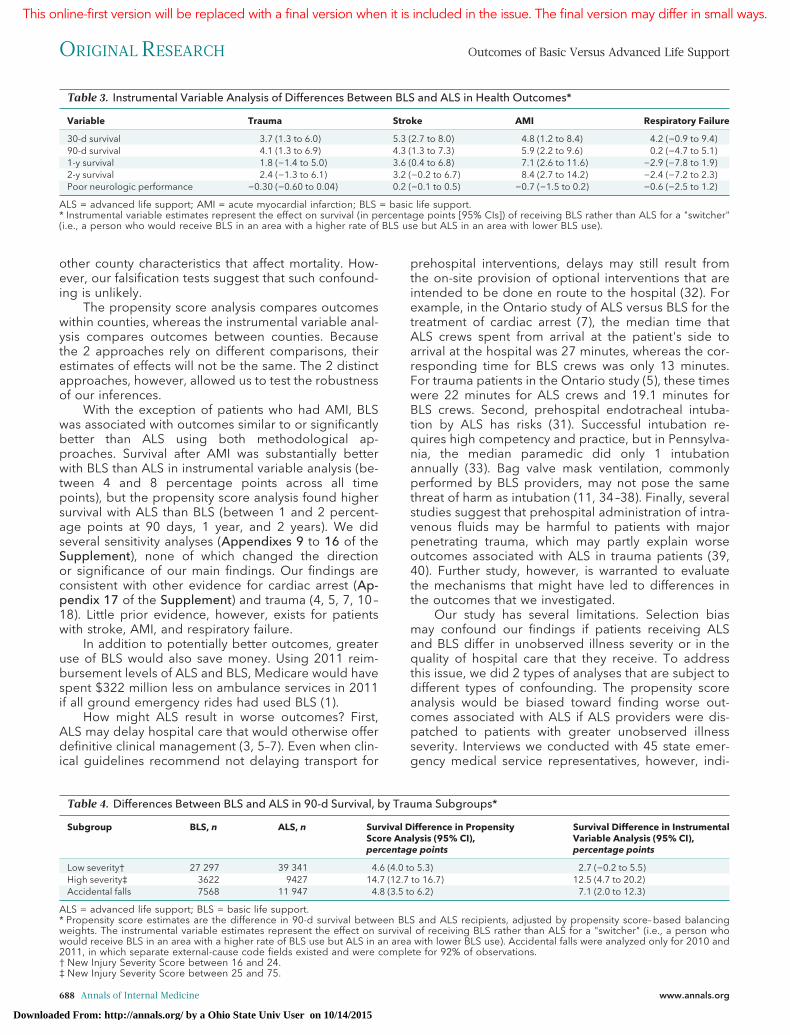
In instrumental variable analysis, patients receivingBLS were 4.1 percentage points (CI, 1.3 to 6.9 percent-age points) more likely to survive to 90 days (Table 3).At 1 year and 2 years, survival was higher with BLS butnot statistically significantly so.
Survival differences at 90 days between BLS andALS were more pronounced in patients with severetrauma compared with those with less severe trauma ininstrumental variable analysis (12.5 percentage points[CI, 4.7 to 20.2 percentage points] vs. 2.7 percentagepoints [CI, �0.2 to 5.5 percentage points]) and propen-sity score analysis (14.7 percentage points [CI, 12.7 to16.7 percentage points] vs. 4.6 percentage points [CI,4.0 to 5.3 percentage points]) (Table 4). For patientsexperiencing falls, 90-day survival was higher with BLSin both propensity score analysis (4.8 percentagepoints [CI, 3.5 to 6.2 percentage points]) and instru-mental variable analysis (7.1 percentage points [CI, 2.0to 12.3 percentage points]) (Table 4).
StrokeIn propensity score analysis, 90-day survival was 7.0
percentage points (CI, 6.2 to 7.7 percentage points)higher with BLS and remained higher up to 2 years(Table 2). In instrumental variable analysis, 90-day sur-vival was 4.3 percentage points (CI, 1.3 to 7.3 percent-
This online-first version will be replaced with a final version when it is included in the issue. The final version may differ in small ways.
ORIGINAL RESEARCH Outcomes of Basic Versus Advanced Life Support
684 Annals of Internal Medicine www.annals.org
Downloaded From: http://annals.org/ by a Ohio State Univ User on 10/14/2015
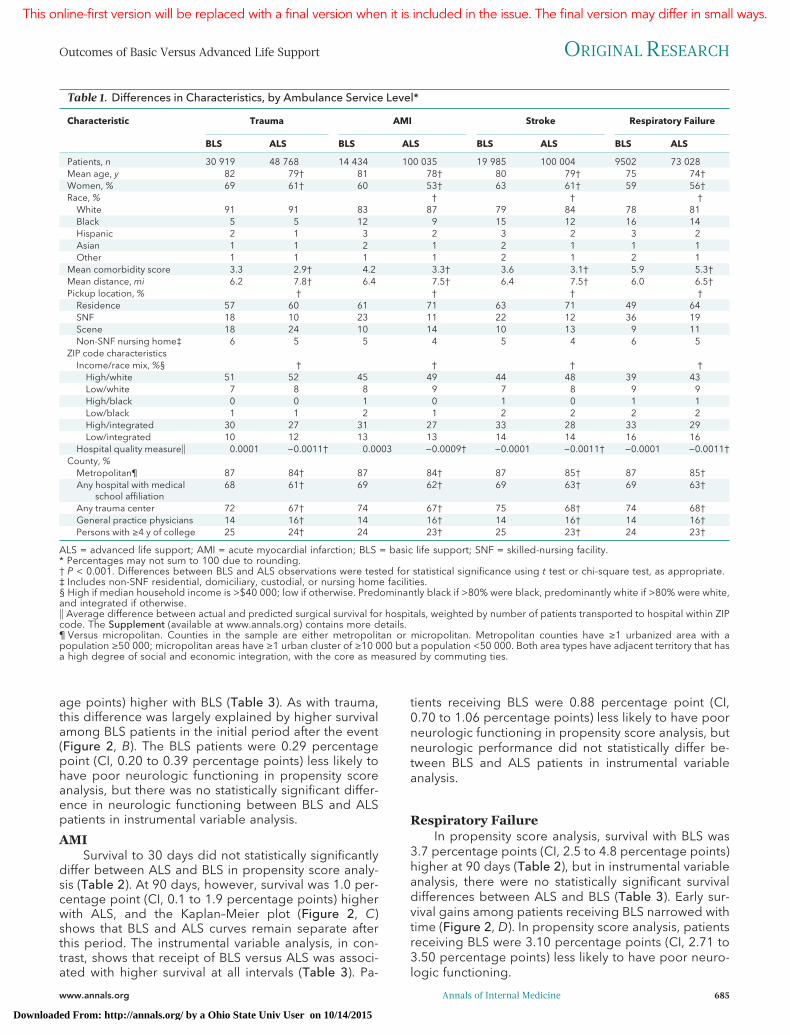
age points) higher with BLS (Table 3). As with trauma,this difference was largely explained by higher survivalamong BLS patients in the initial period after the event(Figure 2, B). The BLS patients were 0.29 percentagepoint (CI, 0.20 to 0.39 percentage points) less likely tohave poor neurologic functioning in propensity scoreanalysis, but there was no statistically significant differ-ence in neurologic functioning between BLS and ALSpatients in instrumental variable analysis.
AMISurvival to 30 days did not statistically significantly
differ between ALS and BLS in propensity score analy-sis (Table 2). At 90 days, however, survival was 1.0 per-centage point (CI, 0.1 to 1.9 percentage points) higherwith ALS, and the Kaplan–Meier plot (Figure 2, C)shows that BLS and ALS curves remain separate afterthis period. The instrumental variable analysis, in con-trast, shows that receipt of BLS versus ALS was associ-ated with higher survival at all intervals (Table 3). Pa-
tients receiving BLS were 0.88 percentage point (CI,0.70 to 1.06 percentage points) less likely to have poorneurologic functioning in propensity score analysis, butneurologic performance did not statistically differ be-tween BLS and ALS patients in instrumental variableanalysis.
Respiratory FailureIn propensity score analysis, survival with BLS was
3.7 percentage points (CI, 2.5 to 4.8 percentage points)higher at 90 days (Table 2), but in instrumental variableanalysis, there were no statistically significant survivaldifferences between ALS and BLS (Table 3). Early sur-vival gains among patients receiving BLS narrowed withtime (Figure 2, D). In propensity score analysis, patientsreceiving BLS were 3.10 percentage points (CI, 2.71 to3.50 percentage points) less likely to have poor neuro-logic functioning.
Table 1. Differences in Characteristics, by Ambulance Service Level*
Characteristic Trauma AMI Stroke Respiratory Failure
BLS ALS BLS ALS BLS ALS BLS ALS
Patients, n 30 919 48 768 14 434 100 035 19 985 100 004 9502 73 028Mean age, y 82 79† 81 78† 80 79† 75 74†Women, % 69 61† 60 53† 63 61† 59 56†Race, % † † †
White 91 91 83 87 79 84 78 81Black 5 5 12 9 15 12 16 14Hispanic 2 1 3 2 3 2 3 2Asian 1 1 2 1 2 1 1 1Other 1 1 1 1 2 1 2 1
Mean comorbidity score 3.3 2.9† 4.2 3.3† 3.6 3.1† 5.9 5.3†Mean distance, mi 6.2 7.8† 6.4 7.5† 6.4 7.5† 6.0 6.5†Pickup location, % † † † †
Residence 57 60 61 71 63 71 49 64SNF 18 10 23 11 22 12 36 19Scene 18 24 10 14 10 13 9 11Non-SNF nursing home‡ 6 5 5 4 5 4 6 5
ZIP code characteristicsIncome/race mix, %§ † † † †
High/white 51 52 45 49 44 48 39 43Low/white 7 8 8 9 7 8 9 9High/black 0 0 1 0 1 0 1 1Low/black 1 1 2 1 2 2 2 2High/integrated 30 27 31 27 33 28 33 29Low/integrated 10 12 13 13 14 14 16 16
Hospital quality measure�� 0.0001 −0.0011† 0.0003 −0.0009† −0.0001 −0.0011† −0.0001 −0.0011†County, %
Metropolitan¶ 87 84† 87 84† 87 85† 87 85†Any hospital with medical
school affiliation68 61† 69 62† 69 63† 69 63†
Any trauma center 72 67† 74 67† 75 68† 74 68†General practice physicians 14 16† 14 16† 14 16† 14 16†Persons with ≥4 y of college 25 24† 24 23† 25 23† 24 23†
ALS = advanced life support; AMI = acute myocardial infarction; BLS = basic life support; SNF = skilled-nursing facility.* Percentages may not sum to 100 due to rounding.† P < 0.001. Differences between BLS and ALS observations were tested for statistical significance using t test or chi-square test, as appropriate.‡ Includes non-SNF residential, domiciliary, custodial, or nursing home facilities.§ High if median household income is >$40 000; low if otherwise. Predominantly black if >80% were black, predominantly white if >80% were white,and integrated if otherwise.�� Average difference between actual and predicted surgical survival for hospitals, weighted by number of patients transported to hospital within ZIPcode. The Supplement (available at www.annals.org) contains more details.¶ Versus micropolitan. Counties in the sample are either metropolitan or micropolitan. Metropolitan counties have ≥1 urbanized area with apopulation ≥50 000; micropolitan areas have ≥1 urban cluster of ≥10 000 but a population <50 000. Both area types have adjacent territory that hasa high degree of social and economic integration, with the core as measured by commuting ties.
This online-first version will be replaced with a final version when it is included in the issue. The final version may differ in small ways.
Outcomes of Basic Versus Advanced Life Support ORIGINAL RESEARCH
www.annals.org Annals of Internal Medicine 685
Downloaded From: http://annals.org/ by a Ohio State Univ User on 10/14/2015
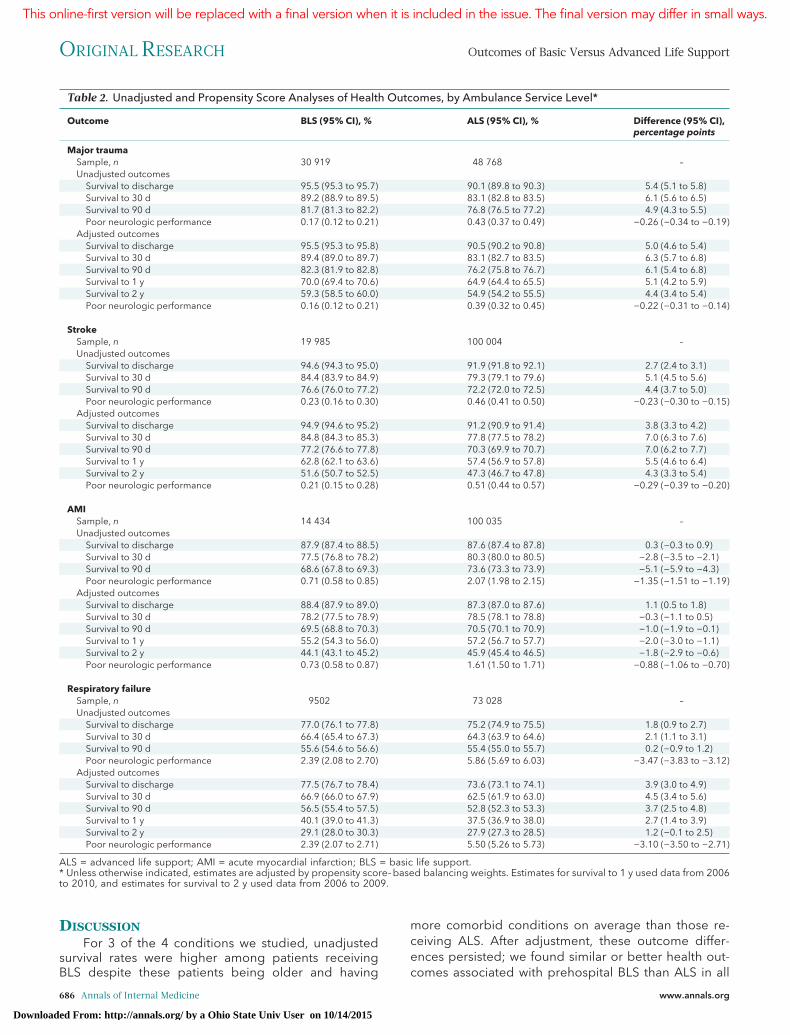
DISCUSSIONFor 3 of the 4 conditions we studied, unadjusted
survival rates were higher among patients receivingBLS despite these patients being older and having
more comorbid conditions on average than those re-ceiving ALS. After adjustment, these outcome differ-ences persisted; we found similar or better health out-comes associated with prehospital BLS than ALS in all
Table 2. Unadjusted and Propensity Score Analyses of Health Outcomes, by Ambulance Service Level*
Outcome BLS (95% CI), % ALS (95% CI), % Difference (95% CI),percentage points
Major traumaSample, n 30 919 48 768 –Unadjusted outcomes
Survival to discharge 95.5 (95.3 to 95.7) 90.1 (89.8 to 90.3) 5.4 (5.1 to 5.8)Survival to 30 d 89.2 (88.9 to 89.5) 83.1 (82.8 to 83.5) 6.1 (5.6 to 6.5)Survival to 90 d 81.7 (81.3 to 82.2) 76.8 (76.5 to 77.2) 4.9 (4.3 to 5.5)Poor neurologic performance 0.17 (0.12 to 0.21) 0.43 (0.37 to 0.49) −0.26 (−0.34 to −0.19)
Adjusted outcomesSurvival to discharge 95.5 (95.3 to 95.8) 90.5 (90.2 to 90.8) 5.0 (4.6 to 5.4)Survival to 30 d 89.4 (89.0 to 89.7) 83.1 (82.7 to 83.5) 6.3 (5.7 to 6.8)Survival to 90 d 82.3 (81.9 to 82.8) 76.2 (75.8 to 76.7) 6.1 (5.4 to 6.8)Survival to 1 y 70.0 (69.4 to 70.6) 64.9 (64.4 to 65.5) 5.1 (4.2 to 5.9)Survival to 2 y 59.3 (58.5 to 60.0) 54.9 (54.2 to 55.5) 4.4 (3.4 to 5.4)Poor neurologic performance 0.16 (0.12 to 0.21) 0.39 (0.32 to 0.45) −0.22 (−0.31 to −0.14)
StrokeSample, n 19 985 100 004 –Unadjusted outcomes
Survival to discharge 94.6 (94.3 to 95.0) 91.9 (91.8 to 92.1) 2.7 (2.4 to 3.1)Survival to 30 d 84.4 (83.9 to 84.9) 79.3 (79.1 to 79.6) 5.1 (4.5 to 5.6)Survival to 90 d 76.6 (76.0 to 77.2) 72.2 (72.0 to 72.5) 4.4 (3.7 to 5.0)Poor neurologic performance 0.23 (0.16 to 0.30) 0.46 (0.41 to 0.50) −0.23 (−0.30 to −0.15)
Adjusted outcomesSurvival to discharge 94.9 (94.6 to 95.2) 91.2 (90.9 to 91.4) 3.8 (3.3 to 4.2)Survival to 30 d 84.8 (84.3 to 85.3) 77.8 (77.5 to 78.2) 7.0 (6.3 to 7.6)Survival to 90 d 77.2 (76.6 to 77.8) 70.3 (69.9 to 70.7) 7.0 (6.2 to 7.7)Survival to 1 y 62.8 (62.1 to 63.6) 57.4 (56.9 to 57.8) 5.5 (4.6 to 6.4)Survival to 2 y 51.6 (50.7 to 52.5) 47.3 (46.7 to 47.8) 4.3 (3.3 to 5.4)Poor neurologic performance 0.21 (0.15 to 0.28) 0.51 (0.44 to 0.57) −0.29 (−0.39 to −0.20)
AMISample, n 14 434 100 035 –Unadjusted outcomes
Survival to discharge 87.9 (87.4 to 88.5) 87.6 (87.4 to 87.8) 0.3 (−0.3 to 0.9)Survival to 30 d 77.5 (76.8 to 78.2) 80.3 (80.0 to 80.5) −2.8 (−3.5 to −2.1)Survival to 90 d 68.6 (67.8 to 69.3) 73.6 (73.3 to 73.9) −5.1 (−5.9 to −4.3)Poor neurologic performance 0.71 (0.58 to 0.85) 2.07 (1.98 to 2.15) −1.35 (−1.51 to −1.19)
Adjusted outcomesSurvival to discharge 88.4 (87.9 to 89.0) 87.3 (87.0 to 87.6) 1.1 (0.5 to 1.8)Survival to 30 d 78.2 (77.5 to 78.9) 78.5 (78.1 to 78.8) −0.3 (−1.1 to 0.5)Survival to 90 d 69.5 (68.8 to 70.3) 70.5 (70.1 to 70.9) −1.0 (−1.9 to −0.1)Survival to 1 y 55.2 (54.3 to 56.0) 57.2 (56.7 to 57.7) −2.0 (−3.0 to −1.1)Survival to 2 y 44.1 (43.1 to 45.2) 45.9 (45.4 to 46.5) −1.8 (−2.9 to −0.6)Poor neurologic performance 0.73 (0.58 to 0.87) 1.61 (1.50 to 1.71) −0.88 (−1.06 to −0.70)
Respiratory failureSample, n 9502 73 028 –Unadjusted outcomes
Survival to discharge 77.0 (76.1 to 77.8) 75.2 (74.9 to 75.5) 1.8 (0.9 to 2.7)Survival to 30 d 66.4 (65.4 to 67.3) 64.3 (63.9 to 64.6) 2.1 (1.1 to 3.1)Survival to 90 d 55.6 (54.6 to 56.6) 55.4 (55.0 to 55.7) 0.2 (−0.9 to 1.2)Poor neurologic performance 2.39 (2.08 to 2.70) 5.86 (5.69 to 6.03) −3.47 (−3.83 to −3.12)
Adjusted outcomesSurvival to discharge 77.5 (76.7 to 78.4) 73.6 (73.1 to 74.1) 3.9 (3.0 to 4.9)Survival to 30 d 66.9 (66.0 to 67.9) 62.5 (61.9 to 63.0) 4.5 (3.4 to 5.6)Survival to 90 d 56.5 (55.4 to 57.5) 52.8 (52.3 to 53.3) 3.7 (2.5 to 4.8)Survival to 1 y 40.1 (39.0 to 41.3) 37.5 (36.9 to 38.0) 2.7 (1.4 to 3.9)Survival to 2 y 29.1 (28.0 to 30.3) 27.9 (27.3 to 28.5) 1.2 (−0.1 to 2.5)Poor neurologic performance 2.39 (2.07 to 2.71) 5.50 (5.26 to 5.73) −3.10 (−3.50 to −2.71)
ALS = advanced life support; AMI = acute myocardial infarction; BLS = basic life support.* Unless otherwise indicated, estimates are adjusted by propensity score–based balancing weights. Estimates for survival to 1 y used data from 2006to 2010, and estimates for survival to 2 y used data from 2006 to 2009.
This online-first version will be replaced with a final version when it is included in the issue. The final version may differ in small ways.
ORIGINAL RESEARCH Outcomes of Basic Versus Advanced Life Support
686 Annals of Internal Medicine www.annals.org
Downloaded From: http://annals.org/ by a Ohio State Univ User on 10/14/2015

of our analyses for major trauma, stroke, and respira-tory failure. Because these high-acuity conditions ne-cessitate early optimization of care, one would have ex-pected any advantage of ALS over BLS to manifest itselfin these diagnoses. Although ALS may be expected toimprove outcomes because of early treatment, the op-posite may occur in practice if ALS is associated withdelays in hospital management or iatrogenic injury (3,5–7, 31).
We used 2 methodological approaches to adjustfor potential confounders of comparisons between BLSand ALS outcomes. One analysis used propensity score
methods to balance observed characteristics. This ap-proach is susceptible to confounding by any unob-served patient characteristics associated with survivaland ALS use; however, because ambulance dispatchprotocols prioritize ALS for the conditions we studied,such individual-level confounding is plausibly minimal.Our second approach used the instrumental variable ofcounty-level variation in overall ALS prevalence to pre-dict the likelihood that a patient would receive ALS.This approach is less susceptible to confounding by un-observed patient characteristics but is subject to con-founding by associations between rates of ALS use and
Figure 2. Kaplan–Meier analysis of survival after emergency event, by ambulance service level.
0 10 20 30 40 50 60 70 80 90
0.75
0.80
0.85
0.90
0.95
1.00
Days
Prob
abili
ty o
f Su
rviv
al
0 500 1000 1500 2000
0.2
0.6
1.0
0 10 20 30 40 50 60 70 80 90
0.70
0.75
0.80
0.85
0.90
0.95
1.00
Days
Prob
abili
ty o
f Su
rviv
al
0 500 1000 1500 2000
0.2
0.6
1.0
0 10 20 30 40 50 60 70 80 90
0.70
0.75
0.80
0.85
0.90
0.95
1.00
Days
Prob
abili
ty o
f Su
rviv
al
0 500 1000 1500 2000
0.2
0.6
1.0
0 10 20 30 40 50 60 70 80 90
0.5
0.6
0.7
0.8
0.9
1.0
Days
Prob
abili
ty o
f Su
rviv
al
BLS ALS
0 500 1000 1500 2000
0.0
0.5
1.0
A B
C D
The insets show the survival probability over the full observational period, and the main graphs shows it for the first 90 d. Data include emergencymedical events between 1 January 2006 and 2 October 2011. Mortality was monitored until 31 December 2011, when the data were censored, andthus there was follow-up to at least 90 days for each beneficiary. Plots use different y-axis scales. ALS = advanced life support; BLS = basic lifesupport. A. Trauma. B. Stroke. C. Acute myocardial infarction. D. Respiratory failure.
This online-first version will be replaced with a final version when it is included in the issue. The final version may differ in small ways.
Outcomes of Basic Versus Advanced Life Support ORIGINAL RESEARCH
www.annals.org Annals of Internal Medicine 687
Downloaded From: http://annals.org/ by a Ohio State Univ User on 10/14/2015
other county characteristics that affect mortality. How-ever, our falsification tests suggest that such confound-ing is unlikely.
The propensity score analysis compares outcomeswithin counties, whereas the instrumental variable anal-ysis compares outcomes between counties. Becausethe 2 approaches rely on different comparisons, theirestimates of effects will not be the same. The 2 distinctapproaches, however, allowed us to test the robustnessof our inferences.
With the exception of patients who had AMI, BLSwas associated with outcomes similar to or significantlybetter than ALS using both methodological ap-proaches. Survival after AMI was substantially betterwith BLS than ALS in instrumental variable analysis (be-tween 4 and 8 percentage points across all timepoints), but the propensity score analysis found highersurvival with ALS than BLS (between 1 and 2 percent-age points at 90 days, 1 year, and 2 years). We didseveral sensitivity analyses (Appendixes 9 to 16 of theSupplement), none of which changed the directionor significance of our main findings. Our findings areconsistent with other evidence for cardiac arrest (Ap-pendix 17 of the Supplement) and trauma (4, 5, 7, 10–18). Little prior evidence, however, exists for patientswith stroke, AMI, and respiratory failure.
In addition to potentially better outcomes, greateruse of BLS would also save money. Using 2011 reim-bursement levels of ALS and BLS, Medicare would havespent $322 million less on ambulance services in 2011if all ground emergency rides had used BLS (1).
How might ALS result in worse outcomes? First,ALS may delay hospital care that would otherwise offerdefinitive clinical management (3, 5–7). Even when clin-ical guidelines recommend not delaying transport for
prehospital interventions, delays may still result fromthe on-site provision of optional interventions that areintended to be done en route to the hospital (32). Forexample, in the Ontario study of ALS versus BLS for thetreatment of cardiac arrest (7), the median time thatALS crews spent from arrival at the patient's side toarrival at the hospital was 27 minutes, whereas the cor-responding time for BLS crews was only 13 minutes.For trauma patients in the Ontario study (5), these timeswere 22 minutes for ALS crews and 19.1 minutes forBLS crews. Second, prehospital endotracheal intuba-tion by ALS has risks (31). Successful intubation re-quires high competency and practice, but in Pennsylva-nia, the median paramedic did only 1 intubationannually (33). Bag valve mask ventilation, commonlyperformed by BLS providers, may not pose the samethreat of harm as intubation (11, 34–38). Finally, severalstudies suggest that prehospital administration of intra-venous fluids may be harmful to patients with majorpenetrating trauma, which may partly explain worseoutcomes associated with ALS in trauma patients (39,40). Further study, however, is warranted to evaluatethe mechanisms that might have led to differences inthe outcomes that we investigated.
Our study has several limitations. Selection biasmay confound our findings if patients receiving ALSand BLS differ in unobserved illness severity or in thequality of hospital care that they receive. To addressthis issue, we did 2 types of analyses that are subject todifferent types of confounding. The propensity scoreanalysis would be biased toward finding worse out-comes associated with ALS if ALS providers were dis-patched to patients with greater unobserved illnessseverity. Interviews we conducted with 45 state emer-gency medical service representatives, however, indi-
Table 3. Instrumental Variable Analysis of Differences Between BLS and ALS in Health Outcomes*
Variable Trauma Stroke AMI Respiratory Failure
30-d survival 3.7 (1.3 to 6.0) 5.3 (2.7 to 8.0) 4.8 (1.2 to 8.4) 4.2 (−0.9 to 9.4)90-d survival 4.1 (1.3 to 6.9) 4.3 (1.3 to 7.3) 5.9 (2.2 to 9.6) 0.2 (−4.7 to 5.1)1-y survival 1.8 (−1.4 to 5.0) 3.6 (0.4 to 6.8) 7.1 (2.6 to 11.6) −2.9 (−7.8 to 1.9)2-y survival 2.4 (−1.3 to 6.1) 3.2 (−0.2 to 6.7) 8.4 (2.7 to 14.2) −2.4 (−7.2 to 2.3)Poor neurologic performance −0.30 (−0.60 to 0.04) 0.2 (−0.1 to 0.5) −0.7 (−1.5 to 0.2) −0.6 (−2.5 to 1.2)
ALS = advanced life support; AMI = acute myocardial infarction; BLS = basic life support.* Instrumental variable estimates represent the effect on survival (in percentage points [95% CIs]) of receiving BLS rather than ALS for a "switcher"(i.e., a person who would receive BLS in an area with a higher rate of BLS use but ALS in an area with lower BLS use).
Table 4. Differences Between BLS and ALS in 90-d Survival, by Trauma Subgroups*
Subgroup BLS, n ALS, n Survival Difference in PropensityScore Analysis (95% CI),percentage points
Survival Difference in InstrumentalVariable Analysis (95% CI),percentage points
Low severity† 27 297 39 341 4.6 (4.0 to 5.3) 2.7 (−0.2 to 5.5)High severity‡ 3622 9427 14.7 (12.7 to 16.7) 12.5 (4.7 to 20.2)Accidental falls 7568 11 947 4.8 (3.5 to 6.2) 7.1 (2.0 to 12.3)
ALS = advanced life support; BLS = basic life support.* Propensity score estimates are the difference in 90-d survival between BLS and ALS recipients, adjusted by propensity score–based balancingweights. The instrumental variable estimates represent the effect on survival of receiving BLS rather than ALS for a "switcher" (i.e., a person whowould receive BLS in an area with a higher rate of BLS use but ALS in an area with lower BLS use). Accidental falls were analyzed only for 2010 and2011, in which separate external-cause code fields existed and were complete for 92% of observations.† New Injury Severity Score between 16 and 24.‡ New Injury Severity Score between 25 and 75.
This online-first version will be replaced with a final version when it is included in the issue. The final version may differ in small ways.
ORIGINAL RESEARCH Outcomes of Basic Versus Advanced Life Support
688 Annals of Internal Medicine www.annals.org
Downloaded From: http://annals.org/ by a Ohio State Univ User on 10/14/2015
cate that, if available, ALS would routinely be dis-patched for many of the conditions that weinvestigated. As a result, the decision to dispatch ALSproviders may plausibly be uncorrelated with unob-served illness severity for conditions other than trauma;for trauma, we controlled for severity. Moreover, BLSpatients were older and had more comorbidities thanALS patients, which suggests that any unobserved dif-ferences in severity may actually have biased our re-sults against BLS.
The instrumental variable analysis could be con-founded if counties with poorer quality hospital carehad higher ALS penetration. Our falsification testsfound no association of ALS penetration with nonemer-gent surgical mortality or nonemergent intensive careunit mortality at the county level. Although these testsincrease confidence in our results, we had no way ofdirectly assessing the quality of care for emergency pa-tients that was not susceptible to potential confoundingby characteristics of ambulance services.
Estimates and significance tests under the propen-sity score analysis could be subject to bias if ALS pro-viders evaluated a patient and then selectively pro-vided care and billed at the BLS level for less acutecases. Given substantial reimbursement differences be-tween ALS and BLS, it is unlikely that ALS providersbilled at BLS rates because Medicare allows billing atthe ALS level if assessment by ALS-trained providerswas considered necessary at dispatch. Further, analysisof survival differences in 2005 claims, which distinguishALS claims billed at the BLS level, showed little sensi-tivity to whether this small group was categorized asALS or BLS (Appendix 15 of the Supplement). Finally,significance tests under the instrumental variable anal-ysis would still be valid in this case as long as higherrates of ALS claims reflect higher utilization rates of ALSproviders, although estimates of the effect magnitudemight be biased.
Because our sample included only patients withhospital claims, another potential limitation may be thatmore BLS patients died at the scene or en route to thehospital. In sensitivity analyses that considered thesecases, however, the direction and significance of ourfindings were unchanged (Appendixes 10 and 11 ofthe Supplement).
Our results are limited to the U.S. health care sys-tem and the Medicare population in particular. Ourcomparisons may not generalize to countries in whichprehospital ALS is provided by physicians. Finally, ad-ministrative data may not always accurately reflect diag-noses, comorbidities, or neurologic performance.
In conclusion, our findings suggest that survival islonger with BLS and that BLS may also offer benefits fornonfatal outcomes.
From University of Chicago, Chicago, Illinois, and HarvardMedical School, Boston, Massachusetts.
Note: Dr. Sanghavi had full access to all of the data in thestudy and takes responsibility for the integrity of the data andthe accuracy of the data analysis. The data in this article were
obtained from the Centers for Medicare & Medicaid Services(CMS) within the U.S. Department of Health and Human Ser-vices. The authors' data use agreement with CMS does notallow sharing of individual records. These data can be ob-tained by others through CMS. However, if there are quanti-ties of interest relevant to the paper that are not in the article,the authors can share results at a higher level of aggregationas long as the CMS data-sharing policies are met.
Grant Support: By a National Science Foundation GraduateResearch Fellowship (Dr. Sanghavi), an Agency for HealthcareResearch and Quality grant (1R36HS022798-01; Dr. Sang-havi), and the National Institutes of Health Early Indepen-dence Award (1DP5OD017897-01; Dr. Jena).
Disclosures: Dr. Jena receives personal fees as a principalconsultant to Precision Health Economics. Dr. Newhouse is adirector of, and holds equity in, Aetna. Authors not namedhere have disclosed no conflicts of interest. Disclosures canalso be viewed at www.acponline.org/authors/icmje/ConflictOfInterestForms.do?msNum=M15-0557.
Reproducible Research Statement: Study protocol: Not appli-cable. Statistical code: Available from Dr. Sanghavi (e-mail,[email protected]). Data set: Availablefrom www.resdac.org.
Requests for Single Reprints: Prachi Sanghavi, PhD, Depart-ment of Public Health Sciences, The University of Chicago,5841 South Maryland Avenue, MC2000, Chicago, IL 60637;e-mail, [email protected].
Current author addresses and author contributions are avail-able at www.annals.org.
References1. Medicare Payment Advisory Commission. Chapter 7: mandatedreport: Medicare payment for ambulance services. In: Report to theCongress: Medicare and the Health Care Delivery System. Washing-ton, DC: Medicare Payment Advisory Commission; 2013. Accessedat www.medpac.gov/documents/reports/chapter-7-mandated-report-medicare-payment-for-ambulance-services-(june-2013-report).pdf?sfvrsn%20=%202 on 4 November 2014.2. Haas B, Nathens AB. Pro/con debate: is the scoop and run ap-proach the best approach to trauma services organization? Crit Care.2008;12:224. [PMID: 18828868] doi:10.1186/cc69803. Liberman M, Mulder D, Sampalis J. Advanced or basic life supportfor trauma: meta-analysis and critical review of the literature.J Trauma. 2000;49:584-99. [PMID: 11038074]4. Ryynanen OP, Iirola T, Reitala J, Palve H, Malmivaara A. Is ad-vanced life support better than basic life support in prehospital care?A systematic review. Scand J Trauma Resusc Emerg Med. 2010;18:62. [PMID: 21092256] doi:10.1186/1757-7241-18-625. Stiell IG, Nesbitt LP, Pickett W, Munkley D, Spaite DW, Banek J,et al; OPALS Study Group. The OPALS Major Trauma Study: impactof advanced life-support on survival and morbidity. CMAJ. 2008;178:1141-52. [PMID: 18427089] doi:10.1503/cmaj.0711546. Stiell IG, Spaite DW, Field B, Nesbitt LP, Munkley D, Maloney J,et al; OPALS Study Group. Advanced life support for out-of-hospitalrespiratory distress. N Engl J Med. 2007;356:2156-64. [PMID:17522399]7. Stiell IG, Wells GA, Field B, Spaite DW, Nesbitt LP, De Maio VJ,et al; Ontario Prehospital Advanced Life Support Study Group. Ad-vanced cardiac life support in out-of-hospital cardiac arrest. N Engl JMed. 2004;351:647-56. [PMID: 15306666]
This online-first version will be replaced with a final version when it is included in the issue. The final version may differ in small ways.
Outcomes of Basic Versus Advanced Life Support ORIGINAL RESEARCH
www.annals.org Annals of Internal Medicine 689
Downloaded From: http://annals.org/ by a Ohio State Univ User on 10/14/2015

8. Medicare Payment Advisory Commission. Payment Basics: Ambu-lance Services Payment System. Washington, DC: Medicare PaymentAdvisory Commission; 2012. Accessed at www.medpac.gov/documents/payment-basics/ambulance-services-payment-system-14.pdf?sfvrsn%20=%200 on 4 November 2014.9. Isenberg DL, Bissell R. Does advanced life support provide bene-fits to patients?: A literature review. Prehosp Disaster Med. 2005;20:265-70. [PMID: 16128477]10. Jayaraman S, Sethi D. Advanced trauma life support training forambulance crews. Cochrane Database Syst Rev. 2010:CD003109.[PMID: 20091538] doi:10.1002/14651858.CD003109.pub211. Hasegawa K, Hiraide A, Chang Y, Brown DF. Association of pre-hospital advanced airway management with neurologic outcomeand survival in patients with out-of-hospital cardiac arrest. JAMA.2013;309:257-66. [PMID: 23321764] doi:10.1001/jama.2012.18761212. Bur A, Kittler H, Sterz F, Holzer M, Eisenburger P, Oschatz E, et al.Effects of bystander first aid, defibrillation and advanced life supporton neurologic outcome and hospital costs in patients after ventricu-lar fibrillation cardiac arrest. Intensive Care Med. 2001;27:1474-80.[PMID: 11685340]13. Ma MH, Chiang WC, Ko PC, Huang JC, Lin CH, Wang HC, et al.Outcomes from out-of-hospital cardiac arrest in Metropolitan Taipei:does an advanced life support service make a difference? Resuscita-tion. 2007;74:461-9. [PMID: 17462809]14. Liberman M, Mulder D, Lavoie A, Denis R, Sampalis JS. Multi-center Canadian study of prehospital trauma care. Ann Surg. 2003;237:153-60. [PMID: 12560770]15. Sukumaran S, Henry JM, Beard D, Lawrenson R, Gordon MW,O’Donnell JJ, et al. Prehospital trauma management: a nationalstudy of paramedic activities. Emerg Med J. 2005;22:60-3. [PMID:15611550]16. Sanghavi P, Jena AB, Newhouse JP, Zaslavsky AM. Outcomesafter out-of-hospital cardiac arrest treated by basic vs advanced lifesupport. JAMA Intern Med. 2015;175:196-204. [PMID: 25419698]doi:10.1001/jamainternmed.2014.542017. Sasser S, Varghese M, Kellerman A, Lormand JD. Prehospitaltrauma care systems. Geneva, Switzerland: World Health Organiza-tion; 2005. Accessed at http://apps.who.int/iris/bitstream/10665/43167/1/924159294X.pdf on 1 September 2015.18. Sasser SM, Varghese M, Joshipura M, Kellermann A. Preventingdeath and disability through the timely provision of prehospitaltrauma care [Editorial]. Bull World Health Organ. 2006;84:507.[PMID: 16878215]19. Goodman DC, Shipman S, Lan J, Chang C, Wright-Slaughter P.2009 population estimates for ZIP code tabulation areas (ZCTAs) andprimary care service areas (PCSAs). Hanover, NH: The DartmouthInstitute for Health Policy and Clinical Research; 2010. Accessed athttp://datawarehouse.hrsa.gov/DataDownload/PCSA/2009/Population%20Estimates%202009.pdf on 1 September 2015.20. U.S. Department of Health and Human Services; Health Re-sources and Services Administration Health Workforce. Area HealthResources Files (AHRF): national, state and county health resourcesinformation database. Accessed at http://arf.hrsa.gov on 4 Novem-ber 2014.21. Gagne JJ, Glynn RJ, Avorn J, Levin R, Schneeweiss S. A com-bined comorbidity score predicted mortality in elderly patients bet-ter than existing scores. J Clin Epidemiol. 2011;64:749-59. [PMID:21208778] doi:10.1016/j.jclinepi.2010.10.00422. Meredith JW, Evans G, Kilgo PD, MacKenzie E, Osler T, McGwinG, et al. A comparison of the abilities of nine scoring algorithms inpredicting mortality. J Trauma. 2002;53:621-8; discussion 628-9.[PMID: 12394857]
23. Stevenson M, Segui-Gomez M, Lescohier I, Di Scala C,McDonald-Smith G. An overview of the injury severity score and thenew injury severity score. Inj Prev. 2001;7:10-3. [PMID: 11289527]24. MacKenzie EJ, Rivara FP, Jurkovich GJ, Nathens AB, Frey KP,Egleston BL, et al. A national evaluation of the effect of trauma-center care on mortality. N Engl J Med. 2006;354:366-78. [PMID:16436768]25. Safar P. Brain Failure and Resuscitation. New York: ChurchillLivingstone; 1981:155-84.26. Hirano K, Imbens GW. Estimation of causal effects using propen-sity score weighting: An application to data on right heart catheter-ization. Health Serv Outcomes Res Methodol 2001;2:259–278.27. Angrist JD, Imbens GW, Rubin DB. Identification of causal effectsusing instrumental variables. J Am Stat Assoc. 1996;91:444-55.28. Angrist JD, Pischke JS. Mostly Harmless Econometrics: An Em-piricist's Companion. Princeton, New Jersey: Princeton Univ Pr;2009.29. McClellan M, McNeil BJ, Newhouse JP. Does more intensivetreatment of acute myocardial infarction in the elderly reduce mor-tality? Analysis using instrumental variables. JAMA. 1994;272:859-66. [PMID: 8078163]30. Prasad V, Jena AB. Prespecified falsification end points: can theyvalidate true observational associations? JAMA. 2013;309:241-2.[PMID: 23321761] doi:10.1001/jama.2012.9686731. Wang HE, Yealy DM. Managing the airway during cardiac arrest[Editorial]. JAMA. 2013;309:285-6. [PMID: 23321768] doi:10.1001/jama.2012.21699832. Jauch EC, Saver JL, Adams HP Jr, Bruno A, Connors JJ, Demae-rschalk BM, et al; American Heart Association Stroke Council. Guide-lines for the early management of patients with acute ischemicstroke: a guideline for healthcare professionals from the AmericanHeart Association/American Stroke Association. Stroke. 2013;44:870-947. [PMID: 23370205] doi:10.1161/STR.0b013e318284056a33. Wang HE, Kupas DF, Hostler D, Cooney R, Yealy DM, Lave JR.Procedural experience with out-of-hospital endotracheal intubation.Crit Care Med. 2005;33:1718-21. [PMID: 16096447]34. Lecky F, Bryden D, Little R, Tong N, Moulton C. Emergency intu-bation for acutely ill and injured patients. Cochrane Database SystRev. 2008:CD001429. [PMID: 18425873] doi:10.1002/14651858.CD001429.pub235. Hanif MA, Kaji AH, Niemann JT. Advanced airway managementdoes not improve outcome of out-of-hospital cardiac arrest. AcadEmerg Med. 2010;17:926-31. [PMID: 20836772] doi:10.1111/j.1553-2712.2010.00829.x36. Wang HE, Peitzman AB, Cassidy LD, Adelson PD, Yealy DM.Out-of-hospital endotracheal intubation and outcome after traumaticbrain injury. Ann Emerg Med. 2004;44:439-50. [PMID: 15520702]37. von Elm E, Schoettker P, Henzi I, Osterwalder J, Walder B. Pre-hospital tracheal intubation in patients with traumatic brain injury:systematic review of current evidence. Br J Anaesth. 2009;103:371-86. [PMID: 19648153] doi:10.1093/bja/aep20238. Stockinger ZT, McSwain NE Jr. Prehospital endotracheal intuba-tion for trauma does not improve survival over bag-valve-mask ven-tilation. J Trauma. 2004;56:531-6. [PMID: 15128123]39. Haut ER, Kalish BT, Cotton BA, Efron DT, Haider AH, Stevens KA,et al. Prehospital intravenous fluid administration is associated withhigher mortality in trauma patients: a National Trauma Data Bankanalysis. Ann Surg. 2011;253:371-7. [PMID: 21178760] doi:10.1097/SLA.0b013e318207c24f40. Bickell WH, Wall MJ Jr, Pepe PE, Martin RR, Ginger VF, Allen MK,et al. Immediate versus delayed fluid resuscitation for hypotensivepatients with penetrating torso injuries. N Engl J Med. 1994;331:1105-9. [PMID: 7935634]
This online-first version will be replaced with a final version when it is included in the issue. The final version may differ in small ways.
ORIGINAL RESEARCH Outcomes of Basic Versus Advanced Life Support
690 Annals of Internal Medicine www.annals.org
Downloaded From: http://annals.org/ by a Ohio State Univ User on 10/14/2015

Current Author Addresses: Dr. Sanghavi: Department of Pub-lic Health Sciences, The University of Chicago, 5841 SouthMaryland Avenue, MC2000, Chicago, IL 60637.Drs. Jena, Newhouse, and Zaslavsky: Department of HealthCare Policy, Harvard Medical School, 180A Longwood Ave-nue, Boston, MA 02115.
Author Contributions: Conception and design: P. Sanghavi,A.B. Jena, A.M. Zaslavsky.Analysis and interpretation of the data: P. Sanghavi, A.B. Jena,J.P. Newhouse, A.M. Zaslavsky.Drafting of the article: P. Sanghavi, A.B. Jena, A.M. Zaslavsky.Critical revision of the article for important intellectual con-tent: P. Sanghavi, A.B. Jena, J.P. Newhouse, A.M. Zaslavsky.Final approval of the article: P. Sanghavi, A.B. Jena, J.P. New-house, A.M. Zaslavsky.Statistical expertise: P. Sanghavi, A.M. Zaslavsky.Obtaining of funding: P. Sanghavi.Collection and assembly of data: P. Sanghavi.
This online-first version will be replaced with a final version when it is included in the issue. The final version may differ in small ways.
www.annals.org Annals of Internal Medicine
Downloaded From: http://annals.org/ by a Ohio State Univ User on 10/14/2015