outline of consolidated financial statements …pdf.irpocket.com/c8804/gph7/w8b5/syzl.pdfcontact:...
TRANSCRIPT
This document has been translated from a portion of the Japanese original for reference purposes only. In the event of any discrepancy between this translated document and the Japanese original, the original shall prevail. The Company assumes no responsibility for this translation, nor for direct, indirect, or any other form of damages that may arise from use of this translation. This English version includes some explanatory notes.
February 12, 2014
Outline of Consolidated Financial Statements (Japanese Accounting Standards) for the Fiscal Year Ended December 2013
Name of Company Listed: Tokyo Tatemono Co., Ltd. Exchange: First Section of Tokyo Stock Exchange Code Number: 8804 URL: http://www.tatemono.com Representative: Hajime Sakuma, President & Chief Executive Officer Contact: Fumio Inada, Executive Officer and the General Manager of the Corporate Communications and
Investor Relations Department, TEL: +81-(0)3-3274-1984 Scheduled date of ordinary shareholders’ meeting: March 28, 2014 Scheduled date for submission of securities report: March 28, 2014 Scheduled day for commencement of dividend payment: March 31, 2014 Supplementary documents for results: Yes Results briefing: Yes (for analysts and institutional investors)
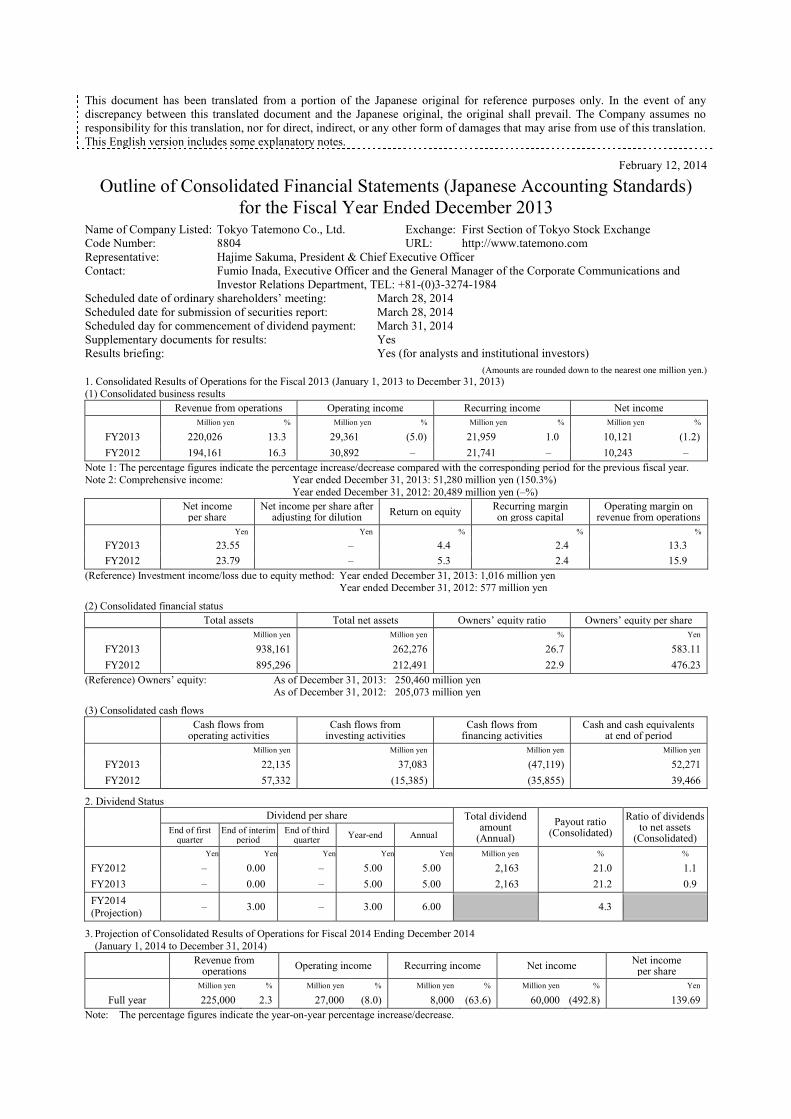
(Amounts are rounded down to the nearest one million yen.) 1. Consolidated Results of Operations for the Fiscal 2013 (January 1, 2013 to December 31, 2013) (1) Consolidated business results
Revenue from operations Operating income Recurring income Net income Million yen % Million yen % Million yen % Million yen %
FY2013 220,026 13.3 29,361 (5.0) 21,959 1.0 10,121 (1.2) FY2012 194,161 16.3 30,892 – 21,741 – 10,243 –
Note 1: The percentage figures indicate the percentage increase/decrease compared with the corresponding period for the previous fiscal year. Note 2: Comprehensive income: Year ended December 31, 2013: 51,280 million yen (150.3%)
Year ended December 31, 2012: 20,489 million yen (–%)
Net income per share
Net income per share after adjusting for dilution Return on equity Recurring margin
on gross capital Operating margin on
revenue from operations Yen Yen % % %
FY2013 23.55 – 4.4 2.4 13.3 FY2012 23.79 – 5.3 2.4 15.9
(Reference) Investment income/loss due to equity method: Year ended December 31, 2013: 1,016 million yen Year ended December 31, 2012: 577 million yen
(2) Consolidated financial status Total assets Total net assets Owners’ equity ratio Owners’ equity per share Million yen Million yen % Yen
FY2013 938,161 262,276 26.7 583.11 FY2012 895,296 212,491 22.9 476.23
(Reference) Owners’ equity: As of December 31, 2013: 250,460 million yen As of December 31, 2012: 205,073 million yen
(3) Consolidated cash flows
Cash flows from operating activities
Cash flows from investing activities
Cash flows from financing activities
Cash and cash equivalents at end of period
Million yen Million yen Million yen Million yen
FY2013 22,135 37,083 (47,119) 52,271 FY2012 57,332 (15,385) (35,855) 39,466
2. Dividend Status
Dividend per share Total dividend
amount (Annual)
Payout ratio (Consolidated)
Ratio of dividends to net assets
(Consolidated) End of first
quarter End of interim
period End of third
quarter Year-end Annual
Yen Yen Yen Yen Yen Million yen % %
FY2012 – 0.00 – 5.00 5.00 2,163 21.0 1.1 FY2013 – 0.00 – 5.00 5.00 2,163 21.2 0.9 FY2014 (Projection) – 3.00 – 3.00 6.00 4.3
3. Projection of Consolidated Results of Operations for Fiscal 2014 Ending December 2014 (January 1, 2014 to December 31, 2014)
Revenue from operations Operating income Recurring income Net income Net income
per share Million yen % Million yen % Million yen % Million yen % Yen
Full year 225,000 2.3 27,000 (8.0) 8,000 (63.6) 60,000 (492.8) 139.69 Note: The percentage figures indicate the year-on-year percentage increase/decrease.

* Notes (1) Significant changes in subsidiaries accompanied by a change in the scope of consolidation during the term: None
(2) Changes in the accounting principles and changes or restatement of accounting estimates
(i) Changes in the accounting principles due to amendment of accounting standard, etc.: Yes (ii) Changes in the accounting principles other than (i): None (iii) Changes in the accounting estimates: Yes (iv) Restatement: None
Note: For details, refer to page 21 of the attachment: “4. Consolidated Financial Statements (5) Notes on Consolidated Financial Statements (Changes in the Accounting Principles, which are Difficult to Distinguish from Changes in the Accounting Estimates)”. (3) Number of outstanding shares (common shares)
(i) Number of outstanding shares (including treasury stock) at the end of the period As of December 2013: 433,059,168 shares As of December 2012: 433,059,168 shares
(ii) Number of shares of treasury stock at the end of the period As of December 2013: 3,536,021 shares As of December 2012: 2,440,516 shares
(iii) Average number of shares during the term As of December 2013: 429,726,009 shares As of December 2012: 430,623,698 shares (Reference) Summary of Non-consolidated Financial Statements 1. Non-consolidated Results of Operations for the Fiscal 2013 (January 1, 2013 to December 31, 2013) (1) Non-consolidated business results
Revenue from operations Operating income Recurring income Net income Million yen % Million yen % Million yen % Million yen %
FY2013 150,452 7.8 22,785 (11.9) 15,945 (16.2) 7,104 (24.4) FY2012 139,569 24.3 25,865 – 19,034 – 9,403 –
Note 1. The percentage figures indicate the percentage increase/decrease compared with the corresponding period for the previous fiscal year.
Net income per share
Net income per share after adjusting for dilution
Yen Yen
FY2013 16.42 –
FY2012 21.73 –
(2) Non-consolidated financial status Total assets Total net assets Owners’ equity ratio Owners’ equity per share Million yen Million yen % Yen
FY2013 845,739 234,204 27.7 541.37 FY2012 814,250 198,920 24.4 459.73
(Reference) Owners’ equity: As of December 31, 2013: 234,204 million yen As of December 31, 2012: 198,920 million yen
* Audit This outline of consolidated financial statements is not subject to the audit procedures under the Financial Instruments and Exchange Act. The audit procedures for consolidated financial statements under the Financial Instruments and Exchange Act were being applied at the time of disclosure of this outline of consolidated financial statements. * Explanation Regarding the Appropriate Use of Business Performance Projections, and Other Items Warranting Special Mention The performance projections and other statements regarding the future presented in these materials are based on information presently obtained by the Company and on certain assumptions deemed to be rational, and the actual performance may differ materially depending on various factors. See "1. Analysis of Operating Results and Financial Situation (1) Analysis of Operating Results" on page 2 of the accompanying materials for details about business performance projections.

1
○ Contents of Accompanying Materials
1. Analysis of Operating Results and Financial Situation .................................................................................. 2 (1) Analysis of Operating Results ................................................................................................................. 2 (2) Analysis of Financial Situation .............................................................................................................. 6 (3) Basic Policy regarding Dividend Distribution of Revenue for the Current and Successive Term ........... 7
2. Corporate Group ............................................................................................................................................. 8 3. Management Policy ...................................................................................................................................... 11 4. Consolidated Financial Statement .............................................................................................................. 12
(1) Consolidated balance sheet .................................................................................................................... 12 (2) Consolidated statement of income and consolidated statement of comprehensive income ................... 14 (3) Consolidated Statements of Changes in Owners’ Equity ...................................................................... 16 (4) Consolidated Statements of Cash Flows ................................................................................................ 18 (5) Notes on Consolidated Financial Statements ......................................................................................... 20
(Notes on the Going Concern) .............................................................................................................. 20 (Significant Items Regarding Preparation of Consolidated Financial Statements) ............................... 20 (Changes in the Accounting Principles, which are Difficult to Distinguish from Changes in the Accounting Estimates) ................................................................................................................ 21 (Changes in the Indication Method) ...................................................................................................... 21 (Relating to Consolidated Balance Sheets) ........................................................................................... 22 (Relating to Consolidated Statements of Income) ................................................................................. 24 (Relating to Consolidated Statements of Cash Flows) .......................................................................... 25 (Segment Information) .......................................................................................................................... 27 (Relating to Rental Properties) .............................................................................................................. 30 (Relating to Special Purpose Companies Subject to Disclosure) .......................................................... 31 (Per Share Information) ........................................................................................................................ 33 (Major Subsequent Events) ................................................................................................................... 34

2
1. Analysis of Operating Results and Financial Situation (1) Analysis of Operating Results (i) Current Operating Results
In fiscal 2013, the Japanese economy staged a moderate recovery, showing improved corporate earnings and a turnaround in capital investment thanks to the continued trend of yen depreciation and the stock market surge that were attributable to economic measures implemented by the government and monetary easing undertaken by the Bank of Japan.
In the real estate industry, there was a move toward recovery in the rental office market, reflecting a further decline in vacancy rates and a rise in asking rents asked in certain areas, because the influence of large new supply disappeared and business sentiment improved. In the residential housing market, the contract rate remained continuously favorable and steady business environments continued against the backdrop of low interest rates and the improvement of business sentiment. In the real estate investment market, J-REIT’s and private funds’ stance toward the acquisition of properties became aggressive, backed by favorable fund raising environments. The entire market became active.
In this business environment, looking at the consolidated business results of the Group for the fiscal year under review, in the Residence Business, revenue from operation increased from ¥194,161 million for the previous fiscal year to ¥220,026 million, up 13.3%, thanks to a sharp rise in the number of sold condominiums from the previous fiscal year. In the Commercial Properties Business, operating income declined by 5.0%, from ¥30,892 million for the previous fiscal year to ¥29,361 million, reflecting the absence of the dividend income associated with the sale of assets that was posted in the previous fiscal year. Recurring income rose by 1.0%, from ¥21,741 million for the previous fiscal year to ¥21,959 million, reflecting the improvement of interest income and expense.
As a result, net income for the fiscal year under review declined from ¥10,243 million for the previous fiscal year to ¥10,121 million, down 1.2%.
See below for an outline of business results by business segment.

3
<Commercial Properties> In the Commercial Properties Business, the Company focused on raising the safety level and improving services
so that customers who use facilities and equipment provided by the Company would experience safety, security and comfort, and sought to improve the occupancy rates of large-scale properties, thereby strengthening its earning sources.
In the fiscal year under review, Otemachi Tower (Chiyoda Ward, Tokyo), Tokyo Square Garden (Chuo Ward, Tokyo) and Grand Front Osaka (Kita Ward, Osaka) commenced operation. Nakano Central Park (Nakano Ward, Tokyo) and Nihonbashi TI Building (Chuo Ward, Tokyo) were in operation for the full year. Revenue from building management services increased, reflecting the change of TOKYO FUDOSAN KANRI K. K. and another company into consolidated subsidiaries. However, revenue decreased slightly due to the absence of dividend income associated with the sale of real estate and assets, which was posted in the previous fiscal year, and profits declined.
As a result, revenue from operation stood at ¥66,475 million (down 1.5% from ¥67,499 million for the previous fiscal year). Operating income declined from ¥33,164 million yen for the previous fiscal year to ¥25,493 million, down 23.1%.
Item
FY2012 FY2013
Quantity, etc. Revenue from
operations (million yen)
Quantity, etc. Revenue from
operations (million yen)
Leasing of commercial properties
Leased area of buildings 438,392 m2 (Of which, subleased area 137,132 m2)
32,561
Leased area of buildings 437,958 m2 (Of which, subleased area 124,359 m2)
31,851
Real estate sales 1 property 5,400 1 property 800
Building management services – 10,860 – 21,899
Dividend income from SPC – 18,678 – 11,924
Revenue from operations – 67,499 – 66,475
Operating income – 33,164 – 25,493
<Residence>
In the Residence Business, to embody the concepts represented by the slogans “refined housing” and “comfortable and peaceful housing after residence,” which express the brand identity for Brillia condominiums, the Company made comprehensive efforts for the acquisition of carefully selected sites and customer-oriented commodity planning. In addition, the Company focused on services after entry and management and operation, such as the provision of an around-the-clock service called Brillia Daily Life Hotline to respond to various requests from the condominium rooms.
During the fiscal year under review, the Company recorded sales of condominiums including “Brillia Tama New Town” (Tama City, Tokyo), “Brillia City Yokohama Isogo” (Isogo Ward, Yokohama), “Brillia WELLITH Tsukishima” (Chuo Ward, Tokyo) and “Grand Front Osaka Owners Tower” (Kita Ward, Osaka), etc.
As a result, revenue from operation increased by 31.1%, from ¥86,612 million for the previous fiscal year to ¥113,523 million. Operating income rose from ¥983 million for the previous fiscal year to ¥7,667 million, up 679.3%.

4
Item
FY2012 FY2013
Quantity, etc. Revenue from
operations (million yen)
Quantity, etc. Revenue from
operations (million yen)
Residence sales 1,188 units 66,756 1,914 units 92,951
Residence leasing
Leased area of buildings 180,655 m2 (Of which, subleased area 44,695 m2)
7,737
Leased area of buildings 162,582 m2 (Of which, subleased area 45,520 m2)
6,267
Condominium management services
Number of managed units 42,312 units 5,318 Number of managed units
46,889 units 5,723
Other – 6,800 – 8,582
Revenue from operations – 86,612 – 113,523
Operating income – 983 – 7,667
< Brokerage >
In brokerage services for corporate customers, the Company strengthened proposal sales (CRE sales) for the effective use of real estate owned and operated by companies, among others. In brokerage services for individual customers, the Company improved the Authorization System of Used House Brillia, which provides a certain guarantee for a portion of the condominiums sold by the Company based on building inspections, and strengthened cooperation with the group companies, thereby endeavoring to increase brokerage transactions.
In the fiscal year under review, sales, revenue and profits rose from the previous fiscal year, reflecting an increase in sales of real estate and brokerage fees received for brokerage, appraisal, and consulting services.
As a result, revenue from operation stood at ¥10,210 million (up 22.2% from ¥8,354 million for the previous fiscal year). Operating income increased from ¥115 million for the previous fiscal year to ¥1,308 million, up 1,034.7%.
Item
FY2012 FY2013
Quantity, etc. Revenue from
operations (million yen)
Quantity, etc. Revenue from
operations (million yen)
Brokerage, appraisal and consulting services 1,100 properties 2,245 1,165 properties 2,703
Real estate sales 21 properties 3,439 13 properties 4,331
Dividend income from SPC – 374 – 681
Other – 2,294 – 2,493
Revenue from operations – 8,354 – 10,210
Operating income – 115 – 1,308
5
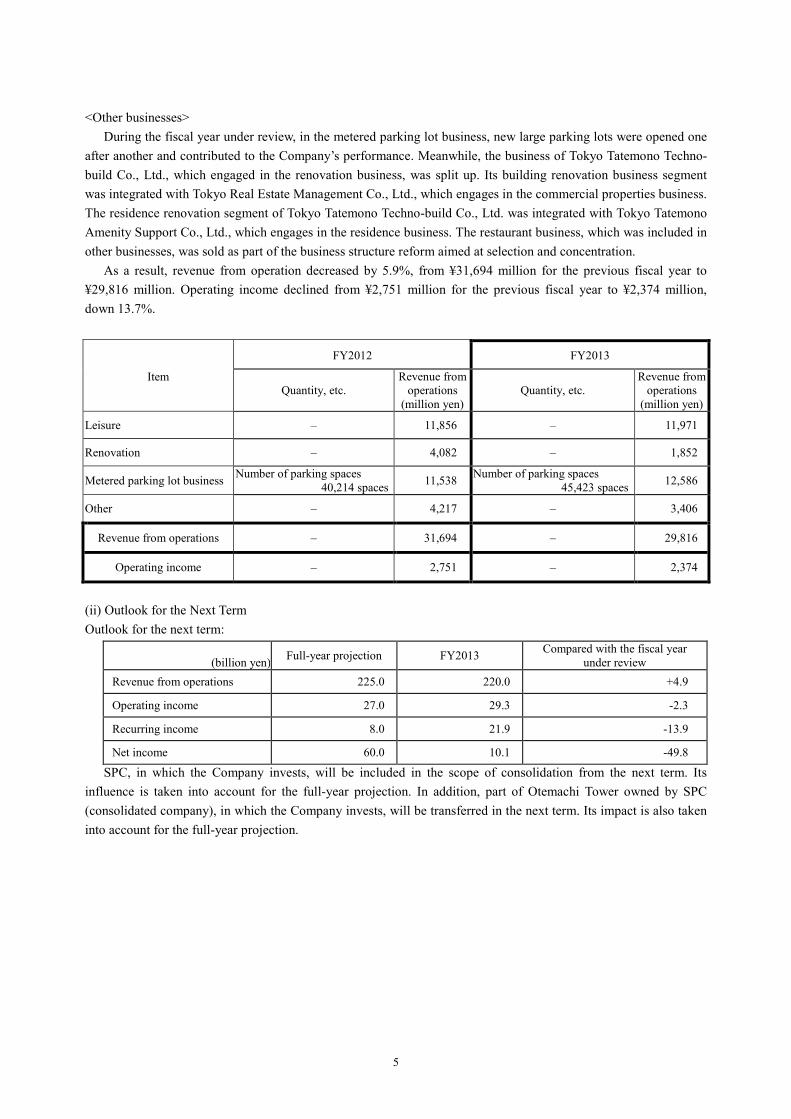
<Other businesses>
During the fiscal year under review, in the metered parking lot business, new large parking lots were opened one after another and contributed to the Company’s performance. Meanwhile, the business of Tokyo Tatemono Techno-build Co., Ltd., which engaged in the renovation business, was split up. Its building renovation business segment was integrated with Tokyo Real Estate Management Co., Ltd., which engages in the commercial properties business. The residence renovation segment of Tokyo Tatemono Techno-build Co., Ltd. was integrated with Tokyo Tatemono Amenity Support Co., Ltd., which engages in the residence business. The restaurant business, which was included in other businesses, was sold as part of the business structure reform aimed at selection and concentration.
As a result, revenue from operation decreased by 5.9%, from ¥31,694 million for the previous fiscal year to ¥29,816 million. Operating income declined from ¥2,751 million for the previous fiscal year to ¥2,374 million, down 13.7%.
Item
FY2012 FY2013
Quantity, etc. Revenue from
operations (million yen)
Quantity, etc. Revenue from
operations (million yen)
Leisure – 11,856 – 11,971
Renovation – 4,082 – 1,852
Metered parking lot business Number of parking spaces 40,214 spaces 11,538 Number of parking spaces
45,423 spaces 12,586
Other – 4,217 – 3,406
Revenue from operations – 31,694 – 29,816
Operating income – 2,751 – 2,374
(ii) Outlook for the Next Term Outlook for the next term:
(billion yen) Full-year projection FY2013 Compared with the fiscal year under review
Revenue from operations 225.0 220.0 +4.9
Operating income 27.0 29.3 -2.3
Recurring income 8.0 21.9 -13.9
Net income 60.0 10.1 -49.8
SPC, in which the Company invests, will be included in the scope of consolidation from the next term. Its influence is taken into account for the full-year projection. In addition, part of Otemachi Tower owned by SPC (consolidated company), in which the Company invests, will be transferred in the next term. Its impact is also taken into account for the full-year projection.

6
(2) Analysis of Financial Situation (i) Analysis of Assets, Liabilities and Net Assets (Assets)
Total assets at the end of the fiscal year under review amounted to ¥938,161 million, showing an increase of ¥42,864 million from the end of the previous fiscal year. The major factors were an increase in investment securities attributable to the fair market valuation of listed stocks, and a rise in the number of consolidated subsidiaries. (Liabilities)
Total liabilities at the end of the fiscal year under review stood at ¥675,884 million, down ¥6,920 million from the end of the previous fiscal year. This was mainly attributable to an increase in deferred income taxes and guarantee deposits received and a decrease in interest-bearing debt. The balance of interest-bearing debt (excluding lease obligations) stood at ¥434,763 million, down ¥44,983 million from the end of the previous fiscal year. (Net assets)
Net assets at the end of the fiscal year under review amounted to ¥262,276 million, up ¥49,785 million from the end of the previous fiscal year. This was primarily attributable to an increase associated with net income and a rise in the valuation difference on available-for-sale securities.
(ii) Analysis of Cash Flow Situation
Consolidated cash and cash equivalents (hereinafter “cash”) at the end of the fiscal year under review increased ¥12,804 million from the end of the previous fiscal year, to ¥52,271 million, reflecting ¥22.135 million cash provided by operating activities, ¥37,083 million cash provided by investing activities, and ¥47,119 million cash used in financing activities.
Cash flows for each category are as follows. (Cash flow from operating activities)
Cash provided by operating activities stood at ¥22,135 million (down ¥35,196 million from the previous fiscal year) at the end of the fiscal year under review. This mainly reflected income before income taxes and minority interests of ¥21,281 million and an increase in cash of ¥10,067 million due to a rise in guarantee deposits received. (Cash flow from investing activities)
Cash provided by investing activities amounted to ¥37,083 million (up ¥52,469 million from the previous fiscal year) at the end of the fiscal year under review. This was primarily attributable to a decrease in cash, due mainly to payment for purchase of marketable and investment securities of ¥14,790 million, and a rise in cash reflecting proceeds from sale of marketable and investment securities of ¥30,746 million, proceeds from the sale of the shares of subsidiaries involving changes in the scope of consolidation of ¥16,937 million and proceeds from sale of fixed assets of ¥15,165 million. (Cash from financing activities)
Cash used in financing activities stood at ¥47,119 million (down ¥11,263 million from the previous fiscal year). This was mainly attributable to a decline in interest-bearing debt.

7
(iii) Cash Flow Index Estimation
FY2011 FY2012 FY2013
Equity capital ratio 20.6% 22.9% 26.7%
Market value based equity capital ratio 11.2% 21.1% 53.5%
Ratio of cash flow to interest-bearing liabilities 63.8 years 8.4 years 19.7 years
Interest coverage ratio 1.0 6.9 2.8 Notes: 1) Each index is calculated by the following formulae using consolidated financial figures: Equity capital ratio: shareholder equity/total gross assets Market value based equity capital ratio: total market value of shares/total gross assets Ratio of cash flow to interest-bearing liabilities: interest-bearing liabilities/operating cash flow Interest coverage ratio: operating cash flow/interest payment 2) Total market value of shares is calculated as follows: end-term closing stock price x number of outstanding
stocks at end term (not including treasury stocks). 3) For operating cash flows and interest payment, the “cash flow from operating activities” and “amount of interest”
in the consolidated cash flow statement are used. Interest-bearing liabilities refer to all interest-bearing liabilities listed on the consolidated balance sheet.
(3) Basic Policy regarding Dividend Distribution of Revenue for the Current and Successive Term
For dividends, it is the Company’s policy to steadily return its profits to each stockholder by enhancing retained earnings to strengthen its management base and financial position and by comprehensively accounting for future operations, business expansion, and business outlook.
The Company plans a year-end dividend payment for the fiscal year under review of ¥5 per share. As a result, the dividend payout ratio for the current fiscal year will be 21.2%.
For the following term, the Company plans to set the interim dividend at ¥3 per share, the year-end dividend at ¥3 per share, and the annual dividend at ¥6 per share (a rise of ¥1 per share from the term under review) in light of the outlook for the next term. The dividend payout ratio for the next term is estimated to be 4.3%.
8
2. Corporate Group Principal businesses operated by the Company and its 47 affiliates (of which, 33 consolidated subsidiaries and
eight equity method affiliates), the names of companies that operate the businesses and their positioning are shown below. The segment classification is the same as that in the segment information.
(i) Commercial Properties
The Company and its consolidated subsidiary, Tokyo Tatemono Resort Co., Ltd., undertake the lease and management of commercial office properties. Consolidated subsidiaries, Tokyo Real Estate Management Co., Ltd., Tokyo Tatemono Amenity Support Co., Ltd., Shinjuku Center Building Management Co., Ltd., and Tokyo Building Service Co., Ltd., undertake building management.
Prime Place Co., Ltd., a consolidated subsidiary, manages and operates commercial facilities.
(ii) Residence The Company develops and sells condominiums and detached houses, etc. Tokyo Tatemono Real Estate Sales Co., Ltd., a consolidated subsidiary, acts as a sales agent for condominiums
for sale, etc. Tokyo Tatemono Amenity Support Co., Ltd., a consolidated subsidiary, undertakes the management of
condominiums, etc. The Company, and Tokyo Tatemono Real Estate Sales Co., Ltd., Kachidoki GROWTH TOWN Co., Ltd. and
another company, which are consolidated subsidiaries, undertake the lease and management of condominiums. E-state Online Co., Ltd., a consolidated subsidiary, provides web construction and support services for
condominiums sales, etc. and Tsunagu Network Communications, Inc., an equity-method affiliate, provides the Internet connection service for condominiums.
(iii) Brokerage
The Company provides brokerage services for real estate and the real estate appraisal and consulting businesses. Tokyo Tatemono Real Estate Sales Co., Ltd., a consolidated subsidiary, sells and buys real estate and provides
brokerage services.
(iv) Other businesses (Leisure)
The Company sells resort villas and develops leisure faculties around the Hatori Lake in Fukushima, and a consolidated subsidiary Tokyo Tatemono Resort Co., Ltd. operates these facilitates.
Tokyo Tatemono Resort Co., Ltd., a consolidated subsidiary, operates hotels and resort facilities. Hotness Co., Ltd., a consolidated subsidiary, operates a spa (premium bathhouse) business. J-Golf Co., Ltd., Tsurugashima Country Club Co., Ltd., Kawaguchiko Country Club Co., Ltd. and Tojo Golf
Club Co., Ltd., consolidated subsidiaries, and other nine companies operate golf courses. (Pay-by-the-hour parking)
NIHON PARKING CORPORATION, a consolidated subsidiary, operates a pay-by-the-hour parking business. (Asset management)
Tokyo Tatemono Fund Management Co., Ltd., a consolidated subsidiary, operates businesses under the Real Estate Specified Joint Enterprise Act.
Tokyo Tatemono Investment Advisors Co., Ltd., a consolidated subsidiary, provides consulting services on real estate investments and arranges and manages real estate funds.
Tokyo Realty Investment Management, Inc., an equity-method affiliate, operates an asset management business for investment corporations as an asset management company under the Act on Securities Investment Trust and Securities Investment Corporations.

9
(International operations) Tokyo Tatemono (Shanghai) Real Estate Consulting Co., Ltd., a consolidated subsidiary, operates a real estate
consulting business in China. Shanghai Xiang Tai Real Estate Development Co., Ltd., an equity-method affiliate, and five other companies
develop condominiums for sale, etc. in China. (Finance)
Tokyo Tatemono Finance Co., Ltd., a consolidated subsidiary, operates a finance business. The business structure diagram that shows the above companies and businesses is as follows:

10
(Business Structure Diagram)
Buildings, etc. Brokerage
Other businesses
Housing
Tokyo Tatemono C
o., Ltd.
Tokyo Tatemono Resort Co., Ltd.
Others
Leasing / operation
Prime Place Co., Ltd.
Commercial facilities management / operation
Tokyo Tatemono Real Estate Sales Co., Ltd.
Tokyo Tatemono Resort Co., Ltd. Hotness Co., Ltd. J-Golf Co., Ltd. Tsurugashima Country Club Co., Ltd. Kawaguchiko Country Club Co., Ltd. Tojo Golf Club Co., Ltd.
Others
Leisure
NIHON PARKING CORPORATION
Others
Pay-by-the-hour parking
Tokyo Tatemono Fund Management Co., Ltd. Tokyo Tatemono Investment Advisors Co., Ltd. Tokyo Realty Investment Management, Inc.
Asset management
Tokyo Tatemono (Shanghai) Real Estate Consulting Co., Ltd. Shanghai Xiang Tai Real Estate Development Co., Ltd.
Others
International operations
Tokyo Tatemono Finance Co., Ltd.
Finance
Tokyo Tatemono Real Estate Sales Co., Ltd.
Sales agency
Tokyo Tatemono Amenity Support Co., Ltd.
Condominium management, etc
Tokyo Tatemono Real Estate Sales Co., Ltd. Kachidoki GROWTH TOWN Co., Ltd.
Others
Leasing / operation
E-state Online Co., Ltd. Tsunagu Network Communications, Inc.
Internet-related business
indicates consolidated subsidiaries. indicated equity-method affiliates.
Tokyo Real Estate Management Co., Ltd. Tokyo Tatemono Amenity Support Co., Ltd. Shinjuku Center Building Management Co., Ltd. Tokyo Building Service Co., Ltd.
Building management, etc.
11
3. Management Policy Disclosure of the Company’s management policy is omitted because there was no material change from the
content of the disclosure made in the Outline of Consolidated Financial Statements for the Fiscal Year Ended December 2011 (disclosed on February 14, 2012).
The outline of the consolidated financial statements stated above may be viewed at the following pages: (Company websites) http://www.tatemono.com/english/ir/highlight.html (Tokyo Stock Exchange website (Company Search Page for information on listed companies)) http://www.tse.or.jp/english/listing/index.html

12
4. Consolidated Financial Statement (1) Consolidated balance sheet
(Million yen)
End of FY2012 (December 31, 2012)
End of FY2013 (December 31, 2013)
Assets Current assets
Cash *1 39,468 *1 52,272 Notes and accounts receivable, trade – 19,678 Accounts receivable, trade 10,202 – Marketable securities *1 5 – TK investments *4 6,875 *4 6,875 Real estate for sale *1 40,756 *1, 5 39,653 Real estate for sale in progress 37,618 *2 31,395 Real estate for development 10,799 *5 30,174 Deferred income taxes 2,348 3,056 Other current assets 14,942 13,112 Allowance for doubtful accounts (571) (253) Total current assets 162,445 195,964
Fixed assets Property and equipment
Buildings and structures 212,446 206,536 Accumulated depreciation (89,409) (97,054) Buildings and structures (net amount) *1, 2 123,037 *1, 2 109,482
Land *1, 2, 3 302,123 *1, 2, 3 290,863 Construction in progress 4,266 5,536 Other fixed assets 20,541 16,452
Accumulated depreciation (12,942) (9,670) Other fixed assets (net amount) *2 7,599 *2 6,782
Total property and equipment 437,027 *5 412,666 Intangible assets
Lease rights *2 24,704 *2 15,975 Goodwill 3,094 667 Other *2 590 *2 776 Total intangible assets 28,389 *5 17,419
Investments and other assets Investment securities *1, 4 192,827 *1, 4 235,254 TK investments *4 50,843 *4 52,918 Long-term loans 89 81 Deferred income taxes 1,778 1,428 Guarantee deposits paid *2 10,943 *2 10,585 Other investments *2, 4 30,891 *2, 4 39,428 Allowance for doubtful accounts (264) (65) Investment loss reserve (19,673) (27,520) Total investments 267,434 312,111
Total fixed assets 732,851 742,196 Total assets 895,296 938,161
13
(Million yen)
End of FY2012 (December 31, 2012)
End of FY2013 (December 31, 2013)
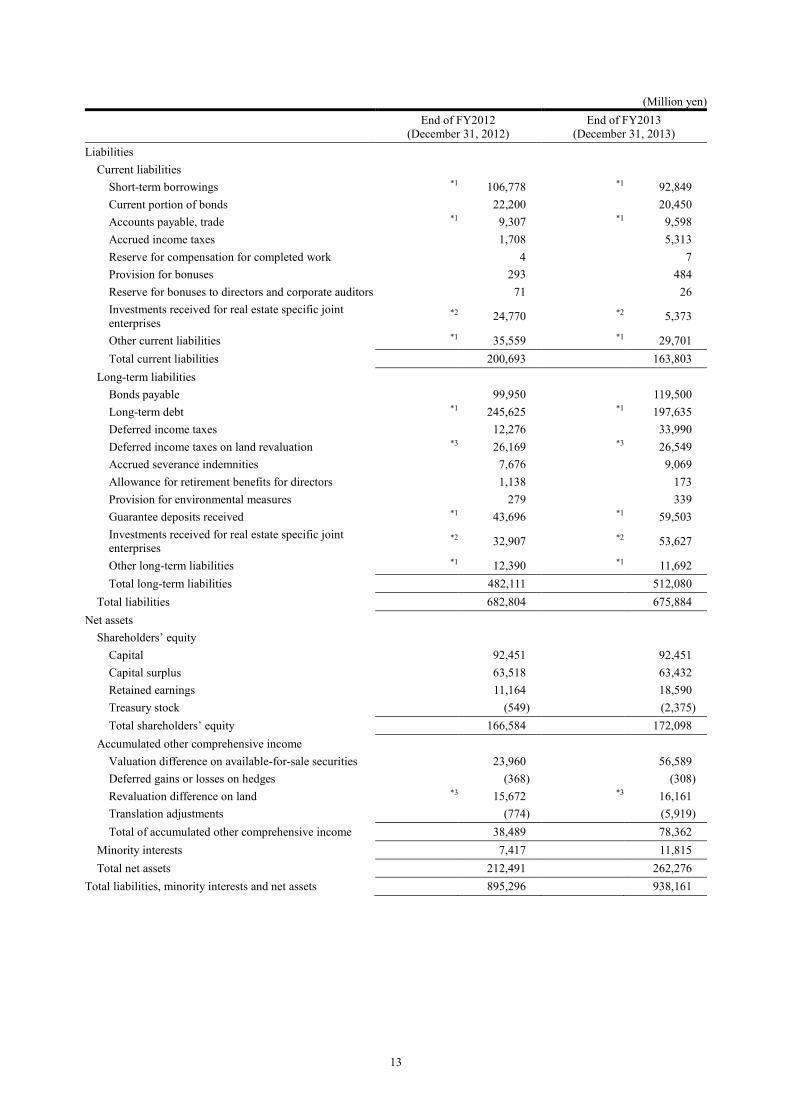
Liabilities Current liabilities
Short-term borrowings *1 106,778 *1 92,849 Current portion of bonds 22,200 20,450 Accounts payable, trade *1 9,307 *1 9,598 Accrued income taxes 1,708 5,313 Reserve for compensation for completed work 4 7 Provision for bonuses 293 484 Reserve for bonuses to directors and corporate auditors 71 26 Investments received for real estate specific joint enterprises
*2 24,770 *2 5,373
Other current liabilities *1 35,559 *1 29,701 Total current liabilities 200,693 163,803
Long-term liabilities Bonds payable 99,950 119,500 Long-term debt *1 245,625 *1 197,635 Deferred income taxes 12,276 33,990 Deferred income taxes on land revaluation *3 26,169 *3 26,549 Accrued severance indemnities 7,676 9,069 Allowance for retirement benefits for directors 1,138 173 Provision for environmental measures 279 339 Guarantee deposits received *1 43,696 *1 59,503 Investments received for real estate specific joint enterprises
*2 32,907 *2 53,627
Other long-term liabilities *1 12,390 *1 11,692 Total long-term liabilities 482,111 512,080
Total liabilities 682,804 675,884 Net assets
Shareholders’ equity Capital 92,451 92,451 Capital surplus 63,518 63,432 Retained earnings 11,164 18,590 Treasury stock (549) (2,375) Total shareholders’ equity 166,584 172,098
Accumulated other comprehensive income Valuation difference on available-for-sale securities 23,960 56,589 Deferred gains or losses on hedges (368) (308) Revaluation difference on land *3 15,672 *3 16,161 Translation adjustments (774) (5,919) Total of accumulated other comprehensive income 38,489 78,362
Minority interests 7,417 11,815 Total net assets 212,491 262,276
Total liabilities, minority interests and net assets 895,296 938,161

14
(2) Consolidated statement of income and consolidated statement of comprehensive income (Consolidated statement of income)
(Million yen)
FY2012 (Jan. 1, 2012 to Dec. 31, 2012)
FY2013 (Jan. 1, 2013 to Dec. 31, 2013)
Revenue from operations 194,161 220,026 Cost of revenue *1 140,385 *1 166,031 Gross profit 53,775 53,995 Selling, general and administrative expenses 22,883 24,633 Operating income 30,892 29,361 Non-operating income
Interest income 41 28 Dividend income 707 821 Equity in earnings of affiliated companies 577 1,016 Other 600 671 Total non-operating income 1,926 2,538
Non-operating expenses Interest expense 8,472 7,692 Borrowing fee 1,082 1,007 New share issue expenses 4 0 Bond issuance expenses 71 203 Distribution from real estate specific joint enterprises 1,202 831 Other 244 205 Total non-operating expenses 11,077 9,941
Recurring income 21,741 21,959 Extraordinary income
Gain on sale of property and equipment 3,286 2,158 Gain on sale of investment securities 39 10,021 Gain on sale of stock in affiliates – 5,281 Gain on negative goodwill – 2,251 Gain on step acquisitions – 1,101 Compensation income 493 153 Gain on reversal from foreign currency translation adjustment – 569
Total extraordinary income 3,819 21,537 Extraordinary loss
Loss on sale of fixed assets 1,109 9 Loss on retirement of property and equipment 118 132 Loss on sales of investment securities 1 13 Loss on devaluation of investment securities 1,859 5,584 Provision for investment loss reserve – 8,570 Loss on transfer of business – 177 Impairment loss *2 3,992 *2 7,727 Loss on reversal of foreign currency translation adjustment 671 –
Total extraordinary loss 7,752 22,215 Income before income taxes and minority interests 17,808 21,281 Current income taxes 2,020 8,644 Deferred income taxes 5,234 2,044 Total income taxes 7,255 10,688 Income before minority interests 10,553 10,592 Minority interests in income 309 471 Net income 10,243 10,121

15
(Consolidated statement of comprehensive income) (Million yen)
FY2012 (Jan. 1, 2012 to Dec. 31, 2012)
FY2013 (Jan. 1, 2013 to Dec. 31, 2013)
Income before minority interests 10,553 10,592 Other comprehensive income
Valuation difference on available-for-sale securities 12,190 35,131 Deferred gains or losses on hedges (368) 60 Revaluation difference on land (4,201) (43) Translation adjustments 1,235 (5) Share of other comprehensive income of associates accounted for using equity method 1,081 5,543
Total of other comprehensive income 9,936 40,687 Comprehensive income 20,489 51,280 Comprehensive income attributable to
Comprehensive income attributable to owners of the parent 20,156 49,461
Comprehensive income attributable to minority interests 333 1,818

16
(3) Consolidated Statements of Changes in Owners’ Equity FY2012 (Jan. 1, 2012 to Dec. 31, 2012)
(Million yen) Shareholders’ equity
Capital Capital surplus
Retained earnings
Treasury stock
Total shareholders’ equity
Balance at the beginning of the period 92,451 90,696 (22,812) (546) 159,788
Changes in items during the period
Deficit disposition (27,178) 27,178 – Net income 10,243 10,243 Reversal of revaluation reserve for land (3,427) (3,427)
Acquisition of treasury stock (3) (3)
Disposal of treasury stock (0) 0 0 Change of scope of consolidation (16) (16)
Transfer to capital surplus from retained earnings 0 (0) –
Net changes in items other than shareholders’ equity
Total changes in items during the period – (27,178) 33,976 (3) 6,795
Balance at the end of current period 92,451 63,518 11,164 (549) 166,584
Accumulated other comprehensive income
Minority interests
Total net assets
Valuation difference on available-for-sale securities
Deferred gains or losses on
hedges
Revaluation difference on
land Translation adjustments
Total of accumulated
other comprehensive
income Balance at the beginning of the period 11,153 – 16,446 (2,450) 25,149 7,163 192,101
Changes in items during the period
Deficit disposition – Net income 10,243 Reversal of revaluation reserve for land (3,427)
Acquisition of treasury stock (3)
Disposal of treasury stock 0 Change of scope of consolidation (16)
Transfer to capital surplus from retained earnings –
Net changes in items other than shareholders’ equity 12,807 (368) (773) 1,676 13,340 254 13,594
Total changes in items during the period 12,807 (368) (773) 1,676 13,340 254 20,390
Balance at the end of current period 23,960 (368) 15,672 (774) 38,489 7,417 212,491

17
FY2013 (Jan. 1, 2013 to Dec. 31, 2013)
(Million yen) Shareholders’ equity
Capital Capital surplus
Retained earnings
Treasury stock
Total shareholders’ equity
Balance at the beginning of the period 92,451 63,518 11,164 (549) 166,584
Changes in items during the period
Dividends from surplus (2,163) (2,163) Net income 10,121 10,121 Reversal of revaluation reserve for land (532) (532)
Acquisition of treasury stock (68) (68)
Disposal of treasury stock 0 1 1 Increase or decrease in
treasury stocks due to change in the scope of consolidation
(1,759) (1,759)
Change of scope of consolidation (86) (86)
Net changes in items other than shareholders’ equity
Total changes in items during the period – (85) 7,425 (1,825) 5,513
Balance at the end of current period 92,451 63,432 18,590 (2,375) 172,098
Accumulated other comprehensive income
Minority interests
Total net assets
Valuation difference on available-for-sale securities
Deferred gains or losses on
hedges
Revaluation difference on
land Translation adjustments
Total of accumulated
other comprehensive
income Balance at the beginning of the period 23,960 (368) 15,672 (774) 38,489 7,417 212,491
Changes in items during the period
Dividends from surplus (2,163) Net income 10,121 Reversal of revaluation reserve for land (532)
Acquisition of treasury stock (68)
Disposal of treasury stock 1 Increase or decrease in treasury stocks due to change in the scope of consolidation
(1,759)
Change of scope of consolidation (86)
Net changes in items other than shareholders’ equity 32,629 60 488 6,694 39,872 4,398 44,271
Total changes in items during the period 32,629 60 488 6,694 39,872 4,398 49,785
Balance at the end of current period 56,589 (308) 16,161 5,919 78,362 11,815 262,276

18
(4) Consolidated Statements of Cash Flows (Million yen)
FY2012 (Jan. 1, 2012 to Dec. 31, 2012)
FY2013 (Jan. 1, 2013 to Dec. 31, 2013)
Cash flows from operating activities Income before income taxes and minority interests 17,808 21,281 Depreciation 8,790 8,318 Impairment loss 3,992 7,727 Amortization of goodwill 252 290 Gain on negative goodwill – (2,251) Loss (gain) on step acquisitions – (1,101) Equity in earnings of affiliated companies (577) (1,016) Increase (decrease) in allowance for doubtful accounts (136) (519) Increase (decrease) in investment loss reserve – 8,570 Increase (decrease) in provision for bonuses 19 (261) Increase (decrease) in provision for bonuses to directors and corporate auditors
0 (59)
Increase (decrease) in provision for retirement benefits 597 392 Increase (decrease) in provision for retirement benefits for directors
25 (1,071)
Increase (decrease) in provision for environmental measures
(5) 59
Interest and dividend income (749) (850) Interest expense 8,472 7,692 Loss (gain) on devaluation of investment securities 1,859 5,584 Loss (gain) on sales of investment securities (38) (10,007) Gain on reversal from foreign currency translation adjustment
– (569)
Loss (gain) on sales and retirement of fixed assets (2,057) (2,016) Loss (gain) on sales of stocks of subsidiaries and affiliates – (5,281) Loss (gain) on transfer of business – 177 Loss on reversal of foreign currency translation adjustment
671 –
(Increase) decrease in accounts receivable, trade (3,595) (8,369) (Increase) decrease in marketable securities 16 – (Increase) decrease in TK investments 338 – (Increase) decrease in inventories *2 18,074 *2 (7,700) Increase (decrease) in guarantee deposits received 3,071 10,067 Increase (decrease) in accounts payable, trade (309) (531) (Increase) decrease in guarantee deposits paid (71) 482 Increase (decrease) in deposits 1,878 (1,594) Other 7,574 2,660 Subtotal 65,900 30,102 Interest and dividends received 880 2,381 Interest paid (8,349) (7,972) Income taxes paid (1,098) (2,376) Net cash provided by (used in) operating activities 57,332 22,135

19
(Million yen)
FY2012 (Jan. 1, 2012 to Dec. 31, 2012)
FY2013 (Jan. 1, 2013 to Dec. 31, 2013)
Cash flows from investing activities Proceeds from maturity of marketable securities 58 5 Proceeds from sale of marketable and investment securities 9,235 30,746
Payment for purchase of marketable and investment securities (23,026) (14,790)
Payment for investments in subsidiaries involving changes in the scope of consolidation – *3 (2,006)
Proceeds from the acquisition of the shares of subsidiaries involving changes in the scope of consolidation – *4 8
Proceeds from the sale of the shares of subsidiaries involving changes in the scope of consolidation – *5 16,937
Investments in TKs (a form of silent partnership) (3,068) (5,100) Proceeds from withdrawal of investments in silent partnerships 1,571 3,041
Proceeds from sale of fixed assets 31,062 15,165 Payment for purchase of fixed assets (20,648) (7,368) Proceeds from transfer of business – 73 Payments of loans receivable (13) (1,823) Collection of loans 406 1,836 Increase (decrease) in investments received for real estate specific joint enterprises (10,921) 1,822
Other (40) (1,465) Net cash provided by (used in) investing activities (15,385) 37,083
Cash flows from financing activities Increase (decrease) in short-term borrowings (404) (10) Increase in long-term debt 95,300 44,200 Repayment of long-term debt (130,281) (104,700) Payments for long-term accounts payable, other (883) (862) Proceeds from issue of bonds 15,000 40,000 Redemption of bonds (12,600) (22,200) Proceeds from sales of treasury stock 0 1 Acquisition of treasury stock (3) (68) Dividends paid (2) (2,159) Payments of dividends to minority shareholders (80) (94) Other (1,900) (1,226) Net cash provided by (used in) financing activities (35,855) (47,119)
Effect of exchange rate changes on cash and cash equivalents 495 704
Net increase (decrease) in cash and cash equivalents 6,586 12,804 Cash and cash equivalents at beginning of year 32,889 39,466 Decrease in cash and cash equivalents resulting from the exclusion of subsidiaries from consolidation (9) –
Cash and cash equivalents at end of year *1 39,466 *1 52,271

20
(5) Notes on Consolidated Financial Statements (Notes on the Going Concern) Not applicable
(Significant Items Regarding Preparation of Consolidated Financial Statements) 1. Matters relating to the scope of consolidation (1) Number of consolidated subsidiaries: 33
Principal consolidated subsidiaries: Major consolidated subsidiaries are listed under 2. Corporate Group. Tokyo Real Estate Management Co., Ltd. and Tokyo Building Service Co., Ltd., which were equity-
method affiliates, became subsidiaries due to the acquisition of additional shares, and are included in the scope of consolidation.
Takanawa Apartment Special Purpose Company is included in the scope of consolidation because the Company’s controlling power increased. Tokyo Tatemono Techno-build Co., Ltd. spun off its residence construction segment and interior goods sales segment to Tokyo Tatemono Amenity Support Co., Ltd., a consolidated subsidiary, through an absorption-type company split. An absorption-type merger was carried out, making Tokyo Real Estate Management Co., Ltd., a consolidated subsidiary, the surviving company and Tokyo Tatemono Techno-build Co., Ltd. the non-surviving company. Tokyo Tatemono Techno-build Co., Ltd. was therefore excluded from the scope of consolidation.
Tokyo Tatemono Investment (China) Co., Ltd. was excluded from the scope of consolidation due to the
completion of liquidation. Amenity Garden Shanghai Ltd. and Shanghai Dong Ying Real Estate Consulting Co. Ltd. were excluded
from the scope of consolidation due to the sale of holding shares. (2) Name of principal non-consolidated subsidiaries, etc.
Principal non-consolidated subsidiary: METS1 Special Purpose Company (3) Special purpose companies subject to disclosure
The overview of special purpose companies subject to disclosure, the overview of transactions using special purpose companies subject to disclosure, and the amount of transactions with special purpose companies subject to disclosure are described in the “matters relating to special purpose companies subject to disclosure.”
2. Matters relating to the application of an equity method (1) Number of equity-method affiliates
Affiliates: 8 Name of principal affiliates: Tokyo Realty Investment Management, Inc.
Qingdao Local Production Development and Construction is included in the scope of the application of an equity method after its incorporation.
Tokyo Real Estate Management Co., Ltd. and Tokyo Building Service Co., Ltd. were excluded from the scope of the application of an equity method due to their inclusion in the scope of consolidation.

21
(Changes in the Accounting Principles, which are Difficult to Distinguish from Changes in the Accounting Estimates)
The Company and its domestic consolidated subsidiaries changed their depreciation method to the depreciation method based on the Corporation Tax Act after the amendment for properties and equipment acquired from January 1, 2013 due to the amendment of the Corporation Tax Act in the fiscal year under review.
This change had a negligible effect on operating income, recurring income and income before income taxes and minority interests for the fiscal year under review.
(Changes in the Indication Method) (Relating to Consolidated Statement of Income)
The borrowing fee, which was included in other of non-operating expenses in the previous fiscal year, is shown independently in the fiscal year under review, because its amount exceeded 10% of total non-operating expenses. To reflect this change in the indication method, the consolidated financial statements for the previous fiscal year were rearranged.
As a result, ¥1,327 million included in other of non-operating expenses in the consolidated statement of income for the previous fiscal year was divided into the borrowing fee of ¥1,082 million and other of ¥244 million.

22
(Relating to Consolidated Balance Sheets) *1 Assets pledged as collateral and liabilities for which collateral are provided as follows: Assets pledged as collateral End of FY2012
(December 31, 2012) End of FY2013
(December 31, 2013) Real estate for sale Buildings and structures Land
6,976 9,081
16,364
million yen million yen million yen
5,190 8,621
16,143
million yen million yen million yen
Total 32,423 million yen 29,956 million yen Liabilities for which collateral are provided End of FY2012
(December 31, 2012) End of FY2013
(December 31, 2013) Short-term borrowings Accounts payable, trade Other current liabilities Long-term debt Guarantee deposits received Other long-term liabilities
3,120 700
16 5,556
291 4,200
million yen million yen million yen million yen million yen million yen
2,887 700 16
3,386 274
3,500
million yen million yen million yen million yen million yen million yen
Total 13,885 million yen 10,765 million yen Other than the above, cash and deposits (time deposits) of ¥1 million, marketable securities of ¥5 million, and
investment securities of ¥778 million were provided in the previous fiscal year, and cash and deposits (time deposits) of ¥1 million, and investment securities of ¥1,071 million were provided in the current fiscal year under review, as assets in trust to safeguard in-house savings and business security deposits, etc. under the Building Lots and Buildings Transaction Business Act and other laws. *2 Real estate for the real estate specific joint enterprise (in the anonymous association (tokumei kumiai) system)
are as follows: End of FY2012
(December 31, 2012) End of FY2013
(December 31, 2013) Real estate for sale in progress Buildings and structures and others Land Lease rights Other intangible assets Guarantee deposits paid Other investments
– 28,442 29,676 4,395
0 756 271
million yen million yen million yen million yen million yen million yen million yen
1,905 27,914 70,969 3,886
7 756 231
million yen million yen million yen million yen million yen million yen million yen
Total 63,542 million yen 105,671 million yen Investments received corresponding to the above are recorded in “investments received for real estate specific
joint enterprises” under long-term liabilities. *3 Revaluation of land
The Company revaluates land for business in accordance with the Act on Revaluation of Land (Act No. 34 enacted on March 31, 1998) and records valuation difference in long-term liabilities and net assets.
- Revaluation method Land for business is revaluated based on the appraisal as stipulated in Article 2, Item 5 of the Order for Enforcement of Act on Revaluation of Land (Cabinet Order No. 119 of March 31, 1998). - Date of revaluation December 31, 2000

23
*4 Preferred securities in special purpose companies (SPC) and TK investments for the purpose of real estate investment are included as follows:
End of FY2012 (December 31, 2012)
End of FY2013 (December 31, 2013)
TK investments 6,875 million yen 6,875 million yen Subtotal of current assets 6,875 million yen 6,875 million yen Investment securities TK investments Other investments
130,757 50,843
0
million yen million yen million yen
116,325 52,918
1
million yen million yen million yen
Subtotal of fixed assets 181,600 million yen 169,245 million yen Total 188,475 million yen 176,120 million yen
During the previous fiscal year, TK investments (fixed assets) of ¥1,875 million were transferred to TK investments (current assets) to reflect a change in the purpose of holding them. *5 In the fiscal year under review, property and equipment of ¥4,686 million and intangible assets of ¥2 million
were transferred to real estate for sale of ¥1,048 million and real estate for development of ¥3,640 million due to a change in the purpose of holding.
*6 Contingent liabilities End of FY2012
(December 31, 2012) End of FY2013
(December 31, 2013) Guaranteed obligations 6,359 million yen 22,195 million yen

24
(Relating to Consolidated Statements of Income) *1 Write-down of the book value of inventories held for ordinary sale due to a fall in profitability FY2012
(Jan. 1, 2012 to Dec. 31, 2012) FY2013
(Jan. 1, 2013 to Dec. 31, 2013) Cost of revenue 3,286 million yen 2,335 million yen *2 Impairment loss
The Group undertook grouping chiefly on an individual property unit basis, and recorded impairment losses for the following asset groups. FY2012 (Jan. 1, 2012 to Dec. 31, 2012)
Main use Type Location Impairment loss 11 condominiums for rent, etc.
Land, lease rights Buildings and structures
Shibuya Ward, Tokyo and other
3,992 million yen
For asset groups to be sold in this consolidated fiscal year, the book value is reduced to the recoverable value, and the reduction is recorded in extraordinary losses as an impairment loss.
The breakdown of impairment loss is as follows: Land 2,391 million yen Lease rights 244 million yen Buildings and structures and other 1,356 million yen Total 3,992 million yen
The recoverable value of the asset groups is primarily measured by net sale value. The planned sale value, etc. is used to evaluate the net sale value. Certain of the above assets have already been sold after posting an impairment loss. FY2013 (Jan. 1, 2013 to Dec. 31, 2013)
Main use Type Location Impairment loss
Facilities of golf courses Land, lease rights, buildings and other
Minamitsuru-gun, Yamanashi and other 2,595 million yen
Resort facility Land, buildings and structures Iwase-gun, Fukushima and other 2,044 million yen
Condominiums for rent and other
Land, lease rights, buildings and other
Setagaya Ward, Tokyo and other 3,087 million yen
For asset groups in which income arising from business operations and those asset groups to be sold in this consolidated fiscal year has been negative on an ongoing basis, the book value is reduced to the recoverable value, and the reduction is recorded in extraordinary losses as an impairment loss.
The breakdown of impairment loss is as follows: Land 3,042 million yen Lease rights 407 million yen Buildings 3,028 million yen Structures and other 1,248 million yen Total 7,727 million yen
The recoverable value of asset groups for which income arising from business operations continued to be negative was measured based on the net sale value or use value. The value as appraised by a real estate appraiser is used for the net sale value, and the use value was calculated by discounting future cash flows at 1.5%. The recoverable value of asset groups to be sold in the future was measured based on the net sale value. In this case, the net sale value was assessed based on the planned sale value.

25
(Relating to Consolidated Statements of Cash Flows) *1 Relationship between cash and cash equivalents at the end of the year and the amount of items stated in
consolidated balance sheets is as follows: FY2012
(Jan. 1, 2012 to Dec. 31, 2012) FY2013
(Jan. 1, 2013 to Dec. 31, 2013) Cash and deposits Time deposits with the term of more than three months
39,468
(1)
million yen million yen
52,272
(1)
million yen million yen
Cash and cash equivalents 39,466 million yen 52,271 million yen *2 Increase and decrease in inventories include increases and decreases in accounts payable, trade and advances
pertaining to inventories. *3 Major items composing the assets and liabilities of the companies that have recently become consolidated
subsidiaries due to the acquisition of shares FY2013 (Jan. 1, 2013 to Dec. 31, 2013)
The relationships between the major breakdown of assets and liabilities at the time of the start of consolidation relating to the change of Takanawa Apartment Special Purpose Company into a consolidated subsidiary through equity contribution and the amount of equity contribution and the “payment for investments in subsidiaries involving a change in the scope of consolidation” is as shown below. Current assets 385 million yen Fixed assets 5,643 million yen Current liabilities (67) million yen Long-term liabilities (81) million yen Subtotal 5,879 million yen Equity method appraisal value up to the acquisition of control (3,490) million yen
Equity contribution 2,389 million yen Cash and cash equivalents of consolidated subsidiaries (383) million yen
Net: Payment for investments in subsidiaries involving changes in the scope of consolidation 2,006 million yen
*4 Major breakdown of assets and liabilities of companies that became consolidated subsidiaries through the
acquisition of shares FY2013 (Jan. 1, 2013 to Dec. 31, 2013)
The relationship between the major breakdown of assets and liabilities at the time of the start of consolidation relating to the change of Tokyo Real Estate Management Co., Ltd. and another company into consolidated subsidiaries through the acquisition of shares and the acquisition price of shares and the “proceeds from the acquisition of the shares of subsidiaries involving a change in the scope of consolidation” is as shown below. Current assets 4,066 million yen Fixed assets 11,571 million yen Current liabilities (2,129) million yen Long-term liabilities (4,112) million yen Stocks of parent company 2,036 million yen Minority interests (2,734) million yen Gain on negative goodwill (2,251) million yen Subtotal 6,446 million yen Equity method appraisal value up to the acquisition of control (2,700) million yen
Gain on step acquisitions (1,101) million yen Additionally acquired shares’ value 2,644 million yen Cash and cash equivalents of consolidated subsidiaries (2,652) million yen
Net: Proceeds from the acquisition of the shares of subsidiaries involving changes in the scope of consolidation
(8) million yen
26
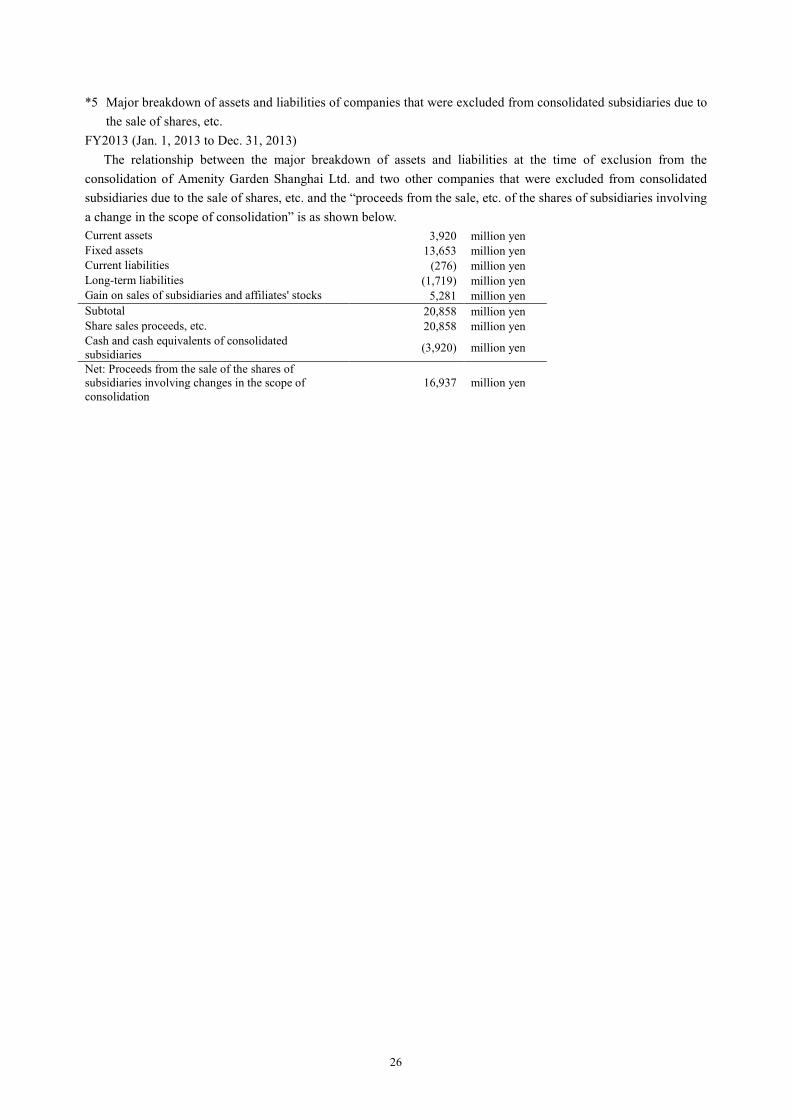
*5 Major breakdown of assets and liabilities of companies that were excluded from consolidated subsidiaries due to the sale of shares, etc.
FY2013 (Jan. 1, 2013 to Dec. 31, 2013) The relationship between the major breakdown of assets and liabilities at the time of exclusion from the
consolidation of Amenity Garden Shanghai Ltd. and two other companies that were excluded from consolidated subsidiaries due to the sale of shares, etc. and the “proceeds from the sale, etc. of the shares of subsidiaries involving a change in the scope of consolidation” is as shown below. Current assets 3,920 million yen Fixed assets 13,653 million yen Current liabilities (276) million yen Long-term liabilities (1,719) million yen Gain on sales of subsidiaries and affiliates' stocks 5,281 million yen Subtotal 20,858 million yen Share sales proceeds, etc. 20,858 million yen Cash and cash equivalents of consolidated subsidiaries (3,920) million yen
Net: Proceeds from the sale of the shares of subsidiaries involving changes in the scope of consolidation
16,937 million yen

27
(Segment Information) a. Segment Information 1. Overview of Reportable Segments
The reportable segments of the Company are the constituent units of the Company for which separate financial information is available and for which the Board of Directors conducts a regular review to determine the allocation of management resources and assess the business performance.
The Company operates business activities by establishing divisions corresponding to their line of business at head office, with the divisions formulating comprehensive strategies for the businesses they operate.
Therefore, the Company comprises business segments with the divisions as the basis and conducts the four businesses of commercial properties, residence, brokerage, and other as its reportable segments.
In the commercial properties business, the Company leases out and manages office buildings and commercial facilities. In the residence business, the Company sells condominiums and detached houses and leases out and manages condominiums. In the brokerage business, the Company sells and buys real estate and provides brokerage, real estate appraisal and consulting services. Other businesses include a Leisure business and Metered Parking Lot business, among others. 2. Information on Revenue from Operations, Profit and Loss, Assets, and Other Items by Reported Segments FY2012 (January 1, 2012 to December 31, 2012) (Million yen)
Commercial properties Residence Brokerage Other Adjustment
(Note 1)
Amount recorded in
consolidated financial
statements (Note 2)
Revenue from operations External customers 67,499 86,612 8,354 31,694 - 194,161 Inter-segment or transfer 475 374 188 2,001 (3,039) -
Total 67,974 86,986 8,542 33,696 (3,039) 194,161 Segment income 33,164 983 115 2,751 (6,122) 30,892 Segment assets 526,685 141,785 33,740 105,857 87,227 895,296 Other items
Depreciation 4,664 1,889 63 2,069 103 8,790 Investments in equity method affiliates 4,881 569 - 24,546 - 29,997
Increase in property and equipment and intangible assets
17,417 250 1,992 808 73 20,542
Note 1: (1) Adjustment of -¥6,122 million for segment income includes inter-segment elimination of ¥68 million and corporate expenses of -¥6,190 million that is not distributed to the reportable segments. Corporate expenses are primarily general and administrative expenses that do not belong to the reportable segments.
(2) Adjustment of segment assets of ¥87,227 million includes the company-level assets of ¥118,779 million and intersegment elimination of -¥31,552 million. The company-level assets chiefly consist of the Company’s cash, deposits and investment securities and assets, etc. relating to administrative divisions.
Note 2: Segment income is adjusted with operating income/loss in the consolidated financial statements.
28
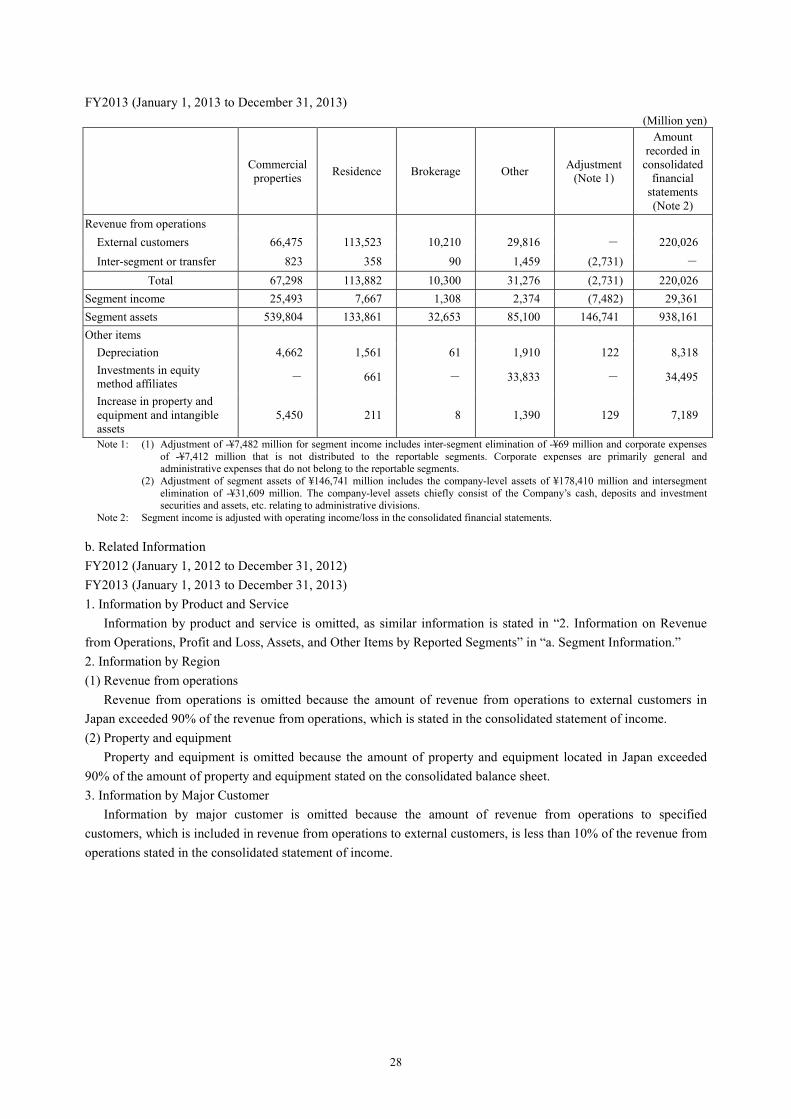
FY2013 (January 1, 2013 to December 31, 2013) (Million yen)
Commercial properties Residence Brokerage Other Adjustment
(Note 1)
Amount recorded in
consolidated financial
statements (Note 2)
Revenue from operations External customers 66,475 113,523 10,210 29,816 - 220,026 Inter-segment or transfer 823 358 90 1,459 (2,731) -
Total 67,298 113,882 10,300 31,276 (2,731) 220,026 Segment income 25,493 7,667 1,308 2,374 (7,482) 29,361 Segment assets 539,804 133,861 32,653 85,100 146,741 938,161 Other items
Depreciation 4,662 1,561 61 1,910 122 8,318 Investments in equity method affiliates - 661 - 33,833 - 34,495
Increase in property and equipment and intangible assets
5,450 211 8 1,390 129 7,189
Note 1: (1) Adjustment of -¥7,482 million for segment income includes inter-segment elimination of -¥69 million and corporate expenses of -¥7,412 million that is not distributed to the reportable segments. Corporate expenses are primarily general and administrative expenses that do not belong to the reportable segments.
(2) Adjustment of segment assets of ¥146,741 million includes the company-level assets of ¥178,410 million and intersegment elimination of -¥31,609 million. The company-level assets chiefly consist of the Company’s cash, deposits and investment securities and assets, etc. relating to administrative divisions.
Note 2: Segment income is adjusted with operating income/loss in the consolidated financial statements. b. Related Information FY2012 (January 1, 2012 to December 31, 2012) FY2013 (January 1, 2013 to December 31, 2013) 1. Information by Product and Service
Information by product and service is omitted, as similar information is stated in “2. Information on Revenue from Operations, Profit and Loss, Assets, and Other Items by Reported Segments” in “a. Segment Information.” 2. Information by Region (1) Revenue from operations
Revenue from operations is omitted because the amount of revenue from operations to external customers in Japan exceeded 90% of the revenue from operations, which is stated in the consolidated statement of income. (2) Property and equipment
Property and equipment is omitted because the amount of property and equipment located in Japan exceeded 90% of the amount of property and equipment stated on the consolidated balance sheet. 3. Information by Major Customer
Information by major customer is omitted because the amount of revenue from operations to specified customers, which is included in revenue from operations to external customers, is less than 10% of the revenue from operations stated in the consolidated statement of income.

29
c. Information on Impairment Losses of Fixed Assets by Reported Segment FY2012 (January 1, 2012 to December 31, 2012) (Million yen)
Commercial properties Residence Brokerage Other Adjustment
Amount recorded in
financial statements
Impairment loss 703 3,023 – 143 122 3,992 Note: The amount of the adjustment indicates impairment losses on company-level assets.
FY2013 (January 1, 2013 to December 31, 2013) (Million yen)
Commercial properties Residence Brokerage Other Adjustment
Amount recorded in
financial statements
Impairment loss 1,065 1,927 – 4,733 – 7,727
d. Information on Amortization of Goodwill and the Balance of Unamortized Goodwill by Reported Segment FY2012 (January 1, 2012 to December 31, 2012) (Million yen)
Commercial properties Residence Brokerage Other Adjustment
Amount recorded in
financial statements
Amortization in the fiscal year under review 30 (2) 35 189 – 252
End balance 488 (4) 70 2,540 – 3,094 Note: Amortization of goodwill and the balance of unamortized goodwill are presented by offsetting the amortization of negative goodwill and
the balance of unamortized negative goodwill. FY2013 (January 1, 2013 to December 31, 2013) (Million yen)
Commercial properties Residence Brokerage Other Adjustment
Amount recorded in
financial statements
Amortization in the fiscal year under review 29 (2) 35 228 – 290
End balance 458 (2) 35 175 – 667 Note: Amortization of goodwill and the balance of unamortized goodwill are presented by offsetting the amortization of negative goodwill and
the balance of unamortized negative goodwill. e. Information on Gains on Negative Goodwill by Reported Segment FY2012 (January 1, 2012 to December 31, 2012)
Not applicable. FY2013 (January 1, 2013 to December 31, 2013)
Tokyo Real Estate Management Co., Ltd. and Tokyo Building Service Co., Ltd., which were equity method affiliates, became consolidated subsidiaries due to the acquisition of additional shares in the commercial properties business segment. ¥2,251 million gains on negative goodwill were therefore recorded.

30
(Relating to Rental Properties) The Company and certain of its consolidated subsidiaries own office buildings for rent, condominiums for rent,
and commercial facilities for rent in Tokyo and other regions. As some of office buildings for rent are used by the Company and some of its consolidated subsidiaries, they are
posted as real estate, including portions used as rental property. The amount recorded in consolidated balance sheet and the market value of these rental prosperities and real
estate including portions used as rental property are as follows: (Million yen)
FY2012
(Jan. 1, 2012 to Dec. 31, 2012)
FY2013 (Jan. 1, 2013 to Dec. 31, 2013)
Rental prosperities
Amount recorded in consolidated balance sheet
Balance at beginning of year 344,499 325,151
Changes during the year (19,348) (15,013)
Balance at end of year 325,151 310,137
Market value at end of year 356,019 349,722
Real estate including portions used as rental property
Amount recorded in consolidated balance sheet
Balance at beginning of year 107,095 105,955
Changes during the year (1,140) (13,411)
Balance at end of year 105,955 92,543
Market value at end of year 123,844 97,100 Notes: i) The amount recorded in consolidated balance sheet is the amount obtained by subtracting accumulated depreciation from acquisition
costs. ii) The market value at the end of the term is the value based on the valuation of properties by an outside licensed real-estate appraiser
for principal properties and the value calculated by the Company based on the Real Estate Appraisal Standards (including values adjusted using indicators) for other properties.
31
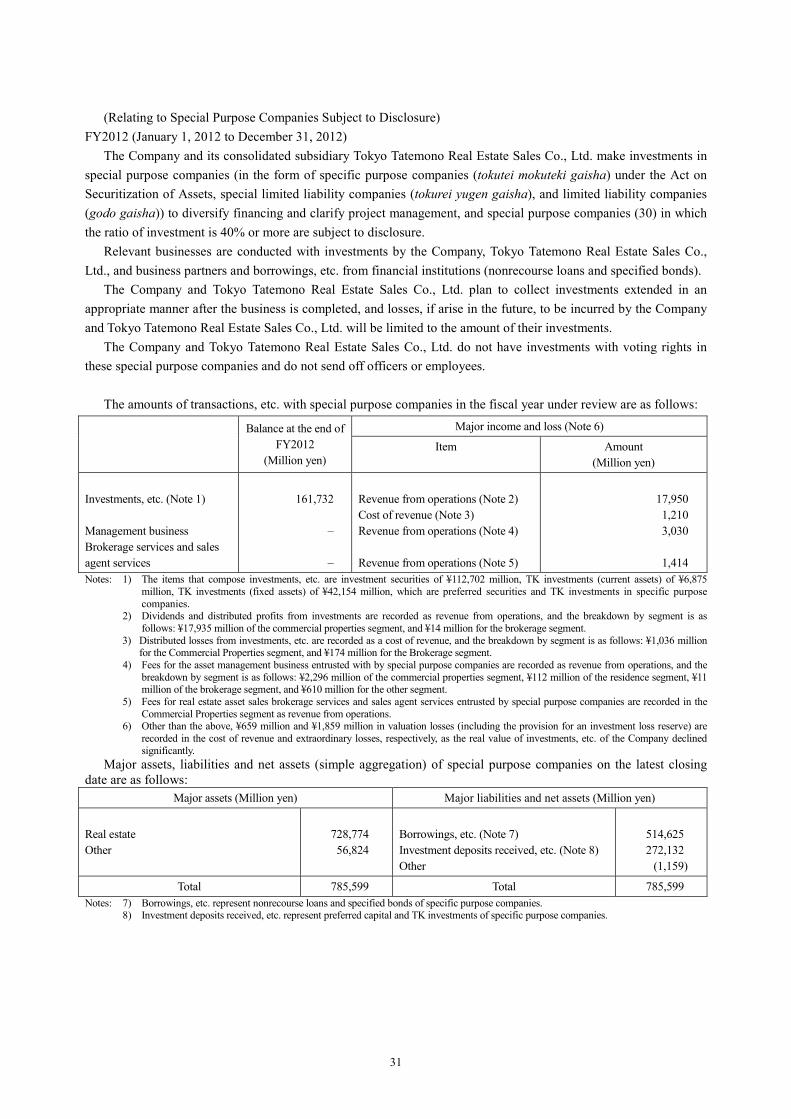
(Relating to Special Purpose Companies Subject to Disclosure)
FY2012 (January 1, 2012 to December 31, 2012) The Company and its consolidated subsidiary Tokyo Tatemono Real Estate Sales Co., Ltd. make investments in
special purpose companies (in the form of specific purpose companies (tokutei mokuteki gaisha) under the Act on Securitization of Assets, special limited liability companies (tokurei yugen gaisha), and limited liability companies (godo gaisha)) to diversify financing and clarify project management, and special purpose companies (30) in which the ratio of investment is 40% or more are subject to disclosure.
Relevant businesses are conducted with investments by the Company, Tokyo Tatemono Real Estate Sales Co., Ltd., and business partners and borrowings, etc. from financial institutions (nonrecourse loans and specified bonds).
The Company and Tokyo Tatemono Real Estate Sales Co., Ltd. plan to collect investments extended in an appropriate manner after the business is completed, and losses, if arise in the future, to be incurred by the Company and Tokyo Tatemono Real Estate Sales Co., Ltd. will be limited to the amount of their investments.
The Company and Tokyo Tatemono Real Estate Sales Co., Ltd. do not have investments with voting rights in these special purpose companies and do not send off officers or employees.
The amounts of transactions, etc. with special purpose companies in the fiscal year under review are as follows:
Balance at the end of FY2012
(Million yen)
Major income and loss (Note 6)
Item Amount (Million yen)
Investments, etc. (Note 1) Management business Brokerage services and sales agent services
161,732
–
–
Revenue from operations (Note 2) Cost of revenue (Note 3) Revenue from operations (Note 4) Revenue from operations (Note 5)
17,950 1,210 3,030
1,414
Notes: 1) The items that compose investments, etc. are investment securities of ¥112,702 million, TK investments (current assets) of ¥6,875 million, TK investments (fixed assets) of ¥42,154 million, which are preferred securities and TK investments in specific purpose companies.
2) Dividends and distributed profits from investments are recorded as revenue from operations, and the breakdown by segment is as follows: ¥17,935 million of the commercial properties segment, and ¥14 million for the brokerage segment.
3) Distributed losses from investments, etc. are recorded as a cost of revenue, and the breakdown by segment is as follows: ¥1,036 million for the Commercial Properties segment, and ¥174 million for the Brokerage segment.
4) Fees for the asset management business entrusted with by special purpose companies are recorded as revenue from operations, and the breakdown by segment is as follows: ¥2,296 million of the commercial properties segment, ¥112 million of the residence segment, ¥11 million of the brokerage segment, and ¥610 million for the other segment.
5) Fees for real estate asset sales brokerage services and sales agent services entrusted by special purpose companies are recorded in the Commercial Properties segment as revenue from operations.
6) Other than the above, ¥659 million and ¥1,859 million in valuation losses (including the provision for an investment loss reserve) are recorded in the cost of revenue and extraordinary losses, respectively, as the real value of investments, etc. of the Company declined significantly.
Major assets, liabilities and net assets (simple aggregation) of special purpose companies on the latest closing date are as follows:
Major assets (Million yen) Major liabilities and net assets (Million yen)
Real estate Other
728,774 56,824
Borrowings, etc. (Note 7) Investment deposits received, etc. (Note 8) Other
514,625 272,132
(1,159)
Total 785,599 Total 785,599 Notes: 7) Borrowings, etc. represent nonrecourse loans and specified bonds of specific purpose companies.
8) Investment deposits received, etc. represent preferred capital and TK investments of specific purpose companies.
32
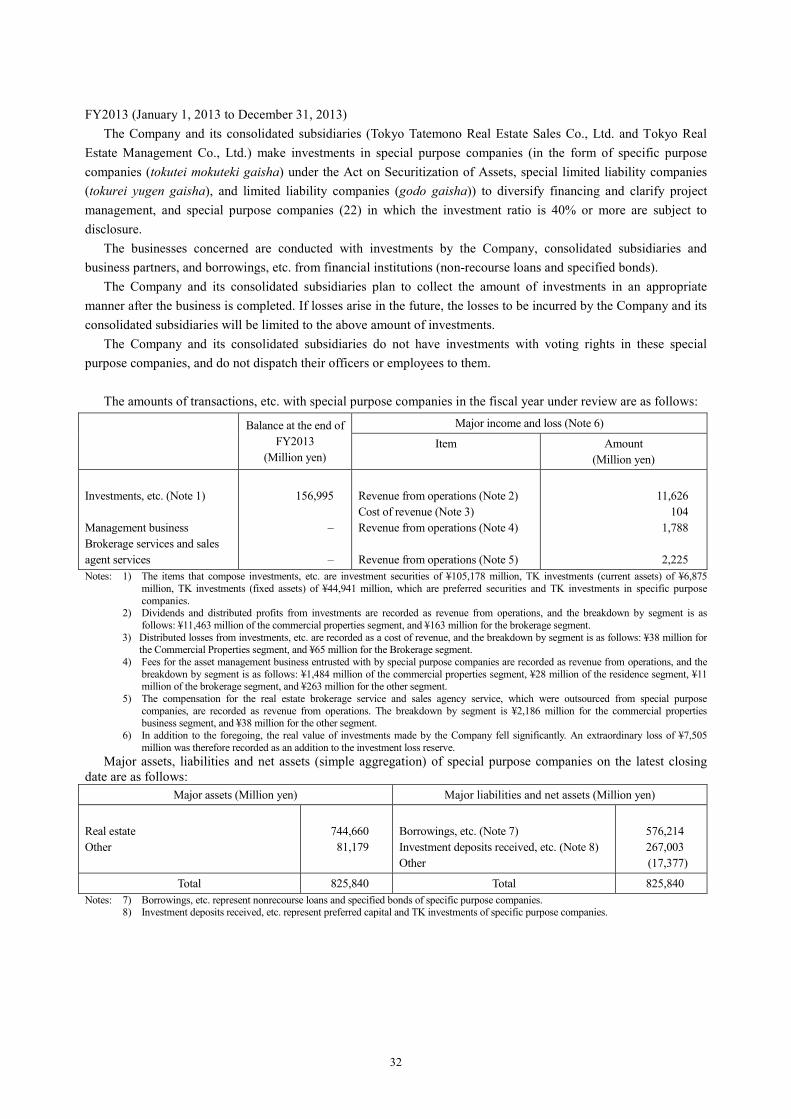
FY2013 (January 1, 2013 to December 31, 2013)
The Company and its consolidated subsidiaries (Tokyo Tatemono Real Estate Sales Co., Ltd. and Tokyo Real Estate Management Co., Ltd.) make investments in special purpose companies (in the form of specific purpose companies (tokutei mokuteki gaisha) under the Act on Securitization of Assets, special limited liability companies (tokurei yugen gaisha), and limited liability companies (godo gaisha)) to diversify financing and clarify project management, and special purpose companies (22) in which the investment ratio is 40% or more are subject to disclosure.
The businesses concerned are conducted with investments by the Company, consolidated subsidiaries and business partners, and borrowings, etc. from financial institutions (non-recourse loans and specified bonds).
The Company and its consolidated subsidiaries plan to collect the amount of investments in an appropriate manner after the business is completed. If losses arise in the future, the losses to be incurred by the Company and its consolidated subsidiaries will be limited to the above amount of investments.
The Company and its consolidated subsidiaries do not have investments with voting rights in these special purpose companies, and do not dispatch their officers or employees to them.
The amounts of transactions, etc. with special purpose companies in the fiscal year under review are as follows:
Balance at the end of FY2013
(Million yen)
Major income and loss (Note 6)
Item Amount (Million yen)
Investments, etc. (Note 1) Management business Brokerage services and sales agent services
156,995
–
–
Revenue from operations (Note 2) Cost of revenue (Note 3) Revenue from operations (Note 4) Revenue from operations (Note 5)
11,626
104 1,788
2,225
Notes: 1) The items that compose investments, etc. are investment securities of ¥105,178 million, TK investments (current assets) of ¥6,875 million, TK investments (fixed assets) of ¥44,941 million, which are preferred securities and TK investments in specific purpose companies.
2) Dividends and distributed profits from investments are recorded as revenue from operations, and the breakdown by segment is as follows: ¥11,463 million of the commercial properties segment, and ¥163 million for the brokerage segment.
3) Distributed losses from investments, etc. are recorded as a cost of revenue, and the breakdown by segment is as follows: ¥38 million for the Commercial Properties segment, and ¥65 million for the Brokerage segment.
4) Fees for the asset management business entrusted with by special purpose companies are recorded as revenue from operations, and the breakdown by segment is as follows: ¥1,484 million of the commercial properties segment, ¥28 million of the residence segment, ¥11 million of the brokerage segment, and ¥263 million for the other segment.
5) The compensation for the real estate brokerage service and sales agency service, which were outsourced from special purpose companies, are recorded as revenue from operations. The breakdown by segment is ¥2,186 million for the commercial properties business segment, and ¥38 million for the other segment.
6) In addition to the foregoing, the real value of investments made by the Company fell significantly. An extraordinary loss of ¥7,505 million was therefore recorded as an addition to the investment loss reserve.
Major assets, liabilities and net assets (simple aggregation) of special purpose companies on the latest closing date are as follows:
Major assets (Million yen) Major liabilities and net assets (Million yen)
Real estate Other
744,660 81,179
Borrowings, etc. (Note 7) Investment deposits received, etc. (Note 8) Other
576,214 267,003 (17,377)
Total 825,840 Total 825,840 Notes: 7) Borrowings, etc. represent nonrecourse loans and specified bonds of specific purpose companies.
8) Investment deposits received, etc. represent preferred capital and TK investments of specific purpose companies.
33
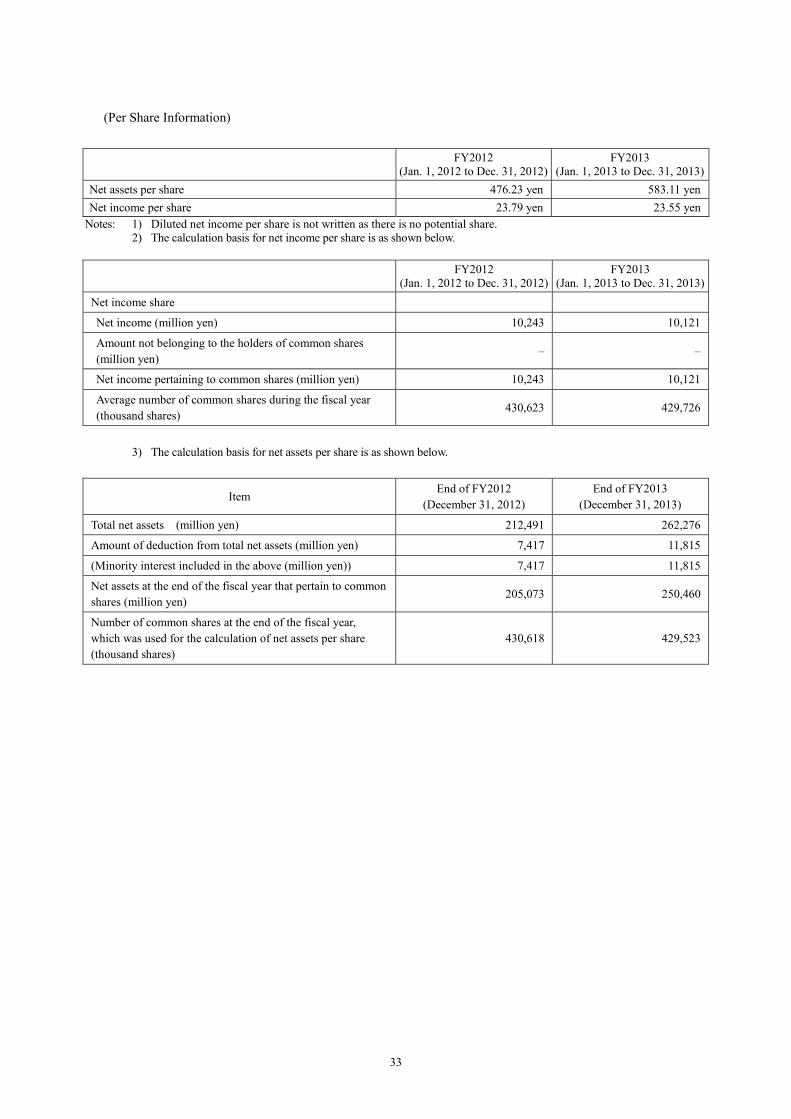
(Per Share Information)
FY2012 (Jan. 1, 2012 to Dec. 31, 2012)
FY2013 (Jan. 1, 2013 to Dec. 31, 2013)
Net assets per share 476.23 yen 583.11 yen Net income per share 23.79 yen 23.55 yen
Notes: 1) Diluted net income per share is not written as there is no potential share. 2) The calculation basis for net income per share is as shown below.
FY2012 (Jan. 1, 2012 to Dec. 31, 2012)
FY2013 (Jan. 1, 2013 to Dec. 31, 2013)
Net income share
Net income (million yen) 10,243 10,121
Amount not belonging to the holders of common shares (million yen)
– –
Net income pertaining to common shares (million yen) 10,243 10,121
Average number of common shares during the fiscal year (thousand shares)
430,623 429,726
3) The calculation basis for net assets per share is as shown below.
Item End of FY2012
(December 31, 2012) End of FY2013
(December 31, 2013)
Total net assets (million yen) 212,491 262,276
Amount of deduction from total net assets (million yen) 7,417 11,815
(Minority interest included in the above (million yen)) 7,417 11,815
Net assets at the end of the fiscal year that pertain to common shares (million yen)
205,073 250,460
Number of common shares at the end of the fiscal year, which was used for the calculation of net assets per share (thousand shares)
430,618 429,523

34
(Major Subsequent Events) (Transfer of fixed assets by a consolidated subsidiary) The consortium (hereinafter referred to as the “Consortium”), the operator of which is Tokyo Prime Stage Y.K.,
plans to become a consolidated subsidiary of the Company, and decided to transfer fixed assets as follows:
1. Profile of the consolidated subsidiary (1) Name The Consortium, the operator of which is Tokyo Prime Stage Y.K. (2) Address (operator) Sakura Sogo Office, 1-11, Kandajinbocho, Chiyoda-ku Tokyo (3) Representative (operator) Tomoyoshi Horikawa, Director (4) Business Holding and sale of real estate trust beneficiary rights, etc. (5) Capital stock (operator) ¥3 million *1 The Consortium is planned to be included in the scope of consolidation from the fiscal year ending December 2014 in
accordance with the accounting standard for consolidated financial statements (No. 22 Corporate Accounting Standard dated March 25, 2011), which will apply from the beginning of the fiscal year ending December 2014.
*2 The Company resolved that it, as an investor in the Consortium, will approve the transfer of assets by the Consortium. 2. Reasons for transfer
As to Otemachi Tower, the trust beneficiary right of which is held by the Consortium, Mizuho Bank, Ltd. a tenant of the building, requested the purchase of part of the trust beneficiary right. We will transfer it to Mizuho Bank, Ltd. based on the following conditions, taking into account the viewpoint of the normalization of the holding asset portfolio after the inclusion of SPC in consolidation. 3. Outline of Otemachi Tower (whole) (1) Address 1-5-5, Otemachi, Chiyoda-ku Tokyo (2) Total floor space 198,467.44 m2 (planned) (3) Size 38 stories above ground, six floors underground, and three-storied penthouse (4) Date of completion First phase completion: August 2013, entire completion: April 2014 (planned) 4. Details of assets to be transferred
(1) Outline of assets to be transferred
Trust beneficiary right, the trust property of which is a 30% co-ownership share of the exclusively held area of around 114,000 ㎡ of the offices of Otemachi Tower and land use rights
(2) Transfer price ¥178.2 billion
(3) Book value Approximately ¥58.0 billion
(4) Capital gains Approximately ¥120.0 billion 5. Profile of transferee (1) Name Mizuho Bank, Ltd. (2) Address 1-3-3, Marunouchi, Chiyoda-ku Tokyo (3) Representative Yasuhiro Sato, President and Director
(4) Business Deposit business, loan business, commodity and securities trading business, and securities investment business, etc.
(5) Capital stock ¥1,404,065 million 6. Schedule for transfer (1) Conclusion of a sales agreement: February 12, 2014 (2) Transfer of the right of ownership: March 26, 2014 (planned)

35
7. Recording of extraordinary gains and future outlook The extraordinary gain of around ¥120.0 billion as a gain on the sale of fixed assets will accrue due to the
transfer of these fixed assets. Refer to the forecast of consolidated results for the fiscal year ending December 2014 for the impact on the consolidated results.
(Million yen) Revenue from
operations Operating income Recurring income Net income
Forecast of consolidated results for the fiscal year ending December 2014
225,000 27,000 8,000 60,000
Consolidated results for the fiscal year ended December 2013
220,026 29,361 21,959 10,121
*3 The Company’s share of the assets to be transferred is assumed to be around 50% for the forecast of consolidated results for the fiscal year ending December 2014.