outline - university of california, san...
TRANSCRIPT
Word embeddings
Sanjoy Dasgupta
Outline
1 Goal and approach
2 Some early word embeddings
3 The word2vec embedding
4 Linguistic regularities in embeddings

Goal
Map words to vectors so that:
Words with similar meaning have vectors that are closetogether.
Why would we want this?
The distributional hypothesis
Firth (1957):
You shall know a word by the company it keeps.
Example from Nida (1975): You encounter a new word, tezguino.
It appears in the following contexts:
• A bottle of is on the table.
• Everybody likes .
• Don’t have before you drive.
• We make out of corn.
Represent each word w by a vector that captures the contexts inwhich w appears.
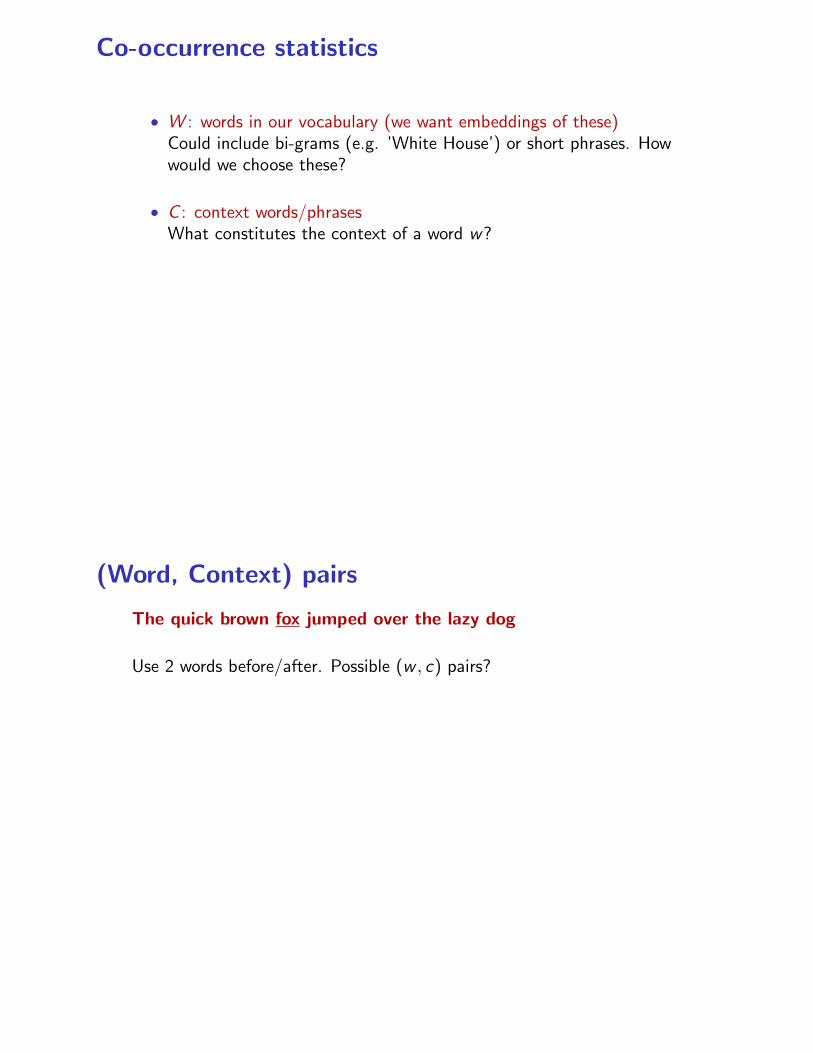
Co-occurrence statistics
• W : words in our vocabulary (we want embeddings of these)Could include bi-grams (e.g. ’White House’) or short phrases. Howwould we choose these?
• C : context words/phrasesWhat constitutes the context of a word w?
(Word, Context) pairs
The quick brown fox jumped over the lazy dog
Use 2 words before/after. Possible (w , c) pairs?
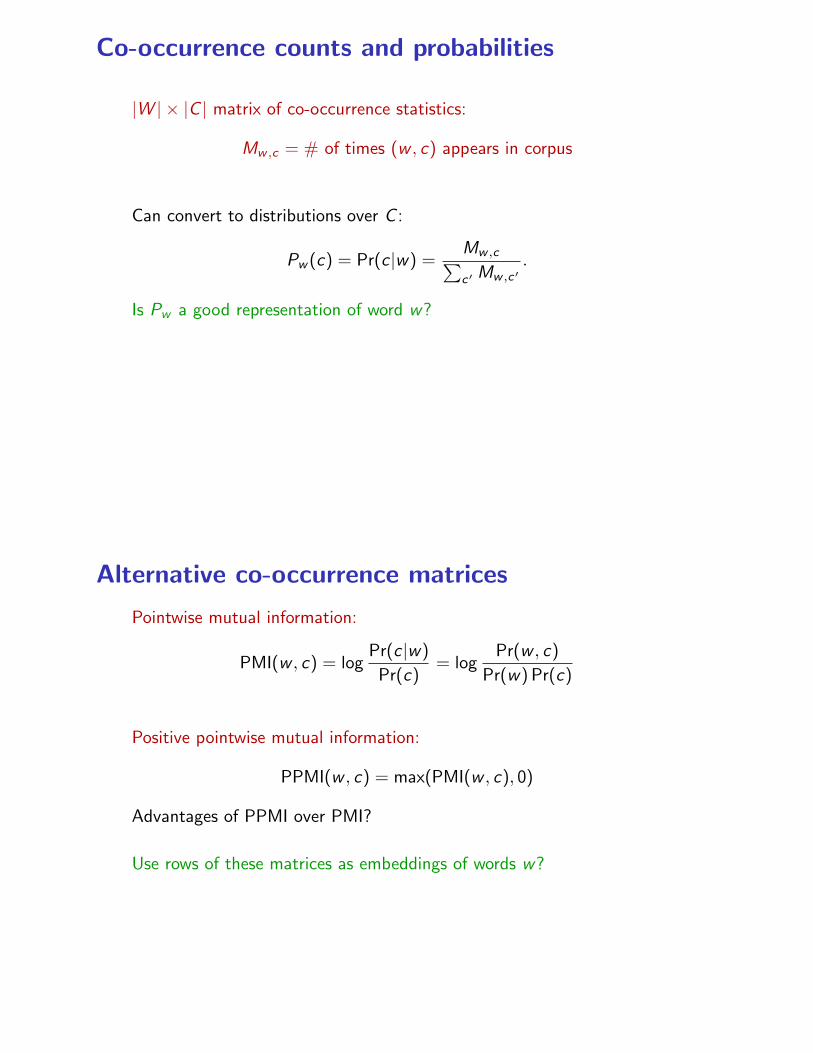
Co-occurrence counts and probabilities
|W | × |C | matrix of co-occurrence statistics:
Mw ,c = # of times (w , c) appears in corpus
Can convert to distributions over C :
Pw (c) = Pr(c |w) =Mw ,c∑c′ Mw ,c′
.
Is Pw a good representation of word w?
Alternative co-occurrence matrices
Pointwise mutual information:
PMI(w , c) = logPr(c |w)
Pr(c)= log
Pr(w , c)
Pr(w) Pr(c)
Positive pointwise mutual information:
PPMI(w , c) = max(PMI(w , c), 0)
Advantages of PPMI over PMI?
Use rows of these matrices as embeddings of words w?

Latent semantic analysis
S. Deerwester, S.T. Dumais, G.W. Furnas, T.K. Landauer and R. Harshman.
Indexing By Latent Semantic Analysis. Journal of the American Society For
Information Science, 41, 391-407, 1990.
Start with one of:
• Pw vectors
• PMIw vectors
• PPMIw vectors
Apply PCA to (1) reduce dimension and (2) denoise.
Brown clustering
P.F. Brown, P.V. deSouza, R.L. Mercer, V.J. Della Pietra and J.C. Lai.
Class-based n-gram models of natural language. Computational Linguistics, 18
(4), 1992.
Hierarchically cluster words W using Pw (or PMIw , or PPMIw ) vectors.
Computational Linguistics Volume 18, Number 4
plan letter
request memo
case question -'-7
charge----I ~__ statement L - ]
draft ~
F- .evaluation
assessment ~ " analysis ,.,
understanding opinion 1 I
conversation discussion
day year
week month
quarter half
iI
accounts people
customers individuals employees
students ]
reps i ~ representatives representative
rep Figure 2 Sample subtrees from a 1,000-word mutual information tree.
iL I
to this single cluster and the leaves of which correspond to the words in the vocabulary. Intermediate nodes of the tree correspond to groupings of words intermediate between single words and the entire vocabulary. Words that are statistically similar with respect to their immediate neighbors in running text will be close together in the tree. We have applied this tree-building algorithm to vocabularies of up to 5,000 words. Figure 2 shows some of the substructures in a tree constructed in this manner for the 1,000 most frequent words in a collection of office correspondence.
Beyond 5,000 words this algorithm also fails of practicality. To obtain clusters for larger vocabularies, we proceed as follows. We arrange the words in the vocabulary in order of frequency with the most frequent words first and assign each of the first C words to its own, distinct class. At the first step of the algorithm, we assign the (C Jr 1) st most probable word to a new class and merge that pair among the resulting C + 1 classes for which the loss in average mutual information is least. At the k th step of the algorithm, we assign the (C + k) th most probable word to a new class. This restores the number of classes to C + 1, and we again merge that pair for which the loss in average mutual information is least. After V - C steps, each of the words in the vocabulary will have been assigned to one of C classes.
We have used this algorithm to divide the 260,741-word vocabulary of Table I into 1,000 classes. Table 2 contains examples of classes that we find particularly interesting. Table 3 contains examples that were selected at random. Each of the lines in the tables contains members of a different class. The average class has 260 words and so to make the table manageable, we include only words that occur at least ten times and
474
How would we get vectors from a hierarchy?
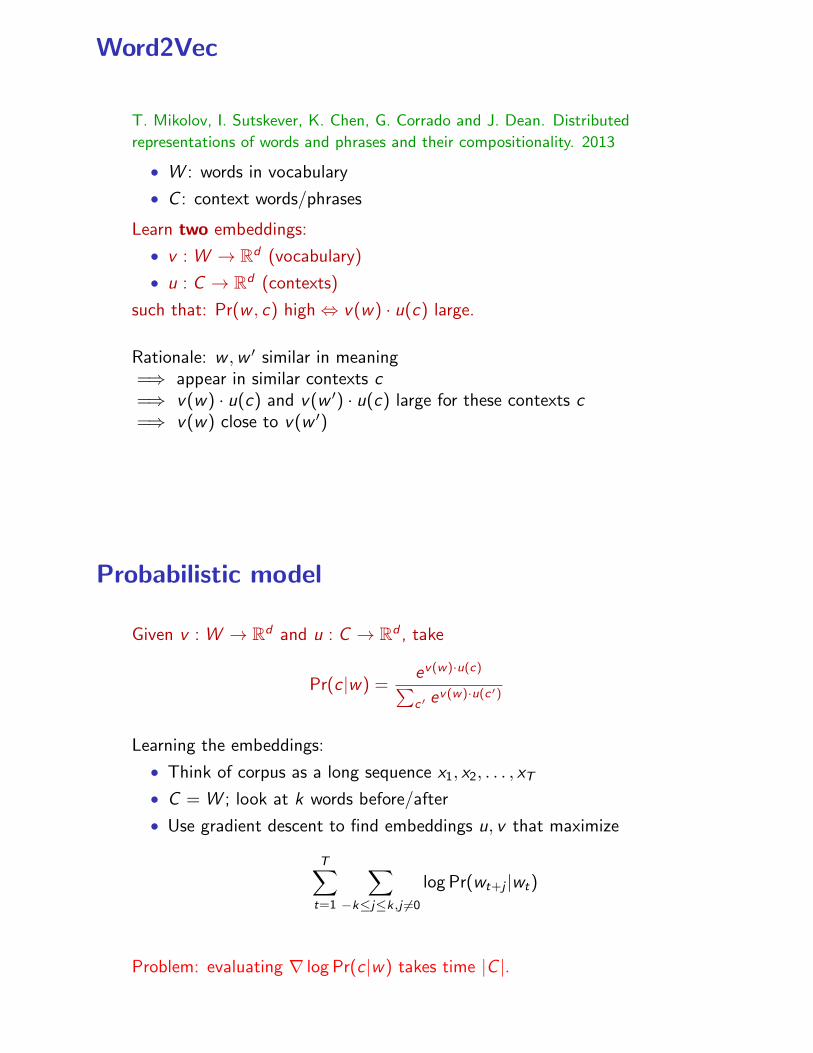
Word2Vec
T. Mikolov, I. Sutskever, K. Chen, G. Corrado and J. Dean. Distributed
representations of words and phrases and their compositionality. 2013
• W : words in vocabulary
• C : context words/phrases
Learn two embeddings:
• v : W → Rd (vocabulary)
• u : C → Rd (contexts)
such that: Pr(w , c) high⇔ v(w) · u(c) large.
Rationale: w ,w ′ similar in meaning=⇒ appear in similar contexts c=⇒ v(w) · u(c) and v(w ′) · u(c) large for these contexts c=⇒ v(w) close to v(w ′)
Probabilistic model
Given v : W → Rd and u : C → Rd , take
Pr(c |w) =ev(w)·u(c)
∑c′ e
v(w)·u(c′)
Learning the embeddings:
• Think of corpus as a long sequence x1, x2, . . . , xT
• C = W ; look at k words before/after
• Use gradient descent to find embeddings u, v that maximize
T∑
t=1
∑
−k≤j≤k,j 6=0
log Pr(wt+j |wt)
Problem: evaluating ∇ log Pr(c |w) takes time |C |.
Negative sampling
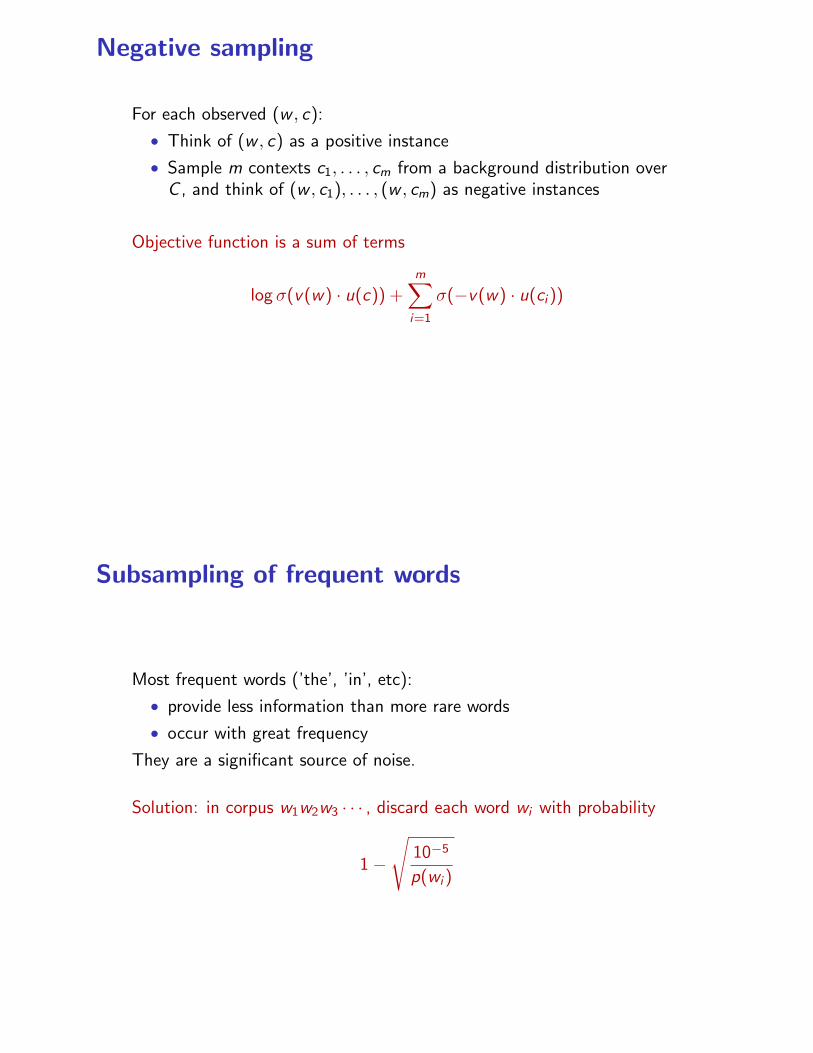
For each observed (w , c):
• Think of (w , c) as a positive instance
• Sample m contexts c1, . . . , cm from a background distribution overC , and think of (w , c1), . . . , (w , cm) as negative instances
Objective function is a sum of terms
log σ(v(w) · u(c)) +m∑
i=1
σ(−v(w) · u(ci ))
Subsampling of frequent words
Most frequent words (’the’, ’in’, etc):
• provide less information than more rare words
• occur with great frequency
They are a significant source of noise.
Solution: in corpus w1w2w3 · · · , discard each word wi with probability
1−√
10−5
p(wi )
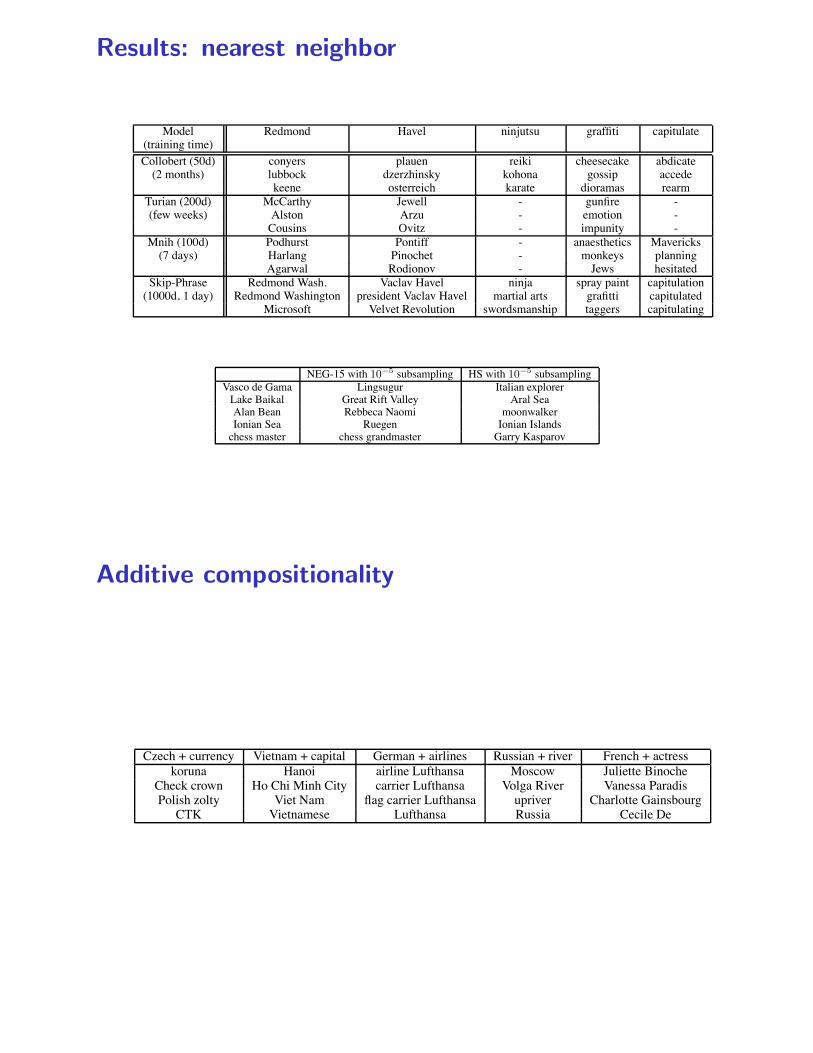
Results: nearest neighbor
Model Redmond Havel ninjutsu graffiti capitulate(training time)Collobert (50d) conyers plauen reiki cheesecake abdicate(2 months) lubbock dzerzhinsky kohona gossip accede
keene osterreich karate dioramas rearmTurian (200d) McCarthy Jewell - gunfire -(few weeks) Alston Arzu - emotion -
Cousins Ovitz - impunity -Mnih (100d) Podhurst Pontiff - anaesthetics Mavericks(7 days) Harlang Pinochet - monkeys planning
Agarwal Rodionov - Jews hesitatedSkip-Phrase Redmond Wash. Vaclav Havel ninja spray paint capitulation(1000d, 1 day) Redmond Washington president Vaclav Havel martial arts grafitti capitulated
Microsoft Velvet Revolution swordsmanship taggers capitulating
Table 6: Examples of the closest tokens given various well known models and the Skip-gram modeltrained on phrases using over 30 billion training words. An empty cell means that the word was notin the vocabulary.
To give more insight into the difference of the quality of the learned vectors, we provide empiricalcomparison by showing the nearest neighbours of infrequent words in Table 6. These examples showthat the big Skip-gram model trained on a large corpus visibly outperforms all the other models inthe quality of the learned representations. This can be attributed in part to the fact that this modelhas been trained on about 30 billion words, which is about two to three orders of magnitude moredata than the typical size used in the prior work. Interestingly, although the training set is muchlarger, the training time of the Skip-gram model is just a fraction of the time complexity required bythe previous model architectures.
7 Conclusion
This work has several key contributions. We show how to train distributed representations of wordsand phrases with the Skip-gram model and demonstrate that these representations exhibit linearstructure that makes precise analogical reasoning possible. The techniques introduced in this papercan be used also for training the continuous bag-of-words model introduced in [8].
We successfully trained models on several orders of magnitude more data than the previously pub-lished models, thanks to the computationally efficient model architecture. This results in a greatimprovement in the quality of the learned word and phrase representations, especially for the rareentities. We also found that the subsampling of the frequent words results in both faster trainingand significantly better representations of uncommon words. Another contribution of our paper isthe Negative sampling algorithm, which is an extremely simple training method that learns accuraterepresentations especially for frequent words.
The choice of the training algorithm and the hyper-parameter selection is a task specific decision,as we found that different problems have different optimal hyperparameter configurations. In ourexperiments, the most crucial decisions that affect the performance are the choice of the modelarchitecture, the size of the vectors, the subsampling rate, and the size of the training window.
A very interesting result of this work is that the word vectors can be somewhat meaningfully com-bined using just simple vector addition. Another approach for learning representations of phrasespresented in this paper is to simply represent the phrases with a single token. Combination of thesetwo approaches gives a powerful yet simple way how to represent longer pieces of text, while hav-ing minimal computational complexity. Our work can thus be seen as complementary to the existingapproach that attempts to represent phrases using recursive matrix-vector operations [16].
We made the code for training the word and phrase vectors based on the techniques described in thispaper available as an open-source project4.
4code.google.com/p/word2vec
8
NEG-15 with 10−5 subsampling HS with 10−5 subsamplingVasco de Gama Lingsugur Italian explorerLake Baikal Great Rift Valley Aral SeaAlan Bean Rebbeca Naomi moonwalkerIonian Sea Ruegen Ionian Islandschess master chess grandmaster Garry Kasparov
Table 4: Examples of the closest entities to the given short phrases, using two different models.
Czech + currency Vietnam + capital German + airlines Russian + river French + actresskoruna Hanoi airline Lufthansa Moscow Juliette Binoche
Check crown Ho Chi Minh City carrier Lufthansa Volga River Vanessa ParadisPolish zolty Viet Nam flag carrier Lufthansa upriver Charlotte GainsbourgCTK Vietnamese Lufthansa Russia Cecile De
Table 5: Vector compositionality using element-wise addition. Four closest tokens to the sum of twovectors are shown, using the best Skip-gram model.
To maximize the accuracy on the phrase analogy task, we increased the amount of the training databy using a dataset with about 33 billion words. We used the hierarchical softmax, dimensionalityof 1000, and the entire sentence for the context. This resulted in a model that reached an accuracyof 72%. We achieved lower accuracy 66% when we reduced the size of the training dataset to 6Bwords, which suggests that the large amount of the training data is crucial.
To gain further insight into how different the representations learned by different models are, we didinspect manually the nearest neighbours of infrequent phrases using various models. In Table 4, weshow a sample of such comparison. Consistently with the previous results, it seems that the bestrepresentations of phrases are learned by a model with the hierarchical softmax and subsampling.
5 Additive Compositionality
We demonstrated that the word and phrase representations learned by the Skip-gram model exhibita linear structure that makes it possible to perform precise analogical reasoning using simple vectorarithmetics. Interestingly, we found that the Skip-gram representations exhibit another kind of linearstructure that makes it possible to meaningfully combine words by an element-wise addition of theirvector representations. This phenomenon is illustrated in Table 5.
The additive property of the vectors can be explained by inspecting the training objective. The wordvectors are in a linear relationship with the inputs to the softmax nonlinearity. As the word vectorsare trained to predict the surrounding words in the sentence, the vectors can be seen as representingthe distribution of the context in which a word appears. These values are related logarithmicallyto the probabilities computed by the output layer, so the sum of two word vectors is related to theproduct of the two context distributions. The product works here as the AND function: words thatare assigned high probabilities by both word vectors will have high probability, and the other wordswill have low probability. Thus, if “Volga River” appears frequently in the same sentence togetherwith the words “Russian” and “river”, the sum of these two word vectors will result in such a featurevector that is close to the vector of “Volga River”.
6 Comparison to Published Word Representations
Many authors who previously worked on the neural network based representations of words havepublished their resulting models for further use and comparison: amongst the most well known au-thors are Collobert and Weston [2], Turian et al. [17], and Mnih and Hinton [10]. We downloadedtheir word vectors from the web3. Mikolov et al. [8] have already evaluated these word representa-tions on the word analogy task, where the Skip-gram models achieved the best performance with ahuge margin.
3http://metaoptimize.com/projects/wordreprs/
7
Additive compositionality
NEG-15 with 10−5 subsampling HS with 10−5 subsamplingVasco de Gama Lingsugur Italian explorerLake Baikal Great Rift Valley Aral SeaAlan Bean Rebbeca Naomi moonwalkerIonian Sea Ruegen Ionian Islandschess master chess grandmaster Garry Kasparov
Table 4: Examples of the closest entities to the given short phrases, using two different models.
Czech + currency Vietnam + capital German + airlines Russian + river French + actresskoruna Hanoi airline Lufthansa Moscow Juliette Binoche
Check crown Ho Chi Minh City carrier Lufthansa Volga River Vanessa ParadisPolish zolty Viet Nam flag carrier Lufthansa upriver Charlotte GainsbourgCTK Vietnamese Lufthansa Russia Cecile De
Table 5: Vector compositionality using element-wise addition. Four closest tokens to the sum of twovectors are shown, using the best Skip-gram model.
To maximize the accuracy on the phrase analogy task, we increased the amount of the training databy using a dataset with about 33 billion words. We used the hierarchical softmax, dimensionalityof 1000, and the entire sentence for the context. This resulted in a model that reached an accuracyof 72%. We achieved lower accuracy 66% when we reduced the size of the training dataset to 6Bwords, which suggests that the large amount of the training data is crucial.
To gain further insight into how different the representations learned by different models are, we didinspect manually the nearest neighbours of infrequent phrases using various models. In Table 4, weshow a sample of such comparison. Consistently with the previous results, it seems that the bestrepresentations of phrases are learned by a model with the hierarchical softmax and subsampling.
5 Additive Compositionality
We demonstrated that the word and phrase representations learned by the Skip-gram model exhibita linear structure that makes it possible to perform precise analogical reasoning using simple vectorarithmetics. Interestingly, we found that the Skip-gram representations exhibit another kind of linearstructure that makes it possible to meaningfully combine words by an element-wise addition of theirvector representations. This phenomenon is illustrated in Table 5.
The additive property of the vectors can be explained by inspecting the training objective. The wordvectors are in a linear relationship with the inputs to the softmax nonlinearity. As the word vectorsare trained to predict the surrounding words in the sentence, the vectors can be seen as representingthe distribution of the context in which a word appears. These values are related logarithmicallyto the probabilities computed by the output layer, so the sum of two word vectors is related to theproduct of the two context distributions. The product works here as the AND function: words thatare assigned high probabilities by both word vectors will have high probability, and the other wordswill have low probability. Thus, if “Volga River” appears frequently in the same sentence togetherwith the words “Russian” and “river”, the sum of these two word vectors will result in such a featurevector that is close to the vector of “Volga River”.
6 Comparison to Published Word Representations
Many authors who previously worked on the neural network based representations of words havepublished their resulting models for further use and comparison: amongst the most well known au-thors are Collobert and Weston [2], Turian et al. [17], and Mnih and Hinton [10]. We downloadedtheir word vectors from the web3. Mikolov et al. [8] have already evaluated these word representa-tions on the word analogy task, where the Skip-gram models achieved the best performance with ahuge margin.
3http://metaoptimize.com/projects/wordreprs/
7
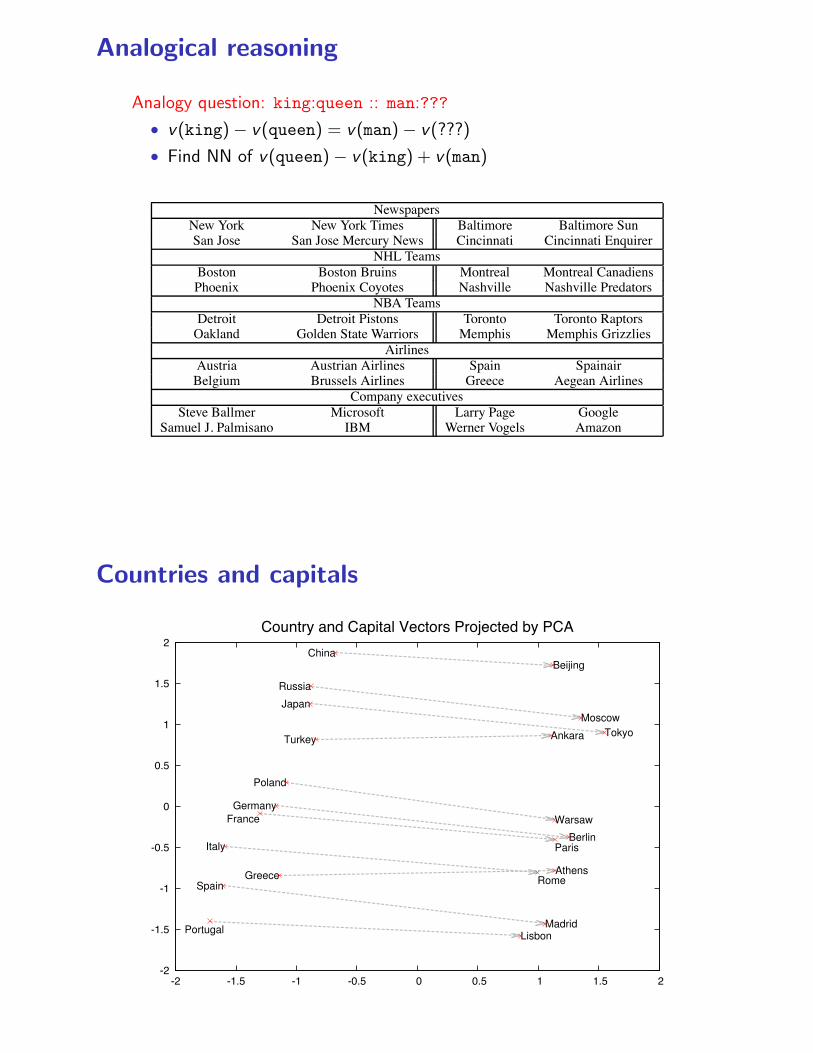
Analogical reasoning
Analogy question: king:queen :: man:???
• v(king)− v(queen) = v(man)− v(???)
• Find NN of v(queen)− v(king) + v(man)
NewspapersNew York New York Times Baltimore Baltimore SunSan Jose San Jose Mercury News Cincinnati Cincinnati Enquirer
NHL TeamsBoston Boston Bruins Montreal Montreal CanadiensPhoenix Phoenix Coyotes Nashville Nashville Predators
NBA TeamsDetroit Detroit Pistons Toronto Toronto RaptorsOakland Golden State Warriors Memphis Memphis Grizzlies
AirlinesAustria Austrian Airlines Spain SpainairBelgium Brussels Airlines Greece Aegean Airlines
Company executivesSteve Ballmer Microsoft Larry Page Google
Samuel J. Palmisano IBM Werner Vogels Amazon
Table 2: Examples of the analogical reasoning task for phrases (the full test set has 3218 examples).The goal is to compute the fourth phrase using the first three. Our best model achieved an accuracyof 72% on this dataset.
This way, we can form many reasonable phrases without greatly increasing the size of the vocabu-lary; in theory, we can train the Skip-gram model using all n-grams, but that would be too memoryintensive. Many techniques have been previously developed to identify phrases in the text; however,it is out of scope of our work to compare them. We decided to use a simple data-driven approach,where phrases are formed based on the unigram and bigram counts, using
score(wi, wj) =count(wiwj) − δ
count(wi) × count(wj). (6)
The δ is used as a discounting coefficient and prevents too many phrases consisting of very infre-quent words to be formed. The bigrams with score above the chosen threshold are then used asphrases. Typically, we run 2-4 passes over the training data with decreasing threshold value, allow-ing longer phrases that consists of several words to be formed. We evaluate the quality of the phraserepresentations using a new analogical reasoning task that involves phrases. Table 2 shows examplesof the five categories of analogies used in this task. This dataset is publicly available on the web2.
4.1 Phrase Skip-Gram Results
Starting with the same news data as in the previous experiments, we first constructed the phrasebased training corpus and then we trained several Skip-gram models using different hyper-parameters. As before, we used vector dimensionality 300 and context size 5. This setting alreadyachieves good performance on the phrase dataset, and allowed us to quickly compare the NegativeSampling and the Hierarchical Softmax, both with and without subsampling of the frequent tokens.The results are summarized in Table 3.
The results show that while Negative Sampling achieves a respectable accuracy even with k = 5,using k = 15 achieves considerably better performance. Surprisingly, while we found the Hierar-chical Softmax to achieve lower performance when trained without subsampling, it became the bestperforming method when we downsampled the frequent words. This shows that the subsamplingcan result in faster training and can also improve accuracy, at least in some cases.
2code.google.com/p/word2vec/source/browse/trunk/questions-phrases.txt
Method Dimensionality No subsampling [%] 10−5 subsampling [%]NEG-5 300 24 27NEG-15 300 27 42
HS-Huffman 300 19 47
Table 3: Accuracies of the Skip-gram models on the phrase analogy dataset. The models weretrained on approximately one billion words from the news dataset.
6
Countries and capitals
-2
-1.5
-1
-0.5
0
0.5
1
1.5
2
-2 -1.5 -1 -0.5 0 0.5 1 1.5 2
Country and Capital Vectors Projected by PCAChina
Japan
France
Russia
Germany
Italy
SpainGreece
Turkey
Beijing
Paris
Tokyo
Poland
Moscow
Portugal
Berlin
RomeAthens
Madrid
Ankara
Warsaw
Lisbon
Figure 2: Two-dimensional PCA projection of the 1000-dimensional Skip-gram vectors of countries and theircapital cities. The figure illustrates ability of the model to automatically organize concepts and learn implicitlythe relationships between them, as during the training we did not provide any supervised information aboutwhat a capital city means.
which is used to replace every log P (wO|wI) term in the Skip-gram objective. Thus the task is todistinguish the target word wO from draws from the noise distribution Pn(w) using logistic regres-sion, where there are k negative samples for each data sample. Our experiments indicate that valuesof k in the range 5–20 are useful for small training datasets, while for large datasets the k can be assmall as 2–5. The main difference between the Negative sampling and NCE is that NCE needs bothsamples and the numerical probabilities of the noise distribution, while Negative sampling uses onlysamples. And while NCE approximately maximizes the log probability of the softmax, this propertyis not important for our application.
Both NCE and NEG have the noise distributionPn(w) as a free parameter. We investigated a numberof choices for Pn(w) and found that the unigram distribution U(w) raised to the 3/4rd power (i.e.,U(w)3/4/Z) outperformed significantly the unigram and the uniform distributions, for both NCEand NEG on every task we tried including language modeling (not reported here).
2.3 Subsampling of Frequent Words
In very large corpora, the most frequent words can easily occur hundreds of millions of times (e.g.,“in”, “the”, and “a”). Such words usually provide less information value than the rare words. Forexample, while the Skip-gram model benefits from observing the co-occurrences of “France” and“Paris”, it benefits much less from observing the frequent co-occurrences of “France” and “the”, asnearly every word co-occurs frequently within a sentence with “the”. This idea can also be appliedin the opposite direction; the vector representations of frequent words do not change significantlyafter training on several million examples.
To counter the imbalance between the rare and frequent words, we used a simple subsampling ap-proach: each word wi in the training set is discarded with probability computed by the formula
P (wi) = 1 −!
t
f(wi)(5)
4
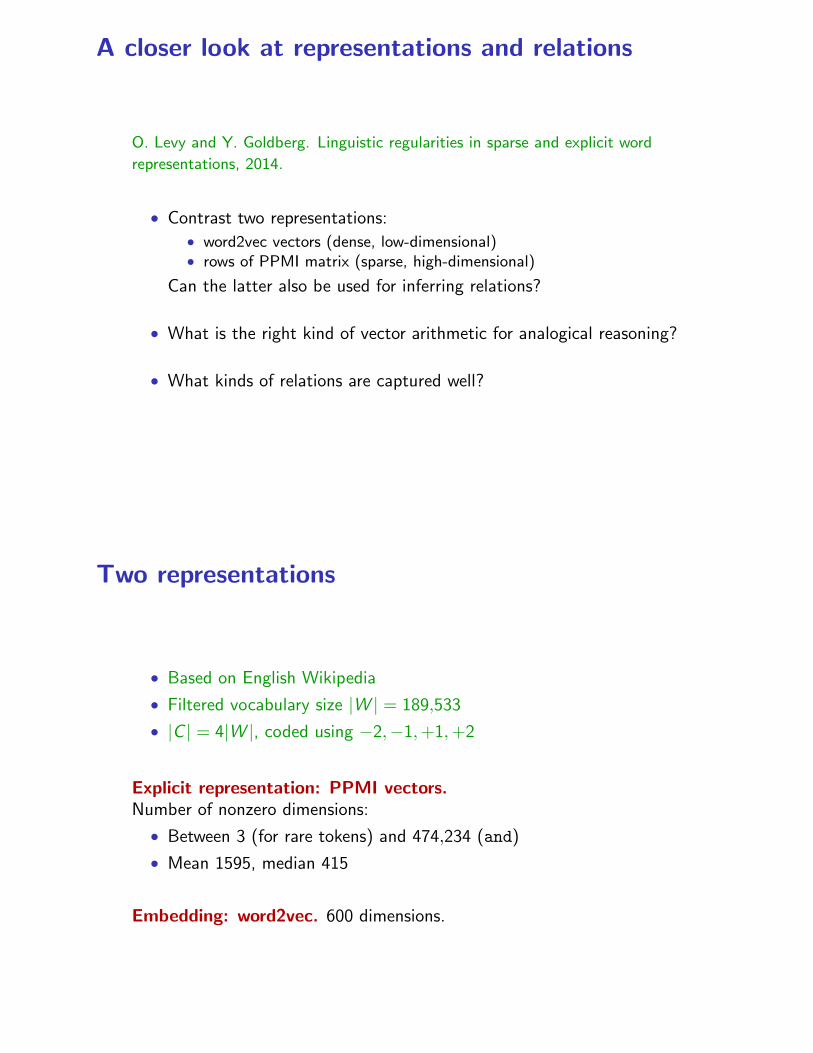
A closer look at representations and relations
O. Levy and Y. Goldberg. Linguistic regularities in sparse and explicit word
representations, 2014.
• Contrast two representations:• word2vec vectors (dense, low-dimensional)• rows of PPMI matrix (sparse, high-dimensional)
Can the latter also be used for inferring relations?
• What is the right kind of vector arithmetic for analogical reasoning?
• What kinds of relations are captured well?
Two representations
• Based on English Wikipedia
• Filtered vocabulary size |W | = 189,533
• |C | = 4|W |, coded using −2,−1,+1,+2
Explicit representation: PPMI vectors.Number of nonzero dimensions:
• Between 3 (for rare tokens) and 474,234 (and)
• Mean 1595, median 415
Embedding: word2vec. 600 dimensions.

Google open vocabulary task
• capital-common-countries, e.g. Athens Greece Baghdad Iraq
• capital-world, e.g. Abuja Nigeria Accra Ghana
• currency, e.g. Algeria dinar Angola kwanza
• city-in-state, e.g. Chicago Illinois Houston Texas
• family, e.g. uncle aunt nephew niece
• adjective-to-adverb, e.g. amazing amazingly calm calmly
• opposite, e.g. clear unclear known unknown
• comparative, e.g. bad worse big bigger
• superlative, e.g. bad worst big biggest
• present-participle, e.g. code coding dance dancing
• nationality-adjective, e.g. China Chinese Spain Spanish
• past-tense, e.g. dancing danced falling fell
• plural, e.g. banana bananas man men
• plural-verbs, e.g. eat eats go goes
Sem-Eval 2012 task
79 semantic relations, each specified by a few characteristic pairs, e.g.
• Reverse: attack:defend, buy:sell, love:hate, expand:contract,command:obey
• Conversion: apprentice:master, colt:horse, grape:wine
• Contiguity: coast:ocean, sidewalk:road, horizon:sky, fence:property
• Cause:Effect: enigma:puzzlement, joke:laughter, practice:improvement
• Event:Feature: rodeo:cowboy, banquet:food, wedding:bride
• Object:Typical Action: glass:break, soldier:fight, juggernaut:crush,sycophant:flatter, quisling:betray
• Sign:Significant: siren:danger, scepter:authority, signature:approval
Given a list of word pairs, rank them according to the degree to which the
specified relation holds.

Vector arithmetic for analogies
To solve: a : b :: a∗ :?, find b∗ using
arg maxb∗
sim(b∗, (b − a + a∗)) where sim(u, v) =u · v‖u‖‖v‖ .
Word2Vec experiments: vectors normalized to unit length, same as
arg maxb∗
(b∗ · b)− (b∗ · a) + (b∗ · a∗)
Alternative multiplicative version:
arg maxb∗
(b∗ · b)(b∗ · a∗)(b∗ · a) + ε
Additive vs multiplicative
London:England :: Baghdad:???
Additive criterion returns Mosul.
Representation MSR GOOGLE SEMEVALEmbedding 9.26% 14.51% 44.77%
Explicit 0.66% 0.75% 45.19%
Table 2: Performance of PAIRDIRECTION on different taskswith the explicit and neural embedding representations.
The results in Table 2 show that the PAIRDI-RECTION method is better than 3COSADD onthe restricted-vocabulary SEMEVAL task (accu-racy jumps from 38% to 45%), but fails at theopen-vocabulary questions in GOOGLE and MSR.When the method does work, the numbers for theexplicit and embedded representations are againcomparable to one another.
Why is PAIRDIRECTION performing so wellon the SEMEVAL task, yet so poorly on the oth-ers? Recall that the PAIRDIRECTION objectivefocuses on the similarity of b⇤ � b and a⇤ � a,but does not take into account the spatial distancesbetween the individual vectors. Relying on di-rection alone, while ignoring spatial distance, isproblematic when considering the entire vocabu-lary as candidates (as is required in the MSR andGOOGLE tasks). We are likely to find candidatesb⇤ that have the same relation to b as reflected bya � a⇤ but are not necessarily similar to b. As aconcrete example, in man:woman, king:?, we arelikely to recover feminine entities, but not neces-sarily royal ones. The SEMEVAL test set, on theother hand, already provides related (and thereforegeometrically close) candidates, leaving mainlythe direction to reason about.
6 Refining the Objective Function
The 3COSADD objective, as expressed in (3), re-veals a “balancing act” between two attractors andone repeller, i.e. two terms that we wish to maxi-mize and one that needs to be minimized:
arg maxb⇤2V
(cos (b⇤, b) � cos (b⇤, a) + cos (b⇤, a⇤))
A known property of such linear objectives is thatthey exhibit a “soft-or” behavior and allow onesufficiently large term to dominate the expression.This behavior is problematic in our setup, becauseeach term reflects a different aspect of similarity,and the different aspects have different scales. Forexample, king is more royal than it is masculine,and will therefore overshadow the gender aspectof the analogy. It is especially true in the case ofexplicit vector representations, as each aspect of
the similarity is manifested by a different set offeatures with varying sizes and weights.
A case in point is the analogy question “Londonis to England as Baghdad is to — ?”, which weanswer using:
arg maxx2V
(cos (x, en) � cos (x, lo) + cos (x, ba))
We seek a word (Iraq) which is similar to Eng-land (both are countries), is similar to Baghdad(similar geography/culture) and is dissimilar toLondon (different geography/culture). Maximiz-ing the sum yields an incorrect answer (under bothrepresentations): Mosul, a large Iraqi city. Look-ing at the computed similarities in the explicit vec-tor representation, we see that both Mosul and Iraqare very close to Baghdad, and are quite far fromEngland and London:
(EXP) " England # London " Baghdad SumMosul 0.031 0.031 0.244 0.244Iraq 0.049 0.038 0.206 0.217
The same trends appear in the neural embeddingvectors, though with different similarity scores:
(EMB) " England # London " Baghdad SumMosul 0.130 0.141 0.755 0.748Iraq 0.153 0.130 0.631 0.655
While Iraq is much more similar to England thanMosul is (both being countries), both similarities(0.049 and 0.031 in explicit, 0.130 and 0.153 inembedded) are small and the sums are dominatedby the geographic and cultural aspect of the anal-ogy: Mosul and Iraq’s similarity to Baghdad (0.24and 0.20 in explicit, 0.75 and 0.63 in embedded).
To achieve better balance among the differentaspects of similarity, we propose switching froman additive to a multiplicative combination:
arg maxb⇤2V
cos (b⇤, b) cos (b⇤, a⇤)cos (b⇤, a) + "
(4)
(" = 0.001 is used to prevent division by zero)
This is equivalent to taking the logarithm of eachterm before summation, thus amplifying the dif-ferences between small quantities and reducingthe differences between larger ones. Using this ob-jective, Iraq is scored higher than Mosul (0.259 vs0.236, 0.736 vs 0.691). We refer to objective (4)as 3COSMUL.7
73COSMUL requires that all similarities be non-negative,which trivially holds for explicit representations. With em-beddings, we transform cosine similarities to [0, 1] using(x + 1)/2 before calculating (4).
175

Explicit vs embedding
Criterion Representation Google task SemEval taskAdditive Embedding 62.70% 38.49%
Explicit 45.05% 38.54%Multiplicative Embedding 66.72% 38.67%
Explicit 68.24% 38.37%
Breakdown of errors: Google task
7 Main Results
We repeated the experiments, this time using the3COSMUL method. Table 3 presents the results,showing that the multiplicative objective recov-ers more relational similarities in both representa-tions. The improvements achieved in the explicitrepresentation are especially dramatic, with an ab-solute increase of over 20% correctly identified re-lations in the MSR and GOOGLE datasets.
Objective Representation MSR GOOGLE
3COSADDEmbedding 53.98% 62.70%
Explicit 29.04% 45.05%
3COSMULEmbedding 59.09% 66.72%
Explicit 56.83% 68.24%
Table 3: Comparison of 3COSADD and 3COSMUL.
3COSMUL outperforms the state-of-the-art(3COSADD) on these two datasets. Moreover, theresults illustrate that a comparable amount of rela-tional similarities can be recovered with both rep-resentations. This suggests that the linguistic reg-ularities apparent in neural embeddings are not aconsequence of the embedding process, but ratherare well preserved by it.
On SEMEVAL, 3COSMUL preformed on parwith 3COSADD , recovering a similar amount ofanalogies with both explicit and neural representa-tions (38.37% and 38.67%, respectively).
8 Error Analysis
With 3COSMUL, both the explicit vectors andthe neural embeddings recover similar amounts ofanalogies, but are these the same patterns, or per-haps different types of relational similarities?
8.1 Agreement between Representations
Considering the open-vocabulary tasks (MSR andGOOGLE), we count the number of times both rep-resentations guessed correctly, both guessed in-correctly, and when one representations leads tothe right answer while the other does not (Ta-ble 4). While there is a large amount of agreementbetween the representations, there is also a non-negligible amount of cases in which they comple-ment each other. If we were to run in an ora-cle setup, in which an answer is considered cor-rect if it is correct in either representation, wewould have achieved an accuracy of 71.9% on theMSR dataset and 77.8% on GOOGLE.
Both Both Embedding ExplicitCorrect Wrong Correct Correct
MSR 43.97% 28.06% 15.12% 12.85%GOOGLE 57.12% 22.17% 9.59% 11.12%
ALL 53.58% 23.76% 11.08% 11.59%
Table 4: Agreement between the representations on open-vocabulary tasks.
Relation Embedding Explicit
GO
OG
LE
capital-common-countries 90.51% 99.41%capital-world 77.61% 92.73%city-in-state 56.95% 64.69%currency 14.55% 10.53%family (gender inflections) 76.48% 60.08%gram1-adjective-to-adverb 24.29% 14.01%gram2-opposite 37.07% 28.94%gram3-comparative 86.11% 77.85%gram4-superlative 56.72% 63.45%gram5-present-participle 63.35% 65.06%gram6-nationality-adjective 89.37% 90.56%gram7-past-tense 65.83% 48.85%gram8-plural (nouns) 72.15% 76.05%gram9-plural-verbs 71.15% 55.75%
MS
R adjectives 45.88% 56.46%nouns 56.96% 63.07%verbs 69.90% 52.97%
Table 5: Breakdown of relational similarities in each repre-sentation by relation type, using 3COSMUL.
8.2 Breakdown by Relation TypeTable 5 presents the amount of analogies dis-covered in each representation, broken down byrelation type. Some trends emerge: the ex-plicit representation is superior in some of themore semantic tasks, especially geography re-lated ones, as well as the ones superlatives andnouns. The neural embedding, however, has theupper hand on most verb inflections, compara-tives, and family (gender) relations. Some rela-tions (currency, adjectives-to-adverbs, opposites)pose a challenge to both representations, thoughare somewhat better handled by the embeddedrepresentations. Finally, the nationality-adjectivesand present-participles are equally handled byboth representations.
8.3 Default-Behavior ErrorsThe most common error pattern under both repre-sentations is that of a “default behavior”, in whichone central representative word is provided as ananswer to many questions of the same type. Forexample, the word “Fresno” is returned 82 timesas an incorrect answer in the city-in-state rela-tion in the embedded representation, and the word“daughter” is returned 47 times as an incorrect an-swer in the family relation in the explicit represen-
176
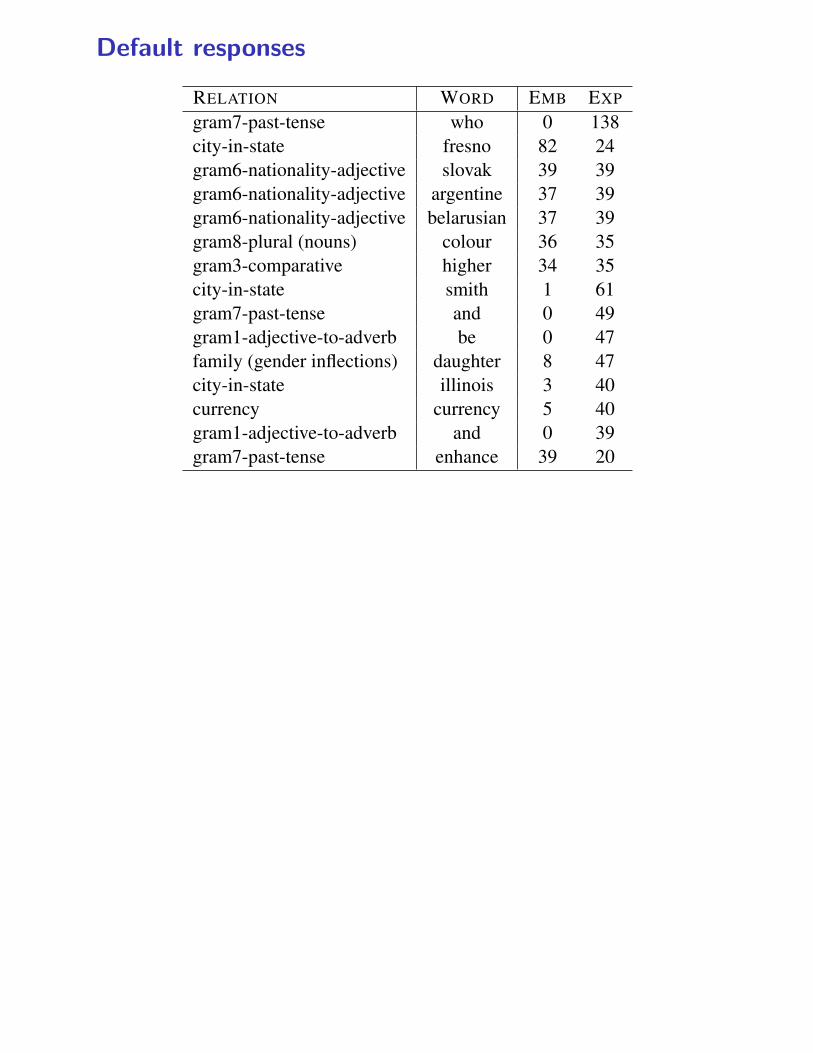
Default responses
RELATION WORD EMB EXP
gram7-past-tense who 0 138city-in-state fresno 82 24gram6-nationality-adjective slovak 39 39gram6-nationality-adjective argentine 37 39gram6-nationality-adjective belarusian 37 39gram8-plural (nouns) colour 36 35gram3-comparative higher 34 35city-in-state smith 1 61gram7-past-tense and 0 49gram1-adjective-to-adverb be 0 47family (gender inflections) daughter 8 47city-in-state illinois 3 40currency currency 5 40gram1-adjective-to-adverb and 0 39gram7-past-tense enhance 39 20
Table 6: Common default-behavior errors under both repre-sentations. EMB / EXP: the number of time the word wasreturned as an incorrect answer for the given relation underthe embedded or explicit representation.
tation. Loosely, “Fresno” is identified by the em-bedded representation as a prototypical location,while “daughter” is identified by the explicit rep-resentation as a prototypical female. Under a def-inition in which a default behavior error is one inwhich the same incorrect answer is returned for aparticular relation 10 or more times, such errorsaccount for 49% of the errors in the explicit repre-sentation, and for 39% of the errors in the embed-ded representation.
Table 6 lists the 15 most common default er-rors under both representations. In most default er-rors the category of the default word is closely re-lated to the analogy question, sharing the categoryof either the correct answer, or (as in the case of“Fresno”) the question word. Notable exceptionsare the words “who”, “and”, “be” and “smith” thatare returned as default answers in the explicit rep-resentation, and which are very far from the in-tended relation. It seems that in the explicit repre-sentation, some very frequent function words actas “hubs” and confuse the model. In fact, theperformance gap between the representations inthe past-tense and plural-verb relations can be at-tributed specifically to such function-word errors:23.4% of the mistakes in past-tense relation aredue to the explicit representation’s default answerof “who” or “and”, while 19% of the mistakes inthe plural-verb relations are due to default answersof “is/and/that/who”.
8.4 Verb-inflection ErrorsA correct solution to the morphological anal-ogy task requires recovering both the correct in-
flection (requiring syntactic similarity) and thecorrect base word (requiring semantic similar-ity). We observe that linguistically, the mor-phological distinctions and similarities tend torely on a few common word forms (for exam-ple, the “walk:walking” relation is characterizedby modals such as “will” appearing before “walk”and never before “walking”, and be verbs ap-pearing before walking and never before “walk”),while the support for the semantic relations isspread out over many more items. We hypothe-size that the morphological distinctions in verbsare much harder to capture than the semantics. In-deed, under both representations, errors in whichthe selected word has a correct form with an incor-rect inflection are over ten times more likely thanerrors in which the selected word has the correctinflection but an incorrect base form.
9 Interpreting Relational Similarities
The ability to capture relational similarities byperforming vector (or similarity) arithmetic is re-markable. In this section, we try and provide intu-ition as to why it works.
Consider the word “king”; it has several aspects,high-level properties that it implies, such as roy-alty or (male) gender, and its attributional simi-larity with another word is based on a mixture ofthose aspects; e.g. king is related to queen on theroyalty and the human axes, and shares the genderand the human aspect with man. Relational simi-larities can be viewed as a composition of attribu-tional similarities, each one reflecting a differentaspect. In “man is to woman as king is to queen”,the two main aspects are gender and royalty. Solv-ing the analogy question involves identifying therelevant aspects, and trying to change one of themwhile preserving the other.
How are concepts such as gender, royalty, or“cityness” represented in the vector space? Whilethe neural embeddings are mostly opaque, one ofthe appealing properties of explicit vector repre-sentations is our ability to read and understand thevectors’ features. For example, king is representedin our explicit vector space by 51,409 contexts, ofwhich the top 3 are tut+1, jeongjo+1, adulyadej+2
– all names of monarchs. The explicit representa-tion allows us to glimpse at the way different as-pects are represented. To do so, we choose a repre-sentative pair of words that share an aspect, inter-sect their vectors, and inspect the highest scoring
177