outline - world bankpubdocs.worldbank.org/en/787691505799074026/092017-cmo...broad commodity price...
TRANSCRIPT

Outline
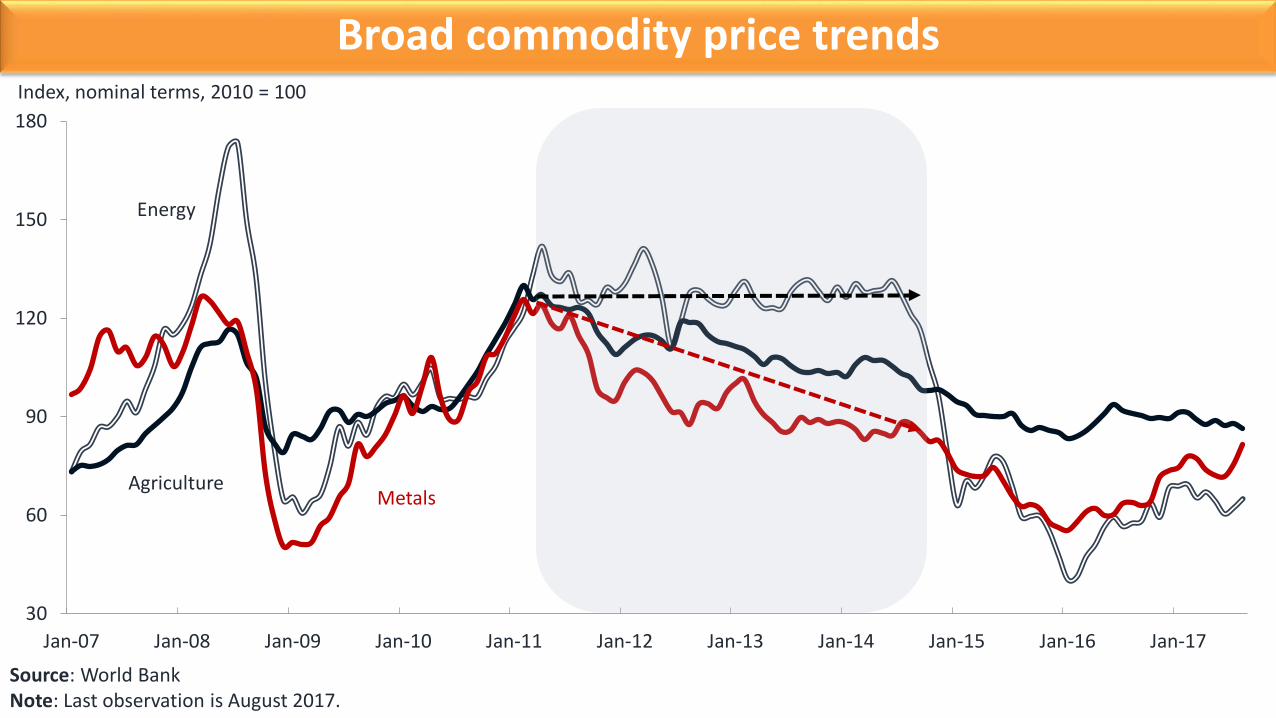
Broad commodity price trends
30
60
90
120
150
180
Jan-07 Jan-08 Jan-09 Jan-10 Jan-11 Jan-12 Jan-13 Jan-14 Jan-15 Jan-16 Jan-17
Index, nominal terms, 2010 = 100
Source: World BankNote: Last observation is August 2017.
Energy
AgricultureMetals

Prices are still higher than the 1985-2004 average
0
40
80
120
160
1960 1965 1970 1975 1980 1985 1990 1995 2000 2005 2010 2015Source: World Bank.
Agriculture
Metals
Energy
Index, constant US$ (2010 = 100)
Changes (%) in real prices to 2016 from:1986-2004 1998
Agriculture: +38 +35Energy: +65 +147Metals: +38 +63

0 3 6 9 12 15 18
Turkey
India
Brazil
China
EU-12
Canada
US
SSA
DEVELOPING
HIGH INCOME
WORLD
Manufacture
Agriculture
Cost of energy
Source: Author’s calculations based on the GTAP database (2007 release) and Baffes (2007), Resources Policy, vol.32, pp. 126-134.Notes: Elasticity estimates are based on OLS regression of nominal prices on oil price, deflator, time trend, annual data, 1960-2005.
Agriculture is an energy intensive industry
0.160.18 0.19
0.17
0.04
0.11
0.33
0.00
0.10
0.20
0.30
0.40
Non-energy Grains Oils andmeals
Other food Rawmaterials
Metals Fertilizers
Elasticity estimates
Energy intensity Transmission elasticities

Outline

20
40
60
80
100
120
Jan-11 Jul-11 Jan-12 Jul-12 Jan-13 Jul-13 Jan-14 Jul-14 Jan-15 Jul-15 Jan-16 Jul-16 Jan-17 Jul-17
“Old” versus “new” oil price equilibrium
Source: World Bank.Note: Weekly data. Volatility is defined as standard deviation of logarithmic changes times 100. Last observation is July 7, 2017.
US$/bbl
January 2011 - August 2014Average price: $104/bbl
Volatility: 2.95
December 2014 - August 2017Average price: $48/bbl
Volatility: 5.05

-70 -60 -50 -40 -30 -20 -10 0 10
Crude oilWheatTeaGoldCocoaSoybeansZincPlatinumLeadTinRiceMaizeCoffee (arabica)AluminumPalmoilCopperNickelSilverCoalCottonNatural rubber
All commodity prices declined during 2011Q1-2014Q2, but oil
Source: World Bank
Price change from 2011Q1 to 2014Q2 (percent)

Downward revisions to EMDE growth
6.16.0
5.7
5.55.45.5
5.3
4.85.0
5.4
5.0
4.3
3
4
5
6
7
2012 2013 2014 2015
Forecast in January of previous year Forecast in January of current year Actual growth
Percent
Source: World Bank, Global Economic ProspectsNotes: EMDE denotes Emerging Markets and Developing Economies.

-
2
4
6
8
10
2007 2008 2009 2010 2011 2012 2013 2014 2015 2016
US shale Canadian oil sands Biofurels
Unconventional oil productionmb/d
Source: International Energy Agency and World Bank
7
8
9
10
11
12
13
J A S O N D J F M A M J J A S O N D J F M A M J J A S O N D J F M A M J J A S O N D J F M A M J J A S O N D J F M A M J J A S O N D
2010 2011 2012 2013 2014 2015
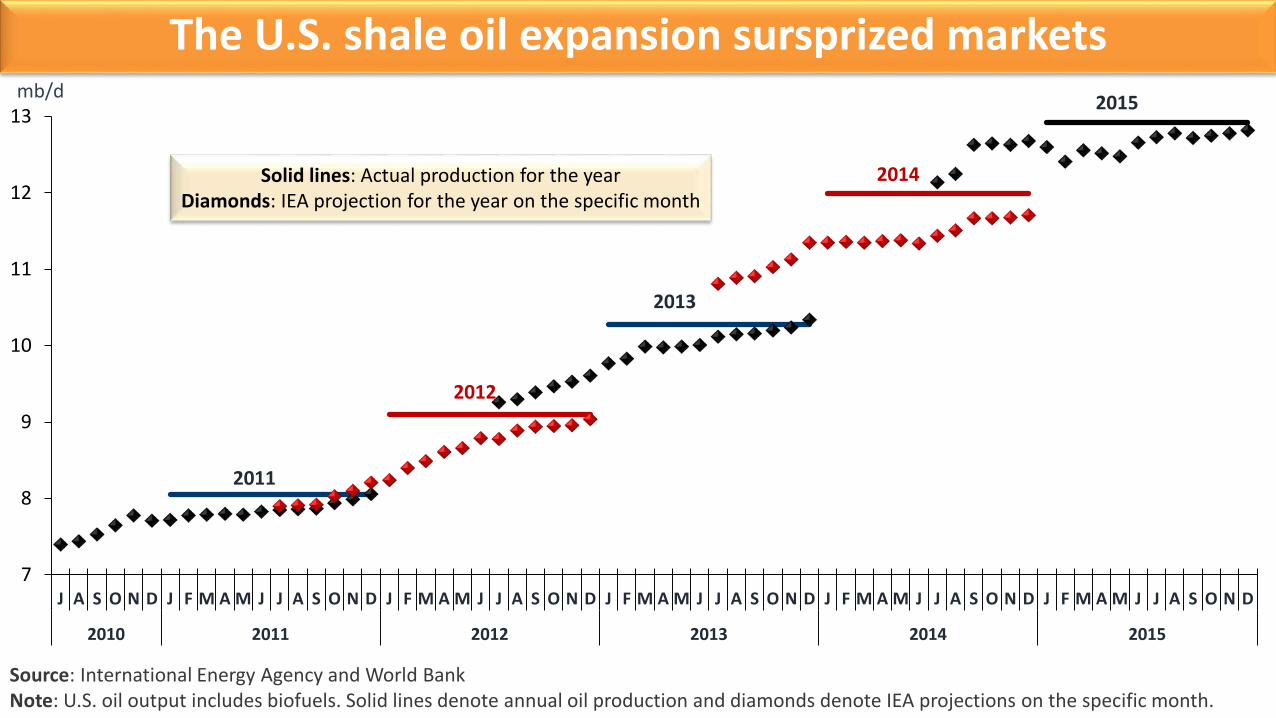
The U.S. shale oil expansion sursprized marketsmb/d
2011
2012
2013
2014
2015
Source: International Energy Agency and World BankNote: U.S. oil output includes biofuels. Solid lines denote annual oil production and diamonds denote IEA projections on the specific month.
Solid lines: Actual production for the yearDiamonds: IEA projection for the year on the specific month

-3.0
-1.5
0.0
1.5
3.0
4.5
2010Q1 2010Q3 2011Q1 2011Q3 2012Q1 2012Q3 2013Q1 2013Q3 2014Q1 2014Q3 2015Q1 2015Q3 2016Q1 2016Q3 2017Q1
Iran Libya Syria Yemen United States Net Change
mb/d, cumulative changes since 2010Q4
Surplus conditions became apparent in 2014Q2
Source: International Energy Agency and World BankNote: Last observation 2017Q1.

Source: IEA
Trigger I: Geopolitical concerns dissipate
3.09
3.60 3.26 3.32 3.42
3.17 3.15 3.11 3.36 3.32 3.41
3.70
0.50
0.36
0.22 0.220.22
0.24 0.42 0.53
0.78 0.87 0.690.44
0.0
0.5
1.0
1.5
2.0
2.5
3.0
3.5
4.0
4.5
JAN FEB MAR APR MAY JUN JUL AUG SEP OCT NOV DEC
Iraq's oil production during 2014 Libya's oil production during 2015
70
75
80
85
90
95
100
20
40
60
80
100
120
Jan-14 May-14 Sep-14 Jan-15 May-15 Sep-15 Jan-16 May-16 Sep-16 Jan-17 May-17
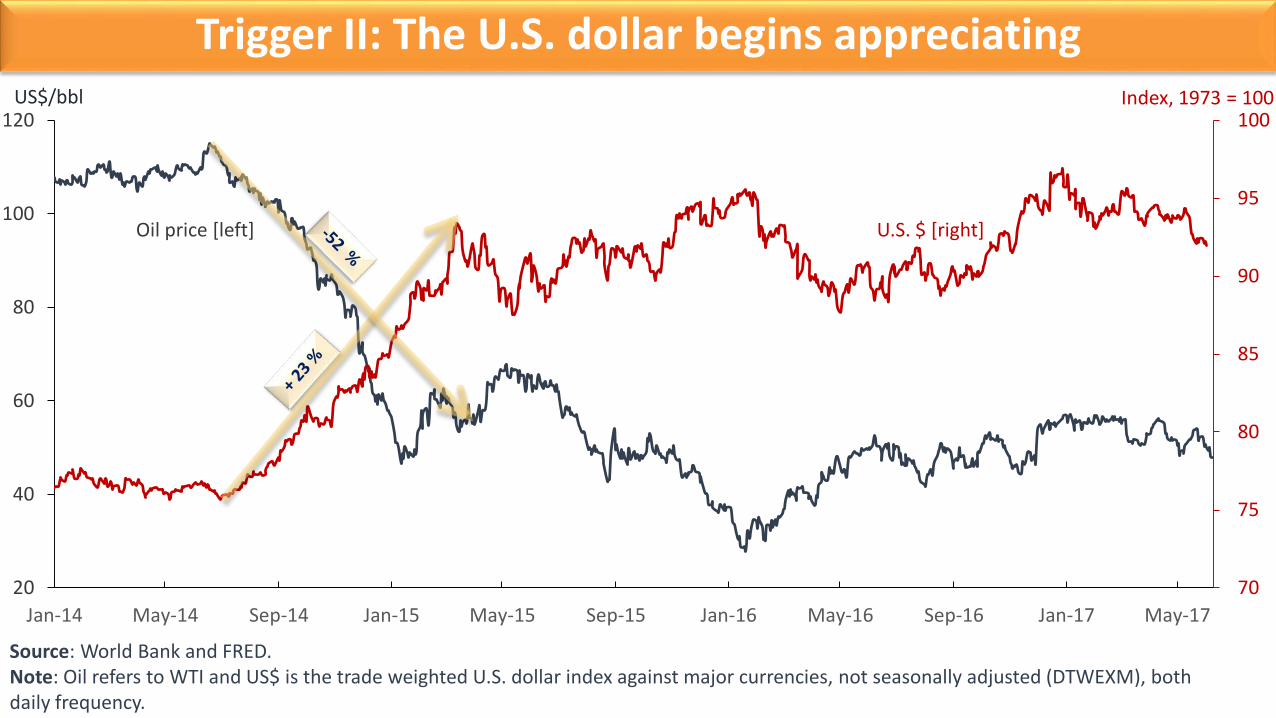
Trigger II: The U.S. dollar begins appreciating
Source: World Bank and FRED.Note: Oil refers to WTI and US$ is the trade weighted U.S. dollar index against major currencies, not seasonally adjusted (DTWEXM), both daily frequency.
Oil price [left] U.S. $ [right]
US$/bbl Index, 1973 = 100

Outline
5
6
7
8
9
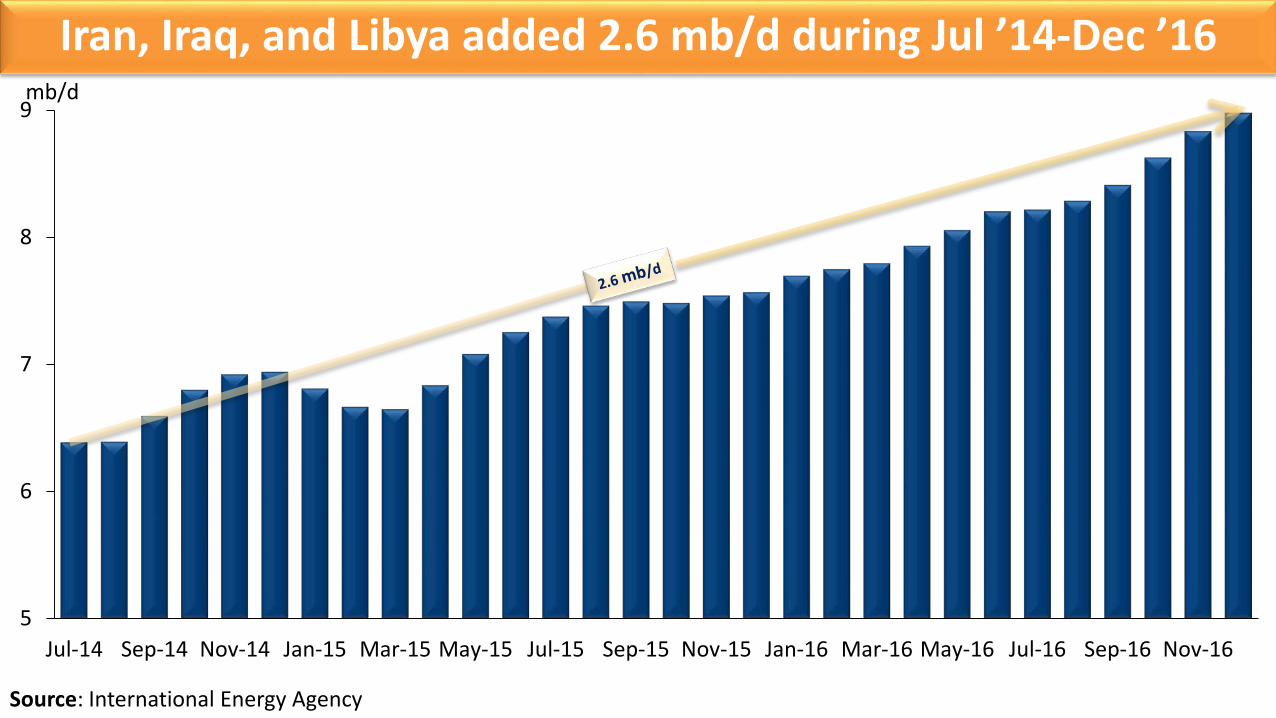
Jul-14 Sep-14 Nov-14 Jan-15 Mar-15 May-15 Jul-15 Sep-15 Nov-15 Jan-16 Mar-16 May-16 Jul-16 Sep-16 Nov-16
mb/dMb/d
Source: International Energy Agency
Iran, Iraq, and Libya added 2.6 mb/d during Jul ’14-Dec ’16

Oil prices in a longer term perspective
Source: World BankNote: World Bank crude oil average. Last observation is August 2017.
0
30
60
90
120
150
1965 1970 1975 1980 1985 1990 1995 2000 2005 2010 2015
US$/bbl, deflated by U.S. CPI (2014 terms)
1965-2017 average: $48.32/bbl
Prior to 1985/86: (i) Alaska, (ii) North Sea, and (iii) Gulf of Mexico (brought 5 mb/d in the 8 years prior to the collapse, 9% of world total). The real oil price during 1978-86 averaged $82/bbl.
Prior to 2014/15: (i) Biofuels, (ii) Canadian oil sands, and (iii) U.S. shale oil (brought 7 mb/d in the decade prior to the collapse, 8% of world total). The real oil price during 2004-14 averaged $92/bbl.
OPEC: Changed its policy in both 1986 and 2014.
36-yr average (excluding the 2 spike periods): $29/bbl.

-1,000
-500
0
500
1,000
1,500
2,000
Jan-11 Jul-11 Jan-12 Jul-12 Jan-13 Jul-13 Jan-14 Jul-14 Jan-15 Jul-15 Jan-16 Jul-16 Jan-17 Jul-17 Jan-18 Jul-18
U.S. shale oil: Slow to get out but quick to come backy-o-y monthly changes, thousand bbl
IEA Forecast
Source: International Energy Agency.Notes: U.S. crude oil production. Last actual observation is August 2017. September 2017 to December 2018 is forecast.
The plunge begins
0
300
600
900
1,200
1,500
1,800
0
30
60
90
120
150
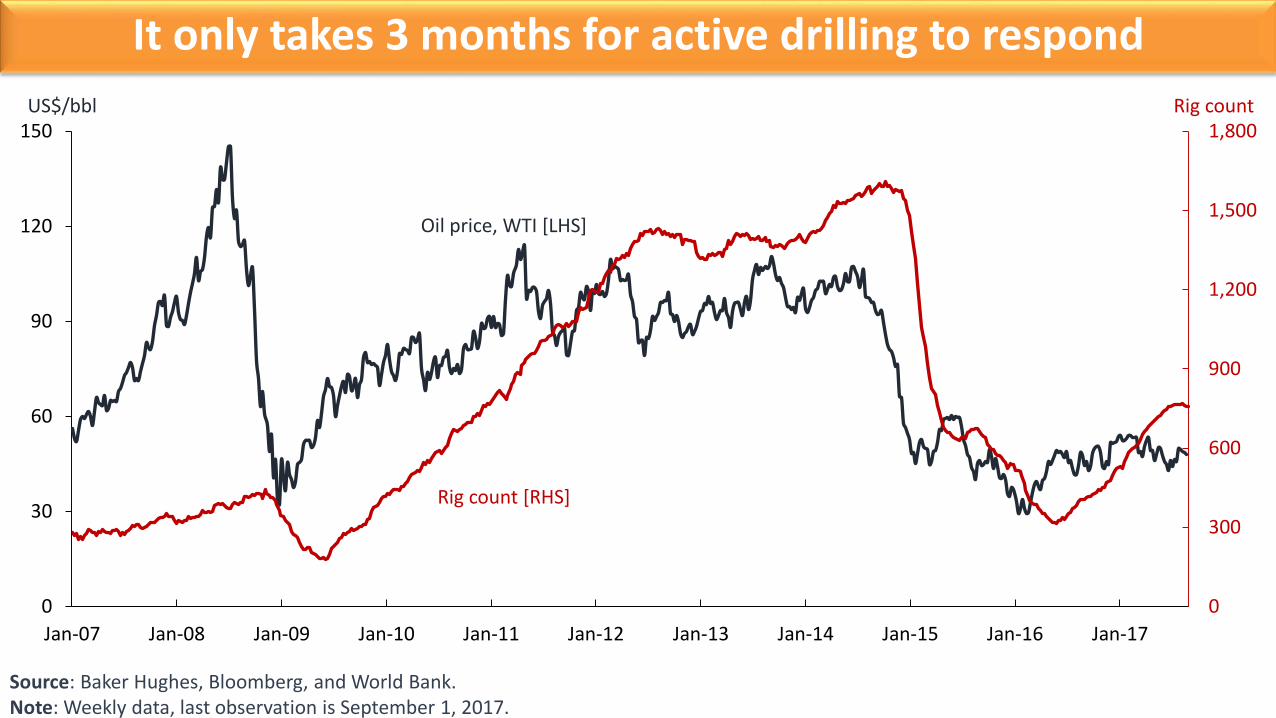
Jan-07 Jan-08 Jan-09 Jan-10 Jan-11 Jan-12 Jan-13 Jan-14 Jan-15 Jan-16 Jan-17
Rig countUS$/bbl
It only takes 3 months for active drilling to respond
Source: Baker Hughes, Bloomberg, and World Bank.Note: Weekly data, last observation is September 1, 2017.
Oil price, WTI [LHS]
Rig count [RHS]
0
200
400
600
800
1,000
1,200
1,400
1,600
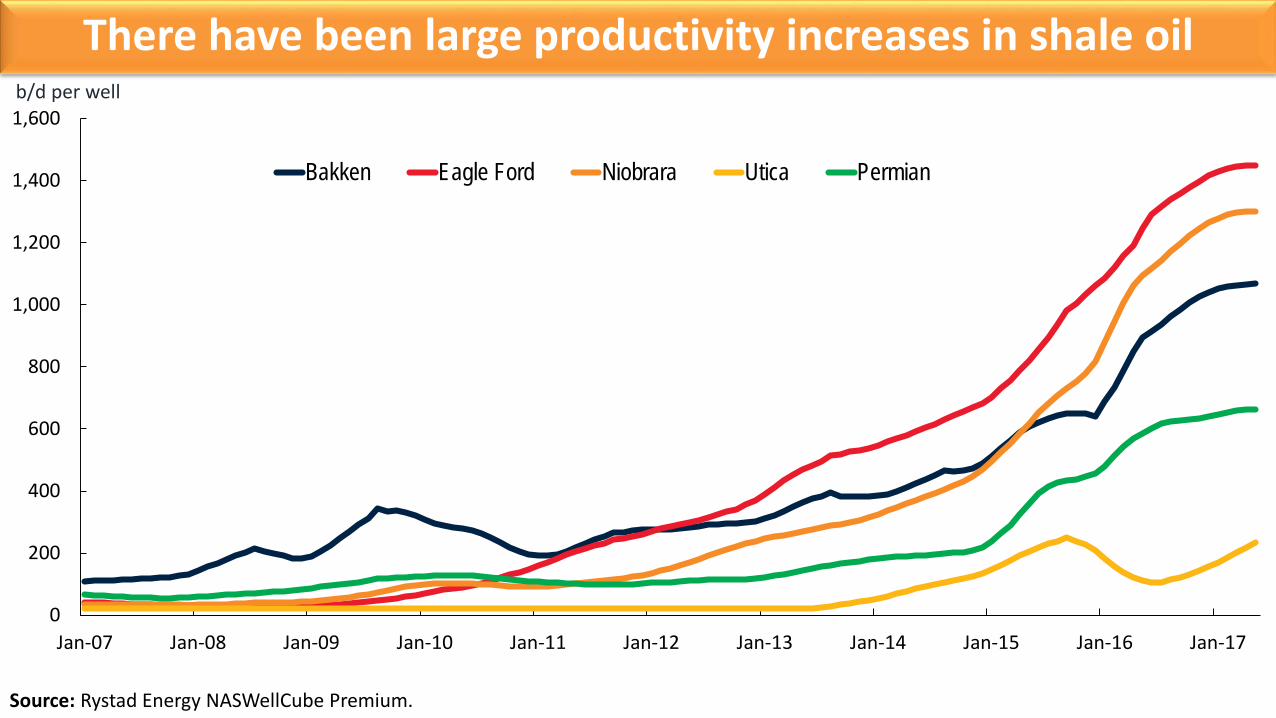
Jan-07 Jan-08 Jan-09 Jan-10 Jan-11 Jan-12 Jan-13 Jan-14 Jan-15 Jan-16 Jan-17
b/d per well
Bakken Eagle Ford Niobrara Utica Permian
Source: Rystad Energy NASWellCube Premium.
There have been large productivity increases in shale oil

20
30
40
50
60
70
80
90
2013Q1 2013Q3 2014Q1 2014Q3 2015Q1 2015Q3 2016Q1 2016Q3 2017Q1
US$/bbl
Range Average US Shale
Source: Rystad Energy NASWellCube Premium. Note: Does not include test activity, where well was shut-down after completion. Last observation is 2017Q2.
The costs of shale oil production ha gone down

55
58
61
64
67
70
J J A S O N D J F M A M J J A S O N D J F M A M J J A S O N D J F M A M
2016-17 2016-17 2016-17
2020
Evolution of Consensus on Brent before/after December 2016
2018 2019US$/bbl
Source: Consensus Economics and World Bank.Note: Median Brent oil price forecasts reported from June 2016 through May 2017 for 2018, 2019, and 2020.
Red diamonds: Price forecast reported prior to the December 2016 announcement of the OPEC/non-OPEC cuts.Blue diamonds: Price forecast reported after the December 2016 announcement of the OPEC/non-OPEC cuts.Horizontal lines: Forecasts averaged over the specific year.

50
60
70
80
90
100
110
Feb Apr Jun Aug Oct Dec Feb Apr Jun Aug Feb Apr Jun Aug Oct Dec Feb Apr Jun Aug Feb Apr Jun Aug Oct Dec Feb Apr Jun Aug
2014-15 2014-15 2014-15
2018
Evolution of Consensus on Brent before/after November 2014
2016 2017US$/bbl
Source: Consensus Economics and World Bank.Note: Median Brent oil price forecasts reported from February 2014 through August 2015 for 2016, 2017, and 2018.
Red diamonds: Price forecast reported prior to the November 2014 OPEC’s disengagement.Blue diamonds: Price forecast reported after the November 2014 OPEC’s disengagement.Horizontal lines: Forecasts averaged over the specific year (illustration purposes only).

U.S. oil announcements drive prices more than other events
Source: Bloomberg, US Energy Information Administration, World Bank, and various media sources.Notes: Price refers to the World Bank average
June 14, 21Inventory buildup
June 8UK
election
June 5Qatar
isolation
June 7Iran
attack
June 7Inventory buildup
May 22Manchester
attack
May 15Cut extension
announcement
May 25OPEC
meeting
June 3London attack
June 1U.S. withdraws
from Paris
May 4Inventory buildup
May 19Expectations of deeper cut
May 31Surging U.S. oil imports
Blue bars denote increases and red bars denote declines in oil price (from the previous trading day). Arrows point to oil price changes in excess of $ 1/bbl.

Outline
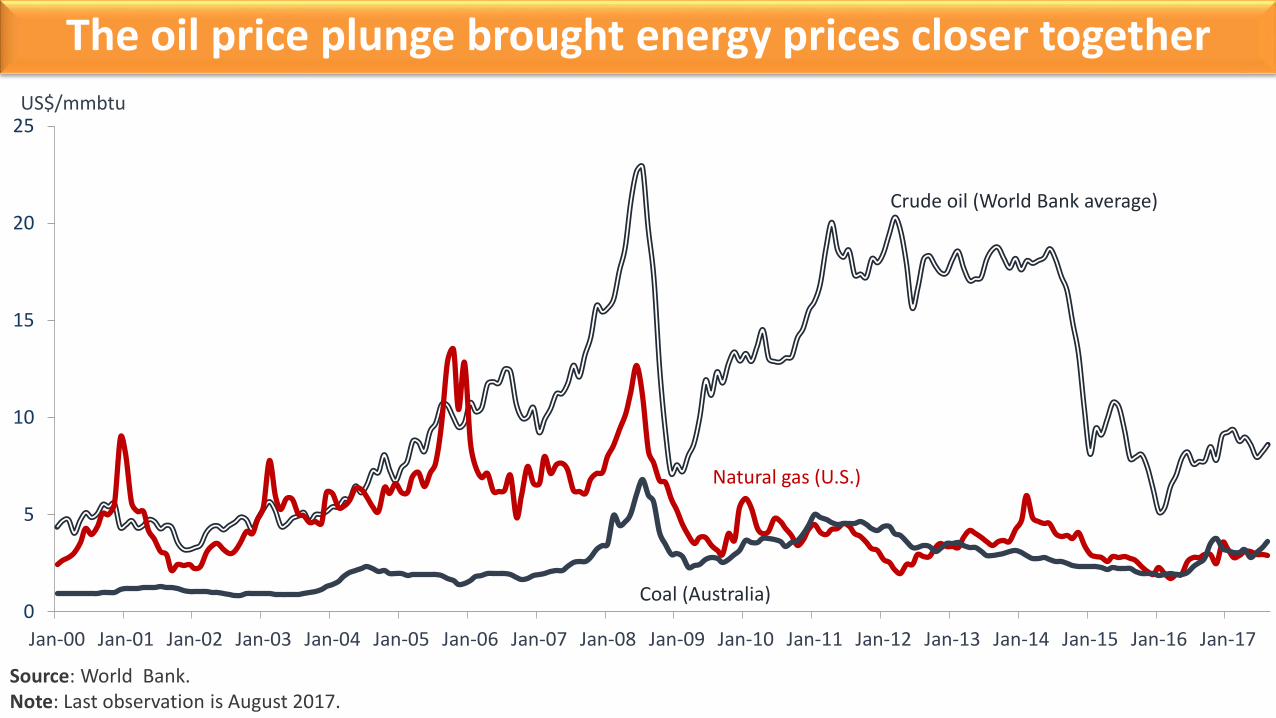
The oil price plunge brought energy prices closer together
0
5
10
15
20
25
Jan-00 Jan-01 Jan-02 Jan-03 Jan-04 Jan-05 Jan-06 Jan-07 Jan-08 Jan-09 Jan-10 Jan-11 Jan-12 Jan-13 Jan-14 Jan-15 Jan-16 Jan-17
US$/mmbtu
Source: World Bank.Note: Last observation is August 2017.
Coal (Australia)
Natural gas (U.S.)
Crude oil (World Bank average)

Natural gas prices follow suit
Source: World Bank.Note: Last observation is August 2017.
0
5
10
15
20
Jan-00 Jan-01 Jan-02 Jan-03 Jan-04 Jan-05 Jan-06 Jan-07 Jan-08 Jan-09 Jan-10 Jan-11 Jan-12 Jan-13 Jan-14 Jan-15 Jan-16 Jan-17
US$/mmbtu
Japan (LNG)
Europe
U.S.

Outline

Agricultural prices have weakened as well
60
80
100
120
140
Jan-07 Jan-08 Jan-09 Jan-10 Jan-11 Jan-12 Jan-13 Jan-14 Jan-15 Jan-16 Jan-17
Beverages Food Raw materials
Index, nominal terms, 2010 = 100
Source: World Bank.Note: Last observation is August 2017.

The S/U ratios have recovered relative to their 2006-07 lows
0.10
0.15
0.20
0.25
0.30
0.35
0.40
1990 1992 1994 1996 1998 2000 2002 2004 2006 2008 2010 2012 2014 2016
Maize Rice Wheat
Source: U.S. Department of Agriculture.Notes: Update based on the U.S. Department of Agriculture August, 2017 data release.
Ratio

Outline
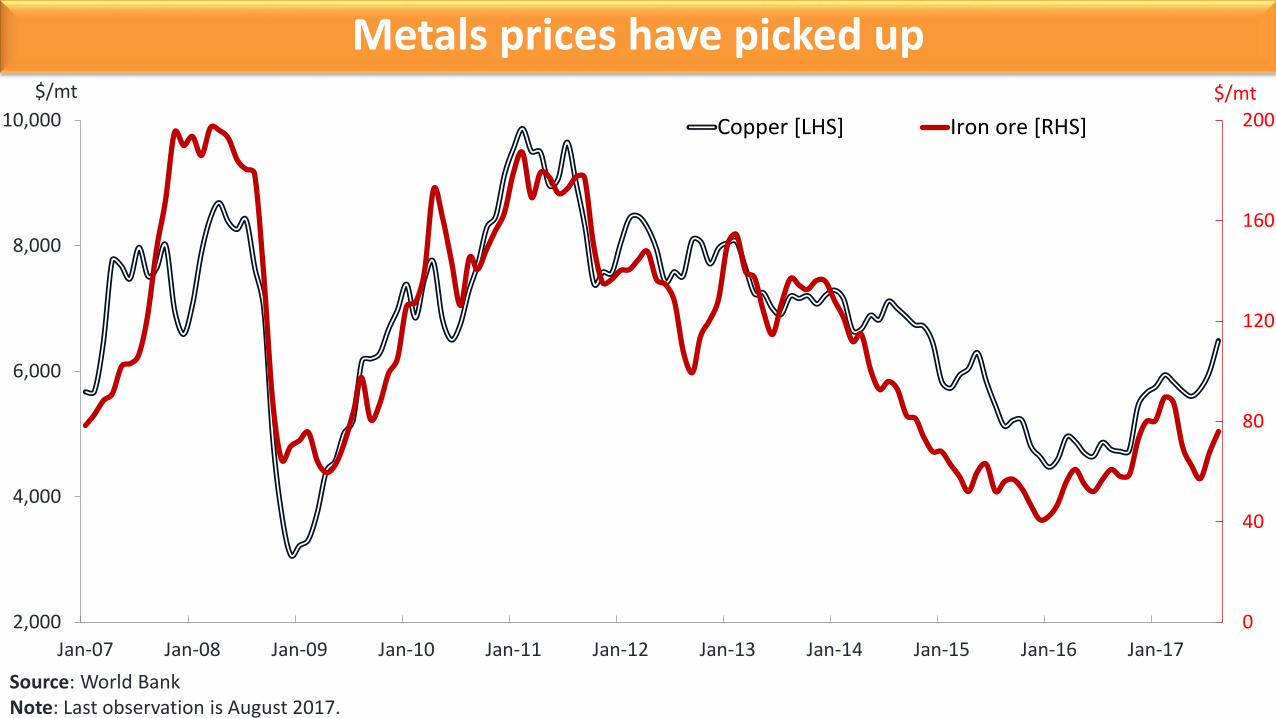
Metals prices have picked up
0
40
80
120
160
200
2,000
4,000
6,000
8,000
10,000
Jan-07 Jan-08 Jan-09 Jan-10 Jan-11 Jan-12 Jan-13 Jan-14 Jan-15 Jan-16 Jan-17
Copper [LHS] Iron ore [RHS]$/mt $/mt
Source: World BankNote: Last observation is August 2017.

China is still the key driver of metal consumption
Source: World Bank and World Bureau of Metal StatisticsNotes: Last observation is June 2017.
0
1
2
3
4
5
6
Jan-95 Jan-97 Jan-99 Jan-01 Jan-03 Jan-05 Jan-07 Jan-09 Jan-11 Jan-13 Jan-15 Jan-17
Million metric tons
Rest of the world
China
Outline

Where are commodity prices heading?
0
40
80
120
160
1960 1965 1970 1975 1980 1985 1990 1995 2000 2005 2010 2015 2020 2025 2030
Source: World Bank.Note: The period 2017-30 refers to forecasts, as of September 2017.
Agriculture
Metals
Energy
Index, real (2010 = 100)

2015 2016 2017F 2018F 2019F
Crude oil price ($/bbl) 51 43 52 54 57
Gold price ($/toz) 1,161 1,249 1,250 1,229 1,208
Agriculture index (2010 = 100) 89 89 88 89 91
Metals index (2010 = 100) 67 63 77 76 76
Global growth (%) 2.7 2.4 2.7 2.9 2.9
Emerging economy growth (%) 3.6 3.5 4.1 4.5 4.7
Commodity and global economy forecasts (nominal)
Source: World BankNote: 2017 onwards denote forecasts.

0
1
2
3
4
5
6
7
1965 1970 1975 1980 1985 1990 1995 2000 2005 2010 2015
Consumption Net Exportsmb/d
Iran’s emergence after sanctions: Perhaps a downside risk?
Source: BP Statistical Review, International Energy Agency.Note: Production includes crude oil and liquids.

0
1
2
3
4
1965 1970 1975 1980 1985 1990 1995 2000 2005 2010 2015
Consumption Net Exports
Venezuela: The (only?) emerging upside price risk
Source: BP Statistical Review.Note: Production includes crude oil and liquids.
mb/d

20
30
40
50
60
1980 1982 1984 1986 1988 1990 1992 1994 1996 1998 2000 2002 2004 2006 2008 2010 2012 2014 2016 2018 2020
OECD, actual Non-OECD, actual OECD, projected in 2005 Non-OECD, projected in 2005
Oil consumption: History and (2005) prospects
Source: International Energy Agency and World Bank.Note: The projection was taken from the 2005 Outlook.
mb/d

2
4
6
8
10
12
14
1965 1970 1975 1980 1985 1990 1995 2000 2005 2010 2015
World OECD Non-OECD
Energy intensity has been declining
Source: BP Statistical Review and World Bank.
bbl/$10,000 of GDP
5
10
15
20
25
30
35
1965 1970 1975 1980 1985 1990 1995 2000 2005 2010 2015
World OECD Non-OECD
bbl of oil equivalent/$10,000 of GDP
Oil intensity Energy intensity

2.4
21.4
11.3
22.6
5.7
8.6
24.8
3.7
12.0
18.7
22.2
21.8
50.4
49.4
50.5
12.5
- 15 30 45 60
GDP
Population
Edible oils
Grains
Base metals
Iron ore
Coal
Crude oil
Share of world total (percent)
2014-16
1990-92
China’s and India’s share of global commodity consumption
Source: World Bank, BP Statistical Review of World Energy, World Bureau of Metals Statistics, U.S. Department of Agriculture
1.2
16.5
9.3
9.9
1.8
1.9
5.2
1.9
3.0
17.8
13.5
9.7
3.0
5.4
10.5
4.4
- 15 30 45 60
GDP
Population
Edible oils
Grains
Base metals
Iron ore
Coal
Crude oil
Share of world total (percent)
2014-16
1990-92
China India
