outlook and challenges for oil supply-demand in asia · asia’s oil demand expected to rise,...
TRANSCRIPT

1
Outlook and Challenges for Oil Supply-Demand in Asia
4th IEEJ/CNPC Joint SeminarJapan-China Joint Symposium on Asian Oil & Gas
December 10th, 2010
Ken Koyama, PhDDirector
Institute of Energy Economics, Japan
©2010 Institute of Energy Economics, Japan
All rights reserved
IEEJ: January 2011
Ken Koyama, IEEJ December 10th, 2010
2
©2010 IEEJ, All rights reserved
Presentation Topic
Growing energy demand in Asia, fossil fuels as a centerpiece
Asia’s oil demand expected to rise, driven by Chinese growth, and its implications
Outlook for global gas supply-demand and the importance of Asian market
Impacts of “Advanced technology” on global/Asian energy supply-demand and its implications
Conclusion
IEEJ: January 2011
Ken Koyama, IEEJ December 10th, 2010
3
©2010 IEEJ, All rights reserved
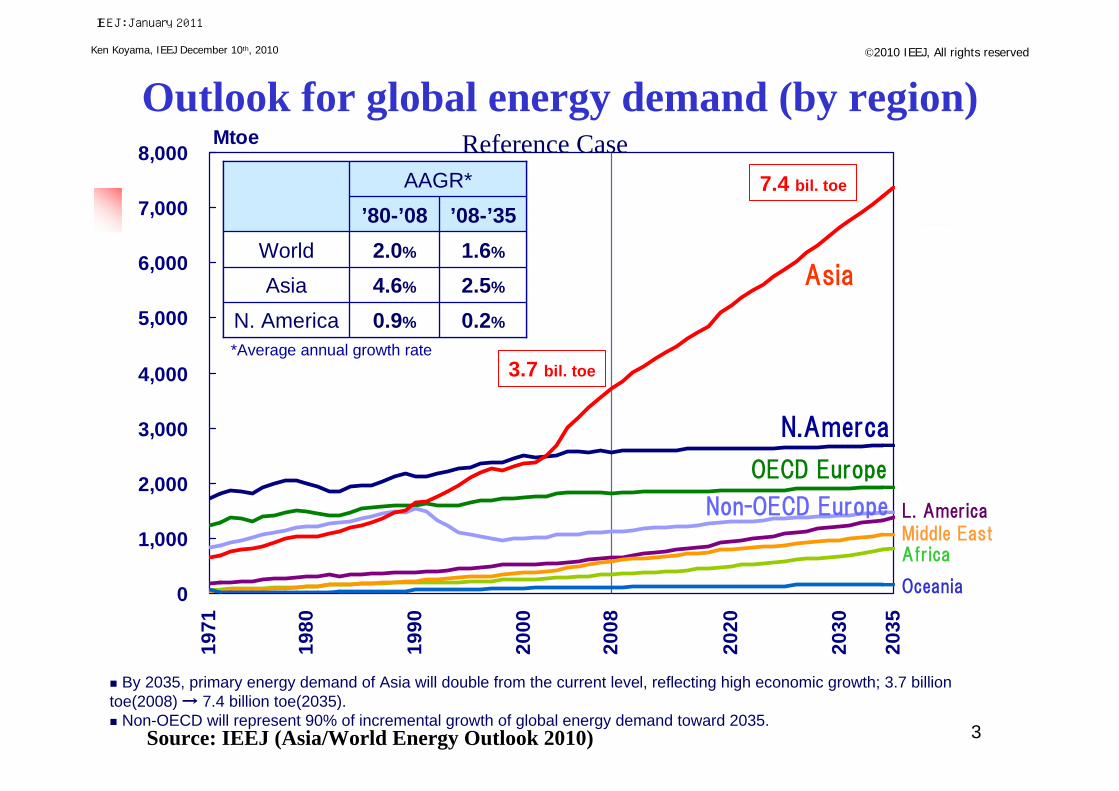
Outlook for global energy demand (by region)
Source: IEEJ (Asia/World Energy Outlook 2010)
By 2035, primary energy demand of Asia will double from the current level, reflecting high economic growth; 3.7 billion toe(2008) → 7.4 billion toe(2035). Non-OECD will represent 90% of incremental growth of global energy demand toward 2035.
0
1,000
2,000
3,000
4,000
5,000
6,000
7,000
8,000
1971
1980
1990
2000
2008
2020
2030
2035
Mtoe
Asia
N.Amerca
OECD Europe
Non-OECD Europe L. AmericaMiddle EastAfrica
Oceania
2.5%4.6%Asia0.2%0.9%N. America
1.6%2.0%World’08-’35’80-’08
AAGR*
2.5%4.6%Asia0.2%0.9%N. America
1.6%2.0%World’08-’35’80-’08
AAGR*
3.7 bil. toe
7.4 bil. toe
*Average annual growth rate
Reference Case
IEEJ: January 2011

Ken Koyama, IEEJ December 10th, 2010
4
©2010 IEEJ, All rights reserved
0
500
1,000
1,500
2,000
2,500
3,000
3,500
1971 1980 1990 2000 2008 2020 2030 2035
石油換算百万トン
2.2%2.9%Oil
1.9%5.3%Coal
4.2%7.6%Gas
2.5%4.6%Total
’08-’35’80-’08
Reference caseAAGR
Oil29%→26%
Coal53%→45%
Gas10%→16%
Nuclear3.7%→6.4%
Renewable1.7%→4.9%
Hydro2.1%→2.0%
Fossil fuel93%→87%
Share in 08→ in 2035
Outlook for energy demand in Asia (by fuel)
Source: IEEJ (Asia/World Energy Outlook 2010)
MTOE Reference Case
IEEJ: January 2011

Ken Koyama, IEEJ December 10th, 2010
5
©2010 IEEJ, All rights reserved
0
500
1000
1500
2000
1971 1980 1990 2000 2008 2020 2030 2035
China IndiaJapan KoreaTaiwan IndonesiaMalaysia PhilippinesThailand VietnamSingapore Hong KongOther Asia Tech. Adv.
Mtoe
8%
46%
17%
20%
14%
34%China
India
Japan
Though the vehicles’ fuel efficiency may be improved, and clean energy vehicles may expand, oil demand in China will expand from 7.4 million B/D in 2008 to 19.0 million B/D in 2035, due mainly to its escalating vehicle ownership. The share of China and India together in Asian oil demand will grow from 46% in 2008 to 61% in 2035. Even in the Tech. Adv. Scenario, oil demand will not peak out and grow continuously. Projected oil demand saving will be equal to 21% of the Reference Scenario in 2035.
20081.07 bil
(216 mbd)↓
2035Reference
1.91 bil (386 mbd)Tech. Adv.
1.49 bi l(301 mbd)
4.1 bil
(21%)Reduction
AAGR China India Japan Korea Taiwan Singapore
1980-2008 5.2% 5.4% -0.3% 4.4% 2.7% 2.9%2008-2035 3.3% 3.0% -1.6% 0.4% 0.4% 0.6%
Indonesia Malaysia Phi l i ppi nes Thailand Vietnam Other As ia
3.9% 4.2% 0.8% 4.9% 7.5% 3.6%2.1% 2.0% 3.3% 1.8% 3.7% 3.8%
Outlook for oil demand in Asia (by country)Reference Case and Tech. Advanced Case
Source: IEEJ (Asia/World Energy Outlook 2010)
IEEJ: January 2011
Ken Koyama, IEEJ December 10th, 2010
6
©2010 IEEJ, All rights reserved
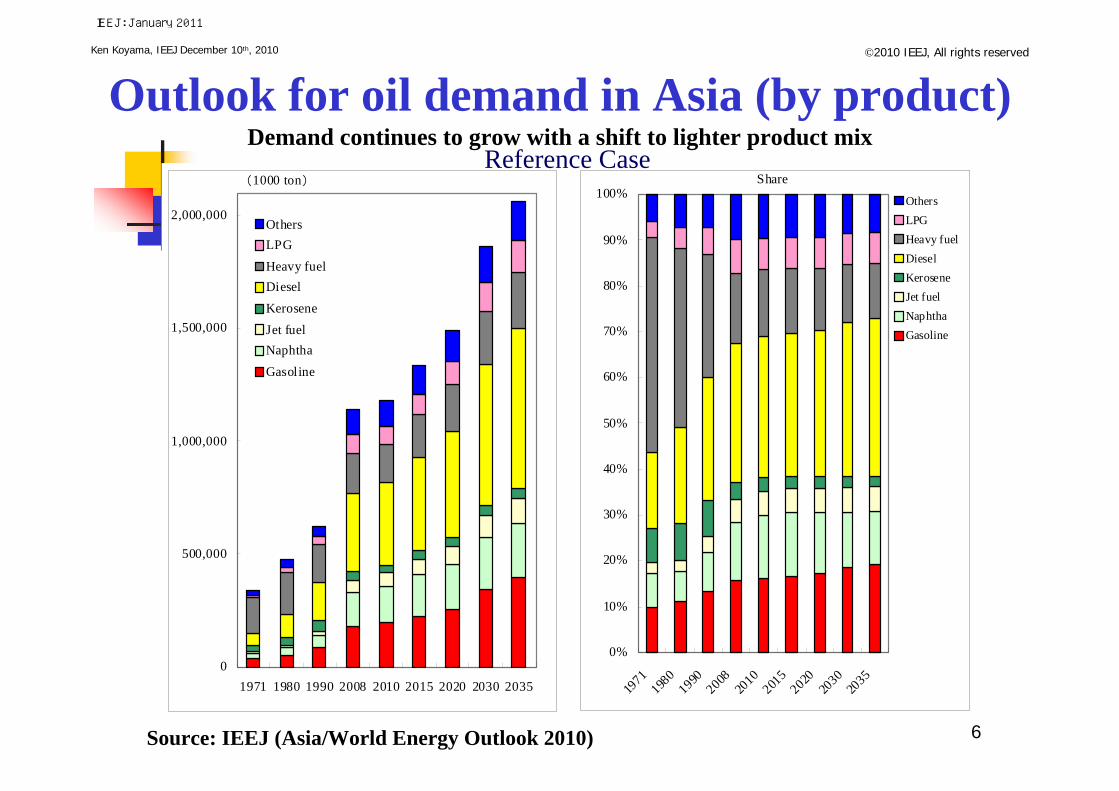
Outlook for oil demand in Asia (by product)Demand continues to grow with a shift to lighter product mix
Source: IEEJ (Asia/World Energy Outlook 2010)
0
500,000
1,000,000
1,500,000
2,000,000
1971 1980 1990 2008 2010 2015 2020 2030 2035
OthersLPGHeavy fuelDieselKeroseneJet fuelNaphthaGasoline
(1000 ton)
0%
10%
20%
30%
40%
50%
60%
70%
80%
90%
100%
1971
1980
1990200820
10201
5202020
3020
35
OthersLPGHeavy fuelDieselKeroseneJet fuelNaphthaGasoline
ShareReference Case
IEEJ: January 2011

Ken Koyama, IEEJ December 10th, 2010
7
©2010 IEEJ, All rights reserved
Outlook for oil supply-demand in AsiaOil import dependence expected to rise in Asia
Source: IEEJ (Asia/World Energy Outlook 2010)
479612
1,067
1,380
1,720
1,901
229304 372 390 367 353
250 308
695
990
1,353
1,548
0
500
1,000
1,500
2,000
2,500
1980 1990 2008 2020 2030 2035
Demand Production Net import
52%51%
63%
72%
79%81%
76%Mtoe Tech. Adv.
Net oil import in Asia will expand from 14 mb/d (695 Mtoe) in 2008 to 31 mb/d (1,548 Mtoe) in 2035. Oil production in Asia (such as China, India, Indonesia and Malaysia) will marginally increase, while oil demand will steadily increase. Therefore, net oil import ratio will reach 81% in the Reference Scenario, and 76% in the Tech. Adv. Scenario by 2035 (compared with 63% in 2008).
Reference Case
IEEJ: January 2011

Ken Koyama, IEEJ December 10th, 2010
8
©2010 IEEJ, All rights reserved
Competition for Access to Energy Resources
Growing import dependence is perceived as “vulnerability”
Strategy being taken as a counter measure: Domestic energy resource development Energy diversification Overseas resource development Promotion of NOCs
Excessive (exclusive) pursuit of “Mercantilism”may lead to politicize and destabilize world energy markets
Behavior of emerging giants attracts attentions in global energy community
IEEJ: January 2011

Ken Koyama, IEEJ December 10th, 2010
9
©2010 IEEJ, All rights reserved
9
China’s importance in global energy landscape
Political/strategic aspects Growing influence in global politics, economy and energy market Rapidly expanding China’s presence and concerns for China’s
“Assertiveness” Uncertainty over future economic growth and social stability Strategy implementation to enhance energy security and its impacts Climate change policy and its impacts on international negotiation
Energy demand 2nd largest in total energy consumption, oil consumption and oil
import in 2009. The respective global share is 20%、10%、10%
Annual consumption growth rates in 2009 are: 9% for total energy; 7% for oil; 9% for gas; and 10% for coal
Demand continued to grow even in 2008-2009. Increasingly higher presence in global market
Energy demand is expected to grow in the long run, backed by economic growth, motorization, etc.
NO1 emitter of CO2 in 2009 (global share 24%)
Energy supply Domestic oil production grew only gradually, and China became a
net importer of oil in 1993. Net import continued to grow strongly China also became net gas and coal importer
IEEJ: January 2011
Ken Koyama, IEEJ December 10th, 2010
10
©2010 IEEJ, All rights reserved
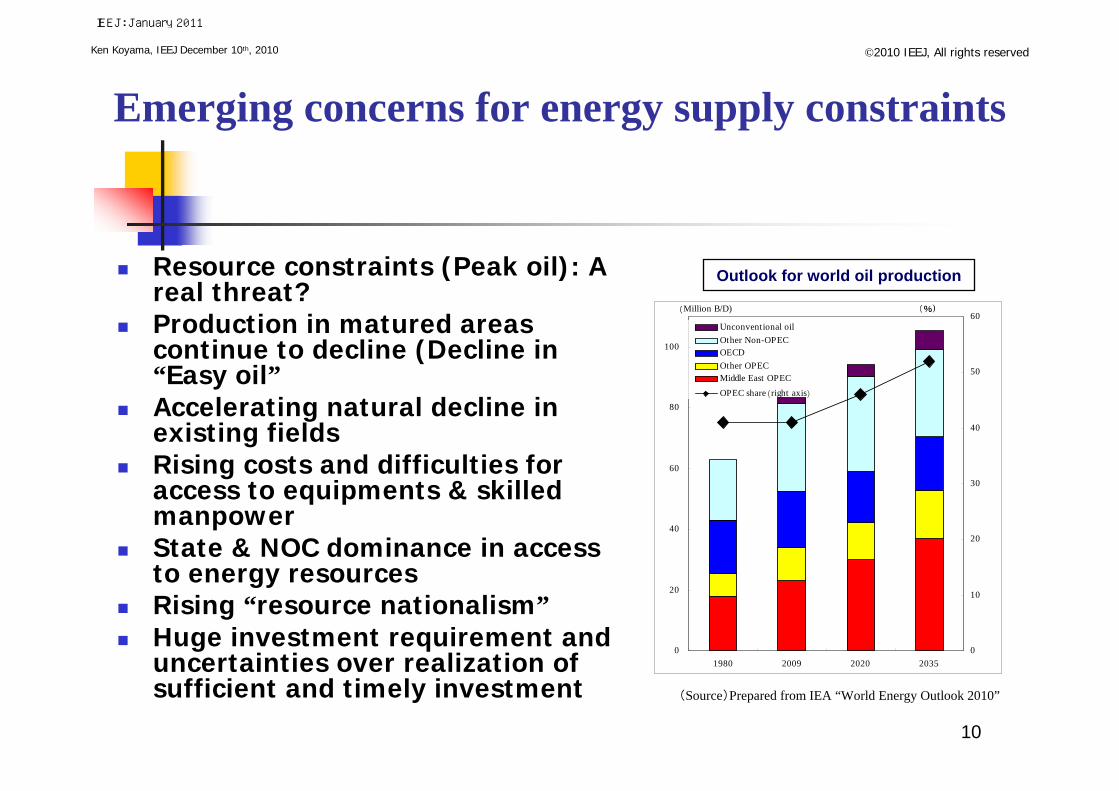
Outlook for world oil production
(Source)Prepared from IEA “World Energy Outlook 2010”
Resource constraints (Peak oil): A real threat?
Production in matured areas continue to decline (Decline in “Easy oil”
Accelerating natural decline in existing fields
Rising costs and difficulties for access to equipments & skilled manpower
State & NOC dominance in access to energy resources
Rising “resource nationalism” Huge investment requirement and
uncertainties over realization of sufficient and timely investment
Emerging concerns for energy supply constraints
0
20
40
60
80
100
1980 2009 2020 20350
10
20
30
40
50
60Unconventional oilOther Non-OPECOECDOther OPECMiddle East OPEC
OPEC share(right axis)
(Million B/D) (%)
IEEJ: January 2011
Ken Koyama, IEEJ December 10th, 2010
11
©2010 IEEJ, All rights reserved
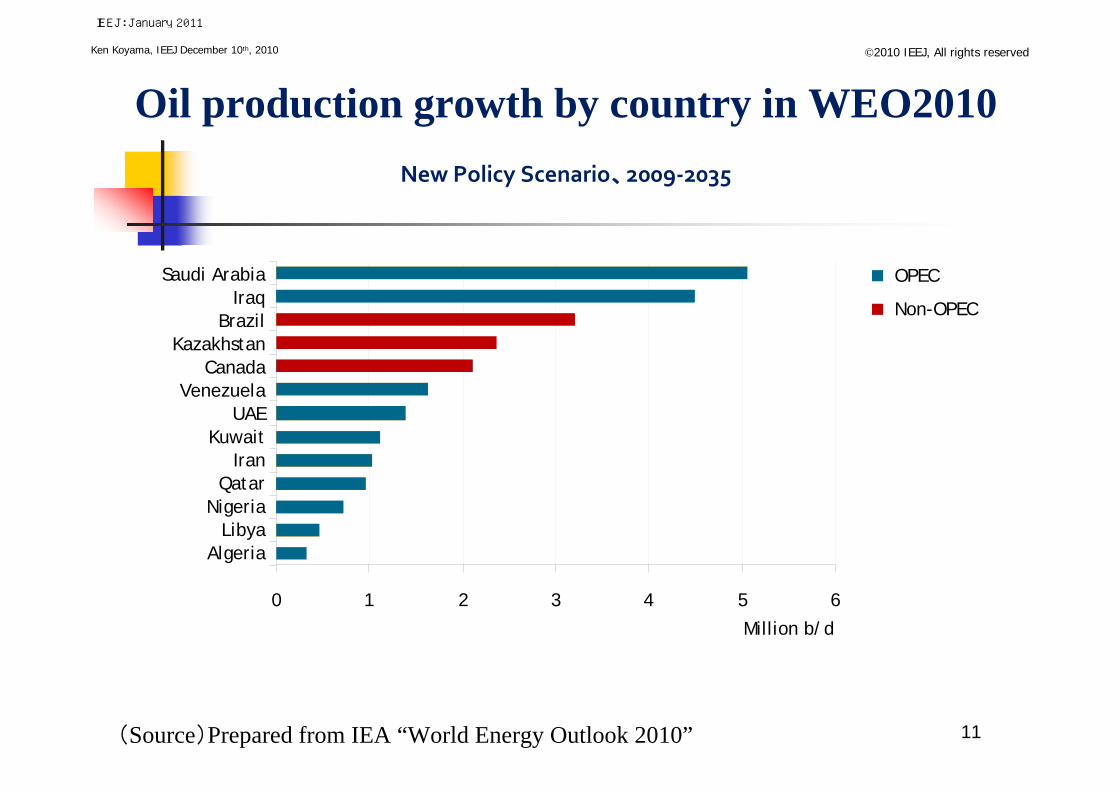
Oil production growth by country in WEO2010
0 1 2 3 4 5 6
AlgeriaLibya
NigeriaQatar
IranKuwait
UAEVenezuela
CanadaKazakhstan
BrazilIraq
Saudi Arabia
Million b/d
OPEC
Non-OPEC
New Policy Scenario、2009‐2035
(Source)Prepared from IEA “World Energy Outlook 2010”
IEEJ: January 2011
Ken Koyama, IEEJ December 10th, 2010
12
©2010 IEEJ, All rights reserved
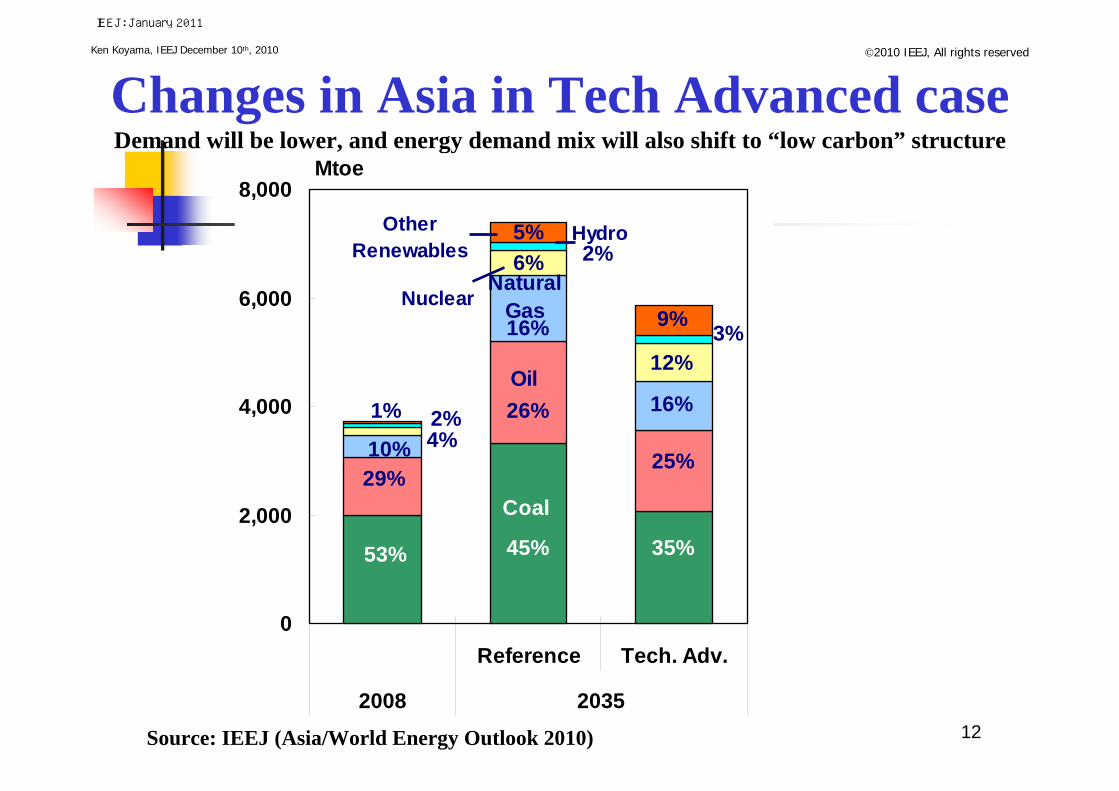
Changes in Asia in Tech Advanced caseDemand will be lower, and energy demand mix will also shift to “low carbon” structure
Source: IEEJ (Asia/World Energy Outlook 2010)
0
2,000
4,000
6,000
8,000
Reference Tech. Adv.
2008 2035
Mtoe
53%
29%10% 4%
45%
26%
16%
6% 2%5%
35%
25%
16%
12%3%9%
2%1%
Coal
Oil
NaturalGasNuclear
HydroOtherRenewables
IEEJ: January 2011

Ken Koyama, IEEJ December 10th, 2010
13
©2010 IEEJ, All rights reserved©2010 IEEJ, All rights reserved
Middle East Oil Export Destination
(Source)BP Statistical Review of World Energy 2010
April 8th, 2010 Ken Koyama, IEEJ
0
5,000
10,000
15,000
20,000
25,000
1990
1991
1992
1993
1994
1995
1996
1997
1998
1999
2000
2001
2002
2003
2004
2005
2006
2007
2008
2009
40
45
50
55
60
65
70
75OthersEuropeUSAsiaAsia's share
(1,000B/D) (%)
IEEJ: January 2011

Ken Koyama, IEEJ December 10th, 2010
14
©2010 IEEJ, All rights reserved
Outlook for Russian oil productionUncertainty over long term prospects for oil production. Frontier development is a key
(Source) prepared from EIA、IEA、OPEC data
Russian oil production outlook by organization Russian government oil production outlook
(Source)prepared from “Russia’s energy strategy 2030”
0)
10.0
10.2 10.2
9.1
10.2
12.8
9.5
9.4
10.6
7
8
9
10
11
12
13
00 05 10 15 20 25 30 35
milli
on b
/d
Actual
IEA/OMR (Nov.10)
MTOMR (2010)
IEO (2010)
WEO (2010)
OPEC (2010)
0
100
200
300
400
500
600
2005 2008 2013-15 2020-22 2030
milli
on to
ns
Far East
East Siberia
Tomsk
Caucasus/CaspianUral
Volga
Northwest
Tyumeni
IEEJ: January 2011

Ken Koyama, IEEJ December 10th, 2010
15
©2010 IEEJ, All rights reservedImpact and implication of US unconventional gas revolution Impacts
Lower US LNG demand impacts on global gas market Higher expectation for role of Gas in US, as important domestic energy source as well as
low carbon/clean energy Expectation for unconventional gas development outside US
Challenges Lower gas price and it impacts on gas development economics Unconventional gas development and its impacts on environmental/pollution problem
World unconventional gas resourceDownward revision for US LNG demand by EIA
Source:“Tight Gas Sands”, Journal of Petroleum Technology(2006/6)
CBM Shale gas Tight gas TotalRegion tcf tcf tcf tcfN America 3,017 3,840 1,371 8,228C&S America 39 2,116 1,293 3,448W Europe 157 509 353 1,019C&E Europe 118 39 78 235FSU 3,957 627 901 5,485Middle East / N Africa 0 2,547 823 3,370Sub-Sahara Africa 39 274 784 1,097China and Plannned Economy Asia 1,215 3,526 353 5,094OECD Pacific 470 2,312 705 3,487Other Asia 0 313 549 862S Asia 39 0 196 235World 9,051 16,103 7,406 32,560
14
15
16
17
18
19
20
21
22
23
1 2 3 4 5 6 7 8 9 10 11 12 13 14 15 16 17 18 19 20 21 22 23
tcf
0
10
20
30
40
50
60
70
80
90
100
LNG
milli
on to
ns
Domestic production(AEO2010)
Domestic production(AEO2008)
LNG imports(AEO2008)
LNG imports(AEO2010)
IEEJ: January 2011

Ken Koyama, IEEJ December 10th, 2010
16
©2010 IEEJ, All rights reserved
Issues for global gas supply-demand
Global gas demand expected to grow in the long run While impact of climate change policy on gas demand remain uncertain, expectation
for gas is rising worldwide, as gas being regarded as important and realistic low carbon/clean energy option as well as domestic energy source
Gas supply security will become important agenda in many countries, as gas demand continues to grow which results in higher gas import dependence
Ample supply potential exists to meet growing demand In addition to conventional source, unconventional resource potential is very large Supply can keep up with demand, if timely investment is materialized Share of unconventional gas supply will increase gradually in global supply mix
Issues to be considered for future outlook How long the current supply surplus can last? To what extent will US “shale gas revolution” affect and change other regional gas
market including Asian market What is the impact of expanded gas utilization on other source of energy?
Analysis based on the follow-up of changing global gas situation is essential
IEEJ: January 2011

Ken Koyama, IEEJ December 10th, 2010
17
©2010 IEEJ, All rights reserved
Global gas demand outlook(dotted line for Tech Advanced case)
Outlook for global and Asian gas demandGas demand in Asia (and in China) is key to global demand growth, which will affect global supply-demand balance
Source: IEEJ (Asia/World Energy Outlook 2010)
Asia gas demand outlook(dotted line for Tech Advanced case)
Asia
N.America
Europe
Others
0
1000
2000
3000
4000
5000
1971 1980 1990 2000 2008 2020 2030 2035
27%
15%
29%
30%
15%
24%
39%
21%
1.9 bil.toe
Mtoe
33
794
266
783
2%
42%
14%
42%
Asia N.America Europe Others
Increase from 2008~2035
0
300
600
900
1200
1971 1980 1990 2000 2008 2020 2030 2035
China India
Japan Korea
Taipei Indonesia
Malaysia Philippines
Thailand Vietnam
Singapore Hong Kong
Other Asia Tech. Adv.
China
IndiaJapan
Mtoe
7%
35%
14%
9%
17%
21%
AAGR China India Japan Korea Taipei Singpore
1980-2008 6.4% 12.7% 5.0% - 7.1% -
2008-2035 6.9% 5.9% 0.3% 1.5% 4.0% 2.7%
Indonesia Malaysia Phi l i ppi nes Thailand Vietnam Other As ia
6.9% 10.6% - - - 6.7%4.7% 2.6% 4.5% 3.1% 3.1% 4.2%
IEEJ: January 2011

Ken Koyama, IEEJ December 10th, 2010
18
©2010 IEEJ, All rights reserved
0
500
1,000
1,500
2,000
2,500
3,000
3,500
1971 1980 1990 2000 2008 2020 2030 2035
Mtoe
2.2%2.9%Oil
1.9%5.3%Coal
4.2%7.6%Natural Gas
2.5%4.6%Total
’08-’35
’80-’08
ReferenceAAGR
Oil29%→26% [25%]
Coal53%→45% [35%]
Natural Gas10%→16% [16%]
Nuclear3.7%→6.4%
[12%]Other
Renewables1.7%→4.9%
[9.3%]Hydro
2.1%→2.0%[2.6%]
Fossil fuel93%→87% [76%]
Solid line: ReferenceDotted line: Tech. Adv.
Share:2008→2035(Reference)
[2035(Tech. Adv.)]
Coal and oil will continue to maintain the dominant share in Asian energy demand through 2035. The share of natural gas will increase substantially reaching 16% by 2035, driven mainly by power generation. Coal share in the Tech. Adv. Scenario will significantly decrease, but will maintain the largest share (35% of total) in primary energy mix by 2035.
Source: IEEJ (Asia/World Energy Outlook 2010)
Outlook for energy demand in Asia (by fuel)IEEJ: January 2011

Ken Koyama, IEEJ December 10th, 2010
19
©2010 IEEJ, All rights reserved
Fossil fuel demand will peak in 2035 under the Tech. Adv. Scenario. In the Tech. Adv. Scenario, the world oil demand will decrease from 82 mbd in 2008 to 78 mbd in 2050, and world coal, from 4.6 Btce in 2008 to 3.4 Btce in 2050. By contrast, natural gas demand will continue to increase towards 2050 even in the Tech. Adv. Scenario. Adequate investment needs to be maintained to explore and develop natural gas resources.
Oil
Coal
Gas
Nuclear
Other RenewablesHydro
* Solid line: ReferenceDotted line: Tech. Adv.
Fossil Fuel (Right Axis)
Source: IEEJ (Asia/World Energy Outlook 2010)
Outlook for global energy demand up to 2050
IEEJ: January 2011

Ken Koyama, IEEJ December 10th, 2010
20
©2010 IEEJ, All rights reserved
Conclusion
Many challenges and uncertainty remain in global energy landscape
Under the circumstance, Asia’s energy demand will grow substantially lead by China’s growth
Asia’s growth is the driver for global demand for oil and gas. The demand growth results in challenges for supply-demand balance and market stability
Advanced technology will change Asia’s energy supply-demand. However, oil and gas will remain as important energy in the region, and its market stability continues to be crucial agenda
IEEJ: January 2011

Ken Koyama, IEEJ December 10th, 2010
21
©2010 IEEJ, All rights reserved
Annex
IEEJ: January 2011

Ken Koyama, IEEJ December 10th, 2010
22
©2010 IEEJ, All rights reserved
Annex 1 Oil price assumption in WEO 2010 (IEA)
0
20
40
60
80
100
120
140
1980 1990 2000 2010 2020 2030 2035
$/bb
l (20
09 P
rice
Current Policy Scenario
New Policy Scenario
450 Scenario
(Source)Prepared from IEA “World Energy Outlook 2010”
IEEJ: January 2011

Ken Koyama, IEEJ December 10th, 2010
23
©2010 IEEJ, All rights reserved
Annex 2 Outlook for oil product demand in China
Source: IEEJ (Asia/World Energy Outlook 2010)
0
100,000
200,000
300,000
400,000
500,000
600,000
700,000
800,000
900,000
1,000,000
1971 1980 1990 2008 2010 2015 2020 2030 2035
OthersLPGHeavy fuelDieselKeroseneJet fuelNaphthaGasoline
(1000 ton)
0%
20%
40%
60%
80%
100%
1971
1980
1990200820
10201
5202020
3020
35
OthersLPGHeavy fuel
DieselKeroseneJet fuelNaphthaGasoline
Share
IEEJ: January 2011
Ken Koyama, IEEJ December 10th, 2010
24
©2010 IEEJ, All rights reserved
24
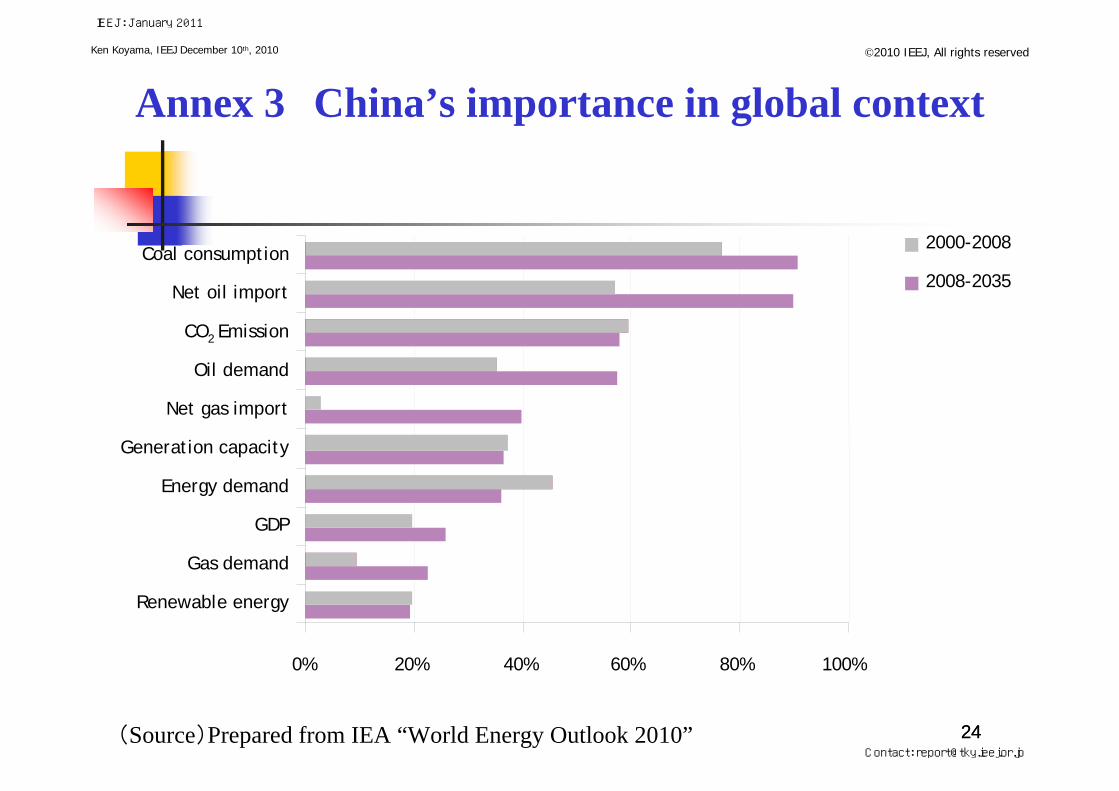
Annex 3 China’s importance in global context
0% 20% 40% 60% 80% 100%
Renewable energy
Gas demand
GDP
Energy demand
Generation capacity
Net gas import
Oil demand
CO2 Emission
Net oil import
Coal consumption2000-2008
2008-2035
(Source)Prepared from IEA “World Energy Outlook 2010”
IEEJ: January 2011
Contact: [email protected]