outlook and implications for the global automotive …– chinese brands accelerating motorisation...
TRANSCRIPT
12 JUNE 2007 • OKURA GARDEN HOTEL • SHANGHAI GLOBAL INSIGHT AUTOMOTIVE SEMINAR
China and India — Outlook and Implicationsfor the Global Automotive Industry
Ashvin ChotaiDirector, Asian Automotive Industry Research

Copyright © 2007 Global Insight, Inc.Copyright © 2007 Global Insight, Inc. 2
Asian Automotive Industry: Key Highlights and Topics of Debate: 2006/2007
• How big will China become?– Winners and Losers … Foreign Brands vs Chinese Brands– Hard Landing? Fuel Tax?
• Will India be the next China?– What is behind the rising level of interest in India– What is Tata’s “1lakh rupee car”? Is it for real?– Potential and Obstacles to Growth?– Winners and Losers
• How rapidly will Chinese and Indian exports grow?– Can they make the same impact as Japanese and Korean brands?
• Resurgence in Japanese Domestic Production– Strong exports encouraging capacity expansion for first time since early 1990s– Japan Production Surpassed U.S. production in 2006– Global production by Japanese brands estimated at 22.3 million in 2006
• Korean Industry Hit by Strong Currency and Strikes– Overseas Expansion Will Accelerate … Limited Growth in South Korea
• ASEAN Rapidly Losing Ground to India and China– Mini slump in 2006 …Mixed Outlook for 2007
Copyright © 2007 Global Insight, Inc.Copyright © 2007 Global Insight, Inc. 3
Presentation Outline
• Overview– Global OEM Financial Performance Overview– Asian developments in a global perspective
• Focus on China and India– Sales, exports and production outlook– Product and segmentation trends– Key challenges / obstacles for exporters from China and India
Chinese brands and their global ambitionsGlobal OEM export plans from India
– Key players and performance outlook
• Developments in Asian Medium and Heavy Truck Market– Focus on China and India
• Global Implications
Copyright © 2007 Global Insight, Inc.Copyright © 2007 Global Insight, Inc. 4
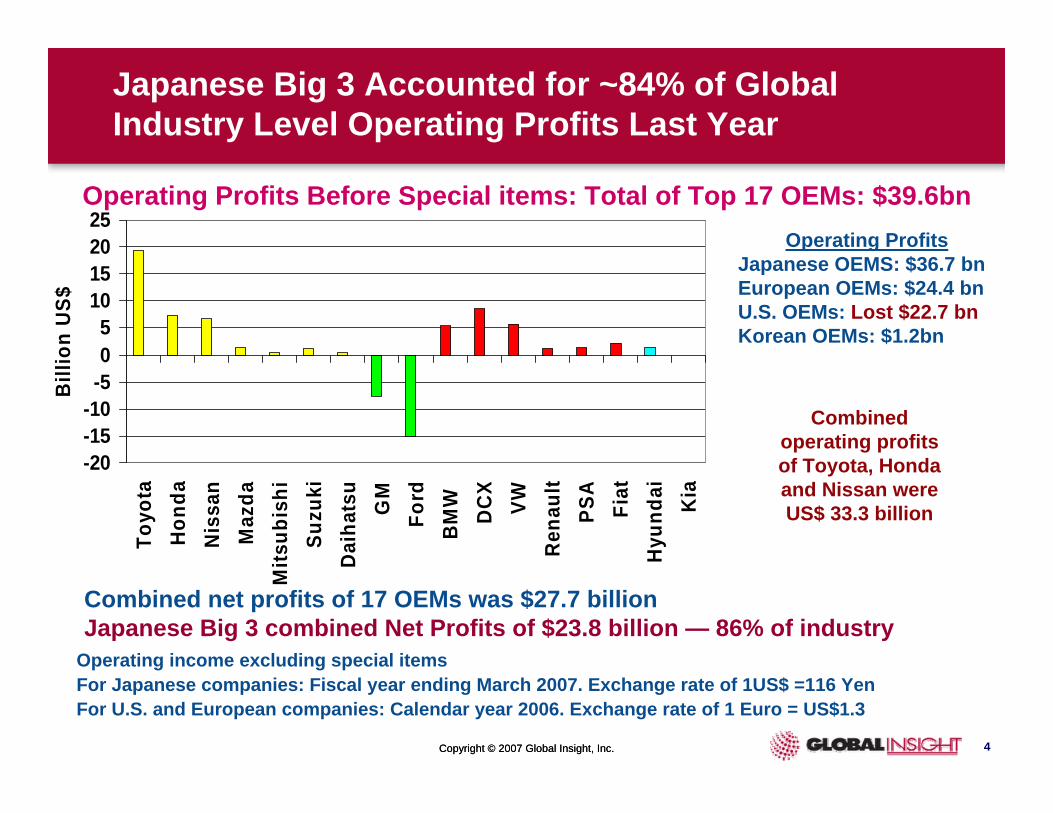
Japanese Big 3 Accounted for ~84% of Global Industry Level Operating Profits Last Year
-20-15-10-505
10152025
Toyo
taH
onda
Nis
san
Maz
daM
itsub
ishi
Suzu
kiD
aiha
tsu
GM
Ford
BM
W
DC
XVW
Ren
ault
PSA
Fiat
Hyu
ndai
Kia
Bill
ion
US$
Operating income excluding special itemsFor Japanese companies: Fiscal year ending March 2007. Exchange rate of 1US$ =116 YenFor U.S. and European companies: Calendar year 2006. Exchange rate of 1 Euro = US$1.3
Combined operating profits of Toyota, Honda and Nissan were US$ 33.3 billion
Operating ProfitsJapanese OEMS: $36.7 bnEuropean OEMs: $24.4 bnU.S. OEMs: Lost $22.7 bnKorean OEMs: $1.2bn
Operating Profits Before Special items: Total of Top 17 OEMs: $39.6bn
Combined net profits of 17 OEMs was $27.7 billionJapanese Big 3 combined Net Profits of $23.8 billion — 86% of industry
Copyright © 2007 Global Insight, Inc.Copyright © 2007 Global Insight, Inc. 5
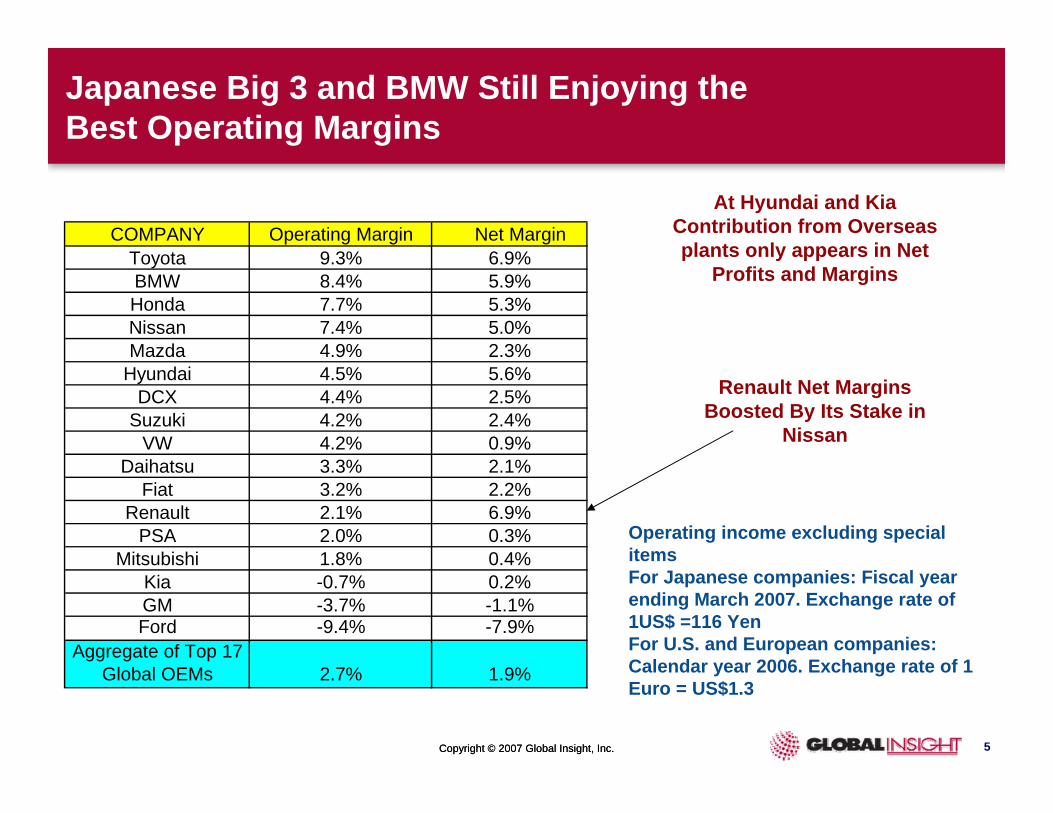
Japanese Big 3 and BMW Still Enjoying the Best Operating Margins
Operating income excluding special itemsFor Japanese companies: Fiscal year ending March 2007. Exchange rate of 1US$ =116 YenFor U.S. and European companies: Calendar year 2006. Exchange rate of 1 Euro = US$1.3
Renault Net Margins Boosted By Its Stake in
Nissan
At Hyundai and KiaContribution from Overseas plants only appears in Net
Profits and Margins
COMPANY Operating Margin Net MarginToyota 9.3% 6.9%BMW 8.4% 5.9%Honda 7.7% 5.3%Nissan 7.4% 5.0%Mazda 4.9% 2.3%
Hyundai 4.5% 5.6%DCX 4.4% 2.5%
Suzuki 4.2% 2.4%VW 4.2% 0.9%
Daihatsu 3.3% 2.1%Fiat 3.2% 2.2%
Renault 2.1% 6.9%PSA 2.0% 0.3%
Mitsubishi 1.8% 0.4%Kia -0.7% 0.2%GM -3.7% -1.1%Ford -9.4% -7.9%
Aggregate of Top 17 Global OEMs 2.7% 1.9%

Copyright © 2007 Global Insight, Inc.Copyright © 2007 Global Insight, Inc. 6
2006: All Vehicles Sales of 68.7 Million Units …Global Growth of 2.57 Million Units … China Again the Main Growth Engine
Strongest Performers
Global 2.57m units, Asian 1.2m units…China:1.42m units
0 200 400 600 800 1000 1200 1400 1600
SAUDI ARABIA
COLOMBIA
ARGENTINA
IRAN
SOUTH AFRICA
ITALY
UKRAINE
VENEZUELA
GERMANY
BRAZIL
INDIA
RUSSIA
CHINA
Change in Vehicle Sales (Thousand units)
2006 Sales Growth/Declines By Country
Most significant declines in U.S., Indonesia and Taiwan
-400 -300 -200 -100 0
UNITED STATES
INDONESIA
TAIWAN
JAPAN
UNITED KINGDOM
TURKEY
MALAYSIA
FRANCE
AUSTRALIA
THAILAND
HUNGARY
PORTUGAL
ECUADOR
Change in Vehicle Sales (Thousand units)
Weakest Performers
Copyright © 2007 Global Insight, Inc.Copyright © 2007 Global Insight, Inc. 7
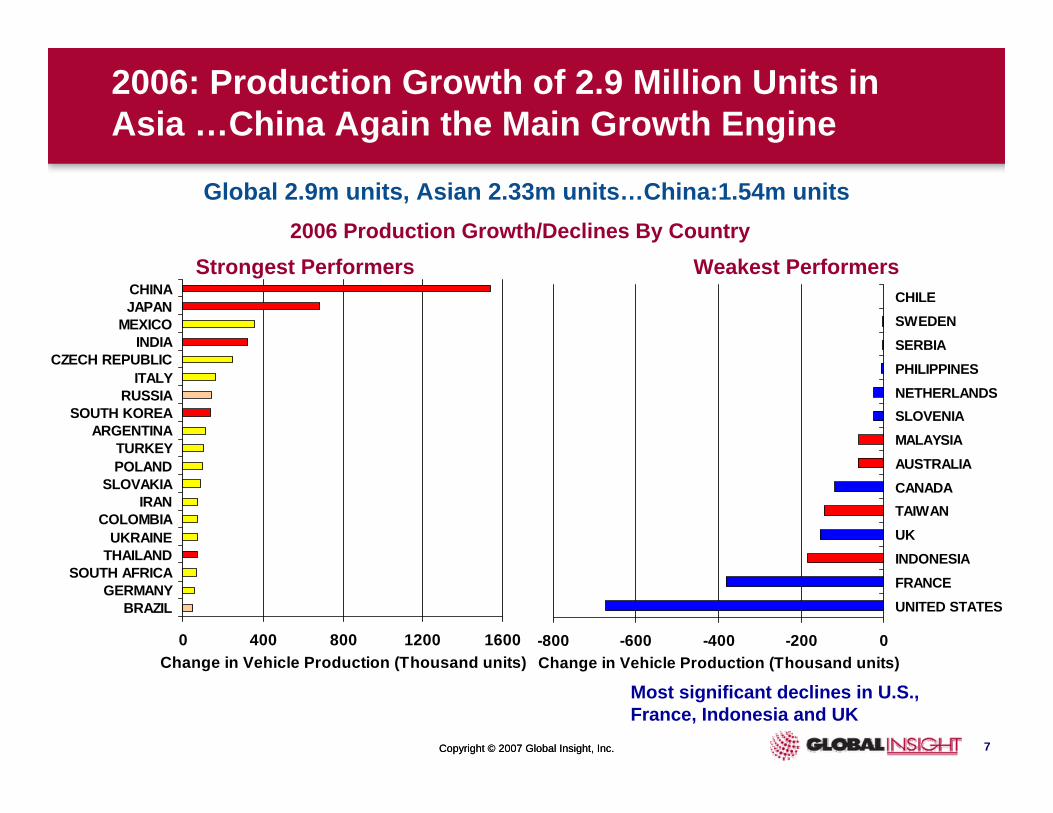
2006: Production Growth of 2.9 Million Units in Asia …China Again the Main Growth Engine
Strongest Performers
Global 2.9m units, Asian 2.33m units…China:1.54m units
0 400 800 1200 1600
BRAZILGERMANY
SOUTH AFRICATHAILANDUKRAINE
COLOMBIAIRAN
SLOVAKIAPOLANDTURKEY
ARGENTINASOUTH KOREA
RUSSIAITALY
CZECH REPUBLICINDIA
MEXICOJAPANCHINA
Change in Vehicle Production (Thousand units)
Most significant declines in U.S., France, Indonesia and UK
-800 -600 -400 -200 0
UNITED STATESFRANCEINDONESIAUKTAIWANCANADAAUSTRALIAMALAYSIASLOVENIANETHERLANDSPHILIPPINESSERBIASWEDENCHILE
Change in Vehicle Production (Thousand units)
2006 Production Growth/Declines By CountryWeakest Performers

Copyright © 2007 Global Insight, Inc.Copyright © 2007 Global Insight, Inc. 8
China Market: Key Trends
• Changing customer mix …greater diversity– Traditionally SOEs, government, taxi firms– Then private buyers in big cities– Motorisation now spreading to small cities– Ageing population will become a more dominant theme after 2010
• Government encouraging independent brands– Encouraging supply development in budget segments– Further intensification in price competition– Chinese brands accelerating motorisation rather than taking significant share
from foreign JVs• Market and consumer dynamics entering first stage of maturity
– Development of used car market now gathering momentum– Brand experience and better brands consciousness in Tier 1/2 cities
• Energy and environmental concerns …fuel prices still low– Limited impact on short term demand– Fuel consumption and environmental factors will constrain long term growth in
motorisation– Fuel efficiency standards will encourage move to smaller cars
• Parallel production of more than one generation of same model – Repositioning of older models to lower price point or different consumer
segment
Copyright © 2007 Global Insight, Inc.Copyright © 2007 Global Insight, Inc. 9
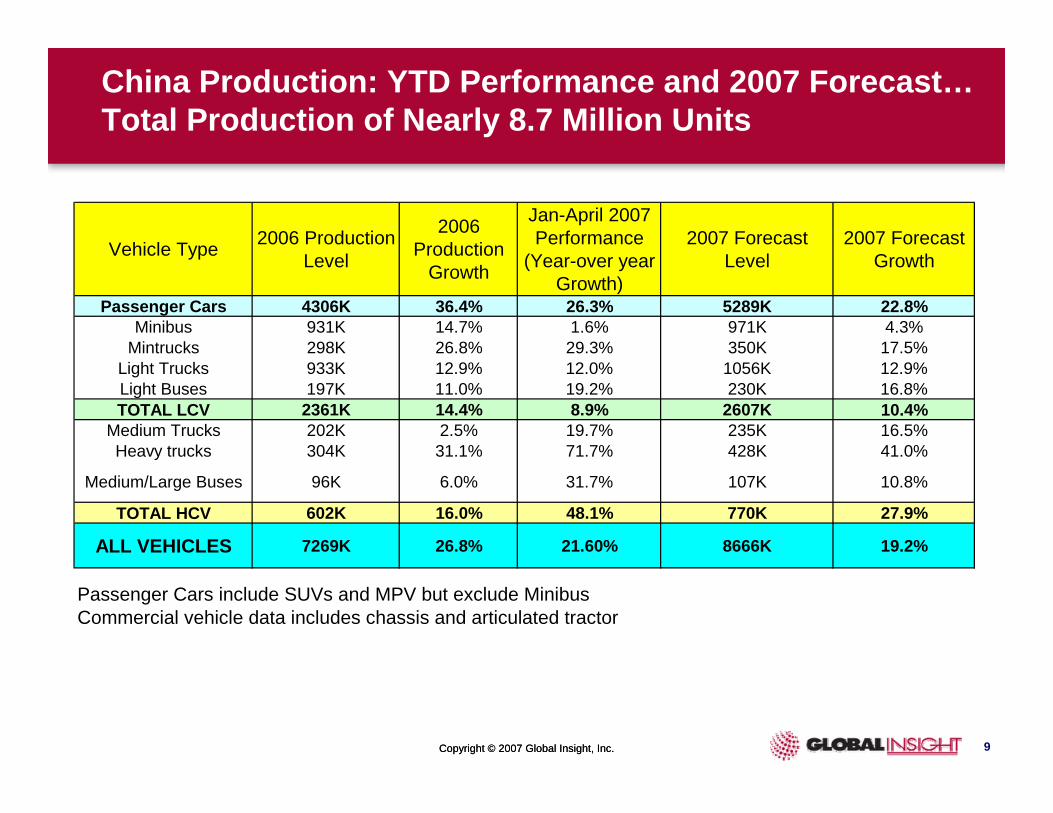
China Production: YTD Performance and 2007 Forecast…Total Production of Nearly 8.7 Million Units
Vehicle Type 2006 Production Level
2006 Production
Growth
Jan-April 2007 Performance
(Year-over year Growth)
2007 Forecast Level
2007 Forecast Growth
Passenger Cars 4306K 36.4% 26.3% 5289K 22.8%Minibus 931K 14.7% 1.6% 971K 4.3%
Mintrucks 298K 26.8% 29.3% 350K 17.5%Light Trucks 933K 12.9% 12.0% 1056K 12.9%Light Buses 197K 11.0% 19.2% 230K 16.8%TOTAL LCV 2361K 14.4% 8.9% 2607K 10.4%
Medium Trucks 202K 2.5% 19.7% 235K 16.5%Heavy trucks 304K 31.1% 71.7% 428K 41.0%
Medium/Large Buses 96K 6.0% 31.7% 107K 10.8%
TOTAL HCV 602K 16.0% 48.1% 770K 27.9%
ALL VEHICLES 7269K 26.8% 21.60% 8666K 19.2%
Passenger Cars include SUVs and MPV but exclude MinibusCommercial vehicle data includes chassis and articulated tractor
Copyright © 2007 Global Insight, Inc.Copyright © 2007 Global Insight, Inc. 10
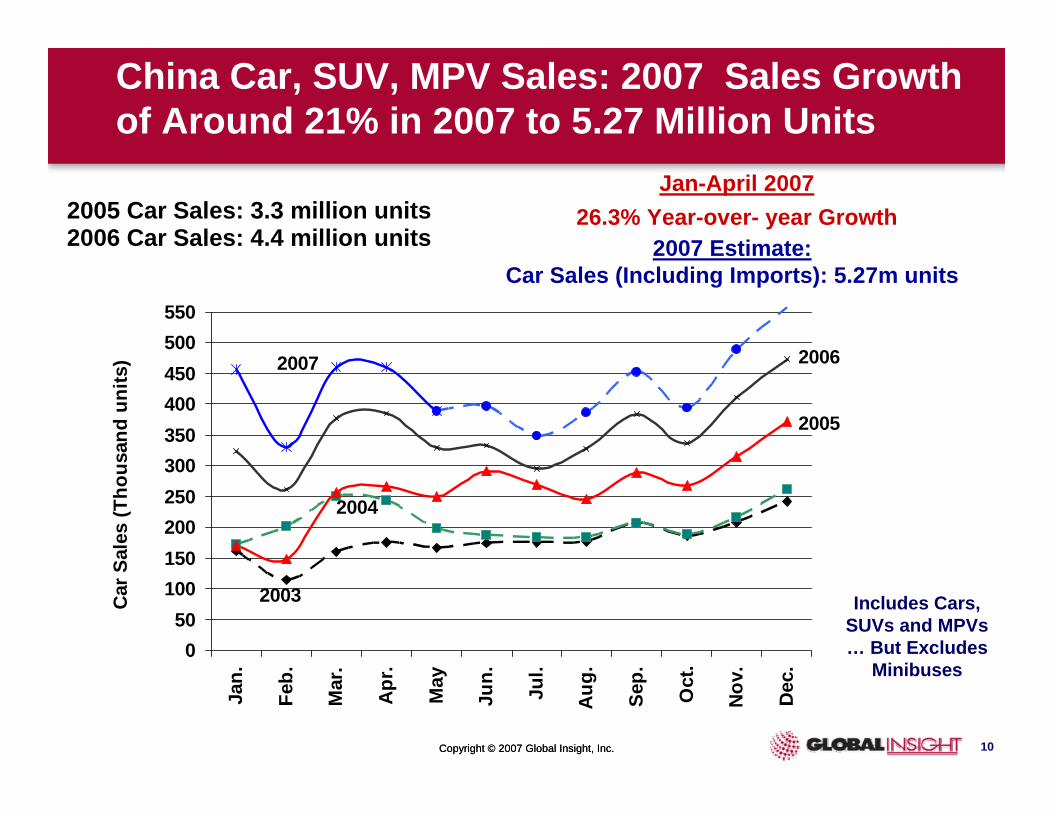
China Car, SUV, MPV Sales: 2007 Sales Growth of Around 21% in 2007 to 5.27 Million Units
050
100150200250300350400450500550
Jan.
Feb.
Mar
.
Apr
.
May
Jun.
Jul.
Aug
.
Sep.
Oct
.
Nov
.
Dec
.
Car
Sal
es (T
hous
and
units
)
2005
2003
2004
20062007
2005 Car Sales: 3.3 million units2006 Car Sales: 4.4 million units
Jan-April 200726.3% Year-over- year Growth
2007 Estimate:Car Sales (Including Imports): 5.27m units
Includes Cars, SUVs and MPVs … But Excludes
Minibuses
Copyright © 2007 Global Insight, Inc.Copyright © 2007 Global Insight, Inc. 11
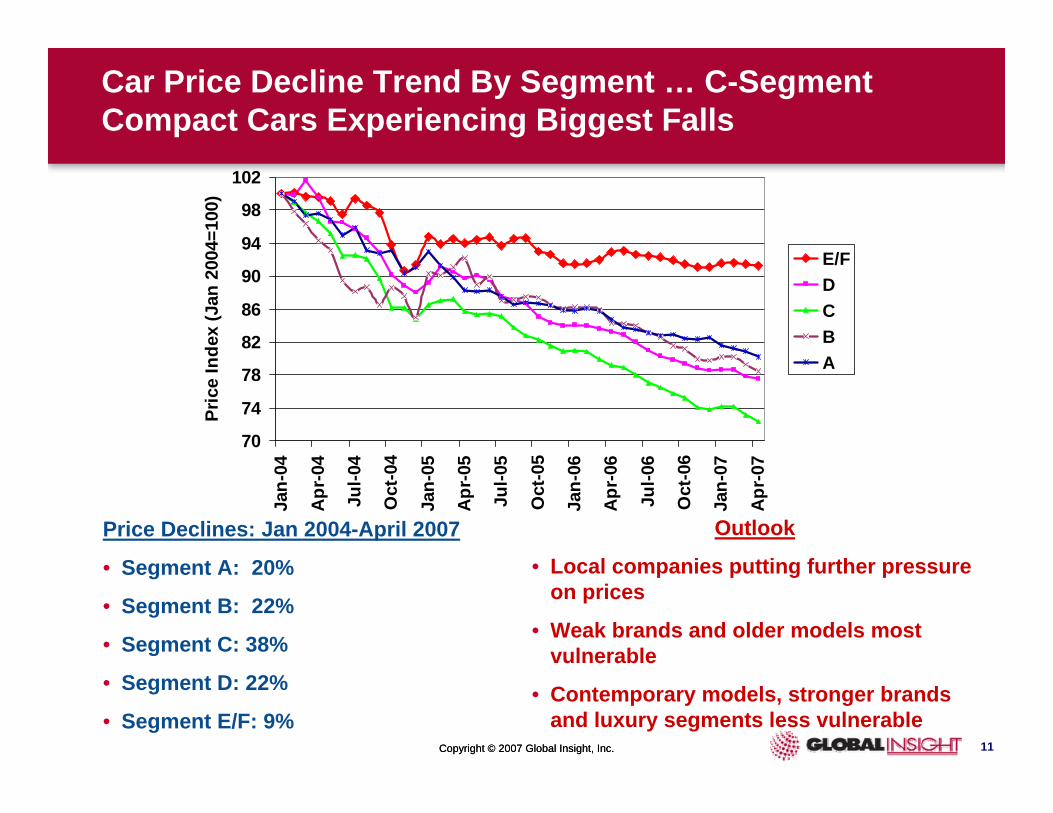
Car Price Decline Trend By Segment … C-Segment Compact Cars Experiencing Biggest Falls
70
74
78
82
86
90
94
98
102
Jan-
04
Apr
-04
Jul-0
4
Oct
-04
Jan-
05
Apr
-05
Jul-0
5
Oct
-05
Jan-
06
Apr
-06
Jul-0
6
Oct
-06
Jan-
07
Apr
-07
Pric
e In
dex
(Jan
200
4=10
0)
E/FDCBA
Price Declines: Jan 2004-April 2007
• Segment A: 20%
• Segment B: 22%
• Segment C: 38%
• Segment D: 22%
• Segment E/F: 9%
Outlook
• Local companies putting further pressure on prices
• Weak brands and older models most vulnerable
• Contemporary models, stronger brands and luxury segments less vulnerable

Copyright © 2007 Global Insight, Inc.Copyright © 2007 Global Insight, Inc. 12
China in Regions
Yantai
Chongqing
MacauHong Kong
Xining
Chengdu Wuhan
Guiyang
Tianjin
Hefei
Nanjing Shanghai
Ha ng
z ho u
Nanchang
Fuzhou
Guangzhou
Nanning
S h en y an g
Changchun
Harbin
Beijing
Guangdong
Fuj i a
n
Taiwan
Sichuan
Hubei
Hunan Jiangxi
H eilon gjiang
Inner Mongolia
Heb
e i
Henan Jiangsu
Anhui
Guangxi
Guizhou
Jilin
Gansu
Shaanxi
Shanxi
Qinghai
Xinjiang
Tibet
N ingx ia
Liaon in
g
Zhe
jian
g
Yunnan
Haikou
Hainan

Copyright © 2007 Global Insight, Inc.Copyright © 2007 Global Insight, Inc. 13
Car Ownership Levels by Region at the End of 2005
0
5
10
15
20
25
30
35
0 5 10 15 20 25
2005 Per Capita Income (Thousand Yuan)
Pass
enge
r Veh
icle
s Pe
r Tho
usan
d Pe
ople
North
South
East
North-West
North-East
South-West
Central
Highest Ownership Levels in North (Beijing) and South (Guangzhou)
Beijing /Government Purchase Influence
Shanghai License plate restrictions
Better public transport
Copyright © 2007 Global Insight, Inc.Copyright © 2007 Global Insight, Inc. 14
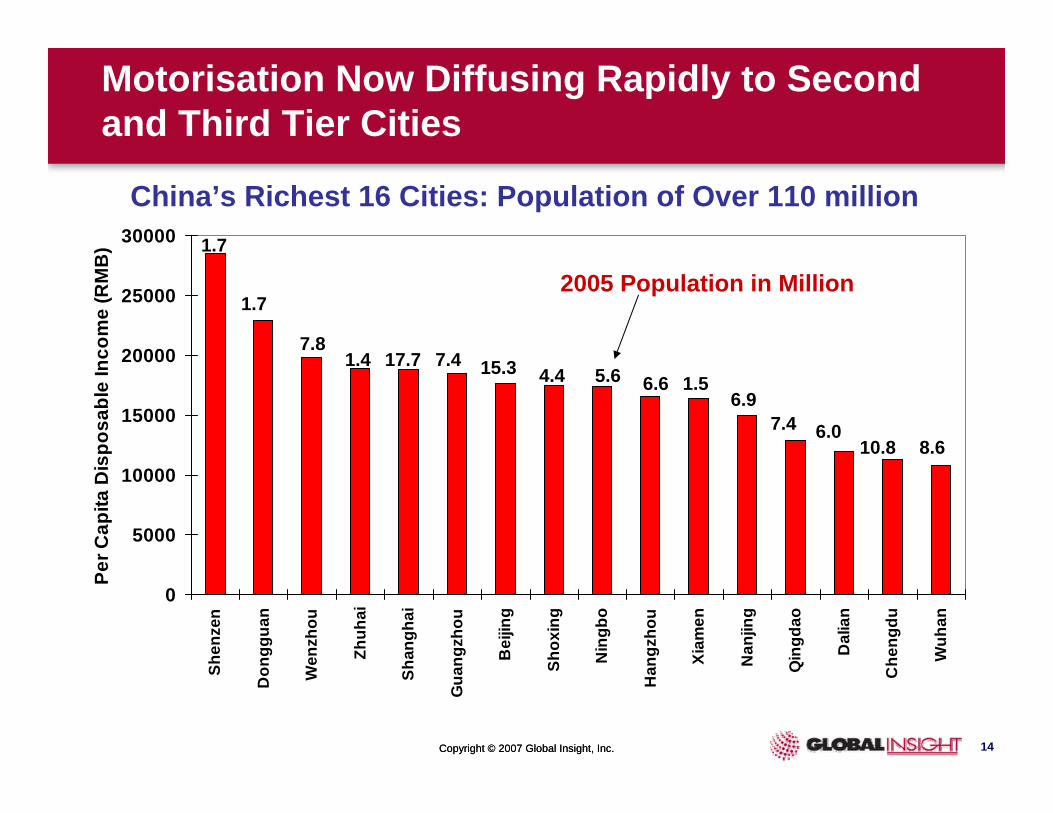
Motorisation Now Diffusing Rapidly to Second and Third Tier Cities
0
5000
10000
15000
20000
25000
30000Sh
enze
n
Don
ggua
n
Wen
zhou
Zhuh
ai
Shan
ghai
Gua
ngzh
ou
Bei
jing
Shox
ing
Nin
gbo
Han
gzho
u
Xiam
en
Nan
jing
Qin
gdao
Dal
ian
Che
ngdu
Wuh
an
Per C
apita
Dis
posa
ble
Inco
me
(RM
B) 1.7
1.7
7.81.4 17.7 7.4 15.3 4.4 5.6 6.6 1.5
6.97.4 6.0
10.8 8.6
2005 Population in Million
China’s Richest 16 Cities: Population of Over 110 million
Copyright © 2007 Global Insight, Inc.Copyright © 2007 Global Insight, Inc. 15
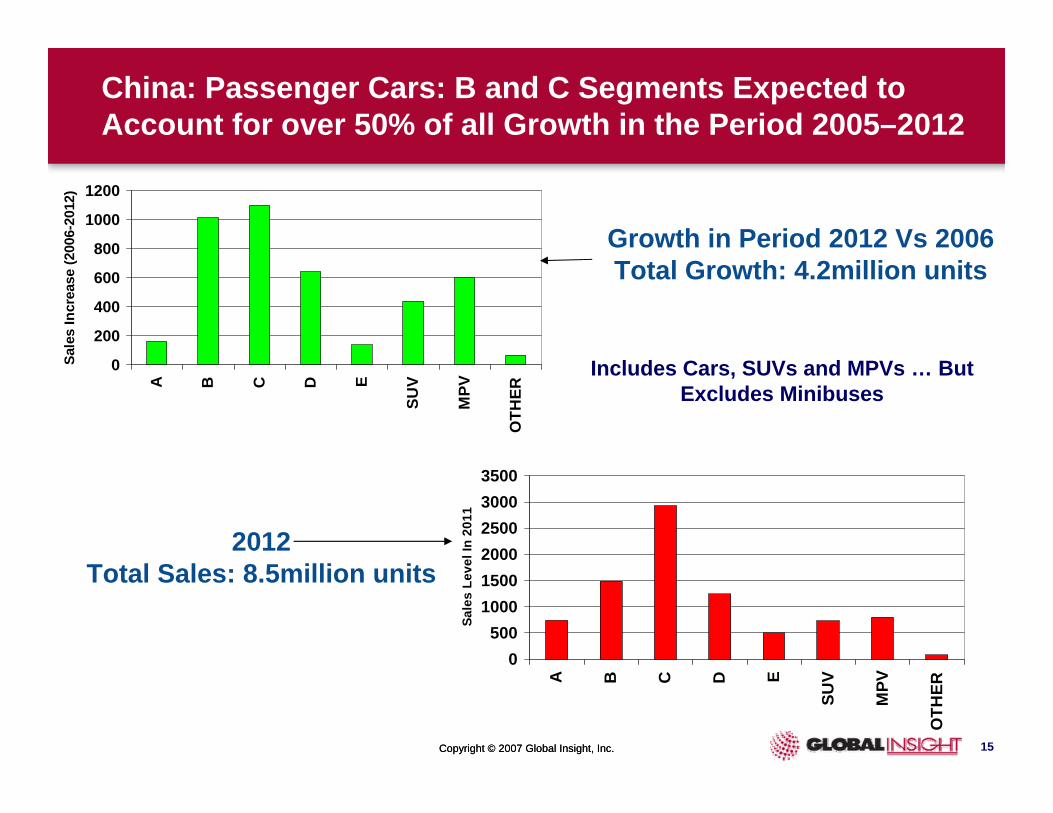
China: Passenger Cars: B and C Segments Expected to Account for over 50% of all Growth in the Period 2005–2012
0
200
400
600
800
1000
1200
A B C D E
SUV
MPV
OTH
ER
Sale
s In
crea
se (2
006-
2012
)
Growth in Period 2012 Vs 2006Total Growth: 4.2million units
0500
100015002000250030003500
A B C D E
SUV
MPV
OTH
ER
Sale
s Le
vel I
n 20
11
2012Total Sales: 8.5million units
Includes Cars, SUVs and MPVs … But Excludes Minibuses
Copyright © 2007 Global Insight, Inc.Copyright © 2007 Global Insight, Inc. 16
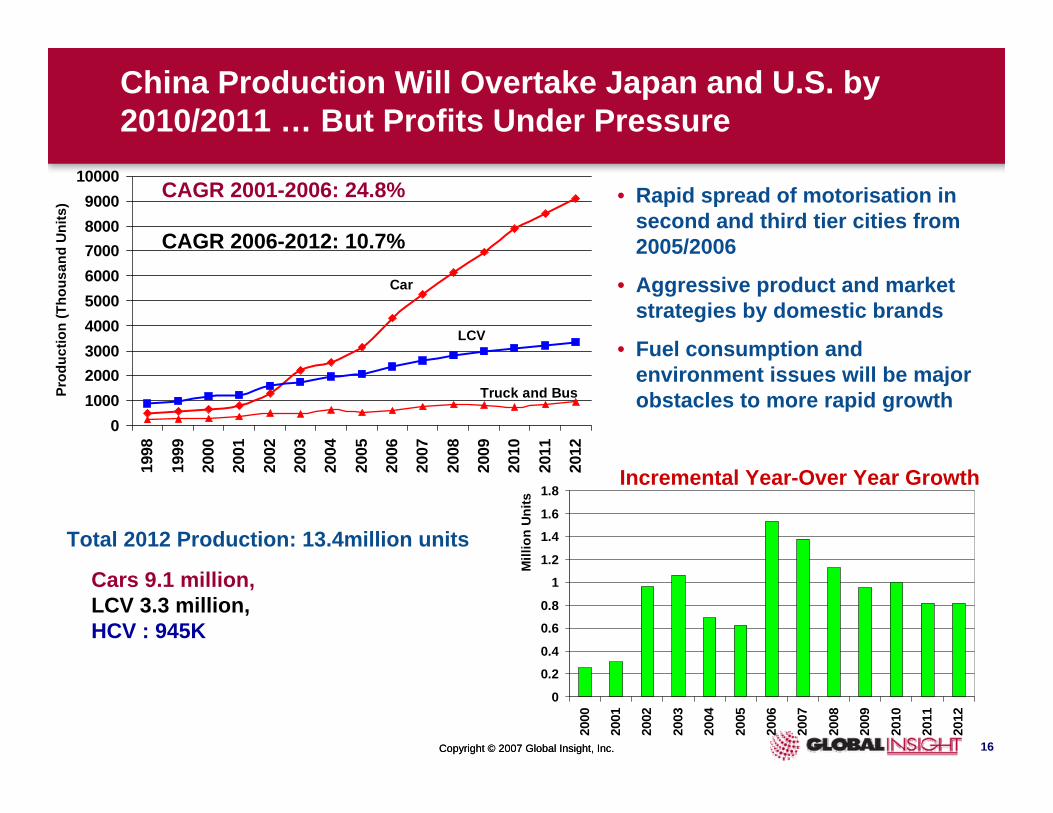
China Production Will Overtake Japan and U.S. by 2010/2011 … But Profits Under Pressure
0100020003000400050006000700080009000
10000
1998
1999
2000
2001
2002
2003
2004
2005
2006
2007
2008
2009
2010
2011
2012
Prod
uctio
n (T
hous
and
Uni
ts)
Car
LCV
Truck and Bus
Cars 9.1 million, LCV 3.3 million,HCV : 945K
Total 2012 Production: 13.4million units
0
0.2
0.4
0.6
0.8
1
1.2
1.4
1.6
1.8
2000
2001
2002
2003
2004
2005
2006
2007
2008
2009
2010
2011
2012
Mill
ion
Uni
ts
Incremental Year-Over Year Growth
• Rapid spread of motorisation in second and third tier cities from 2005/2006
• Aggressive product and market strategies by domestic brands
• Fuel consumption and environment issues will be major obstacles to more rapid growth
CAGR 2001-2006: 24.8%
CAGR 2006-2012: 10.7%
Copyright © 2007 Global Insight, Inc.Copyright © 2007 Global Insight, Inc. 17
Consumers Still Have Strong Appetite for Cars …But What Could Go Wrong?
• Economic hard landing– Focus on controlling investments and exports– Long term solution — boost domestic consumption– Government unlikely to adopt anti-consumption policies
• Environmental disaster– Loss of confidence and impact on FDI– Would trigger clampdown on industrial growth
• Oil supply squeeze– Pump prices will need to be hiked up more aggressively– Chinese oil companies investing to secure oil supplies
• Social or political backlash– Regional disparities …From Equal Poverty To Unequal Wealth– Can the government achieve more balanced development
• Banking crisis– Lower probability now as banks are better capitalised
• Trade backlash …especially from U.S.– But U.S. multinationals are the major exporters– Will force a more rapid yuan appreciation
Copyright © 2007 Global Insight, Inc.Copyright © 2007 Global Insight, Inc. 18
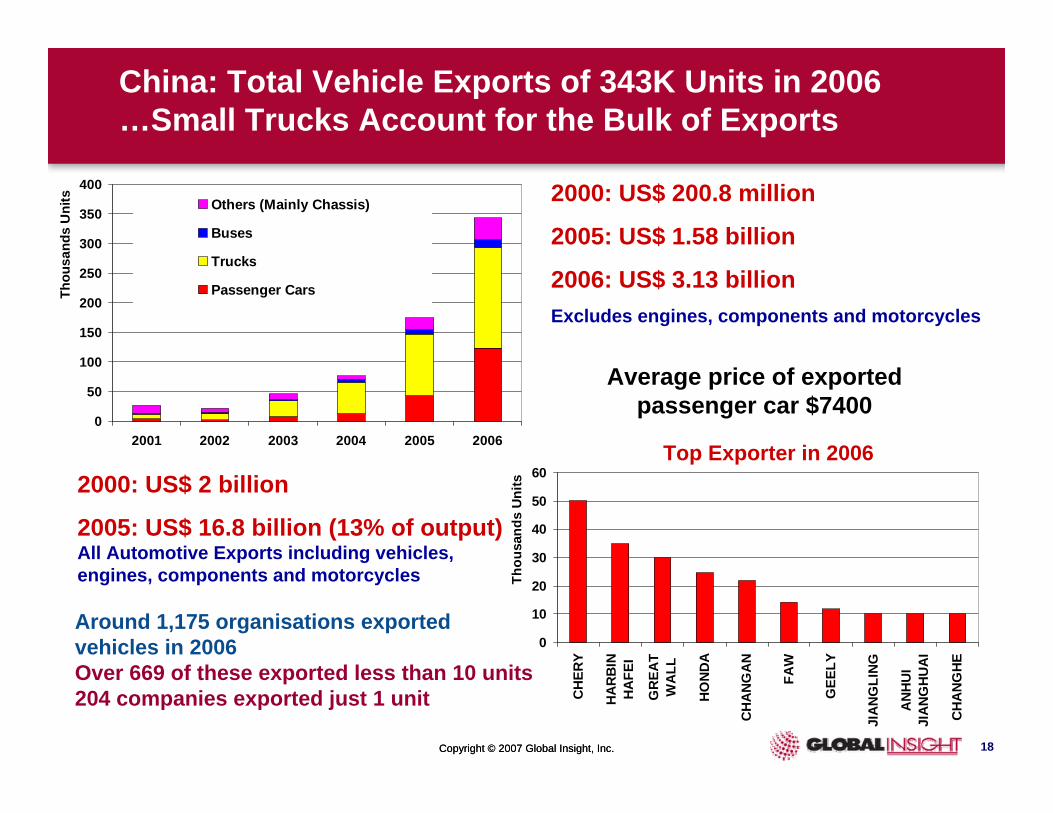
China: Total Vehicle Exports of 343K Units in 2006 …Small Trucks Account for the Bulk of Exports
0
50
100
150
200
250
300
350
400
2001 2002 2003 2004 2005 2006
Thou
sand
s U
nits Others (Mainly Chassis)
Buses
Trucks
Passenger Cars
2000: US$ 200.8 million
2005: US$ 1.58 billion
2006: US$ 3.13 billionExcludes engines, components and motorcycles
Average price of exported passenger car $7400
0
10
20
30
40
50
60
CH
ERY
HA
RB
INH
AFE
I
GR
EAT
WA
LL
HO
ND
A
CH
AN
GA
N
FAW
GEE
LY
JIA
NG
LIN
G
AN
HU
IJI
AN
GH
UA
I
CH
AN
GH
E
Thou
sand
s U
nits
Top Exporter in 20062000: US$ 2 billion
2005: US$ 16.8 billion (13% of output) All Automotive Exports including vehicles, engines, components and motorcycles
Around 1,175 organisations exported vehicles in 2006Over 669 of these exported less than 10 units204 companies exported just 1 unit

Copyright © 2007 Global Insight, Inc.Copyright © 2007 Global Insight, Inc. 19
China Exports: Still Significant Obstacles …Growth Unlikely to be Spectacular
Foreign OEMs• 50% cap on foreign ownership of assembly ventures is restrictive
– Does not encourage global OEMs to hike vehicle exports– Complicated to integrate China operations into regional and global networks under current
ownership structure– India, Thailand, Mexico, Brazil and S. Africa are attractive alternatives with fewer restrictions– Current focus of exports is on components …Exception is Honda
Chinese OEMs• Chinese brands still have major hurdles to overcome
– Upstream: Product quality and refinements– Regulatory: Homologation, Safety and Emissions– Downstream: Branding, Distribution Network, After-Sales, Warranties
• So far … an opportunistic approach by Chinese brands– Deals with inexperienced operators …unable to grapple with all the product, regulatory, brand-
building issues– Need a coherent strategy and greater direct OEM presence in key export regions– International mindset
• Alliances and rebadging relationships will provide learning experience and reduce risks e.g.
– Chery and Chrysler Chery and Fiat
Copyright © 2007 Global Insight, Inc.Copyright © 2007 Global Insight, Inc. 20
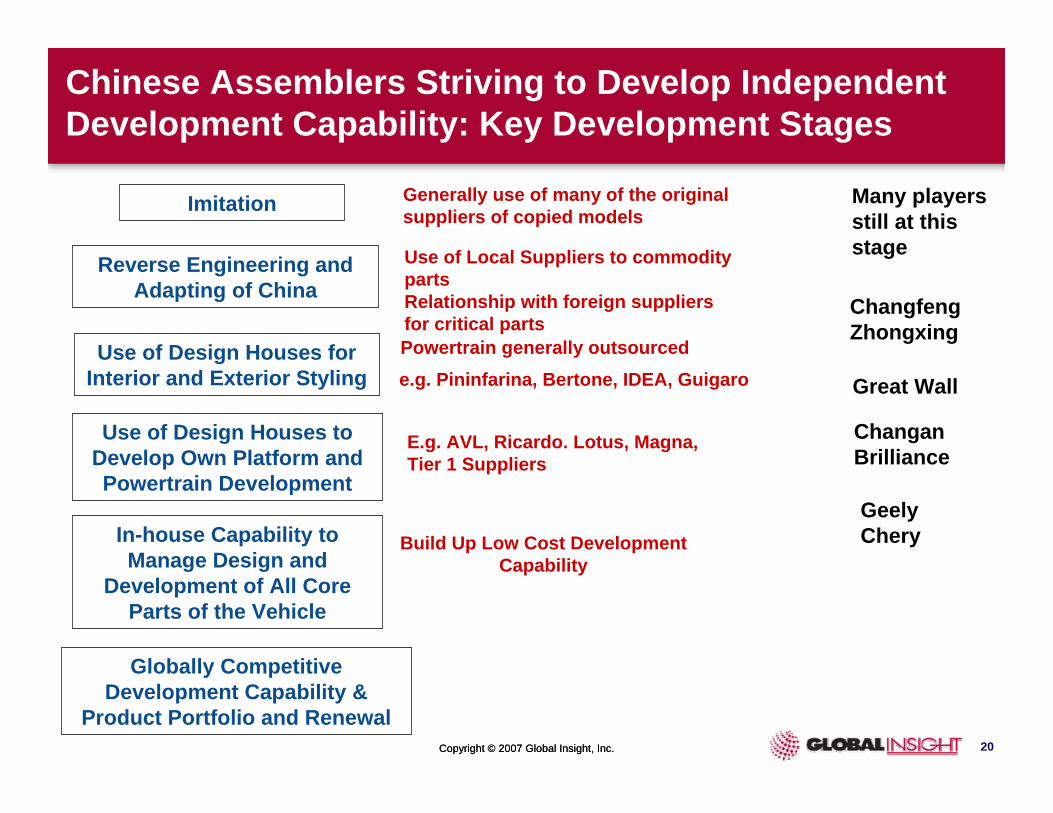
Chinese Assemblers Striving to Develop Independent Development Capability: Key Development Stages
Globally Competitive Development Capability &
Product Portfolio and Renewal
Imitation Generally use of many of the original suppliers of copied models
Reverse Engineering and Adapting of China
Use of Local Suppliers to commodity partsRelationship with foreign suppliers for critical parts
Use of Design Houses to Develop Own Platform and Powertrain Development
E.g. AVL, Ricardo. Lotus, Magna,Tier 1 Suppliers
Use of Design Houses for Interior and Exterior Styling e.g. Pininfarina, Bertone, IDEA, Guigaro
Powertrain generally outsourced
In-house Capability to Manage Design and
Development of All Core Parts of the Vehicle
Build Up Low Cost Development Capability
GeelyChery
Great Wall
ChanganBrilliance
Changfeng Zhongxing
Many players still at this stage
Copyright © 2007 Global Insight, Inc.Copyright © 2007 Global Insight, Inc. 21
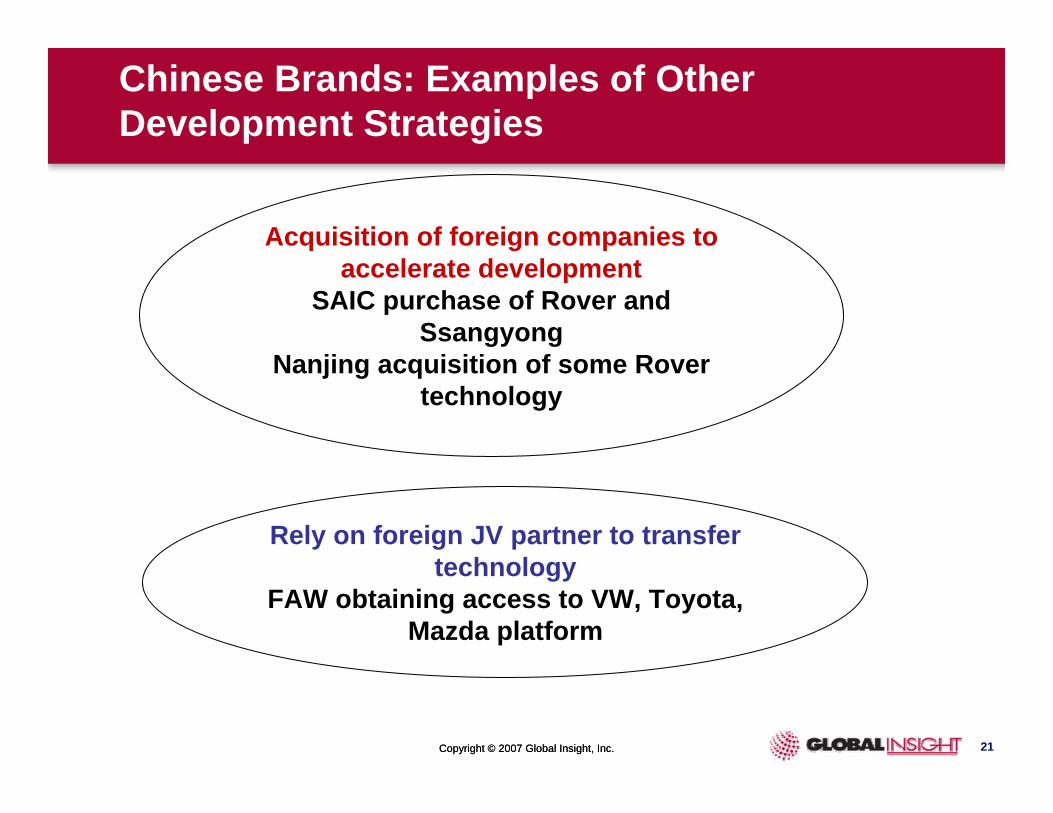
Chinese Brands: Examples of Other Development Strategies
Acquisition of foreign companies to accelerate development
SAIC purchase of Rover and Ssangyong
Nanjing acquisition of some Rover technology
Rely on foreign JV partner to transfer technology
FAW obtaining access to VW, Toyota, Mazda platform

Copyright © 2007 Global Insight, Inc.Copyright © 2007 Global Insight, Inc. 22
China Exports: Commercial Vehicles Dominate ….Passenger Car Export Take-off from 2009/2010
0
200
400
600
800
1000
1200
2001 2002 2003 2004 2005 2006 2007 2008 2009 2010 2011 2012
Thou
sand
s
Others (Mainly Chassis)BusesTrucksPassenger Cars
Total Exports: 343K in 2006 ...Around 1 Million in 2011

Copyright © 2007 Global Insight, Inc.Copyright © 2007 Global Insight, Inc. 23
0 200 400 600 800 1000 1200
DAIMLERCHRYSLER
MAZDASUZUKI
FORD
PSANISSAN
HONDAHYUNDAI
SGM WULINGGM
TOYOTA
VW GROUP
Increase in Vehicle Production (000 units) 2012 vs 2007
2006 Production
Production Growth 2007-2012
Sino-Foreign JVs: LV Production Increase of 2.6 Million Units* in the Period 2007-2012
Growth Prospects by Company: 2007–2012 Sino-Foreign JVs
Based on Ownership of Technology * SGM Wulin counted under Domestic Brand Total

Copyright © 2007 Global Insight, Inc.Copyright © 2007 Global Insight, Inc. 24
0 200 400 600 800 1000
BYD AUTONANJING AUTOMOTIVE
CHINA BRILLIANCELIFAN GROUP
AVICHINABEIJING AUTOMOTIVE
DONGFENGANHUI JIANGHUAI
SGM-WULINSAIC
GREAT WALLGEELY
FAWCHERY
CHANGAN
Increase in Vehicle Production (000 units) 2012 vs 2007
2006 Production
Production Growth 2007-2012
Domestic Brands LV Production Increase of 3.3 Million Units* in the Period 2007-2012
Growth Prospects by Company: 2007–2012 Domestic Brands
Based on Ownership of Technology * SGM Wulin counted under Domestic Brand Total
All Light Vehicles < 6 Tonnes GVW
Current Production minicommercial…future cars
Copyright © 2007 Global Insight, Inc.Copyright © 2007 Global Insight, Inc. 25
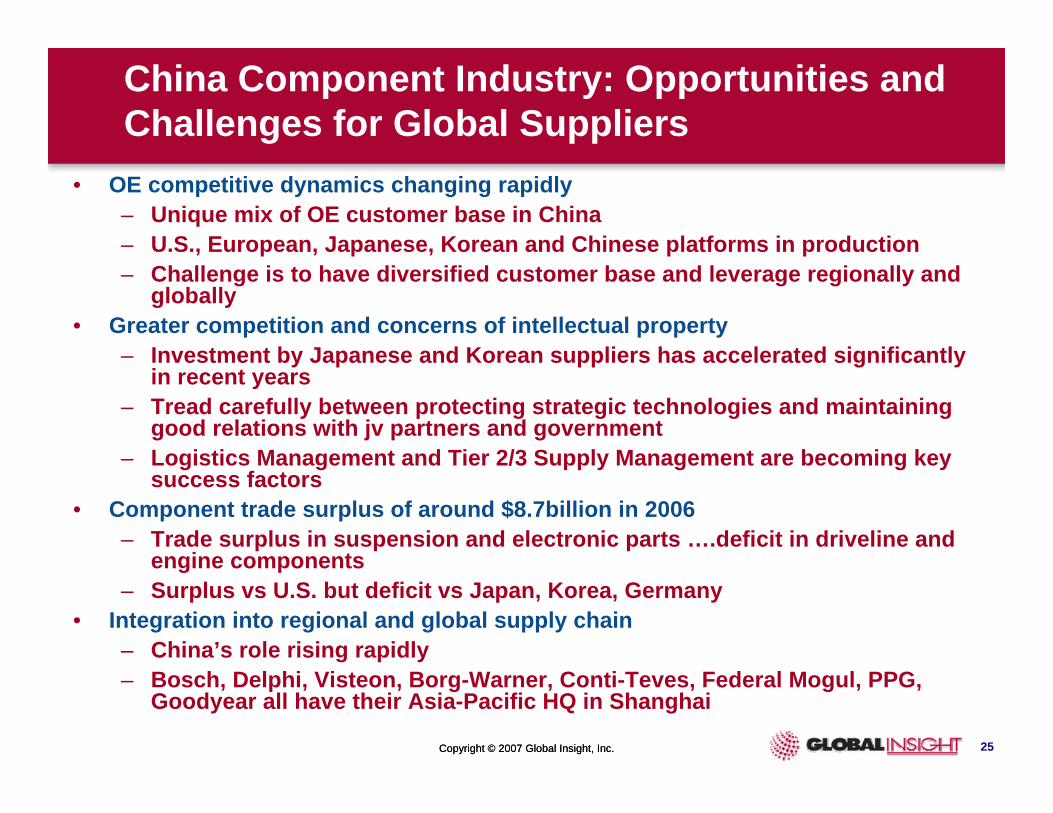
China Component Industry: Opportunities and Challenges for Global Suppliers
• OE competitive dynamics changing rapidly – Unique mix of OE customer base in China– U.S., European, Japanese, Korean and Chinese platforms in production– Challenge is to have diversified customer base and leverage regionally and
globally• Greater competition and concerns of intellectual property
– Investment by Japanese and Korean suppliers has accelerated significantly in recent years
– Tread carefully between protecting strategic technologies and maintaining good relations with jv partners and government
– Logistics Management and Tier 2/3 Supply Management are becoming key success factors
• Component trade surplus of around $8.7billion in 2006– Trade surplus in suspension and electronic parts ….deficit in driveline and
engine components– Surplus vs U.S. but deficit vs Japan, Korea, Germany
• Integration into regional and global supply chain– China’s role rising rapidly– Bosch, Delphi, Visteon, Borg-Warner, Conti-Teves, Federal Mogul, PPG,
Goodyear all have their Asia-Pacific HQ in Shanghai
Copyright © 2007 Global Insight, Inc.Copyright © 2007 Global Insight, Inc. 26
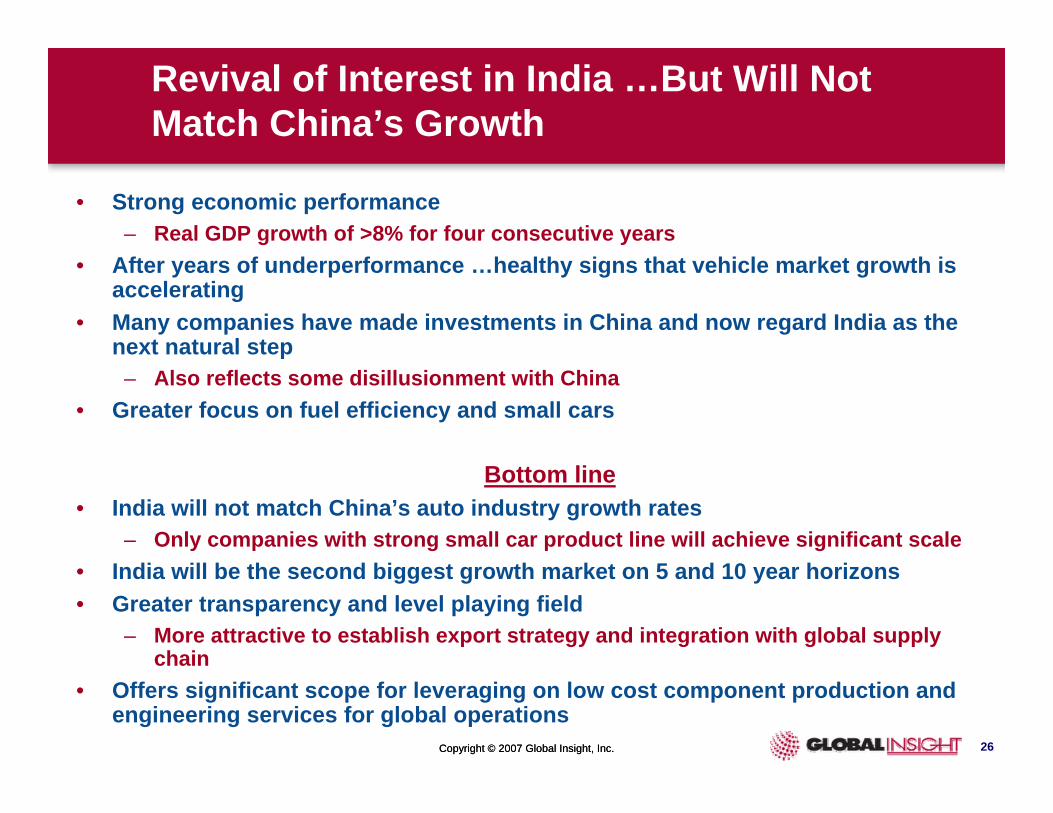
Revival of Interest in India …But Will Not Match China’s Growth
• Strong economic performance– Real GDP growth of >8% for four consecutive years
• After years of underperformance …healthy signs that vehicle market growth is accelerating
• Many companies have made investments in China and now regard India as the next natural step
– Also reflects some disillusionment with China• Greater focus on fuel efficiency and small cars
Bottom line• India will not match China’s auto industry growth rates
– Only companies with strong small car product line will achieve significant scale • India will be the second biggest growth market on 5 and 10 year horizons• Greater transparency and level playing field
– More attractive to establish export strategy and integration with global supply chain
• Offers significant scope for leveraging on low cost component production and engineering services for global operations

Copyright © 2007 Global Insight, Inc.Copyright © 2007 Global Insight, Inc. 27
Tata Plans to Target 2-Wheeler Owners with its Microcar (1 Lakh Car) …Other OEMs Now Beginning to Take Note
• Styling work completed … Prototypes being tested– Rear engine 4–5 seat car with 600cc
Euro IV compliant 30hp engine– Planning a diesel version
• Innovative production concept and supplier relationship– Mother plant in West Bengal and
satellite assembly locations across India
• Target price of base version expected to be $2500 (125,000 rupees) … about half the price of the Maruti Alto
• Attractive financing will play a key role in supporting sales– Tata expanding its vehicle finance
network in rural areas
Tata Microcar will targetbuyers of Two-Wheelers
Tata targeting 1 million units

Copyright © 2007 Global Insight, Inc.Copyright © 2007 Global Insight, Inc. 28
India Gaining Popularity as an Attractive Export Base for Global OEMs
• Few restrictions on foreign ownership of assembly ventures– Full management control– Easier to integrate into global strategy and supply chain
• India gradually positioning itself as global production hub for small cars
• Several global OEMs planning large export operations– Hyundai already the largest exporter … raising exports levels– Suzuki will ramp up exports post 2009– GM will commence Matiz/Spark exports from 2009– Renault and Nissan have ambitious export plans– Toyota and Honda most likely export small cars post 2010
• Poor infrastructure and logistics costs are main obstacles
Copyright © 2007 Global Insight, Inc.Copyright © 2007 Global Insight, Inc. 29
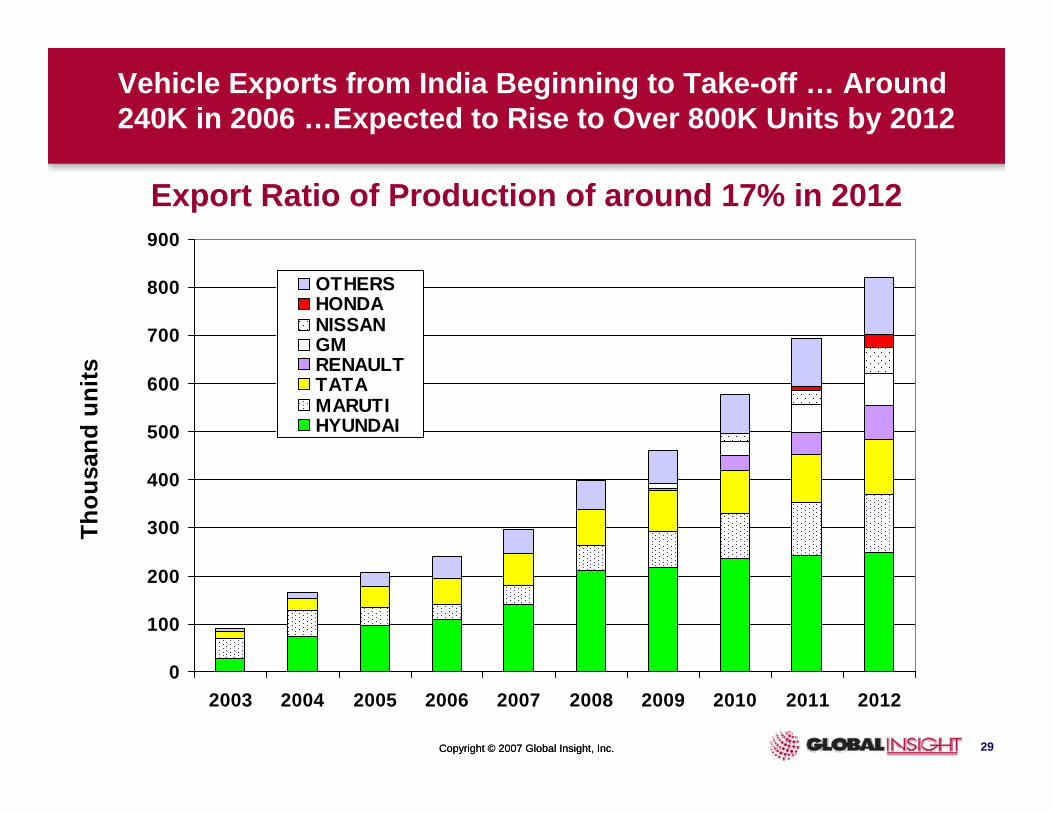
Vehicle Exports from India Beginning to Take-off … Around 240K in 2006 …Expected to Rise to Over 800K Units by 2012
0
100
200
300
400
500
600
700
800
900
2003 2004 2005 2006 2007 2008 2009 2010 2011 2012
Thou
sand
uni
ts
OTHERSHONDANISSANGMRENAULTTATAMARUTIHYUNDAI
Export Ratio of Production of around 17% in 2012

Copyright © 2007 Global Insight, Inc.Copyright © 2007 Global Insight, Inc. 30
0 200 400 600 800 1000 1200 1400
FIAT GROUPFORD
VW GROUPHONDA
TOYOTARENAULT
MAHINDRAGM
HYUNDAISUZUKI
TATA
Production (000 units)
2006 Production Production Growth 2006-2012
Light Vehicle Production Increase of 2.7 million units in the period 2006-2012 … Tata “1 lakh Car” Provides a Major Boost Post 2009
India: Small Car Makers Best Placed for Growth
Logan plus its derivatives
1 Lakh Car (Microcar), Ace
New Plant, More Export Production
New Plant, Diesel Engines,SX4 sedan, Zen Estillo, New Wagon R
New Plant, Add Aveo and SparkIngenio in 2008
Plans to Launch Small Car Delayed to 2009
New plant and Small Car in 2010
Copyright © 2007 Global Insight, Inc.Copyright © 2007 Global Insight, Inc. 31
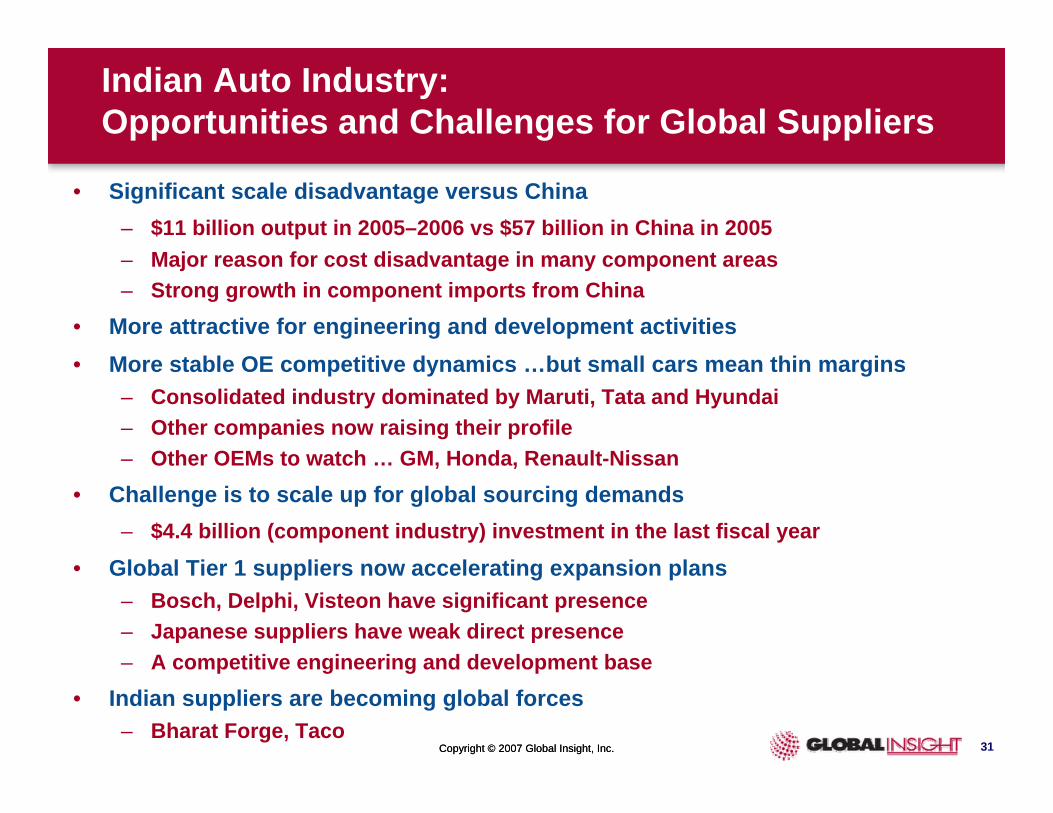
Indian Auto Industry: Opportunities and Challenges for Global Suppliers
• Significant scale disadvantage versus China– $11 billion output in 2005–2006 vs $57 billion in China in 2005– Major reason for cost disadvantage in many component areas– Strong growth in component imports from China
• More attractive for engineering and development activities• More stable OE competitive dynamics …but small cars mean thin margins
– Consolidated industry dominated by Maruti, Tata and Hyundai– Other companies now raising their profile– Other OEMs to watch … GM, Honda, Renault-Nissan
• Challenge is to scale up for global sourcing demands– $4.4 billion (component industry) investment in the last fiscal year
• Global Tier 1 suppliers now accelerating expansion plans– Bosch, Delphi, Visteon have significant presence– Japanese suppliers have weak direct presence– A competitive engineering and development base
• Indian suppliers are becoming global forces– Bharat Forge, Taco
Copyright © 2007 Global Insight, Inc.Copyright © 2007 Global Insight, Inc. 32
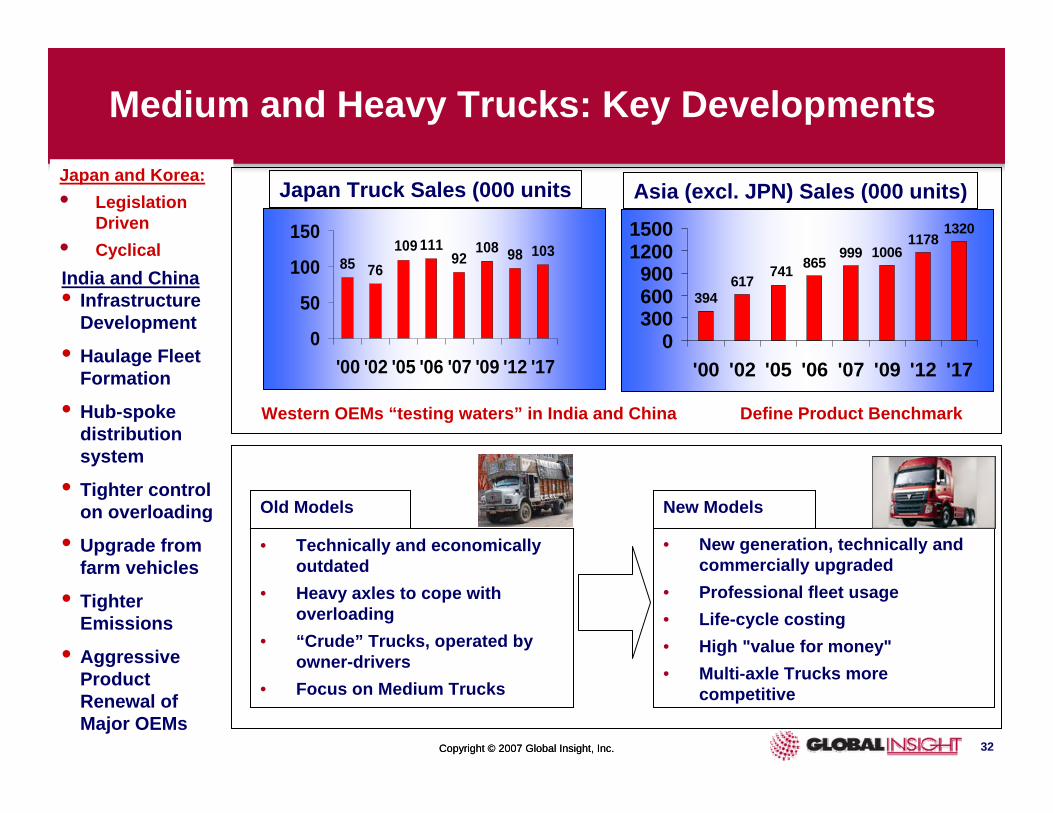
394617
865999 1006
11781320
741
0300600900
12001500
'00 '02 '05 '06 '07 '09 '12 '17
Asia (excl. JPN) Sales (000 units)Japan and Korea:• Legislation
Driven• Cyclical
Medium and Heavy Trucks: Key Developments
• Technically and economically outdated
• Heavy axles to cope with overloading
• “Crude” Trucks, operated by owner-drivers
• Focus on Medium Trucks
• New generation, technically and commercially upgraded
• Professional fleet usage• Life-cycle costing• High "value for money"• Multi-axle Trucks more
competitive
New ModelsOld Models
Western OEMs “testing waters” in India and China Define Product Benchmark
85 76111
92108 98 103109
0
50
100
150
'00 '02 '05 '06 '07 '09 '12 '17
Japan Truck Sales (000 units
India and China• Infrastructure
Development
• Haulage Fleet Formation
• Hub-spoke distribution system
• Tighter control on overloading
• Upgrade from farm vehicles
• Tighter Emissions
• Aggressive Product Renewal of Major OEMs

Copyright © 2007 Global Insight, Inc.Copyright © 2007 Global Insight, Inc. 33
China Truck Demand: Correction in 2005 … But Recovering Strongly Since Second Half of 2006 …Gradual Investment Slowdown
0
100
200
300
400
500
600
1990
1992
1994
1996
1998
2000
2002
2004
2006
2008
2010
2012
Truc
k an
d B
us S
ales
(Tho
usan
d U
nits
)
Trucks6-15T GVW
Trucks >15T GVW
Medium and Large Buses
Key Trends• Strong investments and
infrastructure construction supporting demand
• Overloading restriction fuelled major boom in 2004
• Correction in 2005 and recovery in 2H of 2006
• Road Tolls Charging discouraging overloading
• Demand for large (>25t) Artic tractors is especially strong
• Migration from farm vehicles supporting medium truck sales
Copyright © 2007 Global Insight, Inc.Copyright © 2007 Global Insight, Inc. 34
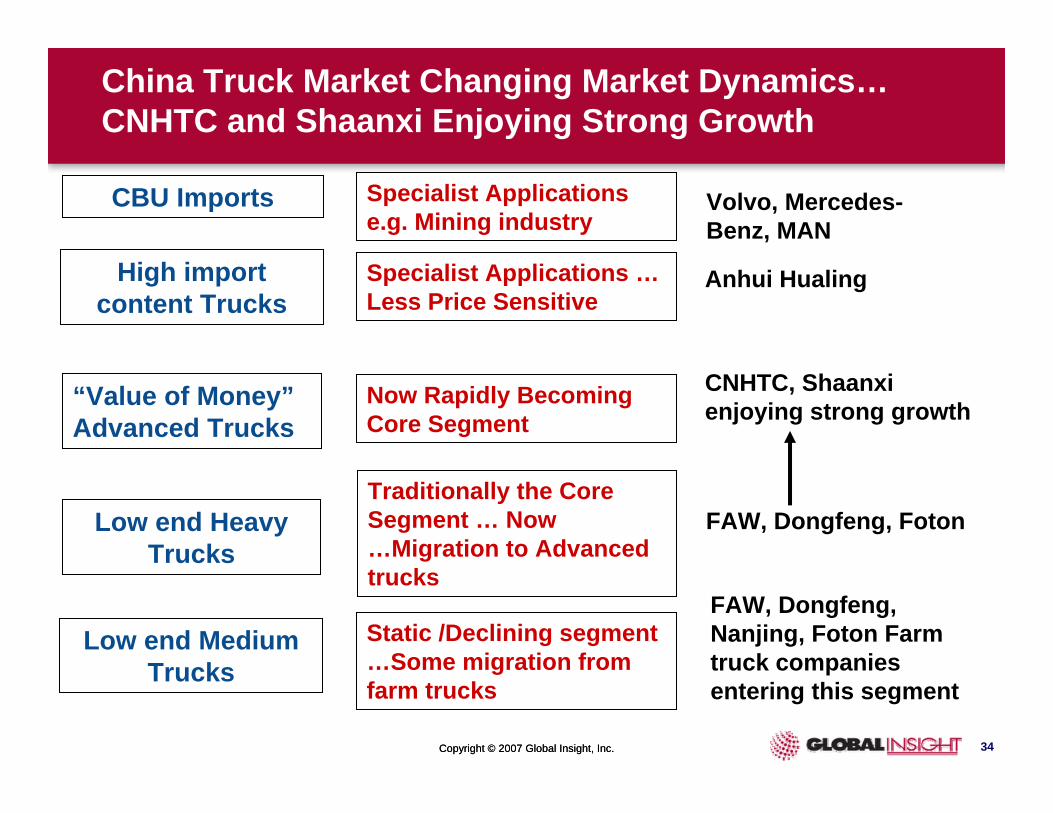
China Truck Market Changing Market Dynamics…CNHTC and Shaanxi Enjoying Strong Growth
“Value of Money”Advanced Trucks
CNHTC, Shaanxi enjoying strong growthNow Rapidly Becoming
Core Segment
Low end Medium Trucks
FAW, Dongfeng, Nanjing, Foton Farm truck companies entering this segment
Static /Declining segment …Some migration from farm trucks
High import content Trucks
Specialist Applications …Less Price Sensitive
Anhui Hualing
CBU Imports Specialist Applications e.g. Mining industry
Volvo, Mercedes-Benz, MAN
Low end Heavy Trucks
FAW, Dongfeng, FotonTraditionally the Core Segment … Now …Migration to Advanced trucks

Copyright © 2007 Global Insight, Inc.Copyright © 2007 Global Insight, Inc. 35
India Truck Sales: Strong Up Cycle Continuing …New Entrants Will Struggle to Build up Volumes
0
50
100
150
200
250
1996
1998
2000
2002
2004
2006
2008
2010
2012
HC
V Sa
les
(Tho
usan
d U
nits
)
Heavy Trucks
Medium Trucks
Bus
TATA
ASHOK LEYLAND
MAHINDRAEICHERSWARAJFORCE/MAN
0
100
200
300
400
500
2002
2004
2006
2008
2010
2012
2014H
CV
Prod
uctio
n (T
hous
and
units
)
Key New Players• Force Motor -- MAN: Joint Venture:
Aiming for high local content• Mahindra & Mahindra and
International: Joint Venture: Aiming for high local content
• Volvo 100% Owned Subsidiary: low volume
• DaimlerChrysler 100% Subsidiary: Very low volume
Key Trends• Infrastructure development a major
driver• Strong industrial performance• Overloading restrictions boosted
2006 performance• Less dependent on agricultural
sector and monsoons

Copyright © 2007 Global Insight, Inc.Copyright © 2007 Global Insight, Inc. 36
Top Six Countries Will Account for 60% of Global Production in 2012 … Major Markets for OEM Parts
-3000 0 3000 6000 9000 12000 15000
TURKEYIRAN
ITALYUK
THAILANDRUSSIAMEXICO
SPAINBRAZIL
CANADAFRANCE
S KOREAINDIA
GERMANYJAPAN
UNITED STATESCHINA
Vehicle Production (Million units)
2006 ProductionProduction Growth 2006-2012
17 Countries with production over 1m units in 2012 …will account for 90% of global production in 2012
China, Japan, Korea and India will account for nearly 40% of global
vehicle production in 2012
Including Passenger Cars And Commercial Vehicles
Global production: 69.8 in 2006 85.7 Million units in 2012 …15.9 Million Units of Growth …India and China will account for 57%
Copyright © 2007 Global Insight, Inc.Copyright © 2007 Global Insight, Inc. 37
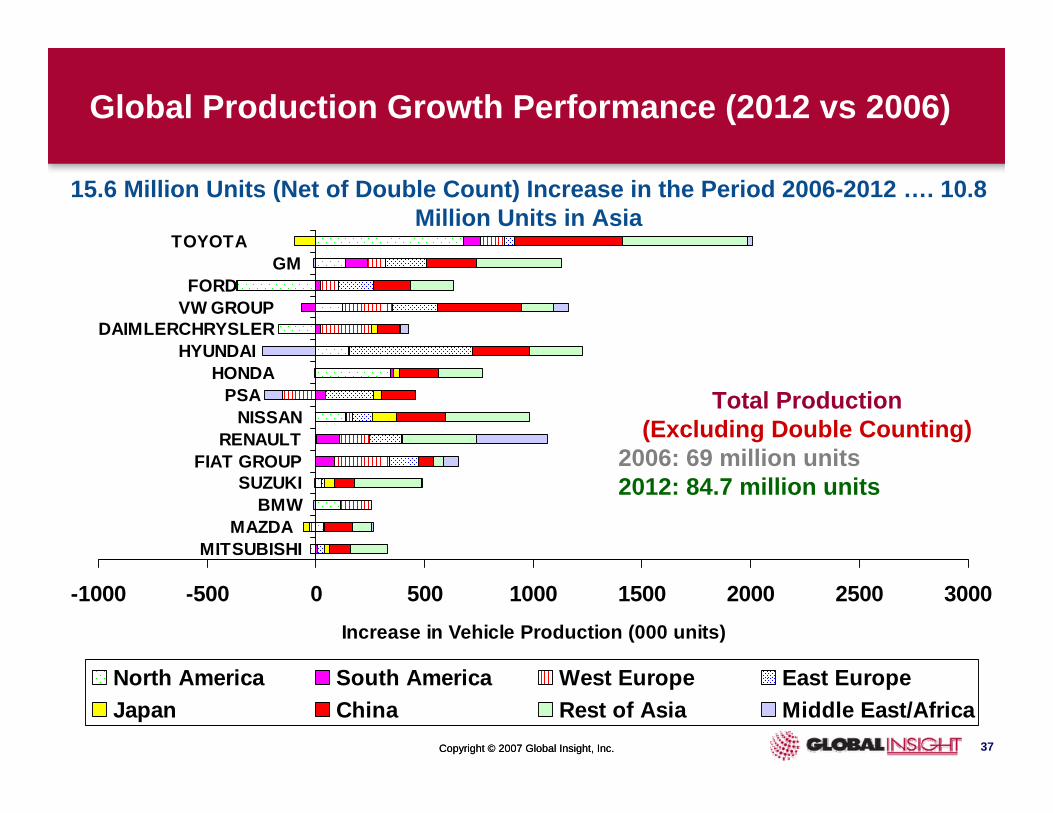
-1000 -500 0 500 1000 1500 2000 2500 3000
MITSUBISHIMAZDA
BMWSUZUKI
FIAT GROUPRENAULT
NISSANPSA
HONDA HYUNDAI
DAIMLERCHRYSLER VW GROUP FORD
GMTOYOTA
Increase in Vehicle Production (000 units)
North America South America West Europe East EuropeJapan China Rest of Asia Middle East/Africa
Total Production(Excluding Double Counting)
2006: 69 million units2012: 84.7 million units
15.6 Million Units (Net of Double Count) Increase in the Period 2006-2012 …. 10.8 Million Units in Asia
Global Production Growth Performance (2012 vs 2006)
Copyright © 2007 Global Insight, Inc.Copyright © 2007 Global Insight, Inc. 38
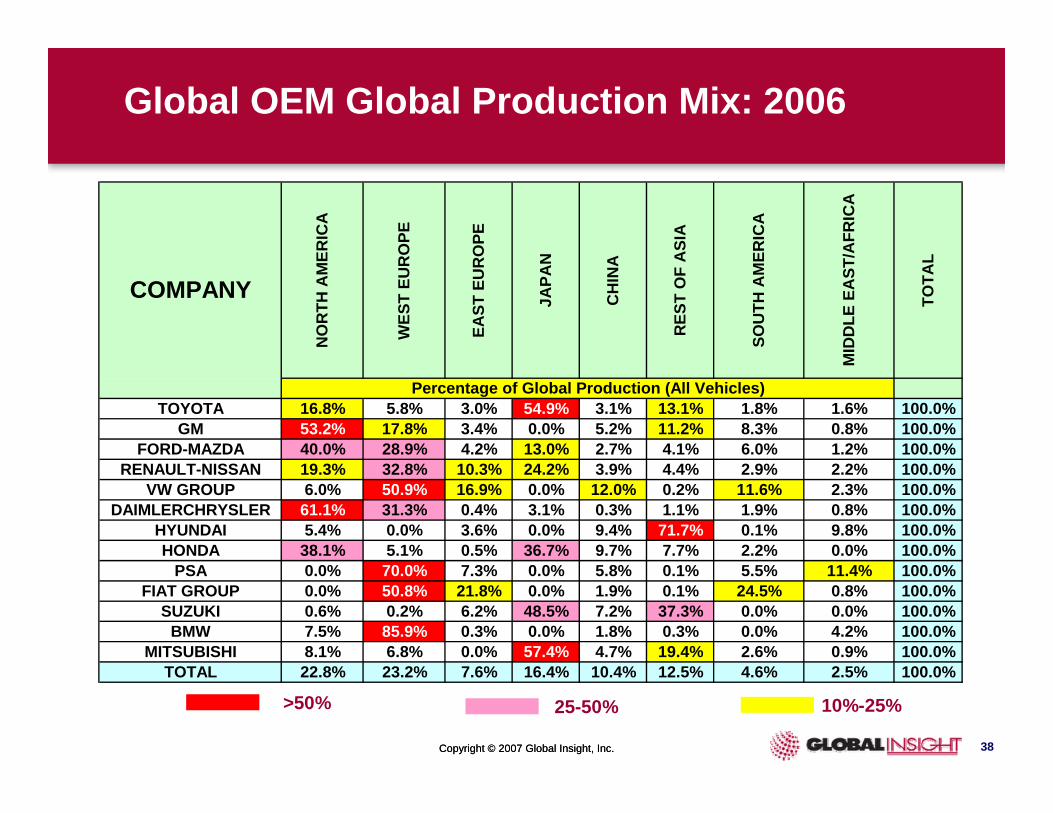
Global OEM Global Production Mix: 2006
>50% 25-50% 10%-25%
NO
RTH
AM
ERIC
A
WES
T EU
RO
PE
EAST
EU
RO
PE
JAPA
N
CH
INA
RES
T O
F A
SIA
SOU
TH A
MER
ICA
MID
DLE
EA
ST/A
FRIC
A
TOTA
L
TOYOTA 16.8% 5.8% 3.0% 54.9% 3.1% 13.1% 1.8% 1.6% 100.0%GM 53.2% 17.8% 3.4% 0.0% 5.2% 11.2% 8.3% 0.8% 100.0%
FORD-MAZDA 40.0% 28.9% 4.2% 13.0% 2.7% 4.1% 6.0% 1.2% 100.0%RENAULT-NISSAN 19.3% 32.8% 10.3% 24.2% 3.9% 4.4% 2.9% 2.2% 100.0%
VW GROUP 6.0% 50.9% 16.9% 0.0% 12.0% 0.2% 11.6% 2.3% 100.0%DAIMLERCHRYSLER 61.1% 31.3% 0.4% 3.1% 0.3% 1.1% 1.9% 0.8% 100.0%
HYUNDAI 5.4% 0.0% 3.6% 0.0% 9.4% 71.7% 0.1% 9.8% 100.0%HONDA 38.1% 5.1% 0.5% 36.7% 9.7% 7.7% 2.2% 0.0% 100.0%
PSA 0.0% 70.0% 7.3% 0.0% 5.8% 0.1% 5.5% 11.4% 100.0%FIAT GROUP 0.0% 50.8% 21.8% 0.0% 1.9% 0.1% 24.5% 0.8% 100.0%
SUZUKI 0.6% 0.2% 6.2% 48.5% 7.2% 37.3% 0.0% 0.0% 100.0%BMW 7.5% 85.9% 0.3% 0.0% 1.8% 0.3% 0.0% 4.2% 100.0%
MITSUBISHI 8.1% 6.8% 0.0% 57.4% 4.7% 19.4% 2.6% 0.9% 100.0%TOTAL 22.8% 23.2% 7.6% 16.4% 10.4% 12.5% 4.6% 2.5% 100.0%
Percentage of Global Production (All Vehicles)
COMPANY

Copyright © 2007 Global Insight, Inc.Copyright © 2007 Global Insight, Inc. 39
Global OEM Global Production Mix: 2012
>50% 25-50% 10%-25%
NO
RTH
AM
ERIC
A
WES
T EU
RO
PE
EAST
EU
RO
PE
JAPA
N
CH
INA
RES
T O
F A
SIA
SOU
TH A
MER
ICA
MID
DLE
EA
ST/A
FRIC
A
TOTA
L
TOYOTA 20.2% 5.8% 2.7% 45.0% 6.7% 15.8% 2.2% 1.5% 100.0%GM 48.6% 16.6% 4.9% 0.0% 7.0% 13.9% 8.4% 0.6% 100.0%
FORD-MAZDA 33.5% 27.8% 5.9% 11.8% 6.6% 7.4% 5.9% 1.2% 100.0%RENAULT-NISSAN 16.0% 26.3% 10.7% 19.4% 5.7% 12.7% 3.6% 5.7% 100.0%
VW GROUP 6.9% 46.5% 17.6% 0.0% 14.9% 2.4% 8.9% 2.9% 100.0%HYUNDAI 7.2% 0.0% 13.5% 0.0% 12.6% 63.1% 0.2% 3.5% 100.0%
DAIMLERCHRYSLER 53.8% 34.0% 0.4% 3.5% 2.7% 1.7% 2.1% 1.7% 100.0%HONDA 38.5% 4.1% 2.0% 30.4% 11.8% 11.1% 2.1% 0.0% 100.0%
PSA 0.0% 61.6% 13.0% 0.8% 9.6% 0.2% 6.2% 8.5% 100.0%FIAT GROUP 0.0% 48.1% 21.5% 0.0% 4.0% 1.6% 22.0% 2.9% 100.0%
SUZUKI 1.4% 0.0% 5.4% 40.7% 9.3% 43.0% 0.0% 0.2% 100.0%BMW 13.0% 79.8% 0.6% 0.0% 3.0% 0.6% 0.0% 3.0% 100.0%TATA 0.0% 0.0% 0.1% 0.0% 0.0% 99.7% 0.1% 0.2% 100.0%
TOTAL 20.0% 20.3% 8.2% 13.6% 15.7% 15.6% 4.2% 2.4% 100.0%
Percentage of Global Production (All Vehicles)
COMPANY
12 JUNE 2007 • OKURA GARDEN HOTEL • SHANGHAI GLOBAL INSIGHT AUTOMOTIVE SEMINAR
Thank You
Ashvin ChotaiDirector, Asian Automotive Industry Research
E-mail: [email protected]