outlook for oil & gas—ramifications for asia from the us ... · pdf fileoutlook for...
TRANSCRIPT

By Dr. Fereidun Fesharaki
Chairman, FACTS Global Energy (FGE)
Australian Institute of Energy National Conference Sydney, Australia
November 19-20, 2012
Outlook for Oil & Gas—Ramifications for Asia from the US Shale Gas Boom

2
Shale Gas Liquids–Game Changer!
• US crude production declined from about 6 mmb/d in 2003 to 5 mmb/d in early 2009, but light crude production associated with shale gas plays has reversed the trend.
• Current liquid production from shale is 700 kb/d with projections to nearly 2 mmb/d by 2015.
0
200
400
600
800
1,000
1,200
1,400
1,600
1,800
2,000
2011 2012 2013 2014 2015
Mississipian Lime Granite Wash WoodfordPermian (Shale) Niobrara Eagle FordBakken
kb/d

3
US Gas Prices Decouple from Oil
• Through the early 2000s, prices of Brent, WTI, and Henry Hub tracked closely on an energy basis.
• Oil prices continued to rise up until 2008 and have since rebounded. • Gas prices continue to decline post-2008 under the weight of additional shale gas
supply.
0%20%40%60%80%
100%120%
Henry Hub Price as % of Brent
0.0
20.0
40.0
60.0
80.0
100.0
120.0Brent vs Henry Hub ($/boe)
Henry Hub Brent WTI

4
East-West Divide in Gas Pricing
• The price of oil-linked Asian LNG imports continues to rise in tandem with crude, even as North American pipeline prices have declined.
• North American gas prices are now about one-fifth the cost of Asian LNG imports. • This opens the potential for US LNG exports to gas-hungry Asian markets, if
government regulations permit.
0.02.04.06.08.0
10.012.014.016.018.0
Henry Hub vs Asian LNG Imports Price ($/mmBtu)
Henry Hub Ave. Asian LNG Import
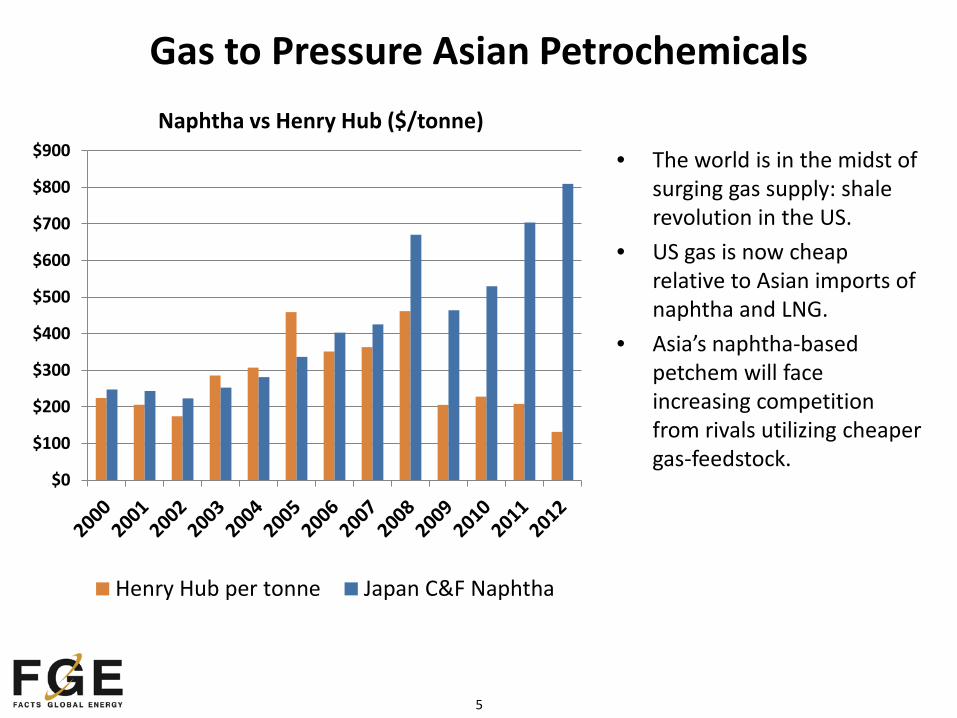
5
Gas to Pressure Asian Petrochemicals
• The world is in the midst of surging gas supply: shale revolution in the US.
• US gas is now cheap relative to Asian imports of naphtha and LNG.
• Asia’s naphtha-based petchem will face increasing competition from rivals utilizing cheaper gas-feedstock.
$0
$100
$200
$300
$400
$500
$600
$700
$800
$900Naphtha vs Henry Hub ($/tonne)
Henry Hub per tonne Japan C&F Naphtha

6
Will Shale Gas Trigger a US Economic Renaissance?
Shale gas is currently 28% of US gas production—projected to be 50% by 2030. • The availability of low priced energy is adding US$1 billion/day to US GDP. • Low priced ethane will spur revival in the US petrochemical industry. • Cheap gas for power generation market giving US manufacturers
advantage. • Refiners advantaged by “sub-international” oil prices (although probably
not to the extent that they currently are). • Shale gas related oil and NGL production (either as associated production
or due to application of drilling techniques) currently around 1.5 mmb/d and could approach 5 mmb/d (oil, condensate, LPG, ethane) by 2020.
Already over 80% of North America’s energy needs are supplied
domestically. This is the highest since 1991.

7
Asia (incl. AU)Proven
Natural Gas Reserves (tcf)
Technically Recoverable Shale
Gas Resources (tcf)
China 107 1,275India 37.9 63Pakistan 29.7 51Australia 110 396**Total 1,785
North AmericaUSA 272.5 482Canada 62 388Mexico 12 681Total 1,551** Recently downgraded by Geoscience Australia
AfricaProven
Natural Gas Reserves (tcf)
Technically Recoverable
Shale Gas Resources (tcf)
South Africa 485Libya 54.7 290Tunisia 2.3 18Algeria 159 231Morocco 0.1 11Western Sahara 7Mauritania 1 0Total 1,042
Non-Conventional Supply: Shale Gas Revolution Continues
EuropeProven
Natural Gas Reserves (tcf)
Technically Recoverable
Shale Gas Resources (tcf)
France 0.2 180Germany 6.2 8Netherlands 49 17Norway 72 83UK 9 20Denmark 2.1 23Sweden 41Poland 5.8 187Turkey 0.2 15Ukraine 39 42Lithuania 4Others* 2.71 19Total 639* Bulgaria, Hungary and Romania.
South AmericaProven
Natural Gas Reserves (tcf)
Technically Recoverable
Shale Gas Resources (tcf)
Venezuela 178.9 11Colombia 4 19Argentina 13.4 774Brazil 12.9 226Chile 3.5 64Uruguay 21Paraguay 62Bolivia 26.5 48Total 1,225
Total Recoverable Resource: 6,242 tcf
1
3
12 Already banned!
6 9
8
10
2
11
7 5
4
Impact on the Asian Gas Market

9
Regional LNG Import Outlook (mmtpa)*
Europe
Middle East
Asia Americas
*Base-case scenario
87 123 152
2015 2020 2030
193 244 313
2015 2020 2030
18 20 19
2015 2020 2030
6 14 30
2015 2020 2030

10
(8.0)
(6.0)
(4.0)
(2.0)
0.0
2.0
4.0
6.0
8.0
10.0
12.0
14.0
16.0
18.0
20.0
22.0
24.0
2006 2007 2008 2009 2010 2011 2012 2013 2014 2015 2020
mm
tpa
Asia Pacific LNG Imports by Country (Year-on-Year Change)
New Markets*
CN+IN
JKT
* Indonesia, Malaysia, Singapore, and Thailand.
New terminals and long-term contracts
startups
Longer-Term Outlook: Who Leads the Growth?
‘Shrinking’ demand
Recovery in LNG demand →↑
Industrial sector gas demand; cost competitiveness;
seasonality drivers
New terminals startups;
domestic gas supply deficits
Nuclear start-up aids in reducing growth

11
0
10
20
30
40
50
60
70
2011 2012 2013 2014 2015 2020 2025 2030
mm
tpa
Singapore Indonesia Malaysia Thailand Others*
*Vietnam, Pakistan, Bangladesh, and Philippines.
New Markets Add Substantially to the Demand Pie
• New Southeast Asian markets of Thailand, Malaysia, Indonesia, and Singapore coupled with potential other new markets could add around 30 mmtpa by the end of this decade.
• Add the Middle East to the picture
and there could be a further 14 mmtpa of demand by 2020.

12
Mozambique - Shanghai (US$2.0/mmBtu)
Australia Under Construction: 62 mmtpa
Planned: 31 mmtpa
New Supplies = Competition
Canada Announced: 44 mmtpa
US Under Construction: 9 mmtpa
Announced: 150 mmtpa**
Key Shipping Assumptions: Ship size: 145,000 cbm (Steam turbine propulsion system). Fuel Oil Price: US$106/bbl BOG: US$15/mmBtu Daily Charter Rate: US$80,000/day. ^Panama canal tariff assumption: US$0.5/mmBtu.
US Gulf of Mexico - Shanghai (US$5.0/mmBtu)
US Gulf of Mexico - Shanghai (US$3.7/mmBtu)^
Canada (West Coast) - Shanghai (US$1.6/mmBtu)
W. Australia - Shanghai (US$1.1/mmBtu)
** Capacity per DOE authorization to FTA countries
US Gulf of Mexico - Shanghai (US$4.8/mmBtu)
Mozambique Announced: 10 mmtpa
13
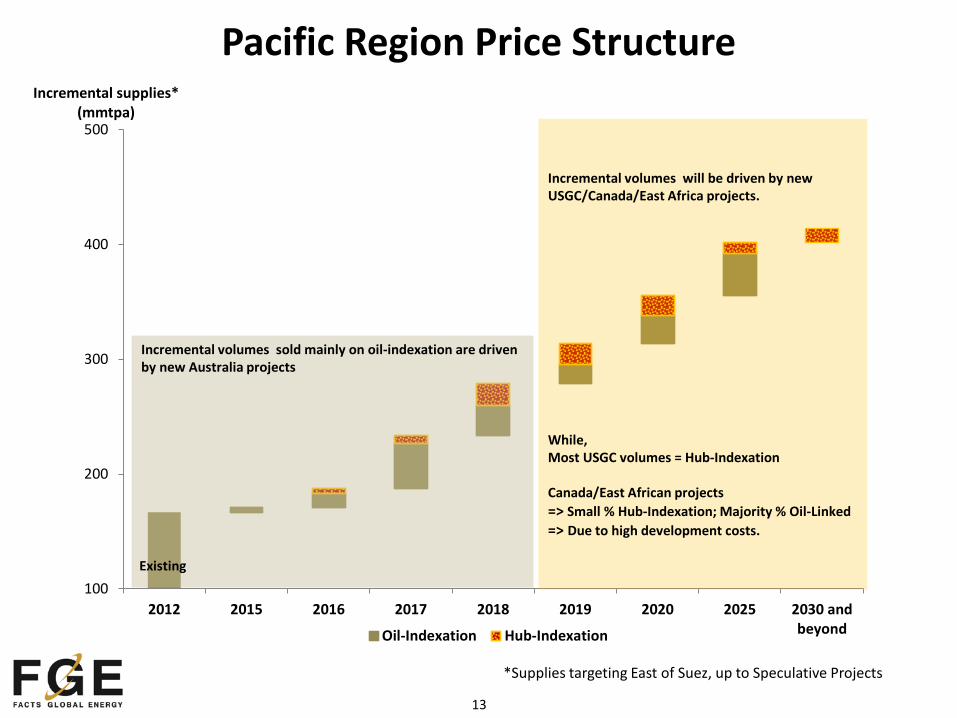
Pacific Region Price Structure
*Supplies targeting East of Suez, up to Speculative Projects
100
200
300
400
500
2012 2015 2016 2017 2018 2019 2020 2025 2030 andbeyond
Incremental supplies* (mmtpa)
Oil-Indexation Hub-Indexation
Incremental volumes sold mainly on oil-indexation are driven by new Australia projects
Incremental volumes will be driven by new USGC/Canada/East Africa projects.
While, Most USGC volumes = Hub-Indexation Canada/East African projects => Small % Hub-Indexation; Majority % Oil-Linked => Due to high development costs.
Existing

14
Hub Pricing vs Oil Indexation • There is no cheap LNG from whichever source we look at. • As such, there is a cost-based floor on the price of LNG. Lower oil prices at the
US$80/bbl range might well mean that the cost of the Hub-based projects and oil-indexed prices are not that different.
• US$10-11/mmBtu or around US$70-80/bbl oil price is the minimum breakeven price for most new LNG projects, whether they are from the US, East Africa, or Australia, whether they are conventional or non-conventional.
• Hub pricing in one way or the other will enter new LNG contracts. We expect many suppliers of US LNG will end up selling at Hub-related prices plus a margin.
• There are blessings in Hub-related pricing for both sellers and buyers. It is not possible to insist that buyers should ignore Hub pricing and only use conventional oil indexation. Buyers simply will not accept this argument.
There is a reasonable middle ground for both sides and deals can be construed to benefit both sides by sharing the risk.
Asian buyers and governments need to design policies to accommodate this floor.

15
Hybrid Pricing—What Buyers Want?
(%*HH) (%*JCC) LNG Price
Minor %
Majority %
• Majority of supplies locked-in for security of supplies + traditional oil indexation.
• Minority of supplies are Hub-related; subjected to price volatility but preferred with term flexibilities?
• Same tranche of volumes but at a basket of oil-indexed and Hub-related pricing?
Contract Volumes (mmtpa)

Impact on the Asian Oil Market

17
-30
-25
-20
-15
-10
-5
0
mm
b/d
Asia Net Crude Imports Rising Fast
• Diversifying sources of supplies, but Asia has to import more from OPEC (especially ME).
• Asian NOCs aggressively acquiring overseas upstream assets. • China spent more than US$50
billion in overseas upstream oil and gas acquisitions in 2009 and 2010 alone;
• India, Korea, and Japan are also aggressive in their overseas acquisitions.
• Establishing a global trading network.

18
What’s Happening: Refining
Australia: Closure of Clyde and Kurnell; growing imports
Myanmar: Privatization program
Japan: METI ordered closures
China: Overbuilding?
Malaysia: 300 kb/d RAPID project
NZ: CCR project
India: More refinery projects are talked about…a wait & see situation
Indonesia: Refining shortfall
Vietnam: 200 kb/d KPC/Idemitsu/PetroVietnam
19
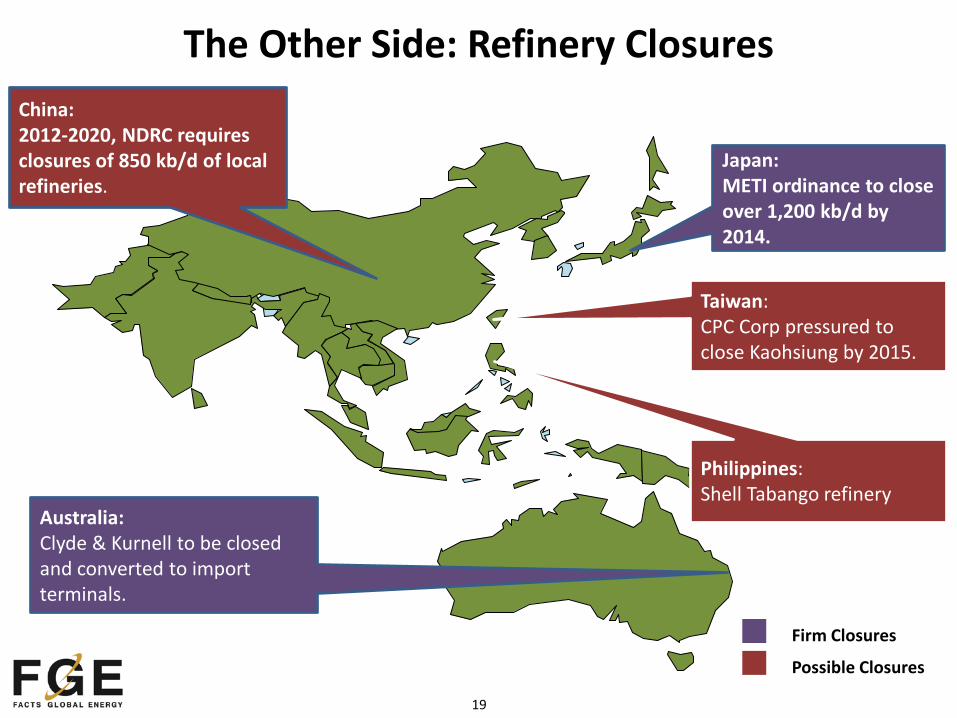
Philippines: Shell Tabango refinery
Taiwan: CPC Corp pressured to close Kaohsiung by 2015.
Australia: Clyde & Kurnell to be closed and converted to import terminals.
Japan: METI ordinance to close over 1,200 kb/d by 2014.
China: 2012-2020, NDRC requires closures of 850 kb/d of local refineries.
Firm Closures
Possible Closures
The Other Side: Refinery Closures

20
($4.00)
($2.00)
$0.00
$2.00
$4.00
$6.00
$8.00
$10.00
$12.00
$14.00
2002
2003
2004
2005
2006
2007
2008
2009
2010
2011
2012
2013
2014
2015
2016
2017
2018
2019
2020
US$
/bbl
HSK
RCC
HDC
Actuals up to 2011. Forecasts in $2012 thereafter
Outlook for Singapore Refining Margins
21
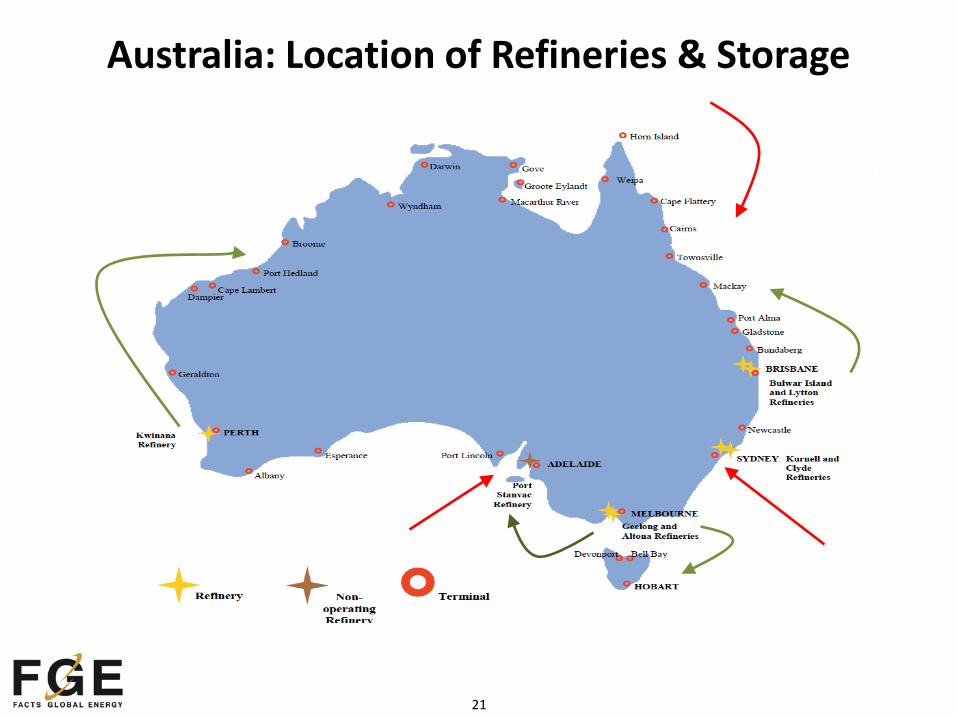
Australia: Location of Refineries & Storage

22
The Economics of Australian Refining
Australian refineries have always been: • Small • Less technically sophisticated • High labor cost • High engineering cost
…but recently: • High working capital cost • Declining domestic crude
availability • Strong Australian dollar • Change in demand requirement
as gasoline is flat and diesel is growing

23
Impact on Caltex of Clyde & Kurnell Closure
• Increased imports into Sydney • Potential change in supply to other refiners
and independents • Potential change in market share of supply • Entry by new players • New storage investment • Greater government scrutiny

24
The Future of Refining Globally
• Exit by IOCs as they focus upstream • Margins decline as ME producers integrate
downstream • Supply security/national pride leads to a
decline in importance of profit objective • Barriers to entry remain: Pricing, political
sensitivity • Market growth will be constrained

25
Asia remains the engine of global growth. 62% of LNG and 94% of oil demand increase to 2020 is East of Suez.
• Domestic supply to major growth countries will be constrained so they will remain heavily committed to imports of LNG and oil.
• Shale gas revolution (and consequent liquids production) outside US is many years delayed.
Australia’s position as a supplier of energy remains pivotal, but competitors are looming.
Conclusions

Thank You
Asian Headquarters: 8 Eu Tong Sen Street, #20-89/90 The Central, Singapore 059818 Tel: (65) 6222-0045 Fax: (65) 6222-0309 [email protected]
Global Offices: Dubai, UAE +971-4439-0451 Beijing, PRC +86 (10) 8480-2701/02 Hawaii, US +1 (808) 944-3637 Perth, Australia +61-402-000-565 Tokyo, Japan [email protected] New York, US [email protected] California, US [email protected]
London – Singapore – Dubai – Beijing – Hawaii – Perth – Tokyo – New York – California
Global Headquarters: 133 Aldersgate Street London, EC1A 4JA United Kingdom Tel: +44 (0) 20 7726 9570 Fax: +44 (0) 20 7785 8161 [email protected]
27
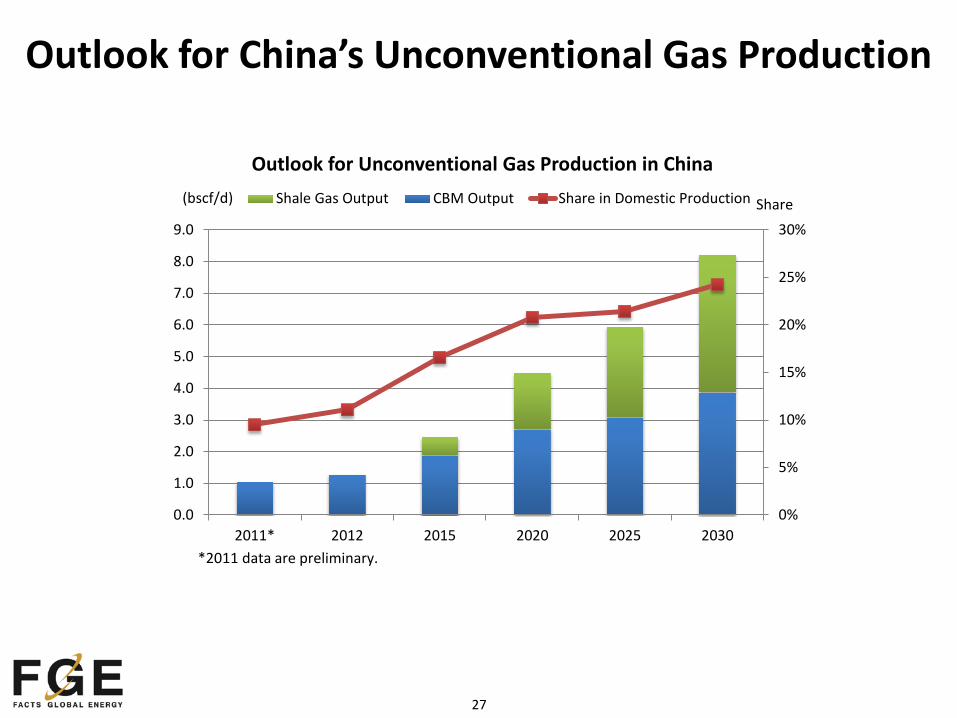
Outlook for China’s Unconventional Gas Production
0%
5%
10%
15%
20%
25%
30%
0.0
1.0
2.0
3.0
4.0
5.0
6.0
7.0
8.0
9.0
2011* 2012 2015 2020 2025 2030
Outlook for Unconventional Gas Production in China Shale Gas Output CBM Output Share in Domestic Production(bscf/d) Share
*2011 data are preliminary.

28
India Shale Gas
• Shale Gas Development Policy expected in March 2013. Government has prepared a draft policy.
• Six basins identified: Cambay, Gondwana, Krishna-Godavari (KG) onshore, Cauvery-onshore, Assam-Arakan, and Indo-Gangetic.
• Recoverable reserves between 6 and 63 tcf.
…but development is likely to be small and delayed.
Source: Geotimes