outlook october 7, 2021 down the road
TRANSCRIPT

MOODY’S ANALYTICS CAPITAL MARKETS RESEARCH / WEEKLY MARKET OUTLOOK 1
Moody’s Analytics and Moody’s Investors Service maintain separate and independent economic forecasts. This publication uses the forecasts of Moody’s Analytics. Moody’s Analytics markets and distributes all Moody’s Capital Markets Research materials. Moody’s Analytics does not provide investment advisory services or products. For further detail, please see the last page.
Kicking the Can Not Too Far Down the Road U.S. Senate leaders have an agreement on a deal that extends the U.S. debt ceiling through early December. Therefore, we’re going to be facing a similar situation in early December where the debt ceiling will likely need to be raised and there will be potential for a partial government shutdown.
It is unimaginable that lawmakers would allow the U.S. to breach the debt ceiling. Odds are rising that Democrats will address the debt limit through reconciliation, a special budget process by which fiscal legislation can pass without the threat of a filibuster. Still, forecasting the U.S. economy is easier than predicting what comes out of Washington DC. Therefore, we created an economic scenario where policymakers actually do fail to raise or suspend the limit before the Treasury runs out of cash and defaults on its obligations; interest rates will spike, with enormous costs to taxpayers, consumers and the economy.
Just how costly this can be is evident from a 1979 episode when the Treasury inadvertently missed payments on Treasury bills maturing that spring. The mishap was caused in part by fallout from a delay in raising the debt limit but also by problems with word processing equipment that the Treasury used at the time to pay investors. Even though investors received their payments with only a small delay, T-bill yields initially jumped by 60 basis points and remained elevated for several months thereafter. The cost to taxpayers was ultimately in the tens of billions of dollars.
President Biden spoke about the debt ceiling on Monday and pushed lawmakers to raise it this week. In response to a question, Biden said he couldn’t guarantee that the U.S.
WEEKLY MARKET OUTLOOK OCTOBER 7, 2021
Lead Authors
Ryan Sweet Senior Director-Economic Research
Asia-Pacific
Katrina Ell Senior Economist
Shahana Mukherjee Economist
Europe
Ross Cioffi Economist
U.S.
Adam Kamins Director
Michael Ferlez Economist
Ryan Kelly Data Specialist
Podcast
Join the Conversation: Apple Podcasts Google Podcasts
Table of Contents
Top of Mind ....................................... 4
Week Ahead in Global Economy .. 6
Geopolitical Risks .............................7
The Long View U.S. ....................................................................... 8 Europe ............................................................... 12 Asia-Pacific ..................................................... 13
Ratings Roundup ............................ 14
Market Data .....................................17
CDS Movers .................................... 18
Issuance ........................................... 20
THIS REPORT WAS REPUBLISHED OCTOBER 7 2021 WITH A CORRECTED REPORT TITLE

MOODY’S ANALYTICS CAPITAL MARKETS RESEARCH / WEEKLY MARKET OUTLOOK 2
won’t breach the debt ceiling. The bond market responded. During the trading session, the yield on a Treasury bill maturing on October 21 rose to 0.12%, 7 basis points higher than bills maturing around it. This is the normal kink in the Treasury bill curve that occurs around the drop-dead date for the debt ceiling.
We have run scenarios through our U.S. macro model to assess the impact on the U.S. economy and financial markets if lawmakers fail to raise the debt ceiling. It is not difficult to craft a very dark scenario if the debt ceiling isn’t raised and there is an impasse for a month.
This economic scenario is cataclysmic. Based on simulations of the Moody’s Analytics model of the U.S. economy, the downturn would be comparable to that suffered during the financial crisis. That means real GDP would decline almost 4% peak to trough, nearly 6 million jobs would be lost, and the unemployment rate would surge to close to 9%. Financial market conditions would tighten significantly, and the corporate bond market would not be immune. Interest rates up and down the credit ladder would jump relative to the baseline. Also, high-yield corporate bond spreads would surge immediately, which would slam the brakes on corporate bond issuance.
It is unlikely that lawmakers risk going down this dark path, but angst in financial markets will re-intensify in late November as attention shifts back to the debt ceiling.
Tracking U.S. supply-chain issues Global supply-chain issues continue to plague the U.S. economy and have contributed to the acceleration in inflation. We don’t have to look far to see clear evidence that supply-chain issues are having economic costs. Vehicle inventories are near record lows, driving prices higher. Consumers have responded with unit vehicle sales plunging recently. After running just shy of 19 million annualized units
in April, sales dropped to around 12 million in September. Anecdotes in the ISM manufacturing survey remain littered with comments about supply-chain issues.
Easing of the supply-chain bottlenecks is key to our near-term forecast for U.S. manufacturing production, inventory replenishing, and easing in inflationary pressures. To better track the amount of stress on U.S. supply chains, we identified a number of high-frequency metrics and combined them to create a U.S. Supply-Chain Stress Index.
The Supply-Chain Stress Index is comprised of 14 supply-side variables, and they fit into three broad categories: production, inventory and transportation. Among the variables in production are manufacturing capacity utilization, ISM manufacturing survey’s supplier deliveries index, and buying policy from the ISM. For inventory, we include the ISM customer inventories index and a number of inventory-to-sales ratios. The I/S ratios help us assess not only how depleted inventories are but also how difficult it is to replenish stockpiles. For the transportation component of the SCSI we included freight shipments, intermodal, traffic job openings in transportation, warehousing, and manufacturing, among other variables. We will update the SCSI monthly.
The SCSI is indexed such that 100 is the average pre-pandemic stress in U.S. supply chains. Therefore, anything north of 100 indicates greater pressure on supply chains and vice-versa. The SCSI suggests there has been little improvement recently. All three components are well above 100. But, not surprisingly, transportation is where the moststress lies followed by production and then inventories.
We tested the relationship between changes in our SCSI and growth in our estimate of real monthly GDP. The correlation over the entire sample is low, at -0.1. This isn’t surprising, as there were not many instances of significant stress in supply

MOODY’S ANALYTICS CAPITAL MARKETS RESEARCH / WEEKLY MARKET OUTLOOK 3
chains between 2009 and mid-2019. One period of stress was in 2015 when 14,000 West Coast longshoremen went on strike, affecting 30 ports. This had some economic costs, but the strike was short. The current supply-chain issues dwarf those in 2015. Therefore, we looked at the correlation between changes in the SCSI and real monthly GDP since the global pandemic intensified toward the end of 2019 and the correlation coefficient is -0.34.
Q3 U.S. GDP tracking keeps sinking The U.S. nominal trade deficit widened more than either we or the consensus expected in August, and that put another dent in our high-frequency GDP model’s estimate of third-quarter GDP growth.
The nominal trade deficit widened from $70.3 billion in July to $73.25 billion. The August trade deficit was the widest since the inception of the data in 1992. Nominal exports were up 0.5% after rising 1.2% in July. Nominal imports increased 1.4% after declining 0.1% previously.
Consumer goods imports rose by $3 billion as a few things are at play, including the current wave of COVID-19 that has
shifted spending away from services and back to goods. Also, domestic retail inventories are extremely lean, requiring additional imports. Separately, the nominal surplus in services fell to $16.2 billion in August, the smallest since late 2011.
The trade deficit remains wide but should narrow through the remainder of this year as consumer spending shifts away from goods and toward services. However, the current wave of the Delta variant of COVID-19 might delay this shift.
The August nominal trade deficit suggests net exports will subtract around 1 percentage point from third-quarter GDP growth. The new data lowered our estimate of third-quarter GDP growth from 3.9% to 2.6% at an annualized rate. Our tracking estimate of third-quarter GDP growth has been dropping steadily. Inventories are going to be the biggest support, and for the first time since we started tracking third-quarter GDP final sales are now seen as declining.
.

MOODY’S ANALYTICS CAPITAL MARKETS RESEARCH / WEEKLY MARKET OUTLOOK 4
TOP OF MIND
The State GDP Data Perspective BY ADAM KAMINS
In the aftermath of the COVID-19 pandemic, the U.S. regional labor market story has largely been written. The Northeast was decimated by severe outbreaks, while tourism hubs and big, expensive cities struggled badly. All of that remains true, but there are some additional details lying underneath the surface. To see this, quarterly state output can be examined. Those figures, released late last week and running through the middle of the year, highlight that not all job losses are created equal. While they do not fundamentally alter the regional narrative, the GDP numbers highlight some under-the-radar regional trends.
Northeast, Midwest silver linings Since the first quarter of 2020, state GDP has risen most rapidly in a handful of states that are hardly viewed as shining stars of the pandemic. Nowhere is this more pronounced than in the Farm Belt, which is home to four of the six fastest-growing states over that period. Iowa led the way, but North Dakota, Nebraska and Indiana are not far behind.
Increased output can be traced in large part to a rapid increase in farm incomes. With corn prices more than doubling this spring before settling in at a level far higher than that of recent years, agriculture-dependent states have reaped the benefits. The rising price environment has driven higher output per farm worker, creating the type of temporary surge in implied productivity that is coloring some state GDP trends. A similar pattern holds in the Northeast, but the reasons are quite different. Despite the devastating economic and public health toll of COVID-19 last spring, the pandemic dented output less than it did nationally across much of the region.
New York and Massachusetts saw unemployment rise sharply, but output experienced one of the 10 smallest declines in the U.S. for each state. And Washington DC fared better than anywhere else, highlighting the more benign impact on cities than indicated in labor market figures. This likely owes to a shift in job composition. As more workers transitioned to temporary remote arrangements, payrolls in highly productive office-using industries held relatively steady, albeit with some jobs being done elsewhere. But consumer industries were not so lucky, as the reduction in daytime population in big cities wreaked havoc with restaurants and retailers. With more high-wage jobs retained, those positions that were lost made a much smaller dent in output than they did in total employment. This has kept states including California, New York and Washington, home to an inordinate share of finance and tech jobs, near the top of the list for the change in output from early 2020 to the middle of this year.
Wage tiers The trends in the Northeast highlight the differential impact of the recession on various types of industries. High-wage positions are closing in on a return to pre-pandemic levels, while the least lucrative jobs are far below and slipping. This reflects the continued uneven impact of the recession, with consumer industry jobs decimated early and white-collar positions holding on. More recently, the trend has been exacerbated by a lack of available workers at restaurants and stores, many of whom are unwilling to stomach a combination of poor pay and elevated risk, keeping low-wage job growth in check.

MOODY’S ANALYTICS CAPITAL MARKETS RESEARCH / WEEKLY MARKET OUTLOOK 5
As a result, the pendulum has tilted even more markedly toward higher-wage workers in states with pronounced early labor market struggles, including New York, Massachusetts and Hawaii. The former two reflect the type of compositional shift associated with reduced daytime populations. Some of this will persist as support positions in lucrative industries migrate to less-expensive locales at an accelerated clip with a physical office location mattering less. The story for Hawaii is a bit different, since pivotal tourism took a major hit. This tilted the economy toward higher-wage jobs, but mostly as a result of weakness elsewhere, mitigating the type of offset seen in the Northeast. The potential downside of a shift toward high-wage industries was especially noticeable in Nevada, the nation’s most hospitality-dependent state. Its job composition became more favorable, but that was no match for a sharp decline in tourism that has only been partially overcome, making it one of the few states for which output remains below its early 2020 levels.
Lack of energy Nevada’s woes make it an exception when it comes to output declines given the common denominator among other states that have yet to return to pre-pandemic heights. Each of those relies heavily on energy extraction, which has faced a uniquely difficult set of challenges since the pandemic began. Back then, steep oil price declines driven by tensions between Russia and Saudi Arabia were rapidly followed by reduced demand as travel ground to a halt. Those are both largely in the past, but the impact on drillers was profound. Active rigs have barely budged from their lows from last year, with producers exhibiting caution in the aftermath of two severe shocks in less than a decade. Reduced production has pushed prices higher of late, but there is little evidence that drilling is resuming at anything resembling its prior pace. This has had especially profound effects on Alaska, Louisiana, Oklahoma and Wyoming.
Texas and North Dakota—the largest oil producers by volume and share of the economy—have fared better. The Lone Star State’s more diverse economy and favorable migration trends have positioned it well. Meanwhile, particularly low drilling costs and high productivity in the Bakken Shale have kept North Dakota moving in the right direction, as has a sizable agriculture presence. More broadly, mining jobs have been hurt not just by market conditions but the nature of the work. Their in-person presence was problematic early, and the infamous boom-bust cycles of the oil market have made the high-wage jobs associated with the energy industry far less stable than those of its white-collar counterparts. More recently, worker shortages may have begun to play a role as well given that the grueling nature of many mining jobs can make them less desirable—albeit more accessible—than high-wage office-using positions. Drilling should begin to approach pre-pandemic levels, but the long-term shift toward renewable sources highlights the variety of risks facing energy states. This could represent a drag on output gains for years to come.
Productivity implications These results have potentially meaningful implications for regional productivity. In short, steep job losses in the Northeast were accompanied by far milder output declines, which by definition suggests a more productive work force. Whether output per worker remains elevated as the economy continues to return to normalcy remains to be seen, but the hope is that increased employment will still provide a jolt to output. On the other hand, for oil-producing states it will be difficult to get output back on track through the volume of new jobs created alone. They will need rising prices to provide a jolt to high-wage hiring, but there is some hope that drillers will begin to incorporate the 2021 uptick into net hiring soon. Still, these findings and any analysis of output and income are colored by massive government support. Stimulus payments and enhanced unemployment insurance have had an equalizing effect, likely contributing to the relative overperformance of states that experienced widespread job losses. With additional fiscal support now lapsed, income and output could take a significant hit everywhere, making the encouraging productivity story a bit less compelling by the time third-quarter output data are released.

MOODY’S ANALYTICS CAPITAL MARKETS RESEARCH / WEEKLY MARKET OUTLOOK 6
The Week Ahead in the Global Economy U.S.
The key U.S. economic data due next week includes the September consumer price index. We also get data on import prices and producer prices. Financial markets will be sensitive to the incoming data on inflation, since there are some concerns that the transitory nature of the recent acceleration in inflation will prove more persistent. Retail sales for September will help us assess the trajectory for consumer spending heading into this quarter. The trajectory for real consumer spending was on an unfavorable trajectory heading into the quarter as unit vehicle sales declined in September. The trajectory for consumer spending is important in normal times, but these are not normal times. It will take a strong start to the fourth quarter for real consumer spending to come anywhere close to our forecast for around a 7% annualized gain. The mini reopening of the economy following the latest wave of COVID-19 would help, particularly for spending on consumer services. Earlier-than-normal holiday shopping will wreak havoc with the seasonal adjustment process. After seasonal adjustment, October and November retail sales could be very strong, but December would be a big dud. On the policy front, the minutes from the September Federal Open Market Committee meeting will be released. Europe
U.K. GDP is expected to have picked up again in August after slowing in July. GDP likely rose 0.6% m/m in August after growing just 0.1% in the month prior. The emergence of the Delta variant of COVID-19 struck spending on services during the month. While supply-side issues likely continued to hold back goods production in August, we expect consumer spending picked up again as the Delta outbreak remained under control. As a result, the labor market was likely stable in the August stanza with the unemployment rate unchanged at 4.6% from the preceding May quarter.
Industrial production in the euro zone likely contracted 0.8% m/m in August. Although industrial production plunged in Germany during the month, this was likely mitigated by growing output in other countries around the bloc, such as France, and we expect Italy’s industrial production to rise 0.3% during the month.
Final estimates of national CPIs will be released next week as well. We expect no change from the preliminary estimates, so Spain’s CPI was likely up 4% y/y in September, Frances likely grew 2.1%, Italy’s 2.6%, and Germany’s 4.1%.
Finally, the euro zone and Russia’s trade surpluses likely increased in August. The euro zone’s nonseasonally adjusted trade balance likely rose to $16.9 billion in August from $13.9 billion a year earlier. Russia’s was likely up to $25.7 billion from $23.2 billion. Russia’s exports were likely supported by growing demand for natural gas and oil. In both the euro zone and Russia.
Asia-Pacific
Singapore’s September quarter GDP will be the highlight on the economic calendar. We expect Singapore’s economy to have grown 1.3% in quarterly terms following a 1.8% contraction in the June quarter. Singapore suffered a quarterly contraction as a resurgence of COVID-19 cases triggered tighter distancing restrictions and weighed on the domestic demand revival. A relatively strong net trade position is expected to have supported the third-quarter turnaround, but domestic consumption is likely to see only a moderate pickup from the last quarter.
China’s annual inflation rate is likely to have remained stable at 0.8% in September, while China’s producer price growth is likely to have inched up to 9.7% in September from 9.5% in August, reflecting some strain from the power shortage and resulting local disruptions. Australia’s unemployment rate is likely to have risen to 5% in September from 4.5% in August, reflecting a sharper hit to employment from extended large-scale closures across New South Wales and Victoria.

MOODY’S ANALYTICS CAPITAL MARKETS RESEARCH / WEEKLY MARKET OUTLOOK 7
Geopolitical Calendar
Date Country EventEconomic Importance
Financial Market Risk
Oct ASEAN ASEAN summit Low Low
31-Oct Japan General elections Low Low
Nov Asia-Pacific Asia-Pacific Economic Cooperation forum Medium Low
Nov China Sixth plenary session of the Central Committee Medium Low
Nov G-20 G-20 Summit Medium Low
7-Nov Nicaragua Presidential, congressional elections Low Low
14-Nov Argentina Legislative elections Medium Low
21-Nov Chile Presidential elections Medium Low
28-Nov Honduras Presidential, congressional and municipal elections Low Low
19-Dec Hong Kong Legislative Council elections Low Medium
10-Apr-22 France General elections Medium Medium
29-May-22 Colombia Presidential elections High Low
2-Oct-22 Brazil Presidential and congressional elections High Medium
Oct/Nov-22 China National Party Congress High Medium

MOODY’S ANALYTICS CAPITAL MARKETS RESEARCH / WEEKLY MARKET OUTLOOK 8
THE LONG VIEW: U.S.
Lawmakers Won’t Allow a Debt-Limit Breach BY RYAN SWEET
CREDIT SPREADS Moody's long-term average corporate bond spread is 97 basis points, 2 bp tighter than this time last week. This is below its high over the past 12 months of 132 bps and just above its lowest over the past year of 95 bps. This spread may be no wider than 117 bps by year-end 2021, and some of the recent tightening is attributable to financial markets settling down after China’s corporate debt concerns and the U.S. debt ceiling rattled investor sentiment. The long-term average industrial corporate bond spread narrowed 1 bp over the past week to 88 bps. This is a hair above the low of 86 over the past 12 months and well below the high of 122 bps.
The long-term investment grade corporate bond spread was 129 basis points, compared with 130 bps last week. It remains well below its recent high of 169 bps. Investment-grade industrial corporate bond spreads narrowed from 133 bps to 132 bps.
The recent ICE BofA U.S. high-yield option adjusted bond spread of 329 basis points is 20 bps wider than at this point last week. The high-yield option adjusted bond spread approximates what is suggested by the accompanying long-term Baa industrial company bond yield spread and is tighter than that implied by a VIX of 19.65.
Defaults Not only is issuance strong, but defaults remain very low. The latest Moody’s monthly default report showed the trailing 12-month global speculative-grade default rate at 3% at the end of August. That is its lowest level since the end of February 2020, when it stood at 3.3% just before the start of the COVID-19 pandemic. August was the eighth consecutive month to register a decline in the default rate since it hit a cyclical peak of 6.8% in December 2020.
According to our Credit Transition Model, the global default rate will fall from the current rate of 3% to 1.6% by the end of December. After that, it will stabilize in the 1.5% to 1.7% range in the first half of 2022 before edging up to 1.9% by the end of August 2022. These forecasts incorporate our assumptions that the U.S. high-yield spread will gradually widen from about 300 basis points currently to 505 basis points over the course of the next
12 months. This will be offset by an improvement in the unemployment rate.
U.S. Corporate Bond Issuance First-quarter 2020’s worldwide offerings of corporate bonds revealed annual advances of 14% for IG and 19% for high-yield, wherein US$-denominated offerings increased 45% for IG and grew 12% for high yield.
Second-quarter 2020’s worldwide offerings of corporate bonds revealed annual surges of 69% for IG and 32% for high-yield, wherein US$-denominated offerings increased 142% for IG and grew 45% for high yield.
Third-quarter 2020’s worldwide offerings of corporate bonds revealed an annual decline of 6% for IG and an annual advance of 44% for high-yield, wherein US$-denominated offerings increased 12% for IG and soared upward 56% for high yield.
Fourth-quarter 2020’s worldwide offerings of corporate bonds revealed an annual decline of 3% for IG and an annual advance of 8% for high-yield, wherein US$-denominated offerings increased 16% for IG and 11% for high yield.
First-quarter 2021’s worldwide offerings of corporate bonds revealed an annual decline of 4% for IG and an annual advance of 57% for high-yield, wherein US$-denominated offerings sank 9% for IG and advanced 64% for high yield.
Issuance weakened in the second quarter of 2021 as worldwide offerings of corporate bonds revealed a year-over-year decline of 35% for investment grade. High-yield issuance faired noticeably better in the second quarter.
U.S. dollar denominated investment-grade issuance was $22.8 billion in the week ended Wednesday, bringing the year-to-date total to $1.315 trillion. High-yield corporate

MOODY’S ANALYTICS CAPITAL MARKETS RESEARCH / WEEKLY MARKET OUTLOOK 9
bond issuance rose $18.1 billion, bringing the year-to-date total to $534 billion.
U.S. ECONOMIC OUTLOOK Because of Democratic divisions over President Biden's Build Back Better agenda, we reduced the price tag of an assumed reconciliation package that funds a range of social investments from $3 trillion in the August forecast to $2.5 trillion in the September vintage. Specifically, we nixed $500 billion in federal support of private industry, which included funding for manufacturing supply chains, R&D investments, and small-business support, among others. Our prior assumptions regarding investments in education, family leave, housing, and climate change initiatives, as well as household tax credits, are unchanged from August. The new baseline forecast assumes that all but $500 billion of the reconciliation package will be paid for by higher taxes on corporations and high-income individuals. We did not make changes to our assumptions around the Infrastructure Investment and Jobs Act.
The baseline forecast assumes the debt ceiling is raised but the drop-dead date could be in October, rather than November. The bond market is showing a little angst about the debt ceiling. This isn’t surprising, but it’s important to note that the amount of concern is small because the bond market has been through numerous debt-ceiling episodes and knows how it will play out—it will ultimately be raised. Currently, all Treasury bills from late October to November, which is likely the drop-dead date for raising the debt ceiling, are trading a touch cheaper than other Treasury bills. This is similar to what happened leading up to prior debt-ceiling drop-dead dates.
COVID-19 assumptions We adjusted our epidemiological assumptions to anticipate that total confirmed COVID-19 cases in the U.S. will be 47.9 million, compared with 41.1 million in the August baseline. The change is due to the recent increase in confirmed cases because of the Delta variant. The seven-day moving average of daily confirmed cases dropped recently but that is likely due to the Labor Day holiday, which reduced testing and reporting. Despite the recent drop, the seven-day moving average of confirmed COVID-19 cases remains well above 100,000.
The date for abatement of the pandemic has been pushed out to this November because of the Delta variant. Herd resiliency, which is a 65%-or-greater share
of the adult population being fully vaccinated or previously infected, was achieved on August 30, a few days earlier than the assumption of September 2 in the August baseline. Also, COVID-19 will be endemic and seasonal.
The economy is feeling the effects of the current wave of COVID-19 cases. Consumer sentiment dropped sharply in August and a number of high-frequency measures of economic activity we closely track have all weakened, including number of people passing through TSA checkpoints, seated diners from OpenTable, movie box-office revenues, and Google mobility.
We expect the variant to start fading soon, much like it has in the U.K., which seems to be leading the U.S. by a few weeks, and thus not affect the economy to an extent that we will need to downgrade our economic outlook.
Delta hits GDP There were some changes to our forecast for GDP growth through the remainder of this year. We cut our forecast for third-quarter GDP growth from 8.2% at an annualized rate in the August baseline to 5% in the September vintage. Risks are weighted to the downside. Our high-frequency GDP model’s tracking estimate of third-quarter GDP growth has been sinking like a rock lately. It also reflects only one piece of source data for August, which would capture the impact of the recent surge in COVID-19 cases. Though we don’t expect that this wave of coronavirus will have significant economic costs, there is a lot less cushion now.
August vehicle sales delivered a big hit to our estimate of third-quarter GDP. Vehicle sales fell from 14.62 million to 13.06 million annualized units in August and are 16.6% below their second-quarter average. This bodes ill for real consumer spending in the third quarter. Our high-frequency GDP model has third-quarter GDP growth tracking at 3.9% at an annualized rate, less than the official forecast. The model anticipates inventories doing the bulk of the heavy lifting this quarter, and the Delta variant is causing supply-chain issues, which could slow the rebuilding of stockpiles. Also, Hurricane Ida is another potential issue for inventory rebuilding and trade. U.S. soybean exports plunged last week, and though they account for a small share of total exports, this highlights the hurricane’s downstream effects.
The September baseline includes our assumptions about Hurricane Ida’s economic costs. Though Ida was a severe hurricane and devastated some regional economies, it
MOODY’S ANALYTICS CAPITAL MARKETS RESEARCH / WEEKLY MARKET OUTLOOK 10
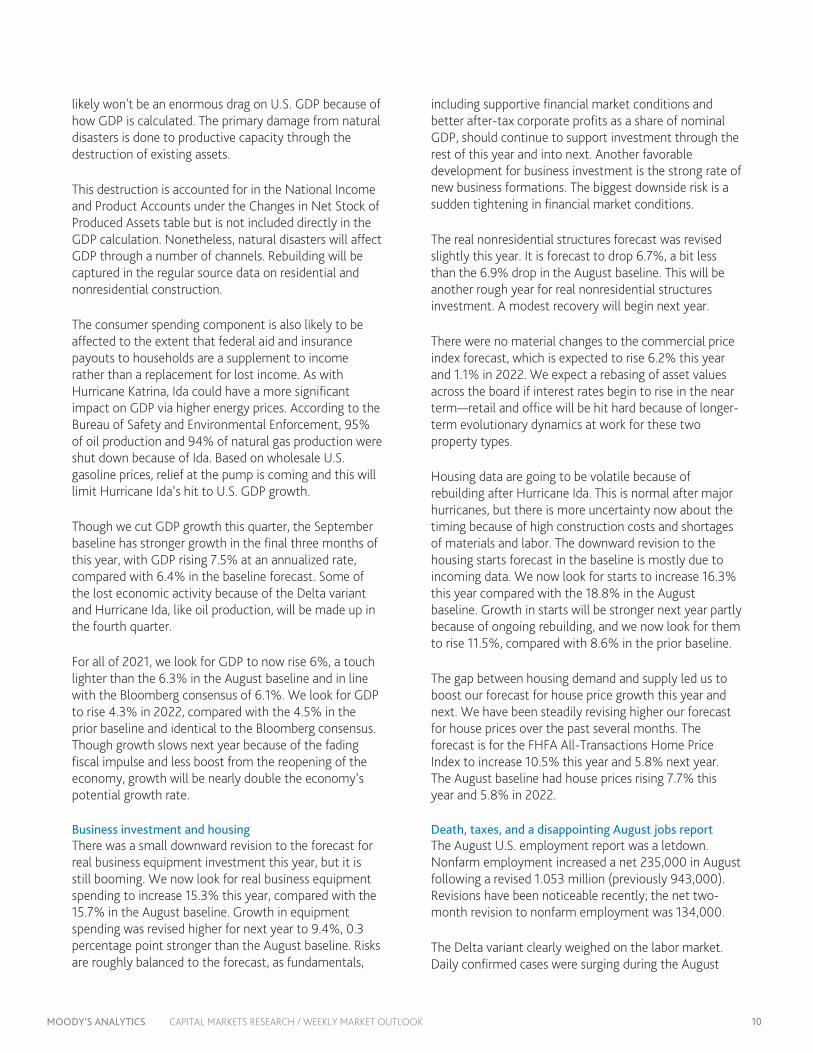
likely won't be an enormous drag on U.S. GDP because of how GDP is calculated. The primary damage from natural disasters is done to productive capacity through the destruction of existing assets.
This destruction is accounted for in the National Income and Product Accounts under the Changes in Net Stock of Produced Assets table but is not included directly in the GDP calculation. Nonetheless, natural disasters will affect GDP through a number of channels. Rebuilding will be captured in the regular source data on residential and nonresidential construction.
The consumer spending component is also likely to be affected to the extent that federal aid and insurance payouts to households are a supplement to income rather than a replacement for lost income. As with Hurricane Katrina, Ida could have a more significant impact on GDP via higher energy prices. According to the Bureau of Safety and Environmental Enforcement, 95% of oil production and 94% of natural gas production were shut down because of Ida. Based on wholesale U.S. gasoline prices, relief at the pump is coming and this will limit Hurricane Ida’s hit to U.S. GDP growth.
Though we cut GDP growth this quarter, the September baseline has stronger growth in the final three months of this year, with GDP rising 7.5% at an annualized rate, compared with 6.4% in the baseline forecast. Some of the lost economic activity because of the Delta variant and Hurricane Ida, like oil production, will be made up in the fourth quarter.
For all of 2021, we look for GDP to now rise 6%, a touch lighter than the 6.3% in the August baseline and in line with the Bloomberg consensus of 6.1%. We look for GDP to rise 4.3% in 2022, compared with the 4.5% in the prior baseline and identical to the Bloomberg consensus. Though growth slows next year because of the fading fiscal impulse and less boost from the reopening of the economy, growth will be nearly double the economy’s potential growth rate.
Business investment and housing There was a small downward revision to the forecast for real business equipment investment this year, but it is still booming. We now look for real business equipment spending to increase 15.3% this year, compared with the 15.7% in the August baseline. Growth in equipment spending was revised higher for next year to 9.4%, 0.3 percentage point stronger than the August baseline. Risks are roughly balanced to the forecast, as fundamentals,
including supportive financial market conditions and better after-tax corporate profits as a share of nominal GDP, should continue to support investment through the rest of this year and into next. Another favorable development for business investment is the strong rate of new business formations. The biggest downside risk is a sudden tightening in financial market conditions.
The real nonresidential structures forecast was revised slightly this year. It is forecast to drop 6.7%, a bit less than the 6.9% drop in the August baseline. This will be another rough year for real nonresidential structures investment. A modest recovery will begin next year.
There were no material changes to the commercial price index forecast, which is expected to rise 6.2% this year and 1.1% in 2022. We expect a rebasing of asset values across the board if interest rates begin to rise in the near term—retail and office will be hit hard because of longer-term evolutionary dynamics at work for these two property types.
Housing data are going to be volatile because of rebuilding after Hurricane Ida. This is normal after major hurricanes, but there is more uncertainty now about the timing because of high construction costs and shortages of materials and labor. The downward revision to the housing starts forecast in the baseline is mostly due to incoming data. We now look for starts to increase 16.3% this year compared with the 18.8% in the August baseline. Growth in starts will be stronger next year partly because of ongoing rebuilding, and we now look for them to rise 11.5%, compared with 8.6% in the prior baseline.
The gap between housing demand and supply led us to boost our forecast for house price growth this year and next. We have been steadily revising higher our forecast for house prices over the past several months. The forecast is for the FHFA All-Transactions Home Price Index to increase 10.5% this year and 5.8% next year. The August baseline had house prices rising 7.7% this year and 5.8% in 2022.
Death, taxes, and a disappointing August jobs report The August U.S. employment report was a letdown. Nonfarm employment increased a net 235,000 in August following a revised 1.053 million (previously 943,000). Revisions have been noticeable recently; the net two-month revision to nonfarm employment was 134,000.
The Delta variant clearly weighed on the labor market. Daily confirmed cases were surging during the August

MOODY’S ANALYTICS CAPITAL MARKETS RESEARCH / WEEKLY MARKET OUTLOOK 11
payroll reference week. According to the Bureau of Labor Statistics, 5.6 million people reported being unable to work because their employer closed or lost business due to the pandemic—that is, they did not work at all or worked fewer hours at some point in the prior four weeks due to the pandemic. Among these individuals, 13.9% received some pay from their employer for the hours not worked, up from 9.1% in July. Similar to July, there were 1.5 million individuals not in the labor force that were unable to look for work because of the pandemic.
There is a clear downward bias in August employment. The month’s job growth normally comes in weaker than the consensus, and we don’t see a reason why the pandemic would have altered this. The August bias is noticeable. Over the past five years, the initial estimate of August job growth has been revised higher by an average of 75,000 jobs between the initial and third estimates. Low response rates to the preliminary survey are the primary culprit behind the tendency for August job growth to come in weaker than the consensus. This struck again. The response rate for this August was 70.5%, compared with the 76.8% last August and the 75% average over the past prior five years.
The September baseline incorporates the August employment report. We anticipate some payback in subsequent months and average monthly job growth this year is forecast to average 543,000, compared with the 532,000 in the August baseline forecast. Odds are that August’s job growth is revised higher.
The unemployment rate is forecast to average 4.5% in the fourth quarter, compared with the 4.6% in the prior baseline. The unemployment rate was revised lower for next year and is now expected to average 3.4% in the fourth quarter of 2022. Risks to the labor market forecast are weighted to the downside. The Delta variant could delay the return to the labor force for many because of childcare and health concerns. Lack of labor supply is the biggest problem; businesses had 10.9 million open positions at the end of July. Still, we expect the economy to hit full employment by the end of 2022 or early 2023.
Inflation and the Fed New historical data and the Delta variant led us to revise higher our forecast for the core PCE deflator. It is now expected to rise 3.9% on a year-ago basis in the fourth quarter of this year, compared with 3.5% in the August baseline. We look for inflation to moderate next year, with the core PCE deflator up 2.2% on a year-ago basis in
the fourth quarter of 2022, only 0.1 of a percentage point higher than in the prior baseline.
We altered our assumptions about when the Fed begins tapering its $120 billion in monthly asset purchases. We now expect the Fed to start tapering in December by cutting its asset purchases by $15 billion, to $105 billion. The August baseline had tapering beginning in January 2022, so the change is fairly minor. We expect this process to be on autopilot and the assumption is for a $15 billion reduction at each Federal Open Market Committee meeting, which would wrap it up before the end of next year. The Fed will then reinvest the proceeds from its maturing assets to ensure the balance sheet doesn’t decline. We still assume the first rate hike in early 2023. The fed funds rate reaches its equilibrium rate, a touch above 2.5%, in the second half of 2025. Markets are pricing in a noticeably more gradual tightening cycle than our baseline.Tapering won’t impact inflation. Though it won’t be disinflationary, tapering could help keep market-based measures of inflation expectations anchored, since tapering is preamble to the Fed tighten monetary policy by allowing its balance sheet to decline and/or by increasing the target range for the fed funds rate.
Inflation expectations are also important in the future path of inflation. The Fed is keeping close tabs on various measures of inflation expectations, which appear to be anchored. The five-year, five-year forward inflation expectation rate is currently around 2.2%. This is based on the consumer price index, and if we adjust this for the tendency for the CPI to run ahead of the PCE deflator—the Fed’s preferred measure of inflation—investors are expecting inflation to be on the Fed’s target. One caveat is that the Fed could be distorting this a little, since the five-year, five-year forward inflation expectation rate incorporates Treasury Inflation-Protected Securities, and the Fed holds 2% of the TIPS market. As the Fed begins to taper, TIPS yields might climb. We didn’t make any significant changes to the 10-year Treasury yield forecast. A bottom could be forming in long-term rates with the current yield below our estimate of the economic fair value of 1.58%. Also, seasonals favor an increase in the 10-year Treasury yield in September. On average, over the past several years, Treasury returns have declined in September. Further, the 10-year Treasury yield has risen in four of the last five Septembers. We don’t anticipate a jump in interest rates this fall, but odds are rates will rise rather than continuing to drop.

MOODY’S ANALYTICS CAPITAL MARKETS RESEARCH / WEEKLY MARKET OUTLOOK 12
THE LONG VIEW: EUROPE
German Industrial Production Falls BY ROSS CIOFFI
German industrial production tumbled in August, dropping by 4% m/m and marking the sharpest month-on-month decline since the depths of the pandemic last year. Supply-chain disruptions hit especially hard in transportation equipment manufacturing, which saw production plunge by 15.7% m/m. Unfortunately, evidence points to supply chains remaining hard pressed well into 2022. Meanwhile, August’s sharper-than-expected decrease will ding our estimate for third-quarter GDP.
However, not all countries saw output decline in August. Denmark, Ireland and Norway also posted industrial production releases on Thursday. Ireland’s output tumbled by 2.8% m/m, but Denmark’s was up 3.5% and Norway’s grew by 2.7%. In Ireland, food production recoiled after strong growth in the previous month, and a steep decline in the manufacture of transport equipment, undoubtedly related to global supply shortages, dragged down the headline. In Denmark, a surge in pharmaceutical production lifted the headline figure, while in Norway, extraction of crude and natural gas saved the day.
U.K. house prices jump According to the Halifax House Price Index, house prices in the U.K. jumped by 1.7% m/m in September, adding to a 0.8% increase in August. This was the fastest month-on-month increase in more than a decade, and it brought the index 7.4% above where it was a year earlier. Low borrowing costs are supporting demand for new housing, but we suspect demand may have spiked in September as the country’s stamp-duty tax holiday came to an end. As taxes normalize, housing demand will moderate from highs of recent months. House prices will rise at a slower rate, but favorable financing conditions will prevent a steep drawback in prices.
Swiss labor market continues to improve Swiss unemployment fell for the third consecutive month. The unemployment rate fell to 2.8% in September from 2.9% in August. Despite the improvement, unemployment rates remain above precrisis levels, suggesting the economy has yet to fully recover from the damage inflicted by COVID-19. Going into the fourth quarter, we expect unemployment will continue to inch downwards but won’t return to precrisis levels until next year.
Euro zone retail sees slight gains Euro zone retail sales excluding motor vehicles rose by 0.3% in August after a downwardly revised drop of 2.6% m/m in July. Sales of food, drinks and tobacco slumped by 1.7%, but this was outweighed by a 1.8% increase in nonfood sales. Consumer behavior has been volatile in the past months, clearly correlated with the progress of the pandemic in the member states.
That said, consumer fundamentals are broadly on a positive trend. The euro zone’s business and consumer sentiment remained virtually flat at 117.8 in September from 117.6 in August. The unemployment rate, meanwhile, has been trending downward, standing at 7.5% in August, the same value as before the start of the pandemic. However, national policies are still responsible for holding down unemployment rates, and the unemployment rate decreased in August due to a shrinking labor force rather than a significant increase in employment.
Despite the caveats, consumer fundamentals point to continued spending. Whether households spend on retail goods or services, they will support third-quarter growth. Spending will slow in the fourth quarter, but this will not jeopardize the overall recovery.
Spain’s industrial output contracts Meanwhile, Spain’s industrial production contracted by 0.3% m/m in August, the third consecutive negative reading since June. Although the monthly drop was smaller relative to previous months, it hints that monthly output is being hampered by worldwide supply-chain bottlenecks. In year-ago terms, production increased by 1.8%, following the 3.4% gain in July. However, the yearly growth rate paints an incomplete picture given that production was still regaining its footing last summer following the lockdown measures implemented to contain the pandemic outbreak in 2020.
German factory orders drop Finally, Germany’s factory orders dropped 7.7% m/m in August after increasing by 3.4% in July. The decline comes after months of solid order growth, and according to a recent Federal Statistics Office report, factories still have months of backlogs to work through.

MOODY’S ANALYTICS CAPITAL MARKETS RESEARCH / WEEKLY MARKET OUTLOOK 13
THE LONG VIEW: ASIA-PACIFIC
RBA Anticipates Quarterly Contraction BY KATRINA ELL and SHAHANA MUKHERJEE
The Reserve Bank of Australia kept all monetary settings steady in its October announcement, as anticipated. The cash rate was held at its record-low of 0.1%, and the parameters of the asset purchase program were left unchanged from September. Government securities will therefore continue to be purchased weekly at the rate of A$4 billion until at least mid-February, and the target was maintained at 10 basis points for the April 2024 Australian Government bond. In addition, the RBA maintained that the September quarter will have seen a decent contraction. The Moody’s Analytics preliminary estimate is for a 1.5% quarterly contraction in the third stanza. The central bank also kept its stance that there is heightened uncertainty about the path of the recovery that temporarily paused with the extended lockdowns in New South Wales and Victoria states, which combined account for around half of the economy. Our base case is that the recovery will be much more subdued than the strong bounceback observed in 2020 after Australia emerged from its first lockdown. New South Wales and Victoria are slated to reopen later in October, but gradually. As a result, the improvement in household consumption and more broadly domestic demand will also be more measured. Australia is learning to live with COVID-19, and this new world will have bumps that will inevitably dent the economy along the way. An important change in the October monetary policy statement compared with September was the wording around the housing market. The RBA has long maintained that its focus is on watching that sound lending standards are maintained. But this month the RBA acknowledged for the first time in a monetary policy statement that the Council of Financial Regulators (comprised of the Australian Prudential Regulation Authority, the RBA, the Australian Securities & Investments Commission, and the Treasury) have been monitoring housing market trends closely.
Australia’s residential property market has thrived in the ultra-low borrowing cost environment, sending average house prices soaring by 18% to 20% in sought-after markets such as Sydney and Melbourne, raising concerns about the sustainability of the price boom, but more importantly, the longer term implications for the country’s burgeoning household debt (at nearly 181% of disposable income). The significant growth has prompted APRA to intervene.
The prudential regulator has increased the minimum interest rate buffer that banks should use when assessing new home loan applications. Going forward, the interest rate needs to be at least 3 percentage points above the home loan rate. Previously the buffer was 2.5 percentage points. APRA expects this new rule will reduce the maximum mortgage for an average borrower by approximately 5%. The absolute change is not considerably large, but it is a clear signal to the market that more aggressive changes will be coming if lending standards do not improve. Australian household debt is amongst the highest in the developed world. Other nations with similarly lofty household debt such as South Korea and New Zealand have already acted via macroprudential tools recently, demonstrating Australia isn't alone with this issue. South Korea ultimately hiked interest rates to rein in debt growth, as it didn't get the transmission mechanism right to deal with the leverage problem.
Looking ahead, while monetary settings are forecast to stay conducive to growth through 2022, the coming months may see APRA take steps to tighten prerequisites or limits for home loans (conditional on borrowers’ debt serviceability) and eventually moderate house price growth.

MOODY’S ANALYTICS CAPITAL MARKETS RESEARCH / WEEKLY MARKET OUTLOOK 14
RATINGS ROUND-UP
U.S. Changes Overwhelmingly Positive BY MICHAEL FERLEZ
U.S. rating change activity was overwhelming positive in the latest period, with upgrades accounting for majority of rating actions and affected debt. U.S. rating activity has held strong this year , with upgrades well outpacing downgrades. Although rating change activity continues to be concentrated among speculative-grade companies, Texas Instruments Inc. and Bunge Limited, both investment-grade firms, saw their ratings upgraded last week. Texas Instruments was the largest upgrade in terms of affected debt. The U.S. semiconductor company saw its senior unsecured rating rise to Aa3 from A1, affecting $7.8 billion in debt. Moody’s Investors Service cited governance considerations in its credit rating upgrade, noting the company’s "improving product mix (more higher margin industrial and auto revenue) and ongoing cost efficiencies from producing more chips on larger 300-millimeter wafers” that helped to expand TI's adjusted gross margins to about 66% from 50% ten years ago.
Europe Western European rating changes were mixed last week. Although upgrades accounted for over 80% of total rating changes, they represented just 20% of the affected debt. Geographically, Austria led all countries with seven rating changes. All seven involved banks and member institutions of the Raiffeisen Banking Group. The largest upgrade in terms of affected debt was made to Raiffeisen Bank International AG, which saw its long-term senior unsecured debt and deposit ratings rise to A2 from A3 among other upgrades. In its rating action, Moody’s Investors Service cited an improved assessment of the joint financial strength of the Austrian RBG for the numerous upgrades. For RBI, Moody’s Investors Services specifically cited a number of reasons, including its expectation of stable capitalization and improving profitability in upgrading BCA’s as well as the bank’s solid and balanced liquidity and funding profile. The largest downgrade for the week was made to DZ Bank AG and several of its subsidiaries. The downgrade affected $61 billion in debt.

MOODY’S ANALYTICS CAPITAL MARKETS RESEARCH / WEEKLY MARKET OUTLOOK 15
RATINGS ROUND-UP
0.0
0.2
0.4
0.6
0.8
1.0
0.0
0.2
0.4
0.6
0.8
1.0
Apr01 Aug04 Dec07 Apr11 Aug14 Dec17 Apr21
FIGURE 1Rating Changes - US Corporate & Financial Institutions: Favorable as a % of Total Actions
By Count of Actions By Amount of Debt Affected
* Trailing 3-month average
Source: Moody's
FIGURE 2
BCF Bank Credit Facility Rating MM Money-MarketCFR Corporate Family Rating MTN MTN Program RatingCP Commercial Paper Rating Notes NotesFSR Bank Financial Strength Rating PDR Probability of Default RatingIFS Insurance Financial Strength Rating PS Preferred Stock RatingIR Issuer Rating SGLR Speculative-Grade Liquidity Rating
JrSub Junior Subordinated Rating SLTD Short- and Long-Term Deposit RatingLGD Loss Given Default Rating SrSec Senior Secured Rating LTCF Long-Term Corporate Family Rating SrUnsec Senior Unsecured Rating LTD Long-Term Deposit Rating SrSub Senior SubordinatedLTIR Long-Term Issuer Rating STD Short-Term Deposit Rating
Rating Key

MOODY’S ANALYTICS CAPITAL MARKETS RESEARCH / WEEKLY MARKET OUTLOOK 16
FIGURE 3Rating Changes: Corporate & Financial Institutions - US
Date Company Sector RatingAmount
($ Million)Up/
Down
Old LTD
Rating
New LTD Rating
IG/SG
9/29/2021JPW INDUSTRIES LUX ACQUISITIONS HOLDINGS S.A R.L-JPW INDUSTRIES HOLDING CORPORATION
Industrial SrSec/LTCFR/PDR 280.0 U Caa1 B3 SG
9/30/2021 RITE AID CORPORATION IndustrialSrSec/SrUnsec/SrSec/BCF/LTCFR/PDR
1610.9 U Caa1 B3 SG
9/30/2021 STANDARD INDUSTRIES INC. Industrial SrUnsec/LTCFR/PDR 4977.7 D Ba2 B1 SG9/30/2021 BUNGE LIMITED Industrial SrUnsec/LTIR/PS 5517.7 U Baa3 Baa2 IG9/30/2021 AHERN RENTALS INC. Industrial LTCFR/PDR D B3 Caa1 SG
9/30/2021MARVEL PARENT, LLC-MONOTYPE IMAGING HOLDINGS INC.
Industrial SrSec/BCF/LTCFR/PDR U B3 B2 SG
9/30/2021 NORTHWEST FIBER, LLC UtilitySrUnsec/SrSec/BCF/LTCFR/PDR
550.0 D Caa1 Caa2 SG
10/1/2021CF INDUSTRIES HOLDINGS, INC.-CF INDUSTRIES, INC.
Industrial SrUnsec 2750.0 U Ba2 Ba1 SG
10/1/2021AEGIS TOXICOLOGY SCIENCES CORPORATION
Industrial SrSec/BCF/LTCFR/PDR U B3 B2 SG
10/4/2021 TEXAS INSTRUMENTS, INCORPORATED Industrial SrUnsec 7800.0 U A1 Aa3 IG10/4/2021 THOR INDUSTRIES, INC. Industrial SrSec/BCF/LTCFR/PDR U Ba3 Ba2 SG10/4/2021 WINNEBAGO INDUSTRIES, INC. Industrial SrSec/LTCFR/PDR 300.0 U B1 Ba3 SG10/4/2021 SITEONE LANDSCAPE SUPPLY HOLDING, LLC Industrial SrSec/BCF/LTCFR/PDR U B1 Ba3 SG10/4/2021 BROADSTREET PARTNERS, INC. Financial SrUnsec/LTCFR/PDR D Caa1 Caa2 SGSource: Moody's
FIGURE 4Rating Changes: Corporate & Financial Institutions - Europe
Date Company Sector RatingAmount
($ Million)Up/
Down
Old LTD
Rating
New LTD
Rating
O
d
New
IG/SG
Country
9/29/2021RAIFFEISENLANDESBANK NIEDEROESTERREICH - WIEN
FinancialSrUnsec/LTIR/LTD/Sub/MTN
2150.4 U Baa1 A3 IG AUSTRIA
9/29/2021RAIFFEISENLANDESBANK OBEROESTERREICH AKTIENGESELLS
Financial SrUnsec/LTIR/LTD 803.3 U Baa1 A3 IG AUSTRIA
9/29/2021 RAIFFEISEN-LANDESBANK STEIERMARK AG Financial LTIR/LTD U Baa1 A3 IG AUSTRIA9/29/2021 RAIFFEISEN-LANDESBANK TIROL AG Financial LTIR/LTD U Baa1 A3 IG AUSTRIA9/29/2021 RAIFFEISENVERBAND SALZBURG Financial LTIR/LTD U Baa1 A3 IG AUSTRIA9/29/2021 RAIFFEISENLANDESBANK VORARLBERG Financial LTIR/LTD U Baa1 A3 IG AUSTRIA
9/29/2021 RAIFFEISEN BANK INTERNATIONAL AG FinancialSrUnsec/LTIR/STD/LTD/SrSub/Sub/MTN
12082.8 U A3 A2 IG AUSTRIA
9/29/2021 SIG COMBIBLOC GROUP AG Industrial SrUnsec/LTCFR/PDR 1159.6 U Ba2 Ba1 SG SWITZERLAND
10/1/2021DZ BANK AG DEUTSCHE ZENTRAL-GENOSSENSCHAFTSBANK
FinancialSrUnsec/LTIR/LTD/Sub/MTN
60988.3 D Aa1 Aa2 IG GERMANY
10/1/2021 BANK URALSIB Financial LTD U B2 B1 SG RUSSIA10/1/2021 BREEZE FINANCE S.A. Industrial SrSec/Sub 430.2 D B2 B3 SG LUXEMBOURG
10/1/2021JSC HOLDING COMPANY METALLOINVEST-METALLOINVEST FINANCE D.A.C.
Industrial SrUnsec 800.0 U Ba1 Baa3 SG IRELAND
10/1/2021 IBERCAJA CAJATRES-IBERCAJA BANCO SA Financial LTD/Sub 579.8 U Ba2 Ba1 SG SPAIN10/4/2021 HOIST FINANCE AB (PUBL) Financial MTN U Ba3 Ba2 SG SWEDEN10/5/2021 SEB AB Financial SrUnsec/LTIR/LTD/MTN 11371.1 D Aa2 Aa3 IG SWEDEN10/5/2021 NORD GOLD PLC Industrial SrUnsec/LTCFR/PDR 400.0 U Ba2 Ba1 SG UNITED KINGDOMSource: Moody's

MOODY’S ANALYTICS CAPITAL MARKETS RESEARCH / WEEKLY MARKET OUTLOOK 17
MARKET DATA
0
200
400
600
800
0
200
400
600
800
2003 2004 2005 2006 2007 2008 2009 2010 2011 2012 2013 2014 2015 2016 2017 2018 2019 2020 2021
Spread (bp) Spread (bp) Aa2 A2 Baa2
Source: Moody's
Figure 1: 5-Year Median Spreads-Global Data (High Grade)
0
400
800
1,200
1,600
2,000
0
400
800
1,200
1,600
2,000
2003 2004 2005 2006 2007 2008 2009 2010 2011 2012 2013 2014 2015 2016 2017 2018 2019 2020 2021
Spread (bp) Spread (bp) Ba2 B2 Caa-C
Source: Moody's
Figure 2: 5-Year Median Spreads-Global Data (High Yield)
MOODY’S ANALYTICS CAPITAL MARKETS RESEARCH / WEEKLY MARKET OUTLOOK 18
CDS MOVERS
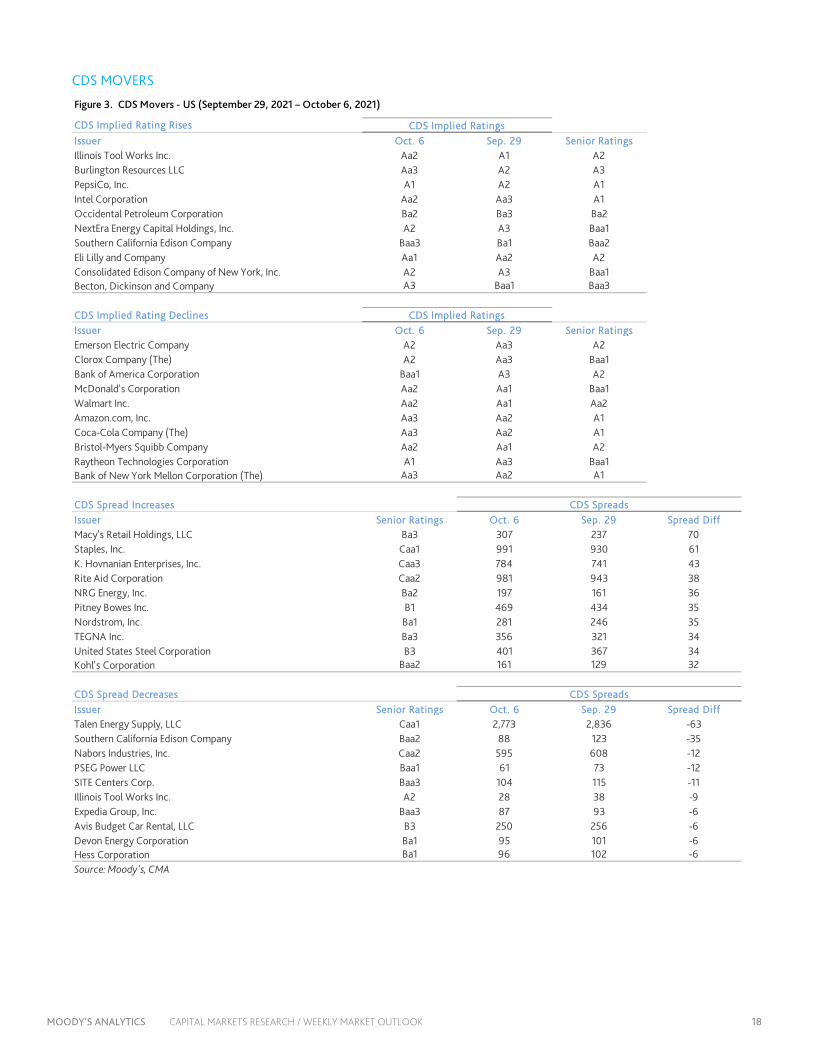
CDS Implied Rating RisesIssuer Oct. 6 Sep. 29 Senior RatingsIllinois Tool Works Inc. Aa2 A1 A2Burlington Resources LLC Aa3 A2 A3PepsiCo, Inc. A1 A2 A1Intel Corporation Aa2 Aa3 A1Occidental Petroleum Corporation Ba2 Ba3 Ba2NextEra Energy Capital Holdings, Inc. A2 A3 Baa1Southern California Edison Company Baa3 Ba1 Baa2Eli Lilly and Company Aa1 Aa2 A2Consolidated Edison Company of New York, Inc. A2 A3 Baa1Becton, Dickinson and Company A3 Baa1 Baa3
CDS Implied Rating DeclinesIssuer Oct. 6 Sep. 29 Senior RatingsEmerson Electric Company A2 Aa3 A2Clorox Company (The) A2 Aa3 Baa1Bank of America Corporation Baa1 A3 A2McDonald's Corporation Aa2 Aa1 Baa1Walmart Inc. Aa2 Aa1 Aa2Amazon.com, Inc. Aa3 Aa2 A1Coca-Cola Company (The) Aa3 Aa2 A1Bristol-Myers Squibb Company Aa2 Aa1 A2Raytheon Technologies Corporation A1 Aa3 Baa1Bank of New York Mellon Corporation (The) Aa3 Aa2 A1
CDS Spread IncreasesIssuer Senior Ratings Oct. 6 Sep. 29 Spread DiffMacy's Retail Holdings, LLC Ba3 307 237 70Staples, Inc. Caa1 991 930 61K. Hovnanian Enterprises, Inc. Caa3 784 741 43Rite Aid Corporation Caa2 981 943 38NRG Energy, Inc. Ba2 197 161 36Pitney Bowes Inc. B1 469 434 35Nordstrom, Inc. Ba1 281 246 35TEGNA Inc. Ba3 356 321 34United States Steel Corporation B3 401 367 34Kohl's Corporation Baa2 161 129 32
CDS Spread DecreasesIssuer Senior Ratings Oct. 6 Sep. 29 Spread DiffTalen Energy Supply, LLC Caa1 2,773 2,836 -63Southern California Edison Company Baa2 88 123 -35Nabors Industries, Inc. Caa2 595 608 -12PSEG Power LLC Baa1 61 73 -12SITE Centers Corp. Baa3 104 115 -11Illinois Tool Works Inc. A2 28 38 -9Expedia Group, Inc. Baa3 87 93 -6Avis Budget Car Rental, LLC B3 250 256 -6Devon Energy Corporation Ba1 95 101 -6Hess Corporation Ba1 96 102 -6Source: Moody's, CMA
CDS Spreads
CDS Implied Ratings
CDS Implied Ratings
CDS Spreads
Figure 3. CDS Movers - US (September 29, 2021 – October 6, 2021)

MOODY’S ANALYTICS CAPITAL MARKETS RESEARCH / WEEKLY MARKET OUTLOOK 19
CDS Movers
CDS Implied Rating RisesIssuer Oct. 6 Sep. 29 Senior RatingsSantander UK plc A1 Baa1 A1Santander Financial Services plc A1 Baa1 A1CaixaBank, S.A. A2 A3 Baa1Dexia Credit Local Baa2 Baa3 Baa3TotalEnergies SE Aa1 Aa2 A1Banca Monte dei Paschi di Siena S.p.A. Ba2 Ba3 Caa1KBC Bank N.V. Aa3 A1 A1National Grid Electricity Transmission plc A1 A2 Baa1Scottish Power UK plc A3 Baa1 Baa1Rolls-Royce plc Ba2 Ba3 Ba3
CDS Implied Rating DeclinesIssuer Oct. 6 Sep. 29 Senior RatingsFrance, Government of Aa1 Aaa Aa2Natixis A1 Aa3 A1BNP Paribas A1 Aa3 Aa3Societe Generale A1 Aa3 A1Deutsche Bank AG A3 A2 A2Banco Santander S.A. (Spain) Aa3 Aa2 A2Banco Bilbao Vizcaya Argentaria, S.A. A1 Aa3 A3HSBC Holdings plc Baa2 Baa1 A3Banque Federative du Credit Mutuel A1 Aa3 Aa3Credit Agricole Corporate and Investment Bank Aa3 Aa2 Aa3
CDS Spread IncreasesIssuer Senior Ratings Oct. 6 Sep. 29 Spread DiffVedanta Resources Limited B3 801 695 106Boparan Finance plc Caa1 1,065 986 79Novafives S.A.S. Caa2 690 644 46Stena AB Caa1 460 414 46CMA CGM S.A. B2 334 289 45Ardagh Packaging Finance plc Caa1 262 226 35Casino Guichard-Perrachon SA Caa1 576 542 34Iceland Bondco plc Caa2 536 506 30Ineos Group Holdings S.A. B2 248 221 28UPC Holding B.V. B3 192 165 27
CDS Spread DecreasesIssuer Senior Ratings Oct. 6 Sep. 29 Spread DiffVue International Bidco plc Ca 634 650 -16Sappi Papier Holding GmbH Ba2 309 324 -15Rolls-Royce plc Ba3 171 185 -14Santander UK plc A1 38 51 -13Santander Financial Services plc A1 39 52 -13Piraeus Financial Holdings S.A. Caa2 555 565 -10Banca Monte dei Paschi di Siena S.p.A. Caa1 179 189 -9Scottish Power Limited Baa1 50 58 -8Scottish Power UK plc Baa1 45 53 -7Iceland, Government of A2 57 63 -6Source: Moody's, CMA
CDS Spreads
CDS Implied Ratings
CDS Implied Ratings
CDS Spreads
Figure 4. CDS Movers - Europe (September 29, 2021 – October 6, 2021)

MOODY’S ANALYTICS CAPITAL MARKETS RESEARCH / WEEKLY MARKET OUTLOOK 20
ISSUANCE
0
700
1,400
2,100
2,800
0
700
1,400
2,100
2,800
Jan Feb Mar Apr May Jun Jul Aug Sep Oct Nov Dec
Issuance ($B) Issuance ($B)2018 2019 2020 2021
Source: Moody's / Dealogic
Figure 5. Market Cumulative Issuance - Corporate & Financial Institutions: USD Denominated
0
200
400
600
800
1,000
0
200
400
600
800
1,000
Jan Feb Mar Apr May Jun Jul Aug Sep Oct Nov Dec
Issuance ($B) Issuance ($B)2018 2019 2020 2021
Source: Moody's / Dealogic
Figure 6. Market Cumulative Issuance - Corporate & Financial Institutions: Euro Denominated

MOODY’S ANALYTICS CAPITAL MARKETS RESEARCH / WEEKLY MARKET OUTLOOK 21
ISSUANCE
Investment-Grade High-Yield Total*Amount Amount Amount
$B $B $BWeekly 22.807 18.077 42.574
Year-to-Date 1,314.451 534.017 1,909.128
Investment-Grade High-Yield Total*Amount Amount Amount
$B $B $BWeekly 16.163 0.875 17.767
Year-to-Date 559.513 127.328 705.654* Difference represents issuance with pending ratings.Source: Moody's/ Dealogic
USD Denominated
Euro Denominated
Figure 7. Issuance: Corporate & Financial Institutions

MOODY’S ANALYTICS CAPITAL MARKETS RESEARCH / WEEKLY MARKET OUTLOOK 22
To order reprints of this report (100 copies minimum), please call 212.553.1658.
Report Number: 1305793 Contact Us
Editor Reid Kanaley [email protected]
Americas +1.212.553.1658 [email protected]
Europe +44.20.7772.5454 [email protected]
Asia (Excluding Japan) +85 2 2916 1121 [email protected]
Japan +81 3 5408 4100 [email protected]
MOODY’S ANALYTICS CAPITAL MARKETS RESEARCH / WEEKLY MARKET OUTLOOK 23
© 2021 Moody’s Corporation, Moody’s Investors Service, Inc., Moody’s Analytics, Inc. and/or their licensors and affiliates (collectively, “MOODY’S”). All rights reserved.
CREDIT RATINGS ISSUED BY MOODY'S CREDIT RATINGS AFFILIATES ARE THEIR CURRENT OPINIONS OF THE RELATIVE FUTURE CREDIT RISK OF ENTITIES, CREDIT COMMITMENTS, OR DEBT OR DEBT-LIKE SECURITIES, AND MATERIALS, PRODUCTS, SERVICES AND INFORMATION PUBLISHED BY MOODY’S (COLLECTIVELY, “PUBLICATIONS”) MAY INCLUDE SUCH CURRENT OPINIONS. MOODY’S DEFINES CREDIT RISK AS THE RISK THAT AN ENTITY MAY NOT MEET ITS CONTRACTUAL FINANCIAL OBLIGATIONS AS THEY COME DUE AND ANY ESTIMATED FINANCIAL LOSS IN THE EVENT OF DEFAULT OR IMPAIRMENT. SEE APPLICABLE MOODY’S RATING SYMBOLS AND DEFINITIONS PUBLICATION FOR INFORMATION ON THE TYPES OF CONTRACTUAL FINANCIAL OBLIGATIONS ADDRESSED BY MOODY’S CREDIT RATINGS. CREDIT RATINGS DO NOT ADDRESS ANY OTHER RISK, INCLUDING BUT NOT LIMITED TO: LIQUIDITY RISK, MARKET VALUE RISK, OR PRICE VOLATILITY. CREDIT RATINGS, NON-CREDIT ASSESSMENTS (“ASSESSMENTS”), AND OTHER OPINIONS INCLUDED IN MOODY’S PUBLICATIONS ARE NOT STATEMENTS OF CURRENT OR HISTORICAL FACT. MOODY’S PUBLICATIONS MAY ALSO INCLUDE QUANTITATIVE MODEL-BASED ESTIMATES OF CREDIT RISK AND RELATED OPINIONS OR COMMENTARY PUBLISHED BY MOODY’S ANALYTICS, INC. AND/OR ITS AFFILIATES. MOODY’S CREDIT RATINGS, ASSESSMENTS, OTHER OPINIONS AND PUBLICATIONS DO NOT CONSTITUTE OR PROVIDE INVESTMENT OR FINANCIAL ADVICE, AND MOODY’S CREDIT RATINGS, ASSESSMENTS, OTHER OPINIONS AND PUBLICATIONS ARE NOT AND DO NOT PROVIDE RECOMMENDATIONS TO PURCHASE, SELL, OR HOLD PARTICULAR SECURITIES. MOODY’S CREDIT RATINGS, ASSESSMENTS, OTHER OPINIONS AND PUBLICATIONS DO NOT COMMENT ON THE SUITABILITY OF AN INVESTMENT FOR ANY PARTICULAR INVESTOR. MOODY’S ISSUES ITS CREDIT RATINGS, ASSESSMENTS AND OTHER OPINIONS AND PUBLISHES ITS PUBLICATIONS WITH THE EXPECTATION AND UNDERSTANDING THAT EACH INVESTOR WILL, WITH DUE CARE, MAKE ITS OWN STUDY AND EVALUATION OF EACH SECURITY THAT IS UNDER CONSIDERATION FOR PURCHASE, HOLDING, OR SALE.
MOODY’S CREDIT RATINGS, ASSESSMENTS, OTHER OPINIONS, AND PUBLICATIONS ARE NOT INTENDED FOR USE BY RETAIL INVESTORS AND IT WOULD BE RECKLESS AND INAPPROPRIATE FOR RETAIL INVESTORS TO USE MOODY’S CREDIT RATINGS, ASSESSMENTS, OTHER OPINIONS OR PUBLICATIONS WHEN MAKING AN INVESTMENT DECISION. IF IN DOUBT YOU SHOULD CONTACT YOUR FINANCIAL OR OTHER PROFESSIONAL ADVISER.
ALL INFORMATION CONTAINED HEREIN IS PROTECTED BY LAW, INCLUDING BUT NOT LIMITED TO, COPYRIGHT LAW, AND NONE OF SUCH INFORMATION MAY BE COPIED OR OTHERWISE REPRODUCED, REPACKAGED, FURTHER TRANSMITTED, TRANSFERRED, DISSEMINATED, REDISTRIBUTED OR RESOLD, OR STORED FOR SUBSEQUENT USE FOR ANY SUCH PURPOSE, IN WHOLE OR IN PART, IN ANY FORM OR MANNER OR BY ANY MEANS WHATSOEVER, BY ANY PERSON WITHOUT MOODY’S PRIOR WRITTEN CONSENT.
MOODY’S CREDIT RATINGS, ASSESSMENTS, OTHER OPINIONS AND PUBLICATIONS ARE NOT INTENDED FOR USE BY ANY PERSON AS A BENCHMARK AS THAT TERM IS DEFINED FOR REGULATORY PURPOSES AND MUST NOT BE USED IN ANY WAY THAT COULD RESULT IN THEM BEING CONSIDERED A BENCHMARK.
All information contained herein is obtained by MOODY’S from sources believed by it to be accurate and reliable. Because of the possibility of human or mechanical error as well as other factors, however, all information contained herein is provided “AS IS” without warranty of any kind. MOODY'S adopts all necessary measures so that the information it uses in assigning a credit rating is of sufficient quality and from sources MOODY'S considers to be reliable including, when appropriate, independent third-party sources. However, MOODY’S is not an auditor and cannot in every instance independently verify or validate information received in the rating process or in preparing its Publications.
To the extent permitted by law, MOODY’S and its directors, officers, employees, agents, representatives, licensors and suppliers disclaim liability to any person or entity for any indirect, special, consequential, or incidental losses or damages whatsoever arising from or in connection with the information contained herein or the use of or inability to use any such information, even if MOODY’S or any of its directors, officers, employees, agents, representatives, licensors or suppliers is advised in advance of the possibility of such losses or damages, including but not limited to: (a) any loss of present or prospective profits or (b) any loss or damage arising where the relevant financial instrument is not the subject of a particular credit rating assigned by MOODY’S.
To the extent permitted by law, MOODY’S and its directors, officers, employees, agents, representatives, licensors and suppliers disclaim liability for any direct or compensatory losses or damages caused to any person or entity, including but not limited to by any negligence (but excluding fraud, willful misconduct or any other type of liability that, for the avoidance of doubt, by law cannot be excluded) on the part of, or any contingency within or beyond the control of, MOODY’S or any of its directors, officers, employees, agents, representatives, licensors or suppliers, arising from or in connection with the information contained herein or the use of or inability to use any such information.
NO WARRANTY, EXPRESS OR IMPLIED, AS TO THE ACCURACY, TIMELINESS, COMPLETENESS, MERCHANTABILITY OR FITNESS FOR ANY PARTICULAR PURPOSE OF ANY CREDIT RATING, ASSESSMENT, OTHER OPINION OR INFORMATION IS GIVEN OR MADE BY MOODY’S IN ANY FORM OR MANNER WHATSOEVER.
Moody’s Investors Service, Inc., a wholly-owned credit rating agency subsidiary of Moody’s Corporation (“MCO”), hereby discloses that most issuers of debt securities (including corporate and municipal bonds, debentures, notes and commercial paper) and preferred stock rated by Moody’s Investors Service, Inc. have, prior to assignment of any credit rating, agreed to pay to Moody’s Investors Service, Inc. for credit ratings opinions and services rendered by it fees ranging from $1,000 to approximately $5,000,000. MCO and Moody’s Investors Service also maintain policies and procedures to address the independence of Moody’s Investors Service credit ratings and credit rating processes. Information regarding certain affiliations that may exist between directors of MCO and rated entities, and between entities who hold credit ratings from Moody’s Investors Service and have also publicly reported to the SEC an ownership interest in MCO of more than 5%, is posted annually at www.moodys.com under the heading “Investor Relations — Corporate Governance — Director and Shareholder Affiliation Policy.”
Additional terms for Australia only: Any publication into Australia of this document is pursuant to the Australian Financial Services License of MOODY’S affiliate, Moody’s Investors Service Pty Limited ABN 61 003 399 657AFSL 336969 and/or Moody’s Analytics Australia Pty Ltd ABN 94 105 136 972 AFSL 383569 (as applicable). This document is intended to be provided only to “wholesale clients” within the meaning of section 761G of the Corporations Act 2001. By continuing to access this document from within Australia, you represent to MOODY’S that you are, or are accessing the document as a representative of, a “wholesale client” and that neither you nor the entity you represent will directly or indirectly disseminate this document or its contents to “retail clients” within the meaning of section 761G of the Corporations Act 2001. MOODY’S credit rating is an opinion as to the creditworthiness of a debt obligation of the issuer, not on the equity securities of the issuer or any form of security that is available to retail investors.
Additional terms for Japan only: Moody's Japan K.K. (“MJKK”) is a wholly owned credit rating agency subsidiary of Moody's Group Japan G.K., which is wholly owned by Moody’s Overseas Holdings Inc., a wholly owned subsidiary of MCO. Moody’s SF Japan K.K. (“MSFJ”) is a wholly owned credit rating agency subsidiary of MJKK. MSFJ is not a Nationally Recognized Statistical Rating Organization (“NRSRO”). Therefore, credit ratings assigned by MSFJ are Non-NRSRO Credit Ratings. Non-NRSRO Credit Ratings are assigned by an entity that is not a NRSRO and, consequently, the rated obligation will not qualify for certain types of treatment under U.S. laws. MJKK and MSFJ are credit rating agencies registered with the Japan Financial Services Agency and their registration numbers are FSA Commissioner (Ratings) No. 2 and 3 respectively.
MJKK or MSFJ (as applicable) hereby disclose that most issuers of debt securities (including corporate and municipal bonds, debentures, notes and commercial paper) and preferred stock rated by MJKK or MSFJ (as applicable) have, prior to assignment of any credit rating, agreed to pay to MJKK or MSFJ (as applicable) for credit ratings opinions and services rendered by it fees ranging from JPY125,000 to approximately JPY550,000,000.
MJKK and MSFJ also maintain policies and procedures to address Japanese regulatory requirements.