outpatient waiting time measures and patient … waiting time measures and patient satisfaction...
TRANSCRIPT
Outpatient Waiting Time Measures andOutpatient Waiting Time Measures and Patient Satisfaction
Julia Prentice and Steven Pizer
HERC Cyber Seminar May 16 2012May 16 2012
Funding for this work was provided by the VA Systems Redesign Office We are indebted to Aaron Legler and Matthew Neuman of the VA Boston Healthcare System and Stacey Campbell of VSSC for programming support Th ihe views expressedd iin thi his presentation are thhose of thhe authhors and d d do not necessarilil y represent thhe position ori f i i policy of the Department of Veterans Affairs or Boston University
wwwhcferesearchvagov
decade
Wait Times are a Key Policy FocusWait Times are a Key Policy Focus
bull VA has monitored wait times for over a decade
‐ Before 1999 anecdotal evidence on waits
bull Congress requested wait time dataCongress requested wait time data
bull VA began systematically collecting wait time data
Interventions to Decrease WaitsInterventions to Decrease Waits
bull Performance measures
bull Advanced Clinic Access in six target clinicsAdvanced Clinic Access in six target clinics ‐ 2000
bull Primary care panel sizes
bull Limited enrollment to ppriorityy 78 ‐ 2003 to 2009
T
ime
tto f
irst
nnex
t av
aaila
ble
ap
poin
ttmen
ts ff
or n
ew p
atie
nt
Wait Times Have Decreased
100
Mean 10 90
80
90
60
70
40
50
20
30
0
10
Jan-
02A
pr-0
2Ju
l-02
Oct
-02
Jan-
03A
pr-0
3Ju
l-03
Oct
-03
Jan-
04A
pr-0
4Ju
l-04
Oct
-04
Jan-
05A
pr-0
5Ju
l-05
Oct
-05
Jan-
06A
pr-0
6Ju
l-06
Oct
-06
Jan-
07A
pr-0
7Ju
l-07
Oct
-07
Jan-
08A
pr-0
8Ju
l-08
Oct
-08
Jan-
09A
pr-0
9Ju
l-09
Oct
-09
Jan-
10A
pr-1
0Ju
l-10
Concerns About Waits Still RemainConcerns About Waits Still Remain
bull VA OIG audits wait time policiesVA OIG audits wait time policies ‐ Access to mental health care‐ April 2012
bull Congressional hearings on accessCongressional hearings on access
‐ SVAC April 2012
‐ HVAC May 2012
Re of Wait Time Measures is Unknown
Reliability of Wait Time Measures is Unknownliability
bull VA has used a varietyy of wait time measures
bull Initiatives to decrease wait times require reliableInitiatives to decrease wait times require reliable measures ‐ Little research has used wait time measures toLittle research has used wait time measures to predict outcomes
bull This study aims to fill this knowledge gap Today focusing on patient satisfaction results‐ Today focusing on patient satisfaction results ‐ Future analyses focus on health outcomes
Wait Time Measures
bull Cappacityy measures ‐ First next available (FNA)
bull TiTime sttamp measures
‐ Create date (CD)
‐ Desired date (DD)
bullbull Access list measures Access list measures ‐ Create date (CD)
‐ Desired date (DD)
FNA Calculation
bull New patient A requests to be seen as soon as possible on January 5 2010
bull First next available appointment is January 10 2010
bull Wait time = 5 days (O‐X)
XX O152010 1102010
FNA Measure
bull Overall supply in syystem pp y
‐ Patient availabilitypreferences not considered
bull Schedulers distinguish between follow‐up
and urgent care appointments
‐More problematic for established vs new patientsMore problematic for established vs new patients
bull Appointment typeMultiple physician profilesAppointment typeMultiple physician profiles ‐ FNA appointment type is not what patient needs
‐ CCannot consullt allll sch dhedulili ng profilfiles ffor same ph ihysiciian
Previous ResearchPrevious Research
bull Veterans visitingg VA facilities with longger FNA have poorer health outcomes
bull Mortality preventable hospitalization for geriatric veteransveterans
bullbull Mortality preventable hospitalization AMI Mortality preventable hospitalization AMI stroke HbA1c
‐ Veterans with diabetes
‐ Veterans over age 70 and with greater comorbidities
FNA Measure Limitations
bull Patient availabilitypypreferences not considered
bull VA managers explloredd othher options
Create Date Time Stampp Calculation
bull New ppatient A reqquests to be seen as soon as possible on January 5 2010
bull Cannot take January 10 2010 appointment
bull Appointment is scheduled for January 21 2010
bull Wait time= 16 days (Y‐X)
Time Stamp CD FNA O Y
152010 1102010 1212010 X
Use o eca ste s e sus sc edu
Create Date (CD) Time Stamp MeasureCreate Date (CD) Time Stamp Measure
bull Little information reqquired of schedulingg clerks
bull Based on completed appointments ‐ Excludes no‐shows cancellations Excludes no shows cancellations
bull Use of recall systems versus schedulinggsy follow‐up appointments right away ‐ Influences wait timeInfluences wait time
‐More problematic for established versus new patients
Desired Date Time Stampp Calculation
bull Established Patient B reqquests an Appril 5 2010 follow‐up appointment on January 1 2010
bull Appointment is scheduled for April 20 Appointment is scheduled for April 20 2010bull 2010
bull Wait time= 15 days (Z‐W)
Desired Date Time Stamp
W Z 152010152010 452010452010 42020104202010
X
Desired Date (DD) Time Stamp MeasureDate (DD) Time Stamp eDesired Measur
bull In 2010 VA shifted to desired date measure
bull Not influenced by use of recall systems
bull Takes into account ppatient ppreferences
Desired Date (DD) Time Stamp MeasureDate (DD) Time Stamp eDesired Measur
bull Schedulers must correctly enter desired date
O i i h ti i t t ‐ Original DD k t l DD kept when negotitiating appointment
‐ Eg May 1st versus May 5th
bullbull Extensive training of schedulers Extensive training of schedulers
‐ Implemented in 2010
‐ Audits find date is entered correctly 90 of the time
Prospective Access MeasuresProspective Access Measures
bull Time stamp measures are retrospective ‐ Only includes completed appointmentsOnly includes completed appointments ‐ Patient no‐shows not included ‐ Cancellations that are not rescheduled not includedCancellations that are not rescheduled not included
bull AAccess lilist measures are prospectiive ‐ Calculate waits off of pending appointments ‐ Includes no‐shows and cancellations
Access List Create Date Calculation
bull New patient A requests an appt ASAP on January 5 2010
bull Appointment is scheduled for February 10 2010
bull Bi‐monthlyy repport dates ((1 and 15th of each month))
bull Appointment is not eligible for calculation until CD is equal to or before report dateequal to or before report date
bull 112010 report‐ appt not included
d )bull 1152010 report‐Wait time = 10 days ((R2‐O)
bull 212010 report‐Wait time = 26 days (R3‐O) Access CD
O Access CD
WR2R1 O R3 112010
152010
1152010 212010 2102010
Access List CD Measure
bullbull Performance measure is percent of appts Performance measure is percent of appts that have less than a 14 day wait
‐We average waits to match other measures
bull Influenced by how follow‐up appts are sch dhedul d ( led (eg recallll systtems))
Access List Desired Date Calculation
bull Established Patient B requests an April 5 2010Established Patient B requests an April 5 2010 follow‐up appointment on January 5 2010
A i i h d l d f M 5 2010bull Appointment is scheduled for May 5 2010
bull Repport dates are 1st and 15th of each month
bull 4152010 report‐Wait time= 10 days (R1‐O)
bull 512010 report‐Wait time= 25 days (R2‐O)
Access DD Access DD Access DD
X O WX O R1R1 R2R2 W 152010
452010
4152010 512010 552010
Access List DD Measure
bull Performance measure is percent of appts that have less than a 14 day wait
‐We average waits to match other measuresWe average waits to match other measures
bull Schedulers must correctly enter DD
Summary of Wait Time Measures bull New versus established patients
bull Time Stamp RetrospectiveTime Stamp Retrospective
bull FNA‐Access Prospective A CD
Time Stamp CD Access CD
OFNA WRX 152010152010 1102010 1152010 12120101102010 1152010 1212010
Access DD
W Z DD Time Stamp
X YW Y Z 152010 452010 4152010 4202010
X
Research QuestionResearch Question
H ll d lt ti f itbull How well do alternative measures of wait times predict patient satisfaction
Surveys on Patient SatisfactionSurveys on Patient Satisfaction
bull Access is a key component of satisfaction
bull Difficult to judge technical quality
bull Patients focus on practical aspects of their healthcare experience
Satisfaction Data bull 2010 Survey of Healthcare Experiences of Patients (SHEP) ‐Managed by Office of Quality and Performance ‐Modeled after Consumer Assessment of Healthcare Providers and SystemsProviders and Systems
bull Simple random sample of patients with completed appointments each month bull Visit date of appointment is recorded bull n=221924 people
Access Satisfaction MeasuresAccess Satisfaction Measures 1) Appt as soon as wanted (Timely appt)
2) Ease of getting test or treatment in last 12 months (Treatment access)
3) Ease of accessing specialist visit (Specialist access)
bull Asked for the last 12 months ‐Most recent visit is likely in mind
bull Coded as AlwaysUsually vs SometimesNever
General Satisfaction MeasuresGeneral Satisfaction Measures
4) Rate VA health care in last 12 months (VA rating) O l f 1 ( ) 10 (b )‐ On a scale of 1 (worst) to 10 (best)
‐ 9 or 10 versus lt=8
5) Satisfaction with VA at recent visit (satisfied)5) Satisfaction with VA at recent visit (satisfied)
‐ Likert scale 1 (least) to 7 (most) of satisfaction
‐ 6 or 7 versus lt=5
atc ed to s t date e de t as se ected o sa e
AnalysesAnalyses
bullbull Logistic regression predicting satisfaction Logistic regression predicting satisfaction
bull Wait time measuresWait time measures ‐ High volume clinic stops ‐ Patientprovider interactions ‐ All major medical sub‐specialties ‐ Facility level monthly averages (including Access measures) ‐Matched to visit date when respondent was selected for samppleespo ‐ Quartiles
‐
Analyses ContinuedAnalyses Continued
bull Risk adjustors from SHEP bull Risk adjustors from SHEP ‐ Sex
‐ Race
‐ Age
‐ Education
‐ Health care utilizationHealth care utilization
‐ Health status
Descriptive Statistics of SampleDescriptive Statistics of Sample Demographics Mean or
Age 67
Male 95
Had some college 53
White 79
Black 10
Hisppanic 5
Other 6
gtgt 5=5 visits visits to a doctorto a doctor s rsquos office in last 12 office in last 12 3131 months
Excellentvery good self‐reported health 25Excellentvery good self reported health status in last 12 months
25
Descriptive Statistics of Satisfaction MMeasures
Satisfaction Measure
Timely visit AlwaysUsually vs SometimesNever 83
Treatment access AlwaysUsually vs SometimesNever 85
Specialist access AlwaysUsually vs SometimesNever 82
VA rating in last 12 months 9 or 10 versus lt9 78
VA satisfaction at most recent visit 6 7 6 82826 or 7 versus lt6
Mean Wait Times 35
3030
25
Wait in Dayys
20
15
10
5
0
Time Stamp CD
Time Stamp DD Time Stamp DD
30913018
FNA
2007
1797
Access CD
1558
Access DD
789 791
472
272252
New Patients Established Patients
New Patient ResultsNew Patient Results
H ll d lt ti f itbull How well do alternative measures of wait times predict patient satisfaction
‐ Longer waits predict lower satisfaction
New Patient FNACD Timely Visit 1
09
08
07
Odds 06 Ratio
05
04
0 3 03
02
0 1 01
0 FNAFNA Time Stamp CD Time Stamp CD
Quartile 2
QQuartil ile 33
Quartile 4
Access CD Access CD
Everything is significant at Plt005 Reference group is VA facilities in quartile 1
New Patient DD Timely Visit 115
11
Odds Ratio
105 Quartile 2
1
Quartile 3
Quartile 4
095
0 909 Time Stamp DD Access DD
Significant at Plt005 in wrong direction Reference group is VA facilities in quartile 1
08 08 08 09 09
New Patient Waits Predicting Satisfaction
Measure Timely Treatment Specialist VA rating VA Appt Access Access satisfaction
FNA (ref=Q1) Q2 Q3
089 082
093 084
093 084
095 092
095 091Q3
Q4 073 073 074 086 085
Time Stamp CD ( f Q1) (ref=Q1) Q2 086 087 086 096 094 Q3 078 080 081 091 090 Q4 067 065 067 083 082
093 091 0 86 Q4 073 072 072 089 086
Access CD (ref=Q1)(ref=Q1) Q2 Q3 Q4
083 085 0 73
084 084 0 72
086 085 0 72
093 093 0 89
Numbers are odds ratio from logistic regression Significant at Plt=005
New Patient Waits Predicting Satisfaction
Measure Timely Treatment Specialist VA rating VA Appt Access Access satisfaction
Time Stamp DD (ref=Q1) Q2 106 101 105 100Q2 Q3 Q4
106 110 106
101 106 102
105 110 107
100 098 101
101101 101 102
A DDAccess DD (ref=Q1) Q2 098 097 098 094 096 Q3 112 109 111 100 103 Q4 110 106 111 100 103
Numbers are odds ratio from logistic regressionNumbers are odds ratio from logistic regression Significant at Plt=005 Significant in wrong direction
New Patient Results
bull FNA and create date measures are most reliablereliable
‐ Predict all 5 satisfaction measures
bull New patients want to be seen as soon as possible bull New patients want to be seen as soon as possible
‐ Date an appointment request was originally
made is reliable
Established Patient ResultsEstablished Patient Results
H ll d lt ti f itbull How well do alternative measures of wait times predict patient satisfaction
‐ Longer waits predict lower satisfaction
Established Patient FNACD
104
1 02 102
100
098
Odds 096
Ratio 094
092
090
0 88 088
086
084
FNA
Ti l Vi itTimely Visit
Time Stamp CD
Q tilQuartile 22
Quartile 3
Quartile 4
Access CD
Significant at Plt005 Reference group is VA facilities in quartile 1
Established Patient DD Timely Visit 120
100
Odds Ratio 0 60
080
Quartile 2
Ratio
0 40
060 Quartile 3
Quartile 4
020
040
000
020
Time Stamp DD Access DD Significant at Plt005 Significant in wrong direction at Plt005 Reference group is VA facilities in quartile 1
Established Patient Waits Predicting Satisfaction M TiTimelly T t t Speciialistt VA ti VAMeasure Treatment S li VA rating VA
Appt Access Access satisfaction
Q4 090 090 090
( Q ) Q2 Q3 Q4
102 100 0 90
FNA (ref=Q1) 099 098 0 93093
099 102 0 90
101 103 0 90
097 095 0 90090
Time Stamp CD (ref=Q1) Q2 092 090 094 096 099 Q3 091 087 089 094 093 Q4 102 096 099 107 102
Access CD (ref=Q1) Q2Q2 Q3 Q4
0 94 0 93 0 94 0 94 0 98 094 096 102
093 095 098
094 093 097
094 098 095
098 098 101
Numbers are odds ratio from logistic regression Significant at Plt=005 Significant in the wrong direction
Established Patient Waits Predicting Satisfaction
Measure Timely Treatment Specialist VA rating VA Appt Access Access satisfaction
Time Stamp DD (ref=Q1) Q2 099 097 098 094Q2 Q3 Q4
099 105 096
097 103 094
098 102 097
094 098 095
097097 100 097
A DDAccess DD (ref=Q1) Q2 091 090 088 094 092 Q3 086 086 083 086 087 Q4 080 077 076 086 084
Numbers are odds ratio from logistic regressionNumbers are odds ratio from logistic regression Significant at Plt=005 Significant in wrong direction
Established Patient ResultsEstablished Patient Results
bull Access list desired date is most reliable ‐ Includes no‐showscancellations ‐More accurate measure of supply in systemMore accurate measure of supply in system
bullbull DD reflects established patient preferences DD reflects established patient preferences versus FNACD measures
Polic Implications Policy Implications bull M lti l it ti d dMultiple wait time measures needed ‐ New versus established patients
bull New patients want to be seen right away ‐ Change in health status ‐ Appointment request dates are reliable ‐ Capacity and create date measures
Polic Implications Contin edPolicy Implications Continued bull E t bli h d ti t t i iti it ti Established patients may not prioritize wait times ‐ Continuity of care ‐ Convenient timeConvenient time
bull VA is a leader in recognizing new versus established patient compl itlexity
bullbull Future work will predict health outcomes Future work will predict health outcomes
Questions or CommentsQuestions or Comments
Julia PrenticeJulia Prentice JuliaPrenticevagov
(857) 364 6057(857)-364-6057 wwwhcferesearchgov
Resources 1 Prentice J Pizer SD (2007) Delayed Access to Health Care and Mortality Health Services Research
42(2) 644-662 2 Prentice JC Pizer SD (2008) Waiting Times and Ambulatory Care Sensitive Condition Hospitalizations Health
Services and Outcomes Research Methodology 8(1)1-18 33 Pizer SD Prentice JC (2011) What Are the Consequences of Waiting for Health Care in the Veteran Population Journal of GeneralPizer SD Prentice JC (2011) What Are the Consequences of Waiting for Health Care in the Veteran Population Journal of General
Internal Medicine 26(supplement 2)676-682 4 Pizer SD Prentice JC (2011) Time is money Outpatient waiting times and health insurance choices of elderly veterans in the United
States Journal of Health Economics 30(4)626-636 5 Prentice JC Fincke BG Miller DR Pizer SD (2011) Outpatient Waiting Times and Diabetes Care Quality
IImprovementt AAmeriican Journall off M Managed C d Care 17(2)e4343-e54J 17(2) 54 6 Prentice JC Fincke BG Miller DR Pizer SD (2012) Waiting for Primary Care and Health Outcomes among Elderly Patients With
Diabetes Health Services Research 47(1)46-67

Desired Date (DD) Time Stamp MeasureDate (DD) Time Stamp eDesired Measur
bull In 2010 VA shifted to desired date measure
bull Not influenced by use of recall systems
bull Takes into account ppatient ppreferences
Desired Date (DD) Time Stamp MeasureDate (DD) Time Stamp eDesired Measur
bull Schedulers must correctly enter desired date
O i i h ti i t t ‐ Original DD k t l DD kept when negotitiating appointment
‐ Eg May 1st versus May 5th
bullbull Extensive training of schedulers Extensive training of schedulers
‐ Implemented in 2010
‐ Audits find date is entered correctly 90 of the time
Prospective Access MeasuresProspective Access Measures
bull Time stamp measures are retrospective ‐ Only includes completed appointmentsOnly includes completed appointments ‐ Patient no‐shows not included ‐ Cancellations that are not rescheduled not includedCancellations that are not rescheduled not included
bull AAccess lilist measures are prospectiive ‐ Calculate waits off of pending appointments ‐ Includes no‐shows and cancellations
Access List Create Date Calculation
bull New patient A requests an appt ASAP on January 5 2010
bull Appointment is scheduled for February 10 2010
bull Bi‐monthlyy repport dates ((1 and 15th of each month))
bull Appointment is not eligible for calculation until CD is equal to or before report dateequal to or before report date
bull 112010 report‐ appt not included
d )bull 1152010 report‐Wait time = 10 days ((R2‐O)
bull 212010 report‐Wait time = 26 days (R3‐O) Access CD
O Access CD
WR2R1 O R3 112010
152010
1152010 212010 2102010
Access List CD Measure
bullbull Performance measure is percent of appts Performance measure is percent of appts that have less than a 14 day wait
‐We average waits to match other measures
bull Influenced by how follow‐up appts are sch dhedul d ( led (eg recallll systtems))
Access List Desired Date Calculation
bull Established Patient B requests an April 5 2010Established Patient B requests an April 5 2010 follow‐up appointment on January 5 2010
A i i h d l d f M 5 2010bull Appointment is scheduled for May 5 2010
bull Repport dates are 1st and 15th of each month
bull 4152010 report‐Wait time= 10 days (R1‐O)
bull 512010 report‐Wait time= 25 days (R2‐O)
Access DD Access DD Access DD
X O WX O R1R1 R2R2 W 152010
452010
4152010 512010 552010
Access List DD Measure
bull Performance measure is percent of appts that have less than a 14 day wait
‐We average waits to match other measuresWe average waits to match other measures
bull Schedulers must correctly enter DD
Summary of Wait Time Measures bull New versus established patients
bull Time Stamp RetrospectiveTime Stamp Retrospective
bull FNA‐Access Prospective A CD
Time Stamp CD Access CD
OFNA WRX 152010152010 1102010 1152010 12120101102010 1152010 1212010
Access DD
W Z DD Time Stamp
X YW Y Z 152010 452010 4152010 4202010
X
Research QuestionResearch Question
H ll d lt ti f itbull How well do alternative measures of wait times predict patient satisfaction
Surveys on Patient SatisfactionSurveys on Patient Satisfaction
bull Access is a key component of satisfaction
bull Difficult to judge technical quality
bull Patients focus on practical aspects of their healthcare experience
Satisfaction Data bull 2010 Survey of Healthcare Experiences of Patients (SHEP) ‐Managed by Office of Quality and Performance ‐Modeled after Consumer Assessment of Healthcare Providers and SystemsProviders and Systems
bull Simple random sample of patients with completed appointments each month bull Visit date of appointment is recorded bull n=221924 people
Access Satisfaction MeasuresAccess Satisfaction Measures 1) Appt as soon as wanted (Timely appt)
2) Ease of getting test or treatment in last 12 months (Treatment access)
3) Ease of accessing specialist visit (Specialist access)
bull Asked for the last 12 months ‐Most recent visit is likely in mind
bull Coded as AlwaysUsually vs SometimesNever
General Satisfaction MeasuresGeneral Satisfaction Measures
4) Rate VA health care in last 12 months (VA rating) O l f 1 ( ) 10 (b )‐ On a scale of 1 (worst) to 10 (best)
‐ 9 or 10 versus lt=8
5) Satisfaction with VA at recent visit (satisfied)5) Satisfaction with VA at recent visit (satisfied)
‐ Likert scale 1 (least) to 7 (most) of satisfaction
‐ 6 or 7 versus lt=5
atc ed to s t date e de t as se ected o sa e
AnalysesAnalyses
bullbull Logistic regression predicting satisfaction Logistic regression predicting satisfaction
bull Wait time measuresWait time measures ‐ High volume clinic stops ‐ Patientprovider interactions ‐ All major medical sub‐specialties ‐ Facility level monthly averages (including Access measures) ‐Matched to visit date when respondent was selected for samppleespo ‐ Quartiles
‐
Analyses ContinuedAnalyses Continued
bull Risk adjustors from SHEP bull Risk adjustors from SHEP ‐ Sex
‐ Race
‐ Age
‐ Education
‐ Health care utilizationHealth care utilization
‐ Health status
Descriptive Statistics of SampleDescriptive Statistics of Sample Demographics Mean or
Age 67
Male 95
Had some college 53
White 79
Black 10
Hisppanic 5
Other 6
gtgt 5=5 visits visits to a doctorto a doctor s rsquos office in last 12 office in last 12 3131 months
Excellentvery good self‐reported health 25Excellentvery good self reported health status in last 12 months
25
Descriptive Statistics of Satisfaction MMeasures
Satisfaction Measure
Timely visit AlwaysUsually vs SometimesNever 83
Treatment access AlwaysUsually vs SometimesNever 85
Specialist access AlwaysUsually vs SometimesNever 82
VA rating in last 12 months 9 or 10 versus lt9 78
VA satisfaction at most recent visit 6 7 6 82826 or 7 versus lt6
Mean Wait Times 35
3030
25
Wait in Dayys
20
15
10
5
0
Time Stamp CD
Time Stamp DD Time Stamp DD
30913018
FNA
2007
1797
Access CD
1558
Access DD
789 791
472
272252
New Patients Established Patients
New Patient ResultsNew Patient Results
H ll d lt ti f itbull How well do alternative measures of wait times predict patient satisfaction
‐ Longer waits predict lower satisfaction
New Patient FNACD Timely Visit 1
09
08
07
Odds 06 Ratio
05
04
0 3 03
02
0 1 01
0 FNAFNA Time Stamp CD Time Stamp CD
Quartile 2
QQuartil ile 33
Quartile 4
Access CD Access CD
Everything is significant at Plt005 Reference group is VA facilities in quartile 1
New Patient DD Timely Visit 115
11
Odds Ratio
105 Quartile 2
1
Quartile 3
Quartile 4
095
0 909 Time Stamp DD Access DD
Significant at Plt005 in wrong direction Reference group is VA facilities in quartile 1
08 08 08 09 09
New Patient Waits Predicting Satisfaction
Measure Timely Treatment Specialist VA rating VA Appt Access Access satisfaction
FNA (ref=Q1) Q2 Q3
089 082
093 084
093 084
095 092
095 091Q3
Q4 073 073 074 086 085
Time Stamp CD ( f Q1) (ref=Q1) Q2 086 087 086 096 094 Q3 078 080 081 091 090 Q4 067 065 067 083 082
093 091 0 86 Q4 073 072 072 089 086
Access CD (ref=Q1)(ref=Q1) Q2 Q3 Q4
083 085 0 73
084 084 0 72
086 085 0 72
093 093 0 89
Numbers are odds ratio from logistic regression Significant at Plt=005
New Patient Waits Predicting Satisfaction
Measure Timely Treatment Specialist VA rating VA Appt Access Access satisfaction
Time Stamp DD (ref=Q1) Q2 106 101 105 100Q2 Q3 Q4
106 110 106
101 106 102
105 110 107
100 098 101
101101 101 102
A DDAccess DD (ref=Q1) Q2 098 097 098 094 096 Q3 112 109 111 100 103 Q4 110 106 111 100 103
Numbers are odds ratio from logistic regressionNumbers are odds ratio from logistic regression Significant at Plt=005 Significant in wrong direction
New Patient Results
bull FNA and create date measures are most reliablereliable
‐ Predict all 5 satisfaction measures
bull New patients want to be seen as soon as possible bull New patients want to be seen as soon as possible
‐ Date an appointment request was originally
made is reliable
Established Patient ResultsEstablished Patient Results
H ll d lt ti f itbull How well do alternative measures of wait times predict patient satisfaction
‐ Longer waits predict lower satisfaction
Established Patient FNACD
104
1 02 102
100
098
Odds 096
Ratio 094
092
090
0 88 088
086
084
FNA
Ti l Vi itTimely Visit
Time Stamp CD
Q tilQuartile 22
Quartile 3
Quartile 4
Access CD
Significant at Plt005 Reference group is VA facilities in quartile 1
Established Patient DD Timely Visit 120
100
Odds Ratio 0 60
080
Quartile 2
Ratio
0 40
060 Quartile 3
Quartile 4
020
040
000
020
Time Stamp DD Access DD Significant at Plt005 Significant in wrong direction at Plt005 Reference group is VA facilities in quartile 1
Established Patient Waits Predicting Satisfaction M TiTimelly T t t Speciialistt VA ti VAMeasure Treatment S li VA rating VA
Appt Access Access satisfaction
Q4 090 090 090
( Q ) Q2 Q3 Q4
102 100 0 90
FNA (ref=Q1) 099 098 0 93093
099 102 0 90
101 103 0 90
097 095 0 90090
Time Stamp CD (ref=Q1) Q2 092 090 094 096 099 Q3 091 087 089 094 093 Q4 102 096 099 107 102
Access CD (ref=Q1) Q2Q2 Q3 Q4
0 94 0 93 0 94 0 94 0 98 094 096 102
093 095 098
094 093 097
094 098 095
098 098 101
Numbers are odds ratio from logistic regression Significant at Plt=005 Significant in the wrong direction
Established Patient Waits Predicting Satisfaction
Measure Timely Treatment Specialist VA rating VA Appt Access Access satisfaction
Time Stamp DD (ref=Q1) Q2 099 097 098 094Q2 Q3 Q4
099 105 096
097 103 094
098 102 097
094 098 095
097097 100 097
A DDAccess DD (ref=Q1) Q2 091 090 088 094 092 Q3 086 086 083 086 087 Q4 080 077 076 086 084
Numbers are odds ratio from logistic regressionNumbers are odds ratio from logistic regression Significant at Plt=005 Significant in wrong direction
Established Patient ResultsEstablished Patient Results
bull Access list desired date is most reliable ‐ Includes no‐showscancellations ‐More accurate measure of supply in systemMore accurate measure of supply in system
bullbull DD reflects established patient preferences DD reflects established patient preferences versus FNACD measures
Polic Implications Policy Implications bull M lti l it ti d dMultiple wait time measures needed ‐ New versus established patients
bull New patients want to be seen right away ‐ Change in health status ‐ Appointment request dates are reliable ‐ Capacity and create date measures
Polic Implications Contin edPolicy Implications Continued bull E t bli h d ti t t i iti it ti Established patients may not prioritize wait times ‐ Continuity of care ‐ Convenient timeConvenient time
bull VA is a leader in recognizing new versus established patient compl itlexity
bullbull Future work will predict health outcomes Future work will predict health outcomes
Questions or CommentsQuestions or Comments
Julia PrenticeJulia Prentice JuliaPrenticevagov
(857) 364 6057(857)-364-6057 wwwhcferesearchgov
Resources 1 Prentice J Pizer SD (2007) Delayed Access to Health Care and Mortality Health Services Research
42(2) 644-662 2 Prentice JC Pizer SD (2008) Waiting Times and Ambulatory Care Sensitive Condition Hospitalizations Health
Services and Outcomes Research Methodology 8(1)1-18 33 Pizer SD Prentice JC (2011) What Are the Consequences of Waiting for Health Care in the Veteran Population Journal of GeneralPizer SD Prentice JC (2011) What Are the Consequences of Waiting for Health Care in the Veteran Population Journal of General
Internal Medicine 26(supplement 2)676-682 4 Pizer SD Prentice JC (2011) Time is money Outpatient waiting times and health insurance choices of elderly veterans in the United
States Journal of Health Economics 30(4)626-636 5 Prentice JC Fincke BG Miller DR Pizer SD (2011) Outpatient Waiting Times and Diabetes Care Quality
IImprovementt AAmeriican Journall off M Managed C d Care 17(2)e4343-e54J 17(2) 54 6 Prentice JC Fincke BG Miller DR Pizer SD (2012) Waiting for Primary Care and Health Outcomes among Elderly Patients With
Diabetes Health Services Research 47(1)46-67
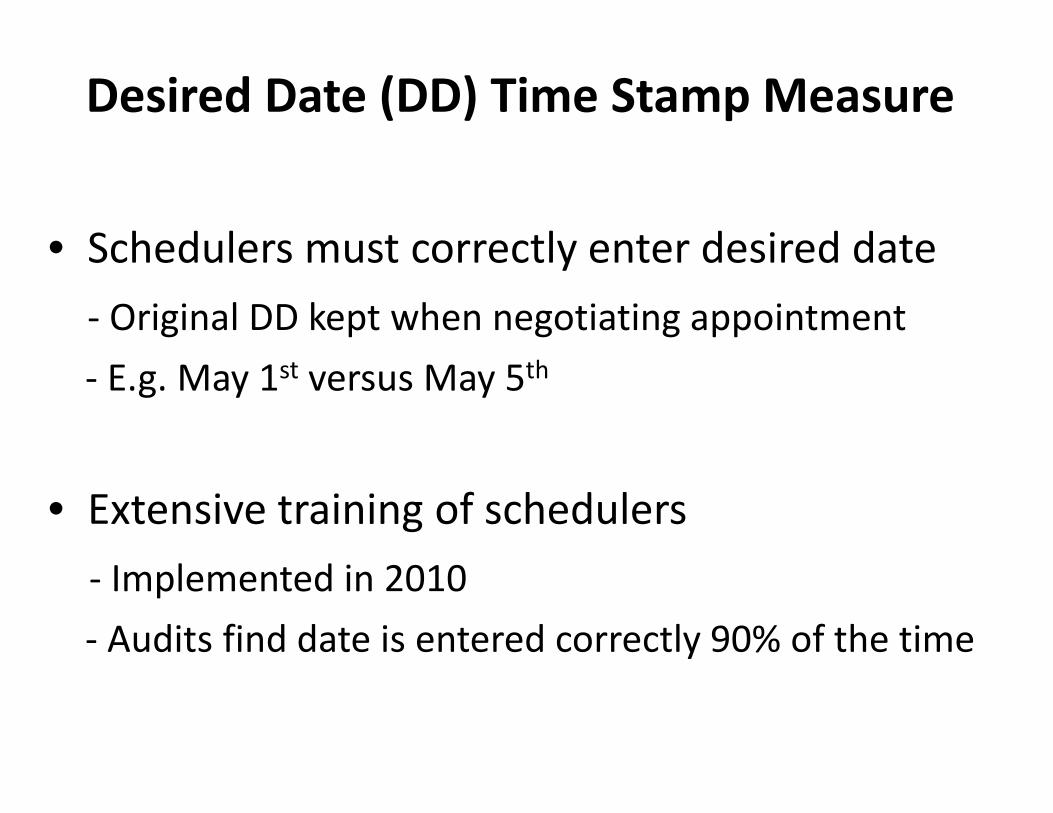
Desired Date (DD) Time Stamp MeasureDate (DD) Time Stamp eDesired Measur
bull Schedulers must correctly enter desired date
O i i h ti i t t ‐ Original DD k t l DD kept when negotitiating appointment
‐ Eg May 1st versus May 5th
bullbull Extensive training of schedulers Extensive training of schedulers
‐ Implemented in 2010
‐ Audits find date is entered correctly 90 of the time
Prospective Access MeasuresProspective Access Measures
bull Time stamp measures are retrospective ‐ Only includes completed appointmentsOnly includes completed appointments ‐ Patient no‐shows not included ‐ Cancellations that are not rescheduled not includedCancellations that are not rescheduled not included
bull AAccess lilist measures are prospectiive ‐ Calculate waits off of pending appointments ‐ Includes no‐shows and cancellations
Access List Create Date Calculation
bull New patient A requests an appt ASAP on January 5 2010
bull Appointment is scheduled for February 10 2010
bull Bi‐monthlyy repport dates ((1 and 15th of each month))
bull Appointment is not eligible for calculation until CD is equal to or before report dateequal to or before report date
bull 112010 report‐ appt not included
d )bull 1152010 report‐Wait time = 10 days ((R2‐O)
bull 212010 report‐Wait time = 26 days (R3‐O) Access CD
O Access CD
WR2R1 O R3 112010
152010
1152010 212010 2102010
Access List CD Measure
bullbull Performance measure is percent of appts Performance measure is percent of appts that have less than a 14 day wait
‐We average waits to match other measures
bull Influenced by how follow‐up appts are sch dhedul d ( led (eg recallll systtems))
Access List Desired Date Calculation
bull Established Patient B requests an April 5 2010Established Patient B requests an April 5 2010 follow‐up appointment on January 5 2010
A i i h d l d f M 5 2010bull Appointment is scheduled for May 5 2010
bull Repport dates are 1st and 15th of each month
bull 4152010 report‐Wait time= 10 days (R1‐O)
bull 512010 report‐Wait time= 25 days (R2‐O)
Access DD Access DD Access DD
X O WX O R1R1 R2R2 W 152010
452010
4152010 512010 552010
Access List DD Measure
bull Performance measure is percent of appts that have less than a 14 day wait
‐We average waits to match other measuresWe average waits to match other measures
bull Schedulers must correctly enter DD
Summary of Wait Time Measures bull New versus established patients
bull Time Stamp RetrospectiveTime Stamp Retrospective
bull FNA‐Access Prospective A CD
Time Stamp CD Access CD
OFNA WRX 152010152010 1102010 1152010 12120101102010 1152010 1212010
Access DD
W Z DD Time Stamp
X YW Y Z 152010 452010 4152010 4202010
X
Research QuestionResearch Question
H ll d lt ti f itbull How well do alternative measures of wait times predict patient satisfaction
Surveys on Patient SatisfactionSurveys on Patient Satisfaction
bull Access is a key component of satisfaction
bull Difficult to judge technical quality
bull Patients focus on practical aspects of their healthcare experience
Satisfaction Data bull 2010 Survey of Healthcare Experiences of Patients (SHEP) ‐Managed by Office of Quality and Performance ‐Modeled after Consumer Assessment of Healthcare Providers and SystemsProviders and Systems
bull Simple random sample of patients with completed appointments each month bull Visit date of appointment is recorded bull n=221924 people
Access Satisfaction MeasuresAccess Satisfaction Measures 1) Appt as soon as wanted (Timely appt)
2) Ease of getting test or treatment in last 12 months (Treatment access)
3) Ease of accessing specialist visit (Specialist access)
bull Asked for the last 12 months ‐Most recent visit is likely in mind
bull Coded as AlwaysUsually vs SometimesNever
General Satisfaction MeasuresGeneral Satisfaction Measures
4) Rate VA health care in last 12 months (VA rating) O l f 1 ( ) 10 (b )‐ On a scale of 1 (worst) to 10 (best)
‐ 9 or 10 versus lt=8
5) Satisfaction with VA at recent visit (satisfied)5) Satisfaction with VA at recent visit (satisfied)
‐ Likert scale 1 (least) to 7 (most) of satisfaction
‐ 6 or 7 versus lt=5
atc ed to s t date e de t as se ected o sa e
AnalysesAnalyses
bullbull Logistic regression predicting satisfaction Logistic regression predicting satisfaction
bull Wait time measuresWait time measures ‐ High volume clinic stops ‐ Patientprovider interactions ‐ All major medical sub‐specialties ‐ Facility level monthly averages (including Access measures) ‐Matched to visit date when respondent was selected for samppleespo ‐ Quartiles
‐
Analyses ContinuedAnalyses Continued
bull Risk adjustors from SHEP bull Risk adjustors from SHEP ‐ Sex
‐ Race
‐ Age
‐ Education
‐ Health care utilizationHealth care utilization
‐ Health status
Descriptive Statistics of SampleDescriptive Statistics of Sample Demographics Mean or
Age 67
Male 95
Had some college 53
White 79
Black 10
Hisppanic 5
Other 6
gtgt 5=5 visits visits to a doctorto a doctor s rsquos office in last 12 office in last 12 3131 months
Excellentvery good self‐reported health 25Excellentvery good self reported health status in last 12 months
25
Descriptive Statistics of Satisfaction MMeasures
Satisfaction Measure
Timely visit AlwaysUsually vs SometimesNever 83
Treatment access AlwaysUsually vs SometimesNever 85
Specialist access AlwaysUsually vs SometimesNever 82
VA rating in last 12 months 9 or 10 versus lt9 78
VA satisfaction at most recent visit 6 7 6 82826 or 7 versus lt6
Mean Wait Times 35
3030
25
Wait in Dayys
20
15
10
5
0
Time Stamp CD
Time Stamp DD Time Stamp DD
30913018
FNA
2007
1797
Access CD
1558
Access DD
789 791
472
272252
New Patients Established Patients
New Patient ResultsNew Patient Results
H ll d lt ti f itbull How well do alternative measures of wait times predict patient satisfaction
‐ Longer waits predict lower satisfaction
New Patient FNACD Timely Visit 1
09
08
07
Odds 06 Ratio
05
04
0 3 03
02
0 1 01
0 FNAFNA Time Stamp CD Time Stamp CD
Quartile 2
QQuartil ile 33
Quartile 4
Access CD Access CD
Everything is significant at Plt005 Reference group is VA facilities in quartile 1
New Patient DD Timely Visit 115
11
Odds Ratio
105 Quartile 2
1
Quartile 3
Quartile 4
095
0 909 Time Stamp DD Access DD
Significant at Plt005 in wrong direction Reference group is VA facilities in quartile 1
08 08 08 09 09
New Patient Waits Predicting Satisfaction
Measure Timely Treatment Specialist VA rating VA Appt Access Access satisfaction
FNA (ref=Q1) Q2 Q3
089 082
093 084
093 084
095 092
095 091Q3
Q4 073 073 074 086 085
Time Stamp CD ( f Q1) (ref=Q1) Q2 086 087 086 096 094 Q3 078 080 081 091 090 Q4 067 065 067 083 082
093 091 0 86 Q4 073 072 072 089 086
Access CD (ref=Q1)(ref=Q1) Q2 Q3 Q4
083 085 0 73
084 084 0 72
086 085 0 72
093 093 0 89
Numbers are odds ratio from logistic regression Significant at Plt=005
New Patient Waits Predicting Satisfaction
Measure Timely Treatment Specialist VA rating VA Appt Access Access satisfaction
Time Stamp DD (ref=Q1) Q2 106 101 105 100Q2 Q3 Q4
106 110 106
101 106 102
105 110 107
100 098 101
101101 101 102
A DDAccess DD (ref=Q1) Q2 098 097 098 094 096 Q3 112 109 111 100 103 Q4 110 106 111 100 103
Numbers are odds ratio from logistic regressionNumbers are odds ratio from logistic regression Significant at Plt=005 Significant in wrong direction
New Patient Results
bull FNA and create date measures are most reliablereliable
‐ Predict all 5 satisfaction measures
bull New patients want to be seen as soon as possible bull New patients want to be seen as soon as possible
‐ Date an appointment request was originally
made is reliable
Established Patient ResultsEstablished Patient Results
H ll d lt ti f itbull How well do alternative measures of wait times predict patient satisfaction
‐ Longer waits predict lower satisfaction
Established Patient FNACD
104
1 02 102
100
098
Odds 096
Ratio 094
092
090
0 88 088
086
084
FNA
Ti l Vi itTimely Visit
Time Stamp CD
Q tilQuartile 22
Quartile 3
Quartile 4
Access CD
Significant at Plt005 Reference group is VA facilities in quartile 1
Established Patient DD Timely Visit 120
100
Odds Ratio 0 60
080
Quartile 2
Ratio
0 40
060 Quartile 3
Quartile 4
020
040
000
020
Time Stamp DD Access DD Significant at Plt005 Significant in wrong direction at Plt005 Reference group is VA facilities in quartile 1
Established Patient Waits Predicting Satisfaction M TiTimelly T t t Speciialistt VA ti VAMeasure Treatment S li VA rating VA
Appt Access Access satisfaction
Q4 090 090 090
( Q ) Q2 Q3 Q4
102 100 0 90
FNA (ref=Q1) 099 098 0 93093
099 102 0 90
101 103 0 90
097 095 0 90090
Time Stamp CD (ref=Q1) Q2 092 090 094 096 099 Q3 091 087 089 094 093 Q4 102 096 099 107 102
Access CD (ref=Q1) Q2Q2 Q3 Q4
0 94 0 93 0 94 0 94 0 98 094 096 102
093 095 098
094 093 097
094 098 095
098 098 101
Numbers are odds ratio from logistic regression Significant at Plt=005 Significant in the wrong direction
Established Patient Waits Predicting Satisfaction
Measure Timely Treatment Specialist VA rating VA Appt Access Access satisfaction
Time Stamp DD (ref=Q1) Q2 099 097 098 094Q2 Q3 Q4
099 105 096
097 103 094
098 102 097
094 098 095
097097 100 097
A DDAccess DD (ref=Q1) Q2 091 090 088 094 092 Q3 086 086 083 086 087 Q4 080 077 076 086 084
Numbers are odds ratio from logistic regressionNumbers are odds ratio from logistic regression Significant at Plt=005 Significant in wrong direction
Established Patient ResultsEstablished Patient Results
bull Access list desired date is most reliable ‐ Includes no‐showscancellations ‐More accurate measure of supply in systemMore accurate measure of supply in system
bullbull DD reflects established patient preferences DD reflects established patient preferences versus FNACD measures
Polic Implications Policy Implications bull M lti l it ti d dMultiple wait time measures needed ‐ New versus established patients
bull New patients want to be seen right away ‐ Change in health status ‐ Appointment request dates are reliable ‐ Capacity and create date measures
Polic Implications Contin edPolicy Implications Continued bull E t bli h d ti t t i iti it ti Established patients may not prioritize wait times ‐ Continuity of care ‐ Convenient timeConvenient time
bull VA is a leader in recognizing new versus established patient compl itlexity
bullbull Future work will predict health outcomes Future work will predict health outcomes
Questions or CommentsQuestions or Comments
Julia PrenticeJulia Prentice JuliaPrenticevagov
(857) 364 6057(857)-364-6057 wwwhcferesearchgov
Resources 1 Prentice J Pizer SD (2007) Delayed Access to Health Care and Mortality Health Services Research
42(2) 644-662 2 Prentice JC Pizer SD (2008) Waiting Times and Ambulatory Care Sensitive Condition Hospitalizations Health
Services and Outcomes Research Methodology 8(1)1-18 33 Pizer SD Prentice JC (2011) What Are the Consequences of Waiting for Health Care in the Veteran Population Journal of GeneralPizer SD Prentice JC (2011) What Are the Consequences of Waiting for Health Care in the Veteran Population Journal of General
Internal Medicine 26(supplement 2)676-682 4 Pizer SD Prentice JC (2011) Time is money Outpatient waiting times and health insurance choices of elderly veterans in the United
States Journal of Health Economics 30(4)626-636 5 Prentice JC Fincke BG Miller DR Pizer SD (2011) Outpatient Waiting Times and Diabetes Care Quality
IImprovementt AAmeriican Journall off M Managed C d Care 17(2)e4343-e54J 17(2) 54 6 Prentice JC Fincke BG Miller DR Pizer SD (2012) Waiting for Primary Care and Health Outcomes among Elderly Patients With
Diabetes Health Services Research 47(1)46-67
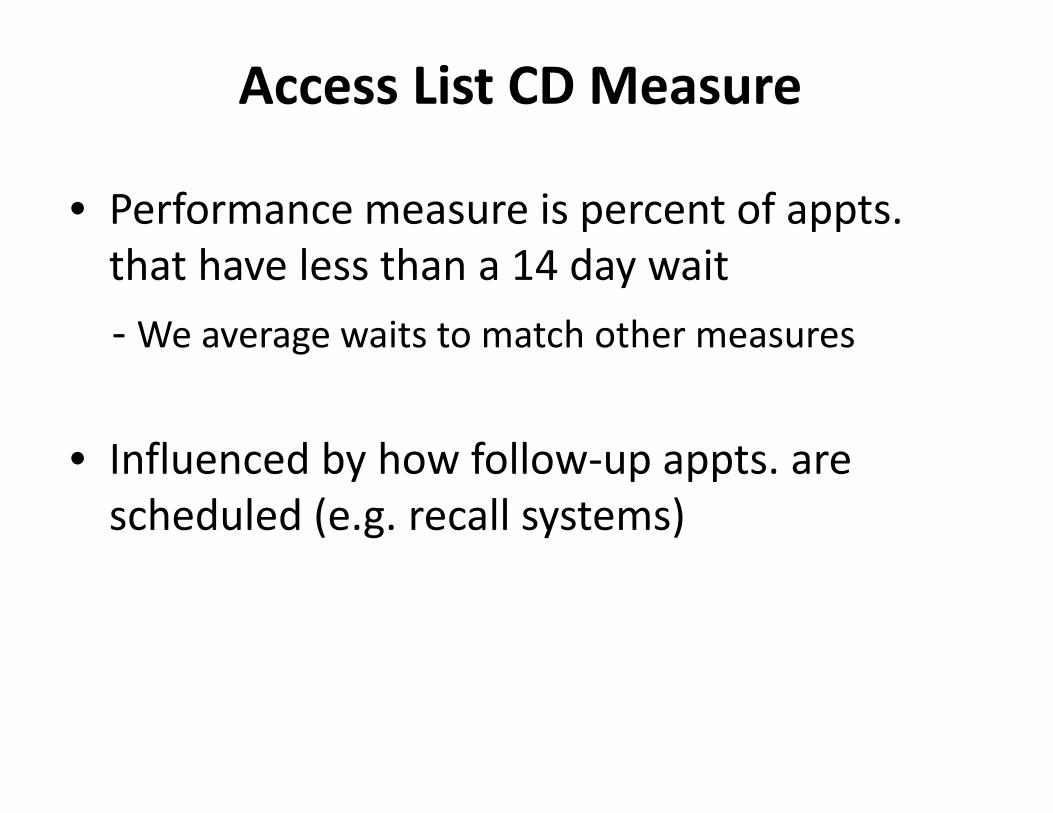
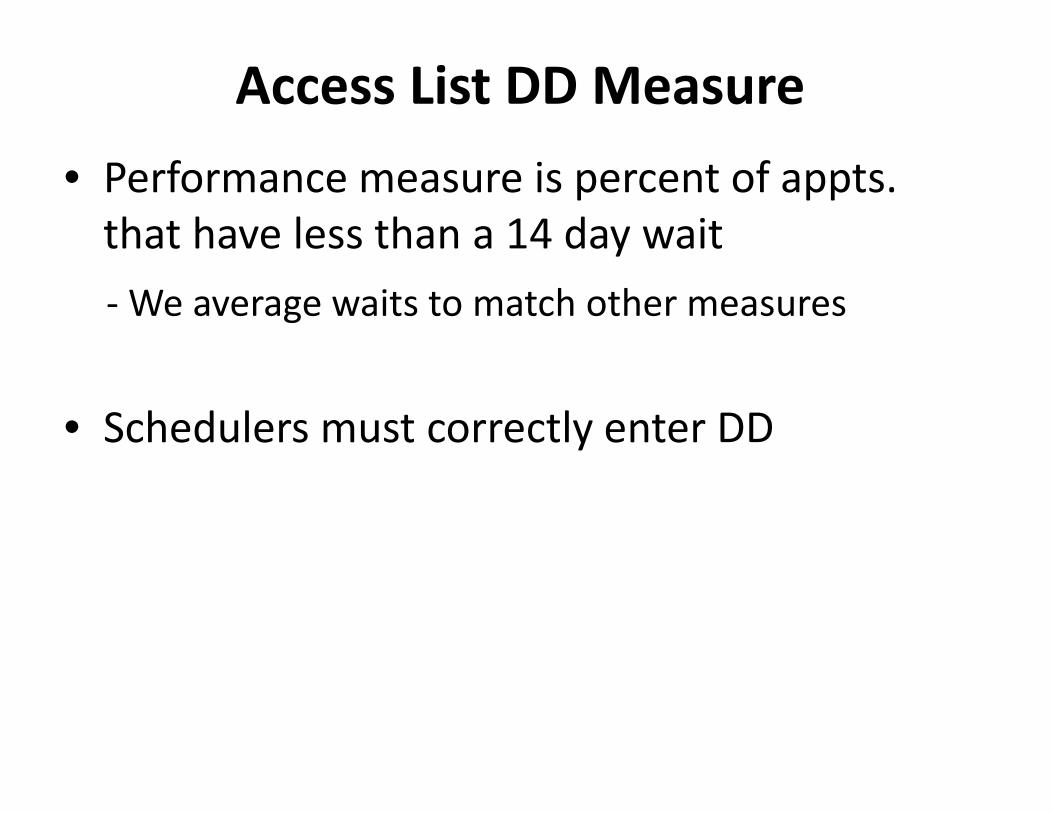
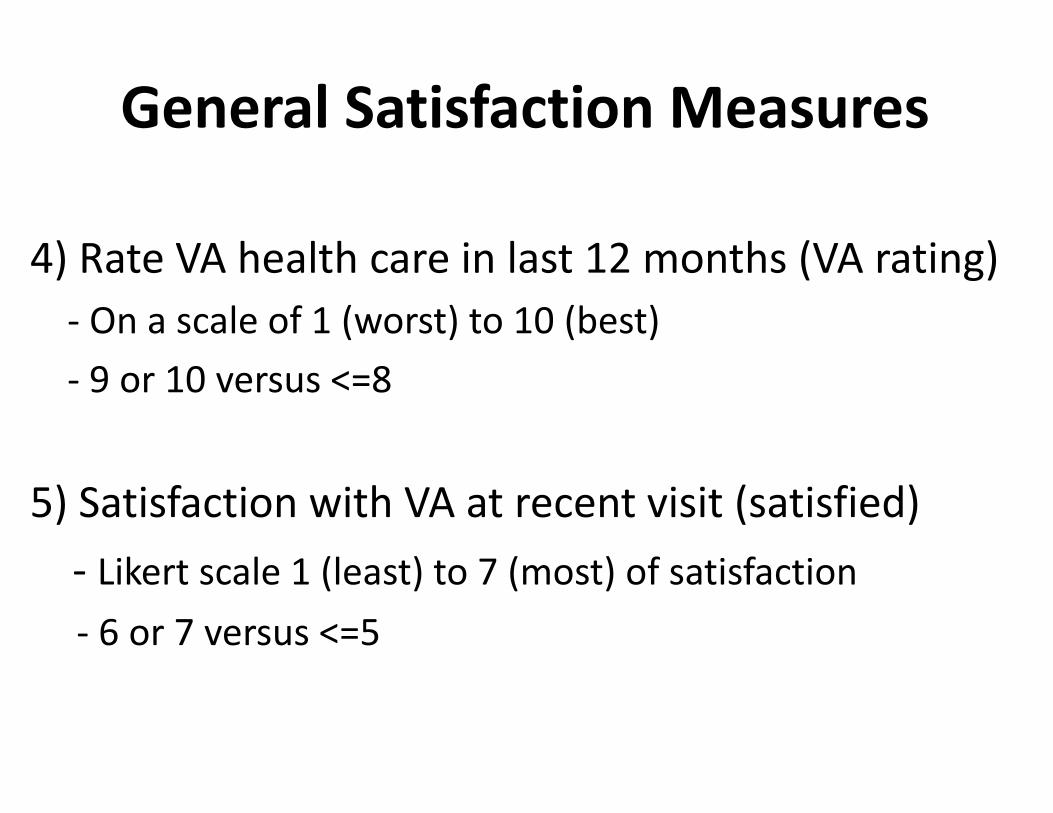
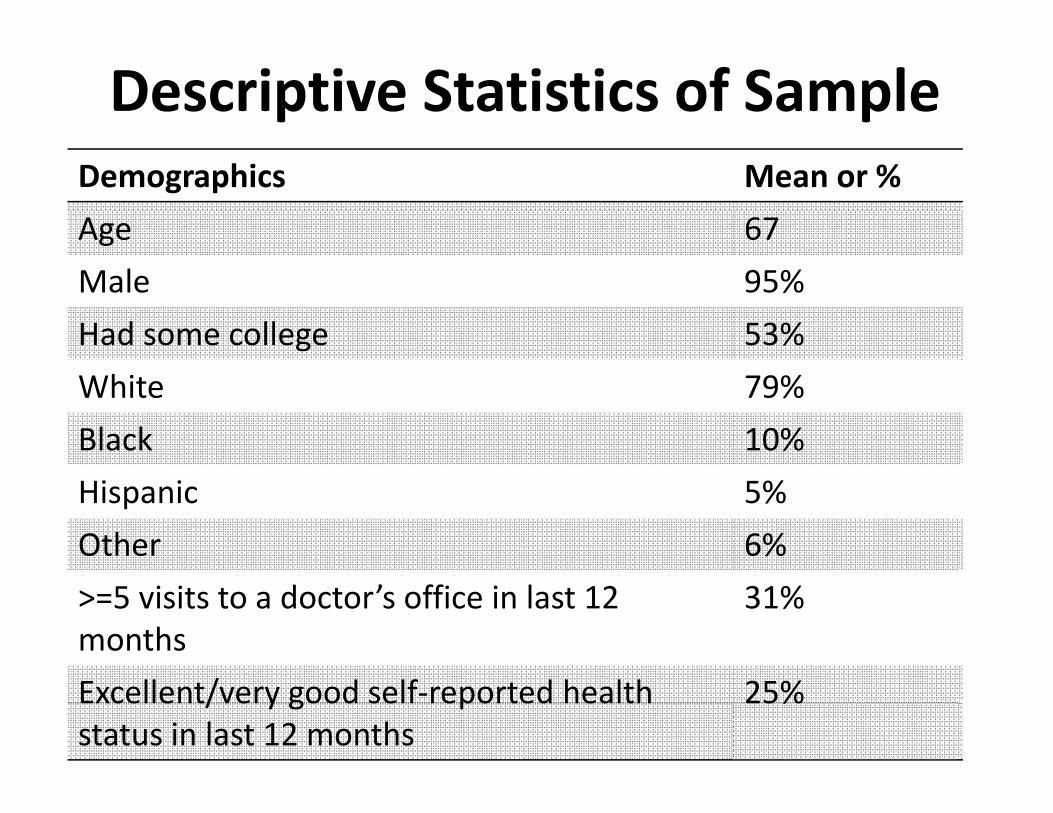

Established Patient ResultsEstablished Patient Results
H ll d lt ti f itbull How well do alternative measures of wait times predict patient satisfaction
‐ Longer waits predict lower satisfaction
Established Patient FNACD
104
1 02 102
100
098
Odds 096
Ratio 094
092
090
0 88 088
086
084
FNA
Ti l Vi itTimely Visit
Time Stamp CD
Q tilQuartile 22
Quartile 3
Quartile 4
Access CD
Significant at Plt005 Reference group is VA facilities in quartile 1
Established Patient DD Timely Visit 120
100
Odds Ratio 0 60
080
Quartile 2
Ratio
0 40
060 Quartile 3
Quartile 4
020
040
000
020
Time Stamp DD Access DD Significant at Plt005 Significant in wrong direction at Plt005 Reference group is VA facilities in quartile 1
Established Patient Waits Predicting Satisfaction M TiTimelly T t t Speciialistt VA ti VAMeasure Treatment S li VA rating VA
Appt Access Access satisfaction
Q4 090 090 090
( Q ) Q2 Q3 Q4
102 100 0 90
FNA (ref=Q1) 099 098 0 93093
099 102 0 90
101 103 0 90
097 095 0 90090
Time Stamp CD (ref=Q1) Q2 092 090 094 096 099 Q3 091 087 089 094 093 Q4 102 096 099 107 102
Access CD (ref=Q1) Q2Q2 Q3 Q4
0 94 0 93 0 94 0 94 0 98 094 096 102
093 095 098
094 093 097
094 098 095
098 098 101
Numbers are odds ratio from logistic regression Significant at Plt=005 Significant in the wrong direction
Established Patient Waits Predicting Satisfaction
Measure Timely Treatment Specialist VA rating VA Appt Access Access satisfaction
Time Stamp DD (ref=Q1) Q2 099 097 098 094Q2 Q3 Q4
099 105 096
097 103 094
098 102 097
094 098 095
097097 100 097
A DDAccess DD (ref=Q1) Q2 091 090 088 094 092 Q3 086 086 083 086 087 Q4 080 077 076 086 084
Numbers are odds ratio from logistic regressionNumbers are odds ratio from logistic regression Significant at Plt=005 Significant in wrong direction
Established Patient ResultsEstablished Patient Results
bull Access list desired date is most reliable ‐ Includes no‐showscancellations ‐More accurate measure of supply in systemMore accurate measure of supply in system
bullbull DD reflects established patient preferences DD reflects established patient preferences versus FNACD measures
Polic Implications Policy Implications bull M lti l it ti d dMultiple wait time measures needed ‐ New versus established patients
bull New patients want to be seen right away ‐ Change in health status ‐ Appointment request dates are reliable ‐ Capacity and create date measures
Polic Implications Contin edPolicy Implications Continued bull E t bli h d ti t t i iti it ti Established patients may not prioritize wait times ‐ Continuity of care ‐ Convenient timeConvenient time
bull VA is a leader in recognizing new versus established patient compl itlexity
bullbull Future work will predict health outcomes Future work will predict health outcomes
Questions or CommentsQuestions or Comments
Julia PrenticeJulia Prentice JuliaPrenticevagov
(857) 364 6057(857)-364-6057 wwwhcferesearchgov
Resources 1 Prentice J Pizer SD (2007) Delayed Access to Health Care and Mortality Health Services Research
42(2) 644-662 2 Prentice JC Pizer SD (2008) Waiting Times and Ambulatory Care Sensitive Condition Hospitalizations Health
Services and Outcomes Research Methodology 8(1)1-18 33 Pizer SD Prentice JC (2011) What Are the Consequences of Waiting for Health Care in the Veteran Population Journal of GeneralPizer SD Prentice JC (2011) What Are the Consequences of Waiting for Health Care in the Veteran Population Journal of General
Internal Medicine 26(supplement 2)676-682 4 Pizer SD Prentice JC (2011) Time is money Outpatient waiting times and health insurance choices of elderly veterans in the United
States Journal of Health Economics 30(4)626-636 5 Prentice JC Fincke BG Miller DR Pizer SD (2011) Outpatient Waiting Times and Diabetes Care Quality
IImprovementt AAmeriican Journall off M Managed C d Care 17(2)e4343-e54J 17(2) 54 6 Prentice JC Fincke BG Miller DR Pizer SD (2012) Waiting for Primary Care and Health Outcomes among Elderly Patients With
Diabetes Health Services Research 47(1)46-67
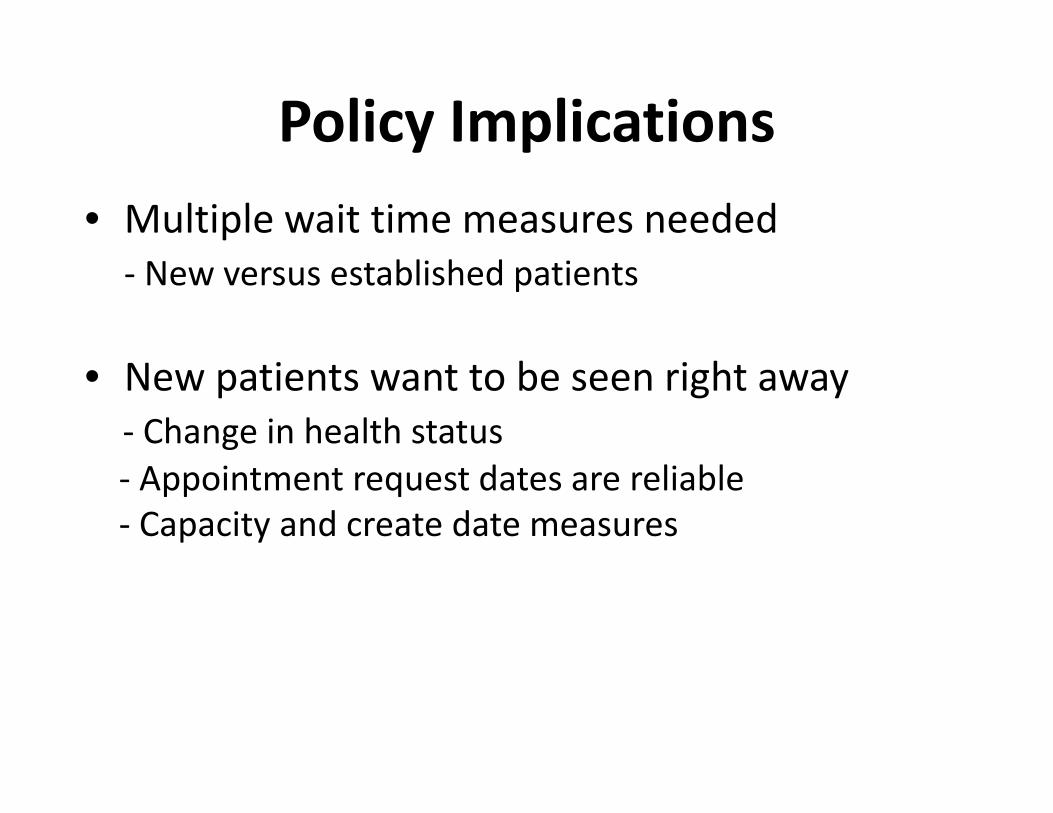