balajitelefilms.combalajitelefilms.com/pdf/quaterlyreports/fy2017_18/btl...videos (outside of...
TRANSCRIPT


Balaji Telefilms LimitedBalaji Telefilms LimitedBalaji Telefilms LimitedBalaji Telefilms Limited C-13, Balaji House, Dalia Industrial Estate, Opp. Laxmi Industries,
New Link Road, Andheri (West), Mumbai 400 053 Tel: 40698000 Fax: 40698181/82/83
Website: www.balajitelefilms.com CIN: L99999MH1994PLC082802
Annexure -2
Nachiket Pantvaidya appointed as Group COO Balaji Telefilms, to
continue to remain as CEO AltBalaji
Mumbai, India, November 10, 2017
The Board of Balaji Telefilms Limited at its board meeting today approved the
appointment of Mr Nachiket Pantvaidya as Group COO Balaji Telefilms Limited. Nachiket
will continue to remain as CEO AltBalaji while having additional responsibilities at Balaji
Telefilms across the television and movies business.
Nachiket joined AltBalaji in December 2015 and has very quickly scaled AltBalaji to be
one of the leading OTT player in the country with the largest collection of original shows
in Hindi and other Indian languages. He brings with him extensive operational
experience and an excellent understanding of the entertainment ecosystem having
worked across all facets of the media industry. Nachiket has previously worked in senior
leadership roles across Sony Entertainment Television, Star TV Network, Fox Television
Studio, BBC and Disney.
At Balaji Telefilms as Group COO Nachiket will work closely with the television and
movies business to drive profitability and operational excellence across the Group. He
will help lead the development and implementation of strong processes and controls
across the group to deliver on our business plans.
Commenting on the appointment Mrs Shobha Kapoor Managing Director Balaji
Telefilms said "Nachiket joined AltBalaji nearly two years ago and has successfully
created a strong and valuable B2C brand at AltBalaji. He brings strong leadership and
management skills and will now work closely with the television and movies business to
help transform the company as we now work to reach Indians globally across multiple
screen formats. We wish Nachiket the very best and look forward to bringing together all
our collective strengths and expertise to create value for our shareholders”
About Balaji Telefilms Limited:
Balaji Telefilms is India’s leading integrated media conglomerate operating across
television, movie and digital content production. The Company, under the stewardship of
Mrs. Shobha Kapoor and Ms.Ekta Kapoor, enjoys market leadership in the television
content industry for over two decades with an exemplary track record for content
creation across genres and target groups.
Balaji Telefilms is a household name which has produced some of the best television
serials in the country including the famous K Series of daily soaps such as Kyunki Saas
Bhi Kabhi Bahu Thi and Kahaani Ghar Ghar Ki. More recently it has created an extremely
successful mystical fantasy series of Naagin 1 and Naagin 2, paving the way for weekend
fiction based programming.
Over the years the company through its movies business has also demonstrated success
in pioneering the production of a differentiated cinematic content across different genres.
Balaji Motion Pictures has been involved in creating a number of commercial as well as
critically acclaimed movies such as The Dirty Picture, LSD, Once Upon a Time, Ek Villain,
Udtaa Punjab and Half Girlfriend
Recently, the Company has launched ALTBalaji, a multi-device Subscription Video On
Demand platform that offers original, premium and exclusive content for a global digital
audiences. ALTBalaji is the group’s strategic foray into the Digital B2C entertainment
category to build a consumer facing brand that gives audiences the content they want to
watch - whenever, wherever and however. These original stories have been appreciated
by the global audiences that have been starved of well-made and interesting stories.
ALTBalaji has over 10 million downloads and subscribers from over 80 countries.
For further details please contact:
Sanjay Dwivedi–Group CFO
Simmi Singh Bisht - Group Head Secretarial
Balaji Telefilms Limited
Tel: +91 22 40698000
Fax: +91 22 40698181
Email: [email protected]
Safe Harbor:
Certain statements in this update concerning our future growth prospects are forward looking
statements, which involve a number of risks and uncertainties that could cause actual results to
differ materially from those in such forward-looking statements. The achievement of such results is
subject to risks, uncertainties and even inaccurate assumptions. Readers may please take a note of
this.
Unique, Distinctive, Disruptive
Unique, Distinctive, Disruptive
Quarterly Performance Review – Q2 FY18 and H1 FY18

Unique, Distinctive, Disruptive
Operating highlights for the quarter
AltBalaji
• Ranked number 3 video streaming app by revenue in the latest App Annie survey
• 8.9m app downloads and growing. The app is available globally and on all the leading OS platforms
• Original shows added in the quarter include Class of 2017, Cybersquad, Pammi Aunty and over 25 hours of stand up comedy in Hindi, Marathi, Gujarati and Punjabi. AltBalaji now has one of the largest collection of original comedy videos (outside of Youtube) in Hindi and other Indian regional languages
• AltBalaji now available to Vodafone users as part of Vodafone Play. Also entered into more B2B partnerships across a range of OEMs, telecom / internet service providers and payment wallets
Television Business
• 7 shows were running during the quarter – quarter saw the start of a new spin off series on Zee TV called KundaliBhagya based on the hit show Kumkum Bhagya running on the same channel
• Show launched for Star Plus for their afternoon programming slot came to an end this quarter as the channel has discontinued telecasting original shows in the afternoon slot
• Balaji Telefilms produced shows continue to dominate the BARC ratings and this is reflective of our positioning as a leading provider of high impact entertainment programming
Movie Business
• No releases during the quarter. Company continues to focus on a limited but high impact stories where the risk reward ratios are extremely favorable and projects can be de-risked by significant pre sales and co-production models
• Movie pipeline includes two mid budget Hindi movies - Veere Di Wedding (releasing May 2018 staring Kareena Kapoor and Sonam Kapoor), Kedarnath (releasing December 2018 staring Sushant Singh Rajput and Sara Ali Khan)
Others
• Final hearing at NCLT is completed and the order is awaited pertaining to the merger of Bolt Media and film production business of Balaji Motion Pictures Limited into Balaji Telefilms. Merger will result in streamlining the group structure as well as operational cost savings
2

Unique, Distinctive, Disruptive
ALTBalaji the new destination for entertainment
Launched 16th April 2017
8.9 millionApp Downloads1
Note : All data as of 30th September
1. App download does not include anonymous users through the website 2. Average time per subscribed user is calculated based on minutes consumed per active session of use3. Gross billing is total collections in the year. Revenue reported in financials as per IND-AS standards
Globally Accessible
Original comedy in
4 languagesHindi, Marathi, Punjabi
and Gujarati
270 million +Minutes of
Video consumed
100,000+Daily Active Users
97 minutesAverage watch time
per user2
Rs 3.2 crGross billing3
10 Original shows
3

Unique, Distinctive, Disruptive
Number 3 Video Streaming app by Revenue
Source App Annie - The leading market data solution for the app economy
4

Unique, Distinctive, Disruptive
Content added during the quarter
5

Unique, Distinctive, Disruptive
Content added during the quarter
6

Unique, Distinctive, Disruptive
Bose Dead / Alive streaming soon…
7

Unique, Distinctive, Disruptive
Consolidated Financial Performance
ALTBalaji was launched on 16th April 2017 and we expect to be in an investment phase for this new business vertical for the next 2 to 3 years. To allow a like for like comparison, the numbers have also been stated excluding ALTBalaji
Revenue from Operations
• Q2 FY18 revenues at Rs 109.8 cr vs Rs 105.9 cr in Q2 FY17. H1 FY 18 revenues at Rs 254.4 cr vs Rs 223.3 cr in H1 FY17
• Increase primarily on account of higher revenues from the TV business
• Q2 FY18 revenue (excluding ALTBalaji) at Rs 108.4 cr vs. Rs 105.9 cr in Q2 FY17
EBITDA
• Q2 FY18 EBITDA at Rs (10.6) cr vs Rs (26.2) cr in Q2 FY17. H1 FY18 EBITDA at Rs (25.4) cr vs Rs (26.5) cr in H1 FY17
• H1 FY18 loss on account of ALTBalaji launch expenses. H1 FY17 was impacted due the piracy of our movies that resulted in a revenue loss of approximately Rs 36 cr
• Q2 FY18 EBITDA (excluding ALTBalaji) at Rs 8.4 cr vs. Rs (21.8) cr in Q2 FY17
Profit after Tax
• Q2 FY18 PAT at Rs (13.8) cr vs Rs (27.9) cr in Q2 FY17. H1 FY18 PAT at Rs (37.3) cr vs Rs (28.2) cr in H1 FY17. Q2 FY18 includes an exceptional item of Rs 9 cr towards income tax provision. This has been provided as a matter of abundant precaution as the matter is still pending adjudication
• Q2 FY18 PAT (excluding ALTBalaji) at Rs 4 cr vs. Rs (26.2) cr in Q2 FY17. H1 FY18 PAT excluding ALTBalaji at Rs 10.4 cr vs Rs (25.7)cr in H1 FY17
Investments
• Investments in mutual fund units at 30th September 2017 Rs 506.4 cr (of which Rs 179.9 cr through ALT and Rs 326.5 cr through BTL)
• Total inventory as of 30th September 2017 Rs 85.4 cr which includes Rs 40.7 cr as movie inventory. Inventory as of 31st March 2017 was at Rs 98.3 cr which included Rs 65 cr of movie inventory
8
Unique, Distinctive, Disruptive
BTL Standalone Financial Performance
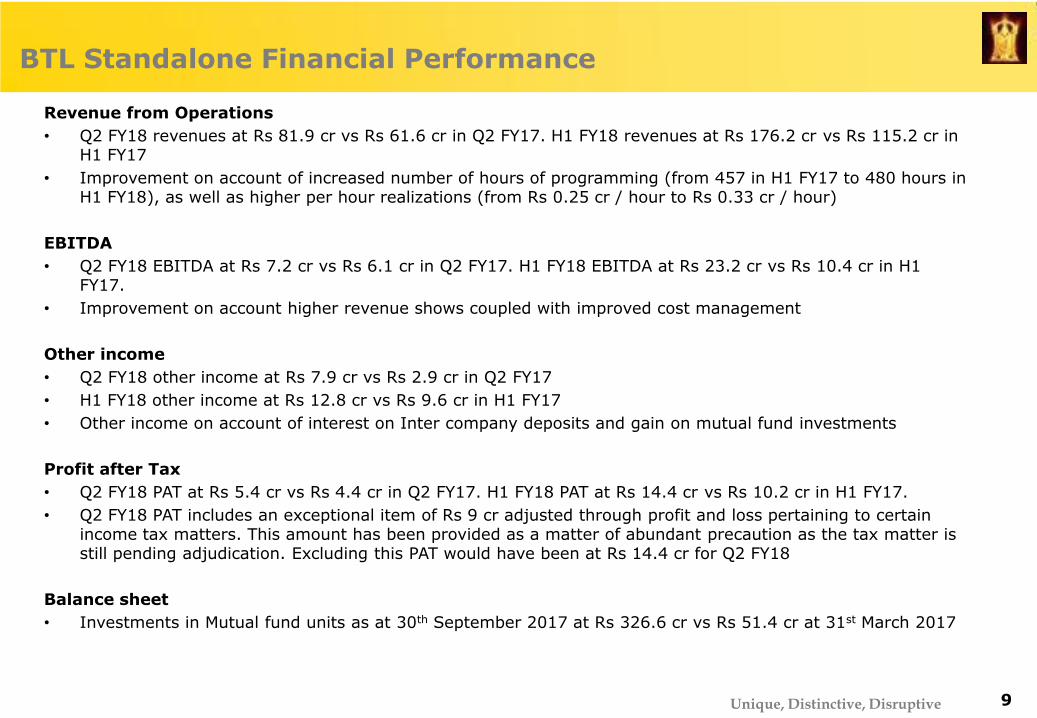
Revenue from Operations
• Q2 FY18 revenues at Rs 81.9 cr vs Rs 61.6 cr in Q2 FY17. H1 FY18 revenues at Rs 176.2 cr vs Rs 115.2 cr in H1 FY17
• Improvement on account of increased number of hours of programming (from 457 in H1 FY17 to 480 hours in H1 FY18), as well as higher per hour realizations (from Rs 0.25 cr / hour to Rs 0.33 cr / hour)
EBITDA
• Q2 FY18 EBITDA at Rs 7.2 cr vs Rs 6.1 cr in Q2 FY17. H1 FY18 EBITDA at Rs 23.2 cr vs Rs 10.4 cr in H1 FY17.
• Improvement on account higher revenue shows coupled with improved cost management
Other income
• Q2 FY18 other income at Rs 7.9 cr vs Rs 2.9 cr in Q2 FY17
• H1 FY18 other income at Rs 12.8 cr vs Rs 9.6 cr in H1 FY17
• Other income on account of interest on Inter company deposits and gain on mutual fund investments
Profit after Tax
• Q2 FY18 PAT at Rs 5.4 cr vs Rs 4.4 cr in Q2 FY17. H1 FY18 PAT at Rs 14.4 cr vs Rs 10.2 cr in H1 FY17.
• Q2 FY18 PAT includes an exceptional item of Rs 9 cr adjusted through profit and loss pertaining to certain income tax matters. This amount has been provided as a matter of abundant precaution as the tax matter is still pending adjudication. Excluding this PAT would have been at Rs 14.4 cr for Q2 FY18
Balance sheet
• Investments in Mutual fund units as at 30th September 2017 at Rs 326.6 cr vs Rs 51.4 cr at 31st March 2017
9

Unique, Distinctive, Disruptive
Television business – Show line up
Channel Shows Time Schedule
Kasam Tere Pyaar Ki 18.00 - 18.30 Monday to Friday
Chandrakanta 20.00 – 21.00 Saturday to Sunday
Ye Hai Mohabbatein 19.30 - 20.00 6 days a week
Chandra Nandni 20.30 - 21.00 Monday to Friday
Dhhai Kilo Prem * 14.00 - 14.30 Monday to Saturday
Kumkum Bhagya 21.00 - 21.30 Monday to Friday
Kundali Bhagya 21.30 - 22.00 Monday to Friday
Note : * Shows ended during the quarter.
10

Unique, Distinctive, Disruptive
Television business – Operating KPIs
Particulars Sep-17 Jun-17 Mar-17 Dec-16 Sep-16Full Year
FY17
Programming Hours 240 240 241 262 231 960
Revenue (Rs Cr) 77.6 80.4 80.9 83.5 60.9 277.9
Realisation / Hour (Rs Cr) 0.32 0.34 0.34 0.32 0.26 0.29
Gross Margin (Rs Cr) 18.9 22.4 29 18.7 14.7 74.1
Gross Margin / Hour (Rs Cr) 0.08 0.09 0.12 0.07 0.06 0.08
Gross Margin % 24.4% 27.9% 35.8% 22.4% 24.1% 26.7%
• Kundali Bhagya for Zee TV was launched in the quarter, Pardes Mein Hai Meraa Dill came to an end in the quarter resulting in a similar number of programming hours
• “Dhaai Kilo Prem” a show commissioned for Star Plus’s afternoon slot came to an end at the end of the quarter. Chandra Nandni on Star Plus expected to end in Q3 FY18
• Realisation per hour and gross margins remain steady
Note : Only includes commissioned programs
11
Unique, Distinctive, Disruptive
Digital Business - ALT Financial Performance
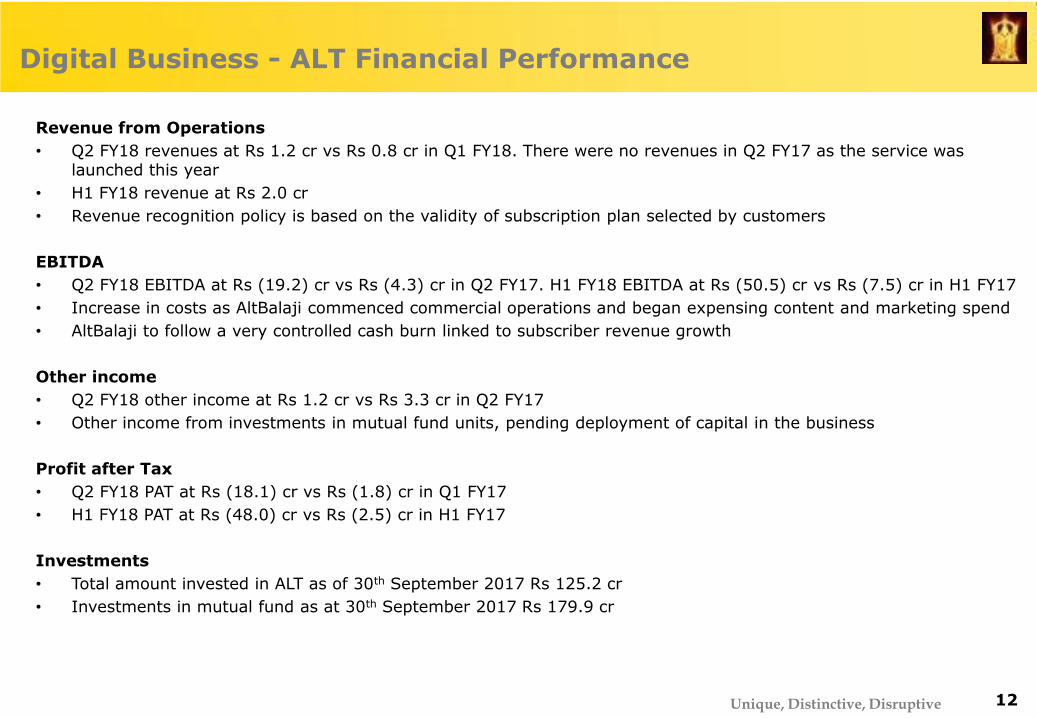
Revenue from Operations
• Q2 FY18 revenues at Rs 1.2 cr vs Rs 0.8 cr in Q1 FY18. There were no revenues in Q2 FY17 as the service was launched this year
• H1 FY18 revenue at Rs 2.0 cr
• Revenue recognition policy is based on the validity of subscription plan selected by customers
EBITDA
• Q2 FY18 EBITDA at Rs (19.2) cr vs Rs (4.3) cr in Q2 FY17. H1 FY18 EBITDA at Rs (50.5) cr vs Rs (7.5) cr in H1 FY17
• Increase in costs as AltBalaji commenced commercial operations and began expensing content and marketing spend
• AltBalaji to follow a very controlled cash burn linked to subscriber revenue growth
Other income
• Q2 FY18 other income at Rs 1.2 cr vs Rs 3.3 cr in Q2 FY17
• Other income from investments in mutual fund units, pending deployment of capital in the business
Profit after Tax
• Q2 FY18 PAT at Rs (18.1) cr vs Rs (1.8) cr in Q1 FY17
• H1 FY18 PAT at Rs (48.0) cr vs Rs (2.5) cr in H1 FY17
Investments
• Total amount invested in ALT as of 30th September 2017 Rs 125.2 cr
• Investments in mutual fund as at 30th September 2017 Rs 179.9 cr
12
Unique, Distinctive, Disruptive
Movies Business - BMPL Financial Performance
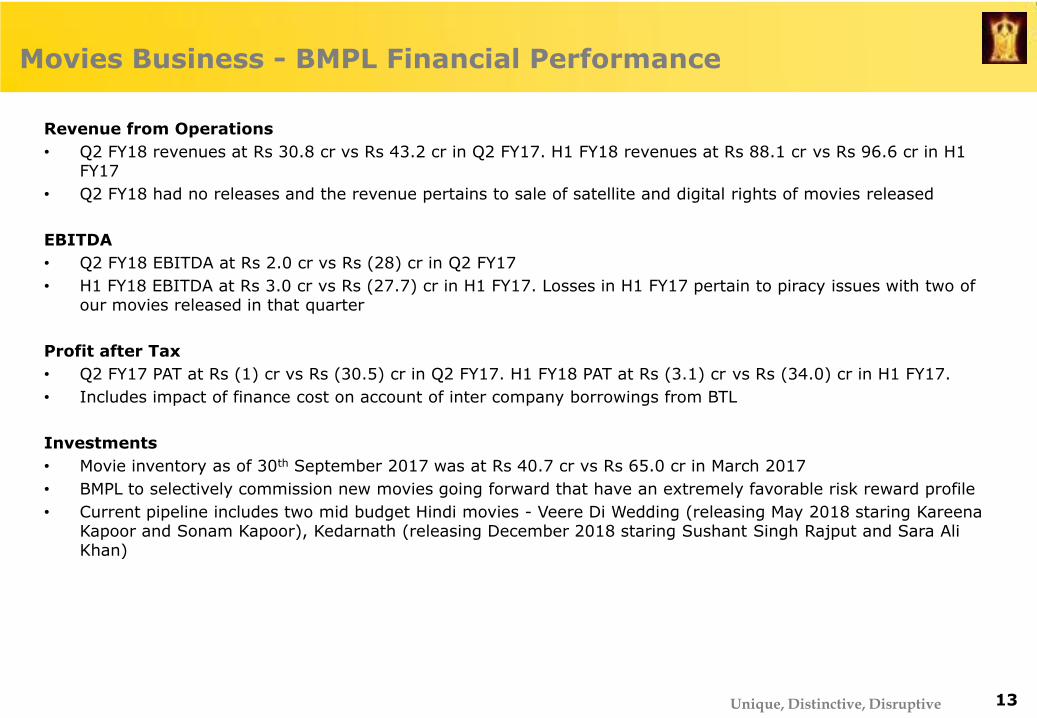
Revenue from Operations
• Q2 FY18 revenues at Rs 30.8 cr vs Rs 43.2 cr in Q2 FY17. H1 FY18 revenues at Rs 88.1 cr vs Rs 96.6 cr in H1 FY17
• Q2 FY18 had no releases and the revenue pertains to sale of satellite and digital rights of movies released
EBITDA
• Q2 FY18 EBITDA at Rs 2.0 cr vs Rs (28) cr in Q2 FY17
• H1 FY18 EBITDA at Rs 3.0 cr vs Rs (27.7) cr in H1 FY17. Losses in H1 FY17 pertain to piracy issues with two of our movies released in that quarter
Profit after Tax
• Q2 FY17 PAT at Rs (1) cr vs Rs (30.5) cr in Q2 FY17. H1 FY18 PAT at Rs (3.1) cr vs Rs (34.0) cr in H1 FY17.
• Includes impact of finance cost on account of inter company borrowings from BTL
Investments
• Movie inventory as of 30th September 2017 was at Rs 40.7 cr vs Rs 65.0 cr in March 2017
• BMPL to selectively commission new movies going forward that have an extremely favorable risk reward profile
• Current pipeline includes two mid budget Hindi movies - Veere Di Wedding (releasing May 2018 staring KareenaKapoor and Sonam Kapoor), Kedarnath (releasing December 2018 staring Sushant Singh Rajput and Sara Ali Khan)
13

Financials

Unique, Distinctive, Disruptive
BTL Standalone Financial Performance
Particulars (Amounts in INR Cr) Q2FY18 Q1 FY18 Q2 FY17 H1 FY18 H1 FY17 FY17
Total Income from operations 81.9 94.3 61.6 176.2 115.2 284.1
Cost of Production 63.0 70.0 46.9 132.9 88.8 210.1
Gross Margin 18.9 24.4 14.7 43.3 26.4 74.1
Gross Margin % 23% 26% 24% 25% 23% 26%
Employee Benefits Expense 4.4 4.1 3.7 8.5 7.0 16.0
Other Expenses 7.3 4.3 4.9 11.6 8.9 19.4
EBITDA 7.2 16.0 6.1 23.2 10.4 38.6
EBITDAMargin % 9% 17% 10% 13% 9% 14%
Depreciation and amortisation expense 3.6 3.5 2.7 7.1 5.2 11.8
Other Income 7.9 4.9 2.9 12.8 9.6 18.7
Exceptional Item (tax provision) 9.1 - - 9.1 - -
Profit Before Tax 2.5 17.3 6.3 19.8 14.8 45.5
Tax Expenses -2.9 8.4 1.9 5.4 4.6 14.5
Net Profit After Tax 5.4 9.0 4.4 14.4 10.2 31.0
Other Comprehensive Income -0.0 -0.0 -0.0 -0.0 -0.0 -0.1
Total Comprehensive Income 5.4 8.9 4.4 14.3 10.2 30.9
Note : numbers may not add up due to rounding 15
Unique, Distinctive, Disruptive
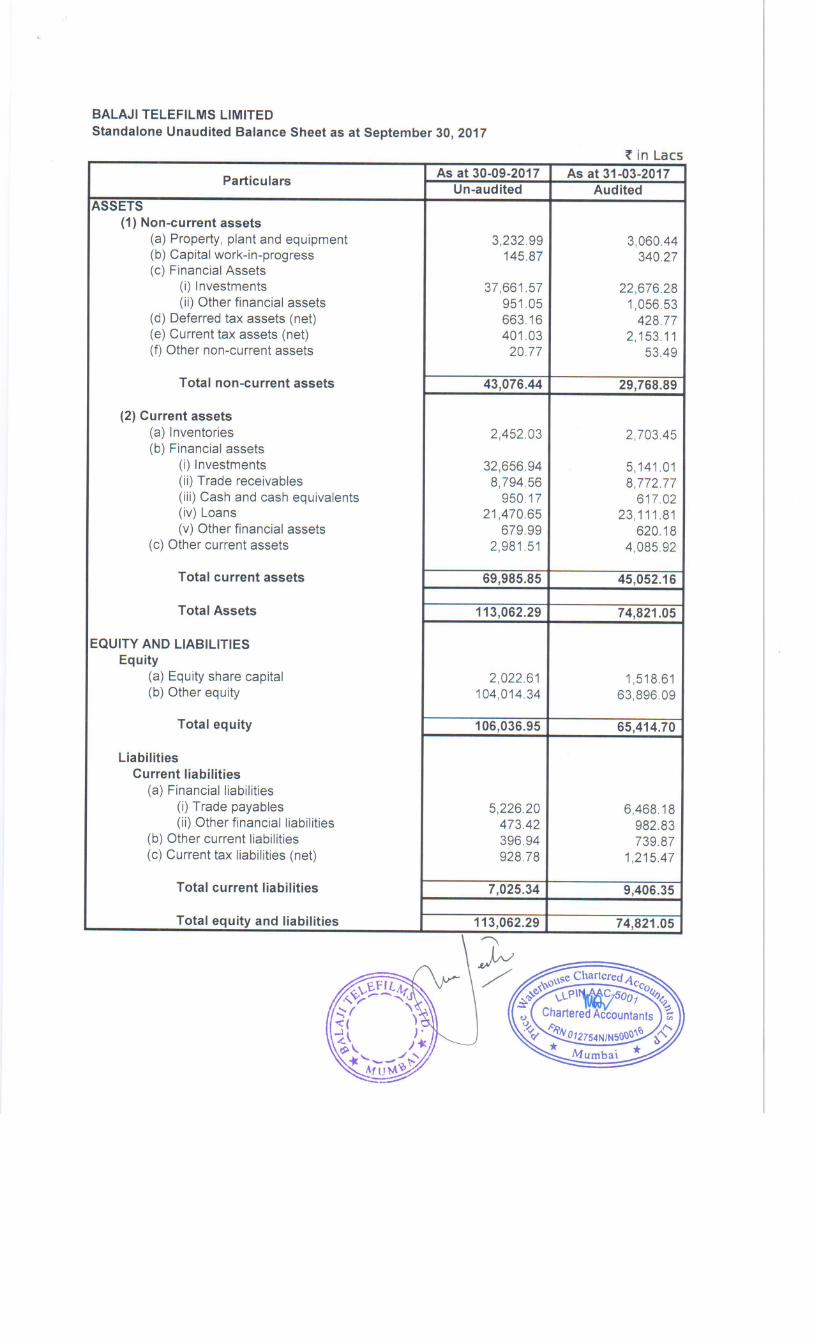
BTL Standalone Balance Sheet
Note : numbers may not add up due to rounding
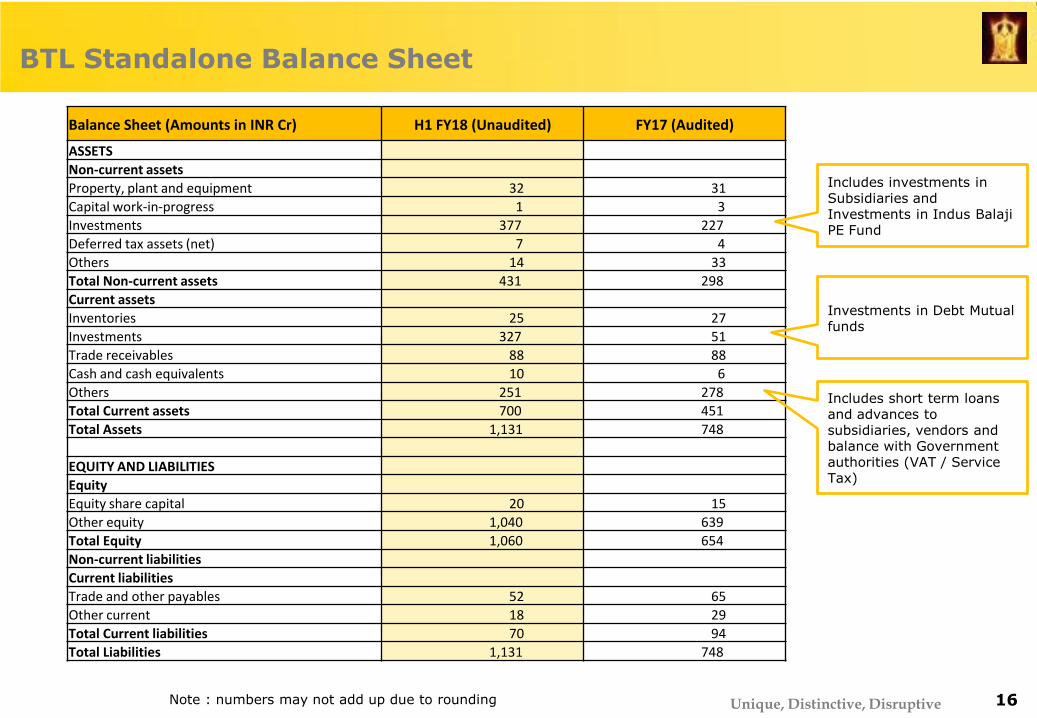
Balance Sheet (Amounts in INR Cr) H1 FY18 (Unaudited) FY17 (Audited)
ASSETS
Non-current assets
Property, plant and equipment 32 31
Capital work-in-progress 1 3
Investments 377 227
Deferred tax assets (net) 7 4
Others 14 33
Total Non-current assets 431 298
Current assets
Inventories 25 27
Investments 327 51
Trade receivables 88 88
Cash and cash equivalents 10 6
Others 251 278
Total Current assets 700 451
Total Assets 1,131 748
EQUITY AND LIABILITIES
Equity
Equity share capital 20 15
Other equity 1,040 639
Total Equity 1,060 654
Non-current liabilities
Current liabilities
Trade and other payables 52 65
Other current 18 29
Total Current liabilities 70 94
Total Liabilities 1,131 748
Includes investments in Subsidiaries and Investments in Indus BalajiPE Fund
Investments in Debt Mutual funds
Includes short term loans and advances to subsidiaries, vendors and balance with Government authorities (VAT / Service Tax)
16
Unique, Distinctive, Disruptive
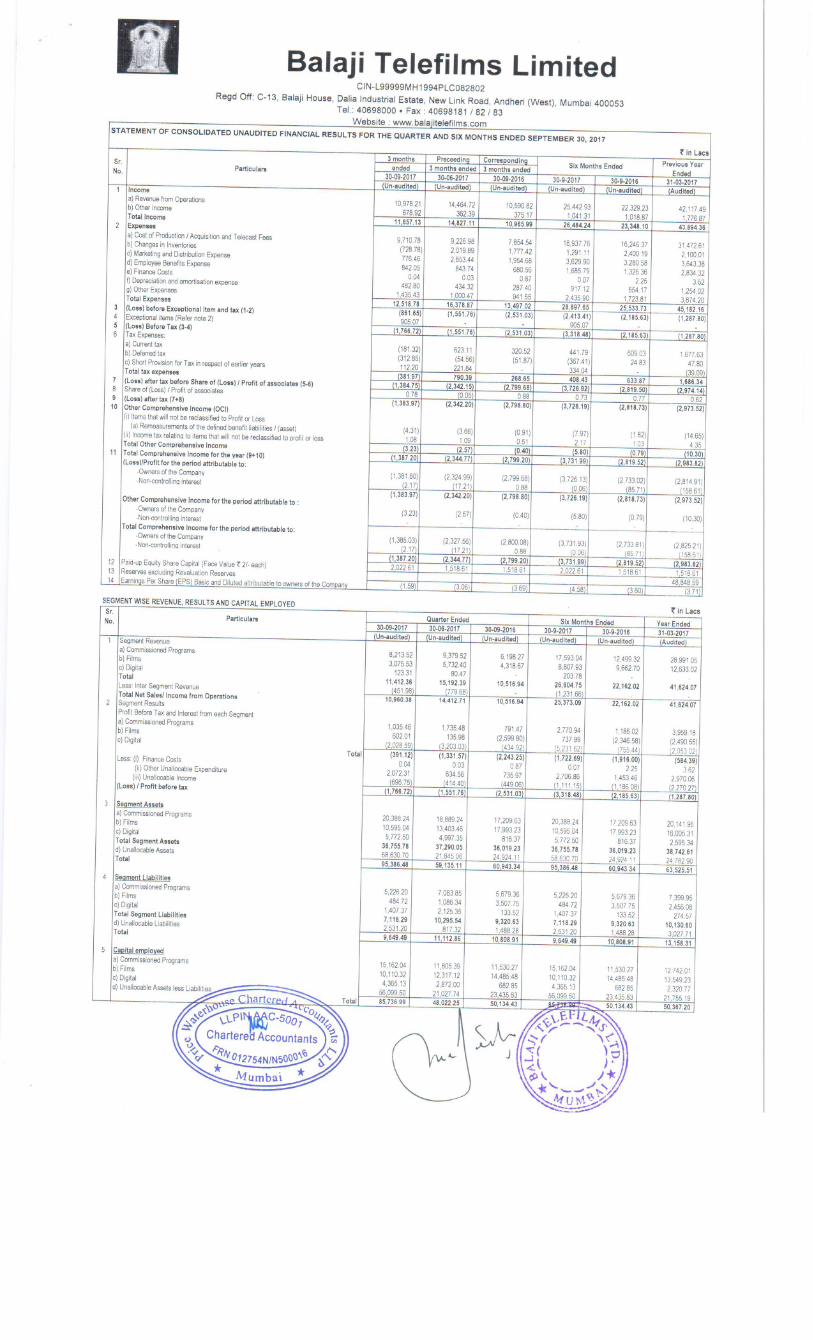
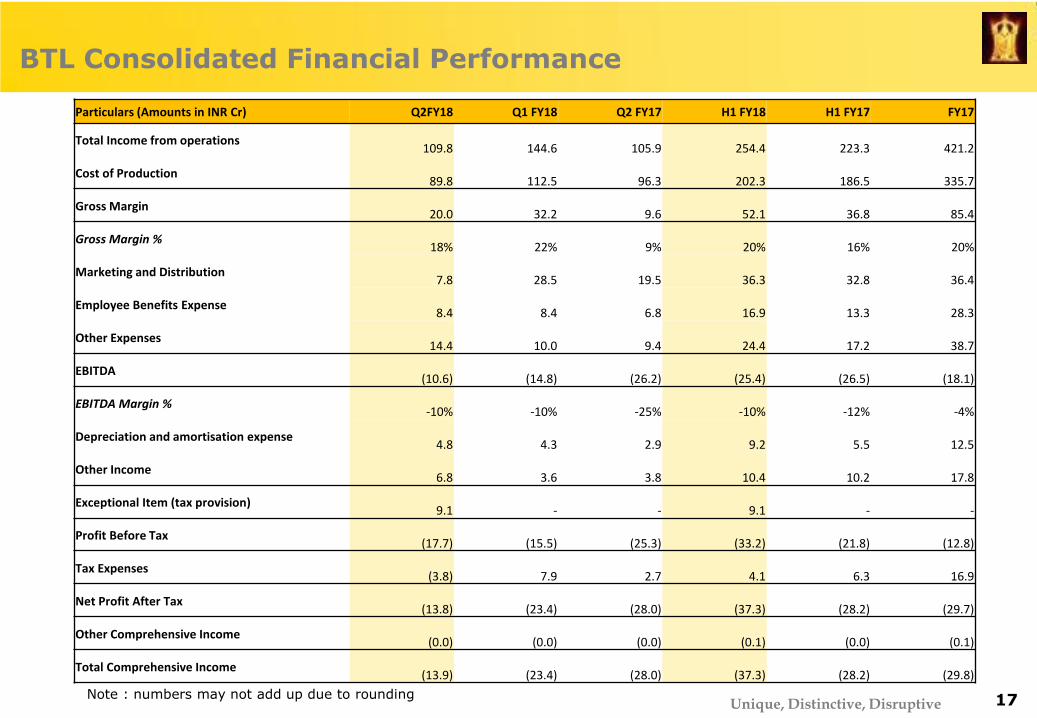
BTL Consolidated Financial Performance
Note : numbers may not add up due to rounding 17
Particulars (Amounts in INR Cr) Q2FY18 Q1 FY18 Q2 FY17 H1 FY18 H1 FY17 FY17
Total Income from operations109.8 144.6 105.9 254.4 223.3 421.2
Cost of Production89.8 112.5 96.3 202.3 186.5 335.7
Gross Margin20.0 32.2 9.6 52.1 36.8 85.4
Gross Margin %18% 22% 9% 20% 16% 20%
Marketing and Distribution7.8 28.5 19.5 36.3 32.8 36.4
Employee Benefits Expense8.4 8.4 6.8 16.9 13.3 28.3
Other Expenses14.4 10.0 9.4 24.4 17.2 38.7
EBITDA(10.6) (14.8) (26.2) (25.4) (26.5) (18.1)
EBITDA Margin %-10% -10% -25% -10% -12% -4%
Depreciation and amortisation expense4.8 4.3 2.9 9.2 5.5 12.5
Other Income6.8 3.6 3.8 10.4 10.2 17.8
Exceptional Item (tax provision)9.1 - - 9.1 - -
Profit Before Tax(17.7) (15.5) (25.3) (33.2) (21.8) (12.8)
Tax Expenses(3.8) 7.9 2.7 4.1 6.3 16.9
Net Profit After Tax(13.8) (23.4) (28.0) (37.3) (28.2) (29.7)
Other Comprehensive Income(0.0) (0.0) (0.0) (0.1) (0.0) (0.1)
Total Comprehensive Income(13.9) (23.4) (28.0) (37.3) (28.2) (29.8)

Unique, Distinctive, Disruptive
BTL Consolidated Balance Sheet
Note : numbers may not add up due to rounding
Balance Sheet (Amounts in INR Cr) H1 FY18 (Unaudited) FY17 (Audited)
Non-current assets
Property, plant and equipment 36 35
Capital work-in-progress 1 11
Investments 40 40
Deferred tax assets (net) 7 9
Others 72 79
Total Non-current assets 157 174
Current assets
Inventories 85 98
Investments 506 157
Trade receivables 108 98
Cash and cash equivalents 20 16
Others 78 92
Total Current assets 797 461
Total Assets 954 635
EQUITY AND LIABILITIES
Equity
Equity share capital 20 15
Other equity 840 492
Non Controlling Interest -3 -3
Total Equity 857 504
Non-current liabilities 2 8
Current liabilities
Trade and other payables 68 72
Other current 27 52
Total Current liabilities 95 124
Total Liabilities 954 635
18
Investments in Debt Mutual funds
Unique, Distinctive, Disruptive
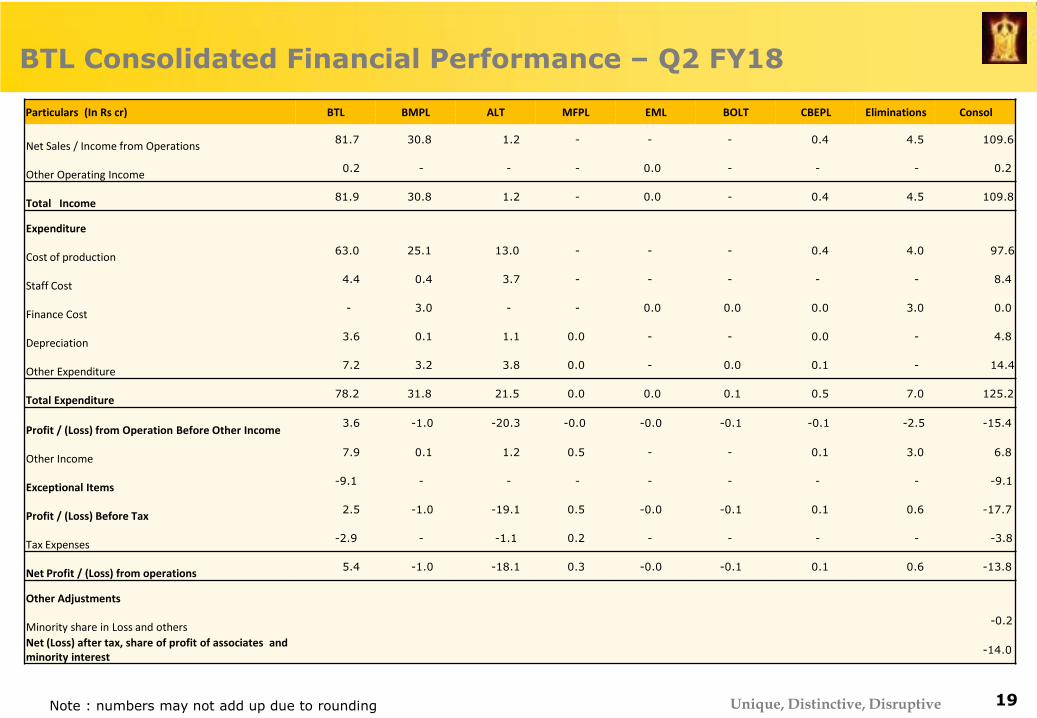
BTL Consolidated Financial Performance – Q2 FY18
Particulars (In Rs cr) BTL BMPL ALT MFPL EML BOLT CBEPL Eliminations Consol
Net Sales / Income from Operations 81.7 30.8 1.2 - - - 0.4 4.5 109.6
Other Operating Income 0.2 - - - 0.0 - - - 0.2
Total Income 81.9 30.8 1.2 - 0.0 - 0.4 4.5 109.8
Expenditure
Cost of production 63.0 25.1 13.0 - - - 0.4 4.0 97.6
Staff Cost 4.4 0.4 3.7 - - - - - 8.4
Finance Cost - 3.0 - - 0.0 0.0 0.0 3.0 0.0
Depreciation 3.6 0.1 1.1 0.0 - - 0.0 - 4.8
Other Expenditure 7.2 3.2 3.8 0.0 - 0.0 0.1 - 14.4
Total Expenditure 78.2 31.8 21.5 0.0 0.0 0.1 0.5 7.0 125.2
Profit / (Loss) from Operation Before Other Income3.6 -1.0 -20.3 -0.0 -0.0 -0.1 -0.1 -2.5 -15.4
Other Income 7.9 0.1 1.2 0.5 - - 0.1 3.0 6.8
Exceptional Items-9.1 - - - - - - - -9.1
Profit / (Loss) Before Tax 2.5 -1.0 -19.1 0.5 -0.0 -0.1 0.1 0.6 -17.7
Tax Expenses -2.9 - -1.1 0.2 - - - - -3.8
Net Profit / (Loss) from operations 5.4 -1.0 -18.1 0.3 -0.0 -0.1 0.1 0.6 -13.8
Other Adjustments
Minority share in Loss and others-0.2
Net (Loss) after tax, share of profit of associates and minority interest
-14.0
Note : numbers may not add up due to rounding 19

Unique, Distinctive, Disruptive
BTL Consolidated Financial Performance – H1 FY18
Note : numbers may not add up due to rounding 20
Particulars (In Rs cr) BTL BMPL ALT MFPL EML BOLT CBEPL Eliminations Consol
Net Sales / Income from Operations 175.5 88.1 2.0 - - - 0.4 12.3 253.7
Other Operating Income 0.7 - - - 0.0 - - - 0.7
Total Income 176.2 88.1 2.0 - 0.0 - 0.4 12.3 254.4
Expenditure
Cost of production 133.0 80.1 36.8 - - - 0.4 11.8 238.6
Staff Cost 8.5 0.6 7.7 0.1 - - - - 16.9
Finance Cost - 6.0 - - 0.0 0.1 0.0 6.1 0.0
Depreciation 7.1 0.2 1.8 0.0 - 0.0 0.0 - 9.2
Other Expenditure 11.5 4.4 8.1 0.2 0.0 0.1 0.1 - 24.4
Total Expenditure 160.1 91.4 54.4 0.3 0.0 0.1 0.6 17.9 289.0
Profit / (Loss) from Operation Before Other Income16.1 -3.3 -52.3 -0.3 -0.0 -0.1 -0.1 -5.6 -34.5
Other Income 12.8 0.2 2.9 0.5 - - 0.1 6.1 10.4
Exceptional Items-9.1 - - - - - - - -9.1
Profit / (Loss) Before Tax 19.8 -3.1 -49.4 0.2 -0.0 -0.1 -0.0 0.6 -33.2
Tax Expenses 5.4 - -1.5 0.2 - - - - 4.1
Net Profit / (Loss) from operations 14.4 -3.1 -47.9 0.0 -0.0 -0.1 -0.0 0.6 -37.3
Other Adjustments -0.1
Minority share in Loss and others0.0
Net (Loss) after tax, share of profit of associates and minority interest
-37.3

Unique, Distinctive, Disruptive
Accounting policies for amortisation on inventory
Television serials
• Inventories are valued at lower of cost and net realisable value. Cost is determined on the basis of average cost.
Movies
• Items of inventory are carried at lower of cost and net realisable value. Cost is determined on the following basis:
• Films: Actual Cost
• Unamortised cost of films: The cost of films is amortised in the ratio of current revenue to the expected total revenue. At the end of each accounting period, balance unamortised cost is compared with the net expected revenue. If the net expected revenue is less than unamortised cost, the same is written down to the net expected revenue
• Marketing and distribution expenses are charged to revenue in the period in which they are incurred and are not inventorised
Digital
• Original content amortised over 2 years, 75% of the cost in the first year and 25% in the second year
• Acquired content is amortised over license period
21
Unique, Distinctive, Disruptive
Investor Contacts
Balaji Telefilms Limited
CIN : L99999MH1994PLC082802
Kartik Sankaran – Sr. Vice President - Investor Relations
Simmi Singh Bisht - Group Head – Secretarial
Tel: +91 22 4069 8000
E-mail: [email protected]
For further information please visit: http://www.balajitelefilms.com
22

Thank you