over-indebtedness in the eu : from figures to expert opinions · over-indebtedness in the eu : from...
TRANSCRIPT
Over-indebtedness in the EU : from figures to expert opinions
Author : Mr. Andrea Falanga
Co-editors : Réseau Financité & EFIN
March 2015
Summary:
Over-indebtedness is a complex phenomenon, described by several variables and definitions. However data relative to the EU show that this issue regards a significant part of the population, albeit not a majority, and its demographic distribution is not casual. In particular an excessive debt burden is more frequent or severe for certain social groups and countries, which paves the way for targeted policies.

Definition of over-indebtedness and possible classifications
Debt is a common instrument used by households to maintain a stable level of consumption, coherently with their resources and life-cycle's phase. Being indebted is a normal behavior and is almost inevitable for the majority of the households (Betti et al, 2001). According to life-cycle theory (LCT), households apply to credit markets because they want to have steady living conditions over the years. Since generally the income curve is humped over a person's life, debt is the mean that allows households to smooth their consumption (D'Alessio and Iezzi, 2013). This is the most common among the theoretical explanations for indebtedness. However, it's not trivial to remember that among the assumptions of LCT there are rational investors and competitive markets, hence, this theory may not be the most appropriate to describe a pathologic situation.More specifically the disposable income of a family could be split into two parts: the pre-committed part should be used to meet basic needs and credit repayments, while the remaining one could finance supplementary consumption or savings. Theoretically, in times of financial hardship, efficiently managing the flexible part of one's income is the most straightforward way to handle the problematic period, for example dropping certain consumptions or drawing on savings. Of course this is not always possible and for some families debt could become unsustainable because of a wide variety of reasons. Problems arise especially when “flexible income” is insignificant or very small (Frade and Lopes, 2009).
Since cases in which debt burden is too heavy are not very numerous, but represent an important social issue, there was a complex debate about this topic. The first and non-yet-completed step of the ongoing international discussion was the definition of this phenomenon. This has been a great challenge, especially in EU, for the last couple of decades. Problems and incompatibility of the different proposed definitions at a national level rise from the lack of a clear measure. In fact, starting from the premise that some households are apparently in a condition in which their debt burden is unsustainable, it’s very difficult to state which variable could give a fair view about over-indebtedness and which is the cut-off between a household whose debt position is ‘still manageable’ (to which prevention measures should be addressed) and a one who overcame this threshold. This brought to the production of lots of definitions and even more indicators. The table 1.1 provides a European overview of the current state of the art of definitions:
Table 1.1 - Operative definition of over-indebtedness in different European countries
Country Author Definition
Belgium Law 1998-07-05/57 Over-indebted household (OH) is unable to pay required/approaching debts
France Banque de France, 2014 (Central bank)
Article L330-1 of Consumer code, inserted by Law 2003-710
OH can't meet obligations coming from debt for non-professional reasons
Over-indebtedness of natural persons is characterized by the manifest impossibility of a well-intentioned debtor either meeting his personal debts (now and in the future) or fulfilling an undertaking to guarantee and settle the debt of an individual contractor/a company when he was not executive thereof
Germany Haas, 2006 OH doesn't meet payment obligations over a long period, despite a reduction in living standards
Ireland Combat Poverty Agency, 20091
OH's income is not enough to meet reasonable living expenses and deferred payments
1 Used to be a governmental agency

Italy Law 3/2012 as modified by law 221/2012
OH is in a persistent imbalance between obligations and assets that can be promptly liquidated to meet them, thus, is unable to meet its obligations
UK Oxera, 2004 OH is in arrears or risks to get into arrears
Source: own elaboration
Although nowadays there’s still no agreement on a common framework to be used at a European level to assess if the debt position of a household is critical, it’s still possible to describe the situation and try to get some important indications. First of all, just reading the previous attempts of definition, there’s some evidence that they share a certain number of features. In particular they all consider some different dimensions: economic (amount to be repaid), temporal (medium-long term is usually taken into account), social (some expenses need to be met ahead of debt payments), psychological, i.e. stress is caused by difficulties in repaying debt (D'Alessio and Iezzi, 2013). EC in 2008 dedicated a long study to the definition of over-indebtedness and identified some criteria to be met to reach a common European one:
• The income considered should be the household's, since individual incomes are normally pooled within it;
• Over-indebtedness is a structural status. In this respect it's worth noting that the lobby of consumer credit providers in Europe criticized the inclusion by EC of this element between those to be used in a common European framework. The reason is that notions like 'structural status' or 'persistent situation' are not measurable and, according to data, are not always observable with commonly used indicators (Eurofinas, 2013);
• It's not possible to resolve the problem by borrowing more (illiquidity);• To resolve the issue a household should reduce its expenses or increase its income;• All contracted financial commitments are included (mortgage, consumer credit, but also
telephone bills and other recurrent expenses);• It's impossible for the household to maintain a minimum standard of living (European
Commission, 2008).According to these criteria a household is over-indebted when its existing and expected resources are insufficient to meet its financial commitments without reducing its living standards, even below what is regarded as a minimum acceptable threshold (D'Alessio and Iezzi, 2013).Starting from definitions, a number of indicators is produced. As well as the assumptions mentioned above coming from definitions, all indicators share a series of problems. For example data used to assess over-indebtedness (and construct or classify/choose indicators) are generally collected at a national level in different times, with different frequencies and different reference periods. Besides this, the methodology of sampling, the ratios presented and the computation procedure in each local survey could be very different, posing enormous difficulties in terms of comparability (Betti et al, 2001). Furthermore there’s no universal consideration of what is a minimum acceptable standard of living. This quantity, in fact, depends on economic, social and cultural factors peculiar of each society.
Table 1.2 - Common assumptions and drawbacks of over-indebtedness indicators
Assumptions Drawbacks
• Income considered is the household's• Over-indebtedness is a structural/persistent
condition• Household is illiquid• All commitments are included
Heterogeneity of surveys/data:• Different times, frequencies, reference periods• Various methodology of sampling• Diversity of ratios on which indicators are based
and of their computation
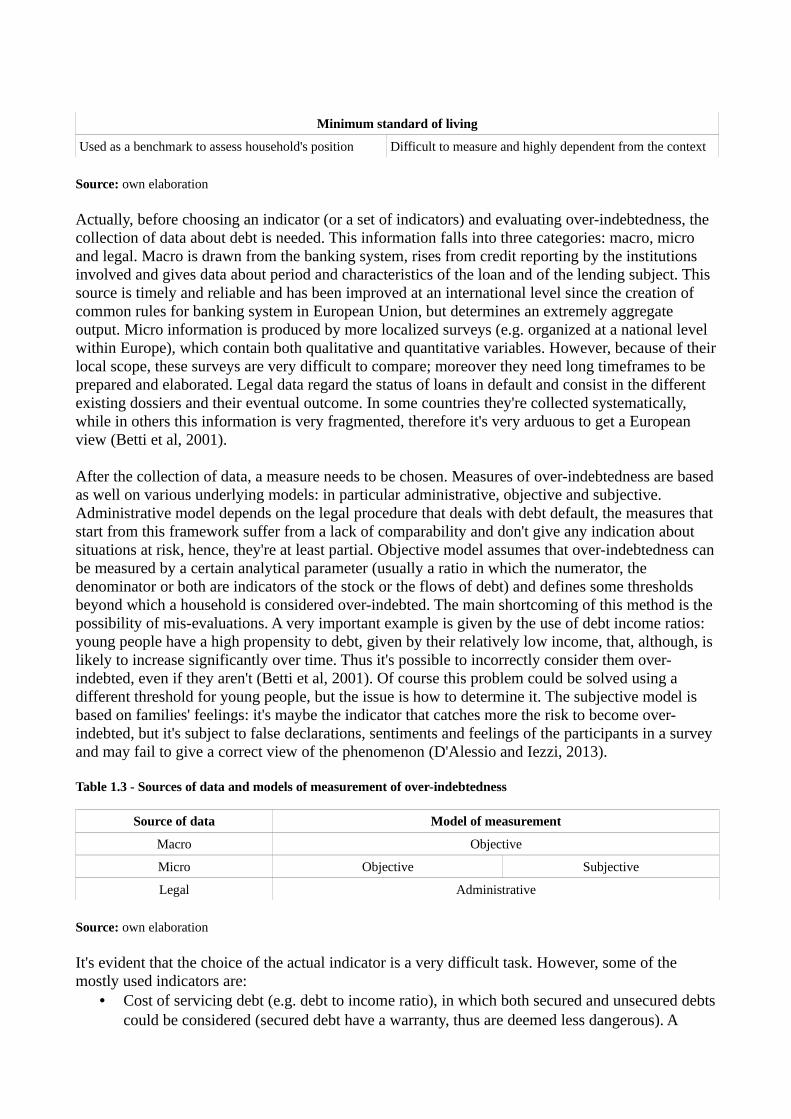
Minimum standard of living
Used as a benchmark to assess household's position Difficult to measure and highly dependent from the context
Source: own elaboration
Actually, before choosing an indicator (or a set of indicators) and evaluating over-indebtedness, the collection of data about debt is needed. This information falls into three categories: macro, micro and legal. Macro is drawn from the banking system, rises from credit reporting by the institutions involved and gives data about period and characteristics of the loan and of the lending subject. This source is timely and reliable and has been improved at an international level since the creation of common rules for banking system in European Union, but determines an extremely aggregate output. Micro information is produced by more localized surveys (e.g. organized at a national level within Europe), which contain both qualitative and quantitative variables. However, because of their local scope, these surveys are very difficult to compare; moreover they need long timeframes to be prepared and elaborated. Legal data regard the status of loans in default and consist in the different existing dossiers and their eventual outcome. In some countries they're collected systematically, while in others this information is very fragmented, therefore it's very arduous to get a European view (Betti et al, 2001).
After the collection of data, a measure needs to be chosen. Measures of over-indebtedness are based as well on various underlying models: in particular administrative, objective and subjective. Administrative model depends on the legal procedure that deals with debt default, the measures that start from this framework suffer from a lack of comparability and don't give any indication about situations at risk, hence, they're at least partial. Objective model assumes that over-indebtedness can be measured by a certain analytical parameter (usually a ratio in which the numerator, the denominator or both are indicators of the stock or the flows of debt) and defines some thresholds beyond which a household is considered over-indebted. The main shortcoming of this method is the possibility of mis-evaluations. A very important example is given by the use of debt income ratios: young people have a high propensity to debt, given by their relatively low income, that, although, is likely to increase significantly over time. Thus it's possible to incorrectly consider them over-indebted, even if they aren't (Betti et al, 2001). Of course this problem could be solved using a different threshold for young people, but the issue is how to determine it. The subjective model is based on families' feelings: it's maybe the indicator that catches more the risk to become over-indebted, but it's subject to false declarations, sentiments and feelings of the participants in a survey and may fail to give a correct view of the phenomenon (D'Alessio and Iezzi, 2013).
Table 1.3 - Sources of data and models of measurement of over-indebtedness
Source of data Model of measurement
Macro Objective
Micro Objective Subjective
Legal Administrative
Source: own elaboration
It's evident that the choice of the actual indicator is a very difficult task. However, some of the mostly used indicators are:
• Cost of servicing debt (e.g. debt to income ratio), in which both secured and unsecured debts could be considered (secured debt have a warranty, thus are deemed less dangerous). A

particular case among these indicators is given by measures based on payments that put a household below the poverty line (D'Alessio and Iezzi, 2013);
• Debt to assets ratio, which considers the capability of the household to face debt payments by selling its assets;
• Legal-based variables like rate of default, rate of credit delinquencies or average liabilities per bankruptcy (Betti et al, 2001);
• Proportion of households perceiving themselves to be in difficulty;• Measures based on arrears (e.g. number of months);• Number of loans: the assumption is that, above a certain number, loans should be a heavy
burden (D'Alessio and Iezzi, 2013);• People that contact debt advice agencies (very different methodology and measurement
across countries, it doesn't exist everywhere).We can examine the main of these indicators more specifically. Debt to income ratios are very intuitive. The problem with this approach is that high income families can easily bear a debt income that would be devastating for a low income one. This is an issue typical of non-flexible measures, known as “one-size-fits-all” (CGAP, 2011). Another drawback is the lack of consideration of financial and real assets that the household holds, since in this case it would be possible to sell these assets and repay the debt (D'Alessio and Iezzi, 2013). Thus, the increase in debt of a family contemporary to a growth in the value of the asset that is the counterpart of the debt may be problematic only if the asset is the home in which the family lives. An increase in debt-income ratios at an aggregate level (detectable for example from national accounts) could be caused also by an increase in the number of families indebted, instead of being an index of more over-indebtedness (Coin et al, 2013). It's even arguable that in some cases the reduction of debt is a good sign for debt management. A cutback in credit, accompanied by a downturn in economic activity and a rising unemployment, will lead to increasing difficulties for over-indebted households (or risking to reach this condition) in maintaining current levels of expenditures (Fondeville et al, 2010). The indicators that deal with poverty line, in particular, are very intuitive and refer to a commonly accepted threshold.Default measures are not perfect as well: default doesn't directly measure over-indebtedness and it's also difficult to distinguish “accidental” defaults, produced by external unexpected shocks from people who deliberately choose not to pay their debts (Frade and Lopes, 2009). Nonetheless default is a sign of financial hardship and may indicate both a risk of over-indebtedness and a particularly critical situation.One of the mostly used measures of over-indebtedness is the formal declaration made by a household, and generally collected via a survey, to be in difficulty with debt repayments. This is an example of indicator based on a wide definition of over-indebtedness, since it doesn't take into account just borrowings, but the overall condition of a household. This kind of measure has several benefits: it indicates that a family is in trouble, even when no other data have been collected, and communicates also some risk situations (e.g. a family is still paying for all its debts, but it's not sure it will happen in the future; the level of indebtedness is not so heavy, but it's enough to make the family feel uncomfortable). On the other hand, since it is not an objective measure and it depends largely on people's willingness to give a fair view on their own conditions and on the right interpretation of what being in difficulty means, it could be flawed or, at least, can't be considered alone and must be compared with other objective quantities (Betti et al, 2001). Another problem is given by the fact that families, in giving their opinion, could compare their situation with an abstract standard of well-being or with people which are considered close (like neighbors or colleagues), causing further distortions in the measure (Frade and Lopes, 2009).The use of data about arrears is very difficult to be interpreted, since arrears should be evaluated on an individual basis to assess if they correspond to a situation of difficulty. Furthermore this indicator

doesn't show households who are still paying in time but are vulnerable to external shocks like a temporary drop in income and, hence, should be considered over-indebted as well. At last being in arrears of very small amounts shouldn't be a too heavy burden (D'Alessio and Iezzi, 2013). Of course level of income is a fundamental discriminant (one-size-fits-all approach could be significantly inefficient) and it's possible that the household can't even pay for very small sums because it's really in trouble.Similarly indicators based on number of credit commitments are not always reliable, especially in case of a large number of small outstanding debts (D'Alessio and Iezzi, 2013). Anyway an analogous clarification to the case of number of commitments should be made, linked with the level of income.
Actually it’s possible that various indicators give different answers because they are likely to capture debt problems in different households, countries, stages of the life-cycle (D'Alessio and Iezzi, 2013). Benefits and drawbacks of considered indicators could be summarized as follows:
Table 1.4 - Benefits and drawbacks of most common over-indebtedness indicators
Indicator Cost of servicing debt
Default-based measures
Households that perceive themselves in difficulty
Arrears-based measures
Number of loans
Benefits • Very intuitive• Easy to collect
data• If poverty line
is considered, a commonly accepted benchmark is used
• Easy data collection
• May reveal both a risk of over-indebtedness and a very critical situation
• Based on a wide definition
• Communicates also risk situations, even if other data lack
• Very intuitive• Easy
collection of data
• Easy collection of data
Drawbacks • One-size-fits-all issue
• Lack of consideration of financial and real assets
• A cutback in credit would be interpreted as a good sign
• Don’t measure over-indebtedness directly
• Difficult to distinguish “accidental defaults” from people who decide not to pay
• Suffer from a lack of international comparability
• Subjective measure (it depends on truth of declarations and correct interpretation of what being in difficulty means)
• Distortions in case of comparison with an abstract model of well-being
• Difficult interpretation
• Don’t indicate risk situations
• Possible distortions in case of many arrears of small amounts (need a careful consideration of income level)
• Potentially non-reliable in case of several loan commitments of small amounts (that however can indicate also a great degree of difficulty)
Source: own elaboration
The variety of strengths and weaknesses mentioned above (table 1.4) would suggest considering as much indicators as possible at the same time. However, the most frequent measures available in the European Union are cost of servicing debt (most of all debt-income ratios derived from surveys or from national accounting), household's perception (declarations collected at a micro level) and legal-based indicators (difficult to evaluate at an international level because of differences in local cultures, definitions of default, judicial/financial system). All these data should be considered in a relative way, comparing results from different indicators/sources with each other and always taking

into account the context (e.g. the difference between poor and high-income families, cultural and social peculiarities of a certain region/country). The use of adequate thresholds for different cases is also fundamental. If there are these preconditions, multiple indicators that give the same (or a very similar) outcome can be useful to have a better knowledge of the phenomenon and decide appropriate policies. In fact no unique accurate indicator of over-indebtedness as well as no common definition is expected for the next years, neither in EU, despite the endeavor of the European Commission toward this result (CPEC and DG SANCO, 2013).
Possible causes of over-indebtedness in literature
As showed before, households have good reasons to ask for loans. However, it shouldn't be reasonable for them to over-borrow, unless this borrowing is necessary to maintain a minimum level of subsistence consumption and also this situation would bring them to more severe difficulties. The same considerations apply to lenders: they shouldn't over-lend, unless losses linked with late/missed payments are below costs of an improved risk management/creditworthiness assessment or below earnings due to higher interest rates, fees and other revenues specific to “bad borrowers” (Shicks, 2010). Nonetheless a significant part of debtors, albeit small, becomes over-indebted. Therefore it's worth speculating on the reasons of this seeming non-sense.
Literature distinguished various possible causes for over-indebtedness. For the purpose of this work it's important to analyze them and then try to find some evidence from data available. A first cluster of likely over-indebtedness drivers is given by borrower's features:
• Income: since it is the main financing channel of debts, it is paramount for over-indebtedness. Intuitively, as income increases; debt problems decrease, but many authoritative sources claim otherwise (Betti et al, 2001). Actually people with high income could bear also more indebtedness, therefore if a debt income ratio is used, it should indicate curiously a higher debt burden for medium-high income families. This confirms the importance of different thresholds for different situations.A particular attention is required by households with a very low income (poor, structurally unemployed persons). These subjects require credit or don't pay debts (even to energy providers) because they are not able to cope with their expenses, even of small amounts. The worst case is given by subjects already over-indebted that need a loan to repay the previous existing debts. This could cause severe problems to intermediaries and families involved (D'Alessio and Iezzi, 2013);
• Employment status: of course being unemployed or having a very unstable labor income makes the financial condition of a household very weak (Shicks, 2010);
• Household's composition: very numerous families, ceteris paribus, may have a higher probability to become over-indebted. Another apparent situation of difficulty is represented by families in which there's only one breadwinner (e.g. single parent households), in particular if it is accompanied by a child or, a fortiori, some children (Betti et al, 2001). Children cause also a certain amount of expenses which cannot be reduced and, just after their birth, are accompanied by at least one parent reducing its working hours or ceasing paid work altogether (EC, 2008). More generally the concentration of dependents in a household is a very important issue;
• Housing tenure: house is one of the most important and frequent spending voices for households. These expenses could vary very much: in fact the family could be the outright owner, the owner still paying a mortgage or the tenant within a rental contract of the apartment in which it lives (ECB, 2013). Renters should have the highest expenses to face, but, in countries involved in housing bubbles, also owners with mortgages could be at risk of over-indebtedness;
• Personal characteristics: each individual has its own peculiarities in terms of attitude to debt. The propensities to saving or, conversely, to spending are fundamental variables to determine the behavior of a family (EC, 2008);
• Psychological/cognitive biases: as was showed by behavioral finance, individuals tend to make suboptimal decisions just because they're not rational and they are guided by feelings, heuristics or mental shortcuts. In particular overconfidence brings to underestimations of the probability of adverse events, confirmation bias pushes people to seek confirmation of their

aprioristic belief (Tekçe, 2013). Some persons never change their habits (habit persistence), some others are focused exclusively on short term (in particular who constantly lives in a precarious situation). At last, according to prospect theory, an individual's utility is much more conditioned by moving reference point rather than by wealth changes (Shicks, 2010);
• Age: since the income pattern over the life-cycle is not linear and, in particular, young people usually have low wages, they should have a higher propensity to debt than retired people or in the second half of their working life. (Betti et al, 2001). It would be interesting to verify the relationship between over-indebtedness and other demographic variables (e.g. sex, ethnicity), but this kind of data usually lacks;
• Health: problems in this field usually lead to high expenses, in some cases even to unemployment (EC, 2008). Moreover these costs are usually unexpected, thus; they could make liquidity management difficult. A particularly bad case is the one of addicted people;
• Financial literacy: it's critical for the comprehension and the assessment of proposed lending contract and more generally for a correct financial management (Lusardi and Tufano, 2009);
• Education level: besides financial literacy, general education broadens the probability to have a good job and a good income, which may mean more indebtedness but also greater capabilities to manage it (ECB, 2013).
Another large group of over-indebtedness drivers is linked with credit market features:• Market structure: it determines level of competition and availability-cost of information,
hence, indirectly, the cost of credit to households;• Informal credit alternatives: informal finance refers to financial transactions that occur
outside official financial institutions, thus, non-regulated by financial authorities. It doesn't deal with legality issues: borrowing from relatives is an informal credit operation as well as some illegal activities like loan sharking (Altunbas et al, 2010). It's evident that in the first case mentioned the probability to become over-indebted for a household decreases (usually there's no payment of interests), in the second increases. Therefore the concentration of over-indebted families in a certain system depends also from the quantity and the quality of these alternatives;
• Ease of borrowing money: in some countries obtaining credit is very easy, fast and it doesn't require collaterals neither accurate checks about borrower's creditworthiness. Obviously this could be an important determinant of over-indebtedness (Frade and Lopes, 2009);
• Unsecured credit: markets in which collaterals are little used should increase the likelihood of over-indebtedness. In particular consumer credit tends to be provided to subjects which are devoid of assets, need money also for common consumptions and can account only on their income;
• Financial exclusion: it's complicated to determine the direction of the causal relation with over-indebtedness (EC, 2008). The possibility that the first causes the latter could appear a paradox, but, if we focus on the subjective indicator of over-indebtedness, which, despite its limits, gives significant indications in social and political terms, it's not necessary to have multiple or very high debts. In particular, the necessity of a sudden and unexpected expense, even of a medium amount, for a low-income household with no access to the credit market could be catastrophic, e.g. the car used to go to work must be replaced (Gloukoviezoff, 2008). The same applies to utility bills: they are almost necessary and they're charged only after consumption, thus, for a financial-excluded household could become a heavy burden;
• Discrimination: any of its forms (statistical, of the employer, of the lender), creates disadvantageous conditions for the discriminated. It could also be linked with financial exclusion (EC, 2008).

Since debt relationships derive from synallagmatic contracts, over-indebtedness is caused also by errors and wrong evaluations by moneylenders. In particular the most relevant factors linked with institutions in the supply side that affect the likelihood of an excessive debt burden are:
• Aggressive marketing techniques and volume-based incentives for employees: they facilitate inappropriate allocation of credit and a focus on quantities that can create financial imbalances for borrowers and for lenders as well;
• Creditworthiness assessment practices: institutions that don't have a sound process of creditworthiness evaluation (for negligence or convenience) increase the possibility of creating a heavy burden for households, in particular when accompanied by financial imprudence by potential borrowers (Shicks, 2010);
• Lack of suitability of products provided with clients' needs: intermediaries may propose and provide to households forms of credit that don't fit with them. Typical examples are contracts characterized by short maturities and inflexible installment schedules offered to families with volatile income. Lenders are often reluctant to reschedule loans, too, which is ruinous for people with temporary honest liquidity difficulties (Frade and Lopes, 2009);
• Adverse selection for “worst” forms of credit: vulnerable population groups are sometimes directed towards the most costly options, such as 'cash credit' (EESC, 2014) In particular credit instruments like payday or SMS loans are characterized by very little due diligence, no collaterals, little information required to the borrowers and very high interest rates (Muttilainen and Valkama, 2008);
• Lack of transparency of terms and conditions: as in the case of products suitability, this is a topic on which EC is very interested and involved, as it was showed by MiFID (Directive 2004/39/CE), that, although, is focused on investment products. The lack of communication of this information is, first of all, unfair and produces also wrong financing decisions (EC, 2008);
• Debt collection practices: while a certain level of firmness is necessary to provide sufficient repayment incentives, if substantial penalties are charged for late payments, a household in momentary difficulty could be brought to over-indebtedness. This is particularly pernicious when lenders make high profits in case of late/failure to pay (CGAP, 2011).
Another cluster of very frequent determinants of over-indebtedness is given by unexpected events, since they modify the situation known when the credit relationship started. The main of these events are:
• Income reduction, for example a member of the family loses its job;• Unforeseen expenses, e.g. medical care;• Increase in debt cost, usually produced by interest rates shifts (Coin et al, 2013);• Relationship breakdown, in particular when a household required credit relying on the
income of a person that afterwards divorces (Bridges et al, 2008).
The last group of over-indebtedness possible causes deals with political, economic, cultural and social environment of each country, inter alia:
• Natural disasters: they can inhibit the production of income by a family for a very long time (CGAP, 2011);
• Changes in government policies: the liberalization of certain markets, some welfare state reforms or a “light touch” policy by financial operators' supervisors can have a deep impact on borrowers' income and on lenders' profits, increasing over-indebtedness likelihood (Shicks, 2010);
• Macroeconomic situation: shocks related to relative prices of certain goods like food and fuel could have a major impact on a household's financial situation (CGAP, 2011). Also a

financial-economic crisis can considerably reduce families' purchasing power, increasing the risk to become over-indebted. In this case over-indebtedness (and more generally financial difficulties for households) could become a mass phenomenon, with severe consequences within the area hit and difficulties in defining the most adequate policy to adopt, as showed by the recent sovereign debt crisis in the Euro area. Other important problems are rises in the general cost of living and variations in wages (including eventual minimum wage levels), which effects are heavier for low-income people;
• Income inequality: the dissatisfaction of people at the bottom of social pyramid could bring them to try to have the same opportunities of high-income households by borrowing, hence, it can produce poor financing decisions (Frade and Lopes, 2009);
• Institutions: efficiency of the judicial system affects the rapidity and the cost of bankruptcy (Shicks, 2010). Broadly speaking, legal enforcement of the contracts in a certain environment determines the ease of debt recovering and, indirectly, the availability of credit provided by lenders in quantitative and qualitative terms (Duygan-Bump and Grant, 2008) ;
• Cultural aspects: in some cultural contexts debt is considered absolutely normal, while in others is felt like a fault. The same considerations apply to bankruptcy, with significant differences across the EU. Some studies (Fürth and Georgarakos, 2010) highlighted also the importance of beliefs about corruption (heavily corrupted institutions should push to illicit actions), religion, justice system for borrower's behavior. Similarly also social capital helps to explain different choices in different geographical areas. Social capital is the productive value (in terms of 'well-being outcomes') of the set of personal relationships, social network support, civic engagement and trust-cooperative norms that characterize a certain society (Scrivens and Smith, 2013).
Table 2.1 – Taxonomy of main possible causes of over-indebtedness
Borrowers Market Lenders Unexpected events Environment
• Income• Employment
status• Household's
composition• Housing
tenure• Personal
characteristics• Psychological
- cognitive biases
• Age• Health• Financial
literacy• Education
level
• Structure• Informal credit
alternatives• Ease of
borrowing money
• Unsecured credit
• Financial exclusion
• Discrimination
• Marketing techniques
• Volume-based incentives
• Creditworthiness assessment
• Products' suitability with client's needs
• Adverse selection for some credit forms
• Debt collection practices
• Income reduction
• Unforeseen expenses
• Increase in debt cost
• Relationship breakdown
• Natural disasters• Changes in
government policy
• Macroeconomic situation
• Income inequality
• Efficiency of the judicial system
• Cultural aspects
Source: own elaboration
A successful distinction in literature was made between the so-called active over-indebtedness, caused by mismanagement of resources (e.g. excessive expenditures or wrong expectations) and passive over-indebtedness, due to unforeseen events (Anderloni and Vandone, 2010). Another possible classification includes also the category of potential over-indebtedness (e.g. low future income) that regards households at risk (Betti et al, 2001).

Some empirical evidences
The aim of this section is trying to get some insights about over-indebtedness in Europe, starting from data available about debt and indebtedness within the European Union. In particular we'd like to have an overview of which credit forms, social groups and countries are affected by a higher frequency or severity of cases of over-indebtedness (or debt burden), in order to identify some critical factors which could be linked with this phenomenon. Likewise the same working method will be applied to individuate credit forms, social groups and countries for which over-indebtedness is a less serious and more manageable problem, in quantitative and qualitative terms, with the purpose of detecting which may be the best practices in this field.Data used in this work come mainly from two huge European studies: Eurosystem households finance and consumption survey (HFCS) and European Survey on Income and Living Conditions (EU SILC). The first is a study conducted by the European Central Bank with the participation of various national central banks. It is mainly focused on the Euro area and it isn't specifically directed to over-indebtedness, but it has a section dedicated to debt and publishes some indicators of debt burden and financial fragility (ECB, 2013). The latter is a great survey about the general living conditions of European households and shows some data referred to all EU countries about arrears and other situations of financial difficulties (Eurostat, 2014). It is organized yearly by Eurostat, but in 2008 a specific module of the study was fully dedicated to over-indebtedness and financial exclusion (Eurostat, 2008). Also some further specifications of information given by these two reports, coming from other authoritative European sources, will be analyzed. A third source will be Eurobarometer, which is a survey about perception by European citizens of some relevant issues for the EU (TNS Opinion & Social, 2010). In particular it deals with feelings of Europeans about risk of becoming over-indebted, that can be interpreted as a subjective indicator of over-indebtedness (table 3.1)
Table 3.1 - Main sources of data used and their characteristics
Source Responsible of the survey
Reference period Contents
HFCS ECB 2010 Not specifically directed to indebtedness, but shows data about debt and debt burden
EU SILC Eurostat 2012 for regular modules Information about households arrears
2008 for ad hoc module about over-indebtedness
Households with overdrafts on bank accounts, uncleared balances on credit cards and arrears
Eurobarometer European Commission 2010 People who feel at risk of over-indebtedness
.Source: own elaboration
Debt and participation to credit markets
Before analyzing in details specific data about over-indebtedness, it's worth considering more generally information about debt and credit markets. This is important to understand the dimensions of the universe of this study, i.e. how many households had access to lending in the reference period and what kind of debts they hold. As can be expected, only a part of the population holds a debt. In particular in the Euro area, according to HFCS, 43.7% of the households was indebted toward the financial system in the reference period (ECB, 2013): more than a half of them had a mortgage and slightly more than two-thirds had a non-mortgage debt (table 3.1). Among mortgages the most recurrent were those directed to the household's main residence (HMR), while in non-mortgage

group the most frequent debts were other forms of loans (ECB, 2013).
Table 3.2 - Participation of population to credit markets and incidence of different debt components in the Euro area (EA)*
Total debt
Mortgage debt Non-mortgage debt
TotalHMR mortgage
Other mortgage
TotalCredit lines/overdraft
Credit card
Non-mortgage loans
% of indebted households per debt component/population
43.7 23.1 19 5.6 29.3 10.2 4.3 22.4
% of indebted households per debt component/total indebted households
100 52.9 44.4 12.8 67 23.3 9.8 51.2
*The percentage of total debt is not equal to the sum of the percentages of each debt component since a household could hold contemporarily different kind of debts. This applies also to total mortgage debt and total non-mortgage debt
Source: own elaboration on data from ECB, 2013
It's possible to get more detailed information, in particular what kind of households is more likely to be indebted, function of size, housing status, income and wealth of the whole family and, moreover, age, work status and education of the reference person. We can see that the relationship between income/education/household size and indebtedness is monotonic or very close to monotonic (increasing), while age is linked with indebtedness by a humped curve (with the maximum in the 35-44 cluster). Wealth apparently is not linked with indebtedness (only the second quintile has values significantly different than other quintiles), while employed (and self-employed) are more likely to be indebted than non-working people and this becomes much more likely in comparison with retired. Obviously owners of their residence with a mortgage are more frequently indebted than renters (table 3.3). To better represent these trends the ratio between the percentage of indebted households conditional to each demographic category (IHDA) and the Euro Area average (43.7%) is provided in the following table, next to IHDA
Table 3.3 – Participation of population to credit market by demographic characteristics in the EA
Demographic attribute% of indebted households conditional to demographic attribute (IHDA)
IHDA/EA average
Household size
1 29.2 0.67
2 39.7 0.913 55.6 1.274 63.6 1.455 and more 64 1.46
Housing status
Owner-outright 24.6 0.56
Owner-mortgage 100 2.29Renter/other 35.9 0.82
Quintile of EA income
1 22.9 0.52
2 35 0.803 43.7 14 55.8 1.285 61.3 1.40

Quintile of EA wealth
1 44.1 1.01
2 38 0.873 46.1 1.054 45.1 1.035 45.3 1.04
Age of reference person
16-34 55.3 1.26
35-44 61.8 1.4145-54 55.8 1.2855-64 43.1 0.9964-74 23.7 0.5475+ 7.7 0.18
Work status of reference person
Employee 57.9 1.32
Self-employed 56.8 1.3Retired 19.5 0.45Other not working
39.5 0.9
Education of reference person
Primary/no education
30.3 0.69
Secondary 48.7 1.11Tertiary 54.1 1.24
Source: own elaboration on data from ECB, 2013
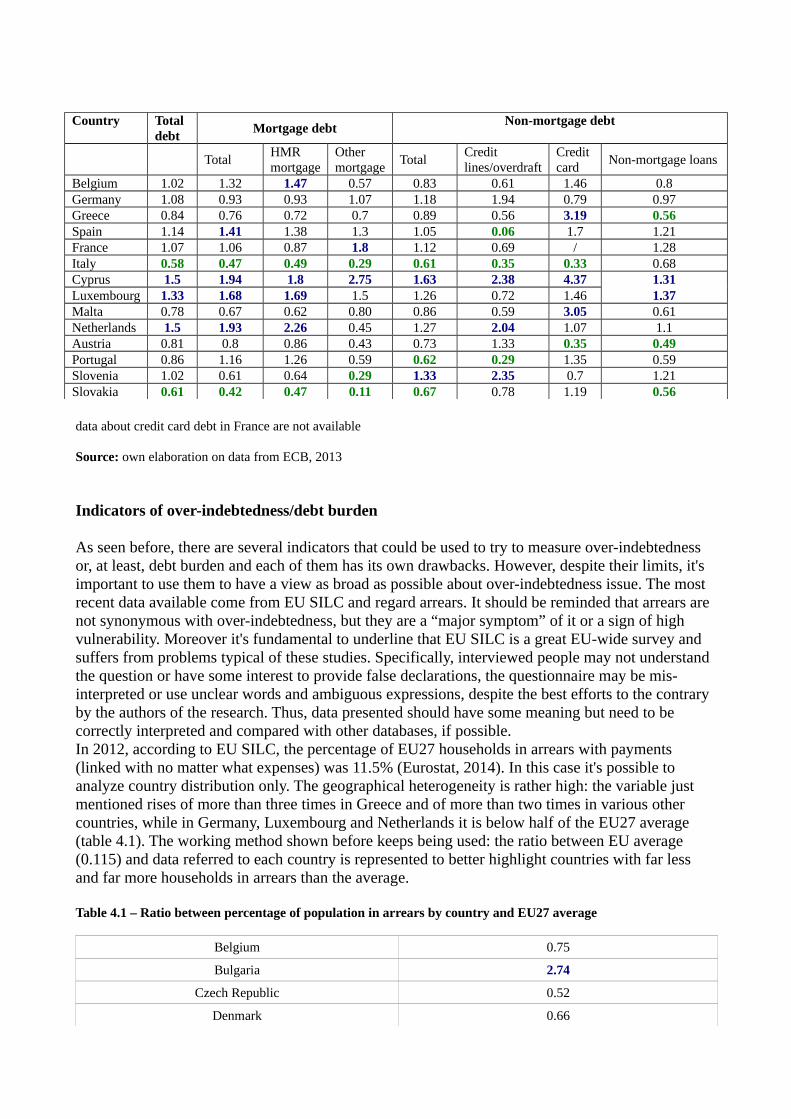
More insights could be obtained focusing on countries. HFCS provides not only the percentage of indebted households per country, but also the percentage of indebted households per country conditional on debt component (e.g. credit card debt). We will adopt the same method used before for demographic characteristics and, thus, compare these data with the EA average through a ratio. The EA average considered are those shown in the first row of table 3.2. Specifically we will compare the percentage of indebted households in each country (e.g. Belgium) with the percentage of indebted households in the Euro area to understand where there's more probability for a family to have a debt toward the financial system (and where there's less). Likewise we will compare also the percentage of indebted households conditional to a certain debt component in each country (e.g. HMR mortgage debt in Belgium) and the percentage of indebted households conditional to the same debt component referred to EA (e.g. HMR mortgage debt in EA).If we analyze data obtained by adopting this procedure, it's possible to say that there are strong differences across countries. Netherlands, Luxembourg and Cyprus are countries in which there's the highest proportion of households indebted, while Italy and Slovakia have few of them. Talking about mortgages, we can distinguish three groups: countries in which there are many owners of houses and few mortgages (e.g. Italy), those in the opposite situation (e.g. Netherlands) and areas in which mortgages and owners are strongly positive correlated (ECB, 2013). In non-mortgage side Italy, Portugal and Slovakia are the countries with fewer households indebted and Cyprus and Slovenia, instead, are well-above average. The heterogeneity is particularly intense for credit cards: Italy and Austria have a percentage of indebted households around one third of the average and Greece, Malta and Cyprus are three times above the average itself (table 3.4).
Table 3.4 – Ratio between percentage of indebted households conditional on country and debt component and average percentage of indebted households conditional on debt component in EA
Country Total debt
Mortgage debtNon-mortgage debt
TotalHMR mortgage
Other mortgage
TotalCredit lines/overdraft
Credit card
Non-mortgage loans
Belgium 1.02 1.32 1.47 0.57 0.83 0.61 1.46 0.8Germany 1.08 0.93 0.93 1.07 1.18 1.94 0.79 0.97Greece 0.84 0.76 0.72 0.7 0.89 0.56 3.19 0.56Spain 1.14 1.41 1.38 1.3 1.05 0.06 1.7 1.21France 1.07 1.06 0.87 1.8 1.12 0.69 / 1.28Italy 0.58 0.47 0.49 0.29 0.61 0.35 0.33 0.68Cyprus 1.5 1.94 1.8 2.75 1.63 2.38 4.37 1.31Luxembourg 1.33 1.68 1.69 1.5 1.26 0.72 1.46 1.37Malta 0.78 0.67 0.62 0.80 0.86 0.59 3.05 0.61Netherlands 1.5 1.93 2.26 0.45 1.27 2.04 1.07 1.1Austria 0.81 0.8 0.86 0.43 0.73 1.33 0.35 0.49Portugal 0.86 1.16 1.26 0.59 0.62 0.29 1.35 0.59Slovenia 1.02 0.61 0.64 0.29 1.33 2.35 0.7 1.21Slovakia 0.61 0.42 0.47 0.11 0.67 0.78 1.19 0.56
data about credit card debt in France are not available
Source: own elaboration on data from ECB, 2013
Indicators of over-indebtedness/debt burden
As seen before, there are several indicators that could be used to try to measure over-indebtedness or, at least, debt burden and each of them has its own drawbacks. However, despite their limits, it's important to use them to have a view as broad as possible about over-indebtedness issue. The most recent data available come from EU SILC and regard arrears. It should be reminded that arrears are not synonymous with over-indebtedness, but they are a “major symptom” of it or a sign of high vulnerability. Moreover it's fundamental to underline that EU SILC is a great EU-wide survey and suffers from problems typical of these studies. Specifically, interviewed people may not understand the question or have some interest to provide false declarations, the questionnaire may be mis-interpreted or use unclear words and ambiguous expressions, despite the best efforts to the contrary by the authors of the research. Thus, data presented should have some meaning but need to be correctly interpreted and compared with other databases, if possible.In 2012, according to EU SILC, the percentage of EU27 households in arrears with payments (linked with no matter what expenses) was 11.5% (Eurostat, 2014). In this case it's possible to analyze country distribution only. The geographical heterogeneity is rather high: the variable just mentioned rises of more than three times in Greece and of more than two times in various other countries, while in Germany, Luxembourg and Netherlands it is below half of the EU27 average (table 4.1). The working method shown before keeps being used: the ratio between EU average (0.115) and data referred to each country is represented to better highlight countries with far less and far more households in arrears than the average.
Table 4.1 – Ratio between percentage of population in arrears by country and EU27 average
Belgium 0.75
Bulgaria 2.74
Czech Republic 0.52
Denmark 0.66

Germany 0.42
Estonia 1.14
Ireland 2.05
Greece 3.39
Spain 0.95
France 0.89
Italy 1.17
Cyprus 2.74
Latvia 2.12
Lithuania 1.15
Luxembourg 0.36
Hungary 2.3
Malta 0.96
Netherlands 0.43
Austria 0.56
Poland 1.32
Portugal 0.84
Romania 2.7
Slovenia 1.83
Slovakia 0.72
Finland 0.94
Sweden 0.58
data about UK are not shown, since 2012 represents a structural break in the time series
Source: own elaboration on data from Eurostat, 2014
HFCS, instead, provides data about a series of indicators of debt burden referred to 2010, with specifications for country and demographic characteristics. The first of these variables considered is debt to asset ratio. This ratio considers the capability of households to sell their assets to face debt payments: in case of high values the families have limited possibility to do this. It is not an indicator of over-indebtedness in a strict sense, but it could be a sign of risk: e.g. a major drop in income could make impossible to meet debt obligations if it's not possible to account on assets. Its value in the Euro area is 0.218 (ECB 2013), taking into account indebted households only (i.e. indebted households of the EA have an average debt to asset ratio of 0.218; of course for other households the ratio is equal to 0)2. Higher percentages can be observed for one-person households or very numerous families, renters or owners with mortgage (regarding housing status), households in which the reference person is particularly young, with a low income, low wealth and no occupation. More generally the ratio decreases with an increasing age, income or wealth. The lowest values are those referred to owners-outright, oldest and wealthiest people (tab 4.2). Once again the variable
2 Assets here considered are both real and financial. The first category includes values of HMR, other real estate property, vehicles (cars, boats, planes, motorbikes), valuables and the self-employment business of household members. Financial assets include: deposits, investments in mutual funds, bonds, investments in non-self employment private business, publicly traded shares, managed investment accounts, money owed to households as private loans, other financial products (options, futures, precious metals, future proceeds from a lawsuit/estate that is being settled, royalties), private pension plans and whole life insurance policies
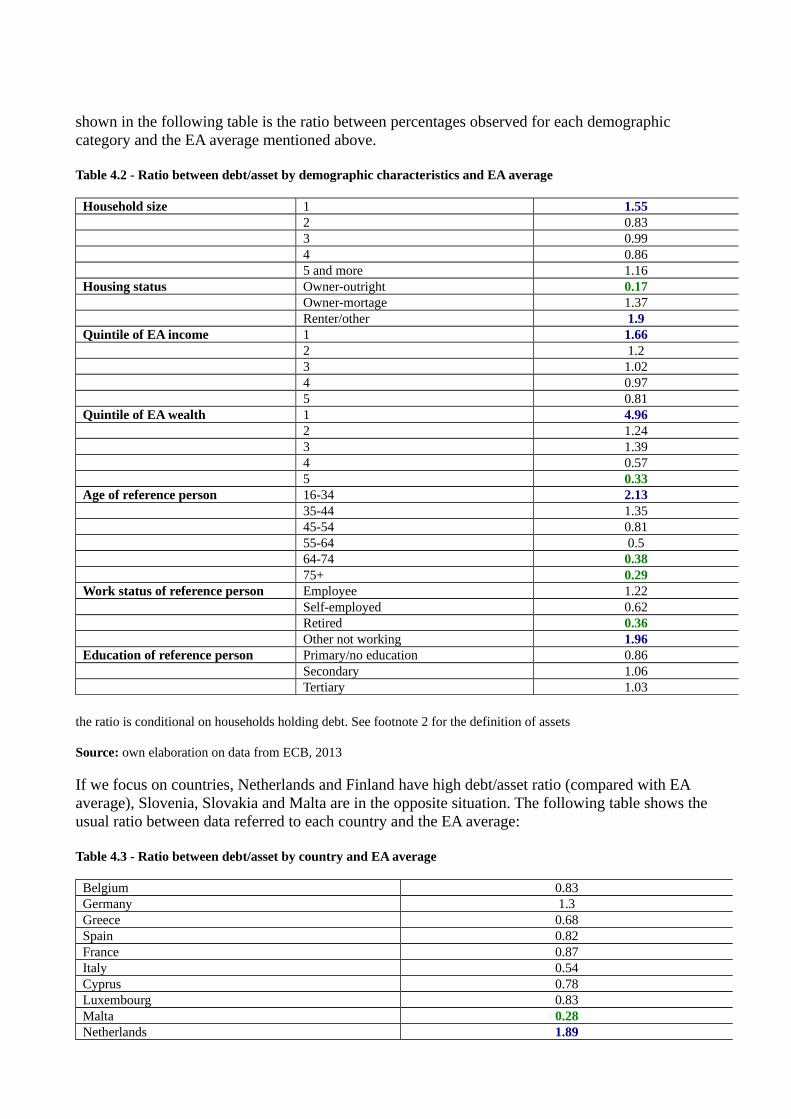
shown in the following table is the ratio between percentages observed for each demographic category and the EA average mentioned above.
Table 4.2 - Ratio between debt/asset by demographic characteristics and EA average
Household size 1 1.552 0.833 0.994 0.865 and more 1.16
Housing status Owner-outright 0.17Owner-mortage 1.37Renter/other 1.9
Quintile of EA income 1 1.662 1.23 1.024 0.975 0.81
Quintile of EA wealth 1 4.962 1.243 1.394 0.575 0.33
Age of reference person 16-34 2.1335-44 1.3545-54 0.8155-64 0.564-74 0.3875+ 0.29
Work status of reference person Employee 1.22Self-employed 0.62Retired 0.36Other not working 1.96
Education of reference person Primary/no education 0.86Secondary 1.06Tertiary 1.03
the ratio is conditional on households holding debt. See footnote 2 for the definition of assets
Source: own elaboration on data from ECB, 2013
If we focus on countries, Netherlands and Finland have high debt/asset ratio (compared with EA average), Slovenia, Slovakia and Malta are in the opposite situation. The following table shows the usual ratio between data referred to each country and the EA average:
Table 4.3 - Ratio between debt/asset by country and EA average
Belgium 0.83Germany 1.3Greece 0.68Spain 0.82France 0.87Italy 0.54Cyprus 0.78Luxembourg 0.83Malta 0.28Netherlands 1.89

Austria 0.77Portugal 1.18Slovenia 0.18Slovakia 0.3Finland 1.59
the ratio is conditional on households holding debt. See footnote 2 for the definition of assets
Source: own elaboration on data from ECB, 2013
Another variable provided by HCFS is debt to income ratio. It has a similar meaning to the previous ratio: in fact it represents the capability of a household to face debt payments accounting on income of its members (total debt and annual income are considered). Therefore the same considerations could be applied: it's an indicator of risk and critical values should be the highest ones. The EA average is 0.62 (ECB, 2013), also in this case it is referred to indebted households only. Despite the similarities just underlined, we can see that this ratio has a very low correlation with the previous (ECB, 2013): it increases with household size, it’s particularly high for owners with mortgage and low for other housing status. It’s humped with the highest values in the middle-high part of the distribution for wealth and in the middle-low part for age, it’s very low for households in the middle quintiles of income and higher for households in the tails. At last it’s very low for retired, low for non-working people or with education until the secondary while it’s almost high for self-employed and people with tertiary education (table 4.4). This means there's a seeming contradiction: in fact some of the categories supposedly more at risk of over-indebtedness show a low debt/income. The possible explanation is that people with low income, low education and non-working have more difficulty to get access to credit by the financial system and they have by definition less income and often less assets to make more debt feasible. Of course establishing which of these factors (low income, low education, bad working status, few assets, financial difficulties) is cause of the others could be a very complex task and is out-of-scope of this work. The following table shows the usual ratio between the variable taken into account by demographic attribute and the EA average:
Table 4.4 - Ratio between debt/income by demographic characteristics and EA average
Household size 1 0.692 0.793 1.164 1.435 and more 1.26
Housing status Owner-outright 0.44Owner-mortage 2.82Renter/other 0.26
Quintile of EA income 1 1.092 0.643 0.834 1.115 1.22
Quintile of EA wealth 1 0.42 0.493 2.114 1.315 1.22
Age of reference person 16-34 1.0435-44 1.5545-54 1.0755-64 0.6464-74 0.6

75+ 0.25Work status of reference person Employee 1.11
Self-employed 1.47Retired 0.49Other not working 0.7
Education of reference person Primary/no education 0.8Secondary 0.76Tertiary 1.68
the ratio is conditional on households holding debt. Income considered is annual
Source: own elaboration on data from ECB, 2013
About countries Slovenia and Slovakia show the lowest value for this ratio, while in Netherlands, Portugal and Cyprus debt/income reaches its maximums. In the following table the ratio between the data for each country and the EA average is computed:
Table 4.5 - Ratio between debt/income by country and EA average
Belgium 1.29Germany 0.6Greece 0.76Spain 1.83France 0.81Italy 0.81Cyprus 2.53Luxembourg 1.4Malta 0.84Netherlands 3.13Austria 0.57Portugal 2.16Slovenia 0.43Slovakia 0.37Finland 1.04
the ratio is conditional on households holding debt. Income considered is annual
Source: own elaboration on data from ECB, 2013
HFCS provides also debt service to income ratio, which, as seen before, is one of the mostly used indicators of over-indebtedness. It's not the case to repeat here its characteristics. Both debt service and income considered in the survey are monthly. The Euro area average is 0.139 (ECB, 2013), in particular it is not highly influenced by household size neither by education, it’s higher for owners with mortgage and lower for other housing status, it has a trade-off with income and age. It’s low for retired and above average for self-employed, while the relationship with wealth is increasing at the beginning and then decreasing. In comparison with debt to income ratio, it is lower in countries in which mortgages have a longer duration and is lower also for non-working, young, poor (in terms of assets) people, probably because these categories have less assets than the average, but also less debt (ECB, 2013). Obviously this doesn't mean that being poor and having no work but also lower debt payments is desirable. The next table represents the ratio between debt service/income and the EA average:
Table 4.6 - Ratio between debt service/income by demographic characteristics and EA average
Household size 1 1.02

2 0.913 1.014 1.055 and more 1.14
Housing status Owner-outright 0.81Owner-mortage 1.32Renter/other 0.57
Quintile of EA income 1 1.912 1.193 1.084 1.015 0.81
Quintile of EA wealth 1 0.752 0.963 1.294 1.045 0.91
Age of reference person 16-34 1.1135-44 1.1645-54 0.9355-64 0.8464-74 0.8875+ 0.6
Work status of reference person Employee 1Self-employed 1.20Retired 0.81Other not working 1.09
Education of reference person Primary/no education 0.92Secondary 1.09Tertiary 1.68
the ratio is conditional on households holding debt. Income and debt service considered are monthly
Source: own elaboration on data from ECB, 2013
Talking about countries, debt service/income has less variability than the previous two variables. Cyprus is again the country with the highest index and also Spain is well above average, at the opposite side there is Austria. Next table represent the ratio between debt service/income conditional on country and EA average:
Table 4.7 - Ratio between debt service/income by country and EA average
Belgium 1.09Germany 0.78Greece 1.06Spain 1.43France 1.06Italy 0.95Cyprus 1.8Luxembourg 1.19Malta 0.83Netherlands 1.04Austria 0.4Portugal 1.24Slovenia 1.14Slovakia 0.9

the ratio is conditional on households holding debt. Data about Finland are not available. Income and debt service considered are montly
Source: own elaboration on data from ECB, 2013
It’s possible to go even more in details about this variable. In particular in 2010 in the Euro area the percentage of households for which debt service to income ratio was equal or higher than 0.4 was 3.4% (Bank of Italy, 2014). The ratio is calculated considering the population as a total and not the indebted households only. The threshold of 0.4 is one of the most usually used to distinguish whether a household is over-indebted or not. Therefore we could say that, according to this ratio, 3.4% of Euro area households were likely over-indebted in 2010. In particular in Netherlands and Spain this situation regarded more than 5% of the population and in Cyprus more than 15%, while in Malta it regarded only 0.6% of households (Bank of Italy 2014).Contemporary being likely over-indebted and having a huge debt compared with the income, of course, represents a very critical situation. It regarded 2.5% of Euro area families in the reference period (Bank of Italy, 2014). More precisely the share of the families in the category previously mentioned (debt service=>0.4) which debt was also higher than 3 times monthly income was very low in Italy, Austria and Malta and very high again in Cyprus, Netherlands and Spain. The situation of households likely over-indebted which liquid activities3 are few compared with the monthly income maybe is even worse. This means that these families have a heavy debt burden and neither can account on a minimum amount of liquid assets to face any kind of expected or unexpected expense. The share of households conditional of a debt service to income =>0.4 which liquid activities were also less than 2 times the monthly income were very few in Malta again, Austria and Germany, in the opposite situation there were Cyprus and Spain (table 4.8). The EA average, instead, is 1.7% (Bank of Italy, 2014).
Table 4.8 – Percentage of vulnerable indebted households/total population by country
Country Debt service/income=>40%
Total Of which debt/income=>3 Of which liquid activities < 2 monthly income
Euro area 3.4 2.5 1.7
Belgium 3.5 2.6 1.3
Germany 2.3 1.7 0.9
Greece 3.1 2 2.2
Spain 8.4 6.4 5.5
France 2.5 1.5 1
Italy 1.8 0.9 1
Austria 1.5 0.7 0.4
Cyprus 16 12.8 9.9
Luxembourg 4.1 3.5 1.8
Malta 0.6 0.4 0.1
Netherlands 7.2 6.6 2.5
Portugal 5 3.8 2.7
income and debt service considered are monthly. For a definition of liquid activities see footnote 3. Euro area doesn't include Latvia, Estonia, Ireland, Slovenia and Finland
3 Liquid activities here considered include deposits, bonds, shares and mutual funds

Source: own elaboration on data from Bank of Italy, 2014
Another ratio that can be analyzed through HFCS is mortgage service to income ratio, which is analogous to debt service ratio, but is only referred to mortgage. The Euro area value is 0.159 (ECB, 2013) if only households with a mortgage are considered and mortgage service/income taken into account are monthly. The distribution for demographic attributes is also very similar to that of debt service ratio: most evident differences are the above average values related to some categories supposedly at risk of over-indebtedness: the two first quintiles of wealth, non-working people and households composed by only one person. The following table shows the values of mortgage service ratio referred to each group mentioned in the first two columns divided by the EA average:
Table 4.9 - Ratio between mortgage service/income by demographic characteristics and EA average
Household size 1 1.182 0.943 1.024 0.975 and more 1.03
Housing status Owner-outright 0.79Owner-mortage 1.02Renter/other 0.91
Quintile of EA income 1 2.522 1.463 1.234 0.995 0.72
Quintile of EA wealth 1 1.42 1.213 1.084 0.915 0.81
Age of reference person 16-34 1.2935-44 1.0745-54 0.8655-64 0.864-74 0.9575+ 0.69
Work status of reference person Employee 0.99Self-employed 1.06Retired 0.84Other not working 1.26
Education of reference person Primary/no education 1.11Secondary 0.97Tertiary 0.97
the ratio is conditional on households holding mortgage debt. Income and mortgage service considered are monthly
Source: own elaboration on data from ECB, 2013
Mortgage debt service/income reaches the farther values from the average in Cyprus, Spain and Slovakia (above average) and in Slovenia (below). Next table shows the usual comparison between the values of the ratio conditional on country and the EA average:
Table 4.10 - Ratio between mortgage service/income by country and EA average
Belgium 0.93

Germany 0.8Greece 1.03Spain 1.29France 1.09Italy 0.97Cyprus 1.59Luxembourg 1.02Malta 0.80Netherlands 0.89Portugal 1.05Slovenia 0.74Slovakia 1.28
the ratio is conditional on households holding mortgage debt. Data about Finland are not available. Data about Austria are not shown because, according to standard error, are not significant. Income and mortgage service considered are montly
Source: own elaboration on data from ECB, 2013
The last variable from HFCS we will deal with is loan to value ratio, which expresses the portion of the value of the household main residence (HMR) covered by the mortgage thanks to which it was acquired. Obviously this ratio is computed only for households with a mortgage. It may be an indicator of risk of over-indebtedness when it is very high, because this means that probably the household had few financial resources when purchased the house. Its value in the Euro area is 0.373 (ECB 2013). The highest ratios are registered for the first two quintiles of wealth and for the first group of age (less than 35 years old). The following table shows the ratio between loan/value and EA average:
Table 4.11 - Ratio between loan/value of HMR by demographic characteristics and EA average
Household size 1 1.142 0.953 1.024 0.895 and more 1.07
Quintile of EA income 1 0.882 0.913 0.924 1.025 1.06
Quintile of EA wealth 1 3.012 23 1.24 0.645 0.47
Age of reference person 16-34 1.5135-44 1.0845-54 0.7855-64 0.6764-74 0.5475+ 0.51
Work status of reference person Employee 1.07Self-employed 0.9Retired 0.53Other not working 0.92
Education of reference person Primary/no education 0.85Secondary 1

Tertiary 1.07
the ratio is conditional on households holding mortgage debt
Source: own elaboration on data from ECB, 2013
About countries, the ones which have a value of loan/value significantly higher than the average are Netherlands and Finland, for which the ratio is respectively equal to 0.525 and 0.486 (ECB, 2013). Therefore these may be areas in which there could be some additional risk of over-indebtedness linked with this particular issue. It's interesting to notice that Spain's ratio (these data are referred to 2008) is below the average, in spite of the speculative bubble on real estate market (Dreger and Kholodilin, 2011). A possible explanation is the fact that, during a bubble, the evaluation of assets is far from the fundamentals, thus a great value of the denominator keeps this ratio low. This shows again that the use of an indicator (or even multiple indicators) could be misleading, if the context is ignored. The table below shows the usual ratio between the values registered in each country and the EA average:
Table 4.12 - Ratio between loan/value of HMR by country and EA average
Belgium 0.77Germany 1.12Greece 0.85Spain 0.83France 0.87Italy 0.8Cyprus 0.85Luxembourg 0.74Malta 0.53Netherlands 1.41Portugal 1.11Slovakia 1Finland 1.3
the ratio is conditional on households holding mortgage debt. Data about Austria and Slovenia are not shown because, according to standard error, are not significant
Source: own elaboration on data from ECB, 2013
EU SILC 2008 ad hoc module
The greatest and most recent survey specifically directed to over-indebtedness is an occasional module dedicated to it by Eurostat in 2008, within the framework of EU SILC. Questions asked in this research, actually, don’t give indications about the current situation, since they were collected before the crisis. Despite this, they have a higher degree of precision than any other, since they were thought just to define and measure the issues of over-indebtedness and financial exclusion in the European Union. The variables on which the attention is focused on in this database and are of great interest for the purpose of this work are arrears, imbalances on credit/store cards and overdrafts on bank accounts. Usually also a specification of the severity of arrears is given, comparing their amount with households' monthly income.
However, an attempt to use information coming from this survey risks providing distorted and weak results. As highlighted by the methodological paper that followed the research (Eurostat, 2010), there were several problems with the variables which are fundamental from the perspective of this
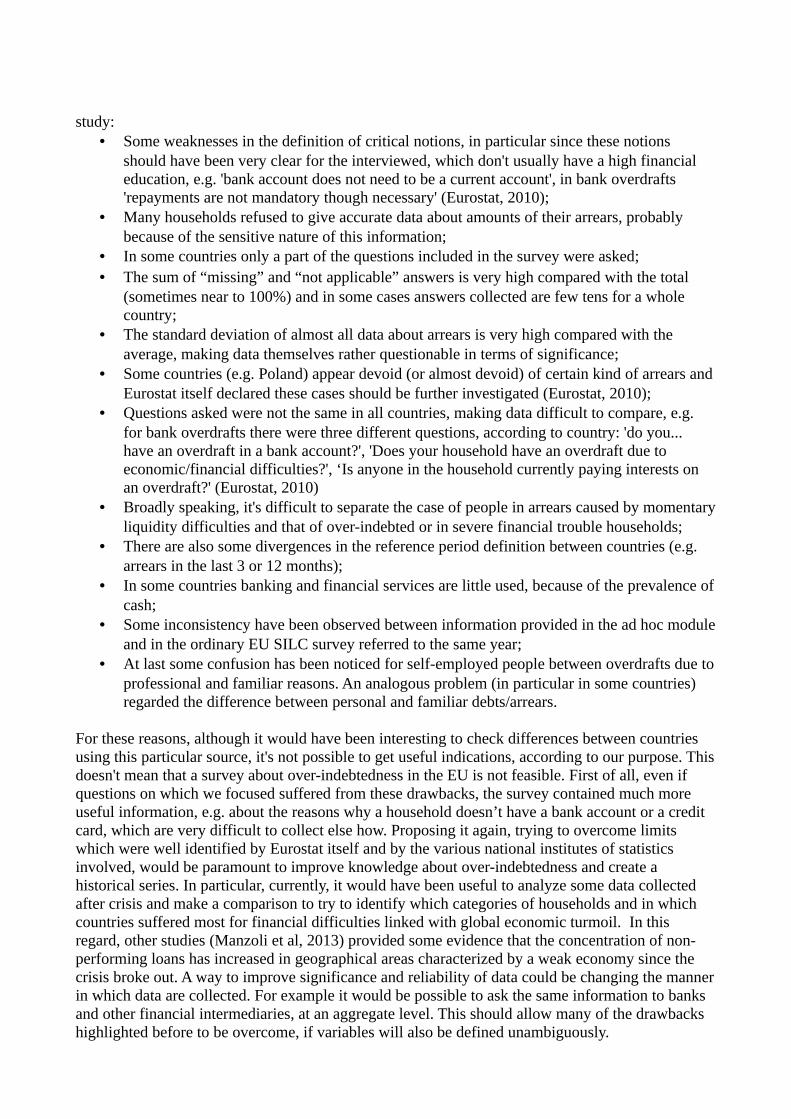
study:• Some weaknesses in the definition of critical notions, in particular since these notions
should have been very clear for the interviewed, which don't usually have a high financial education, e.g. 'bank account does not need to be a current account', in bank overdrafts 'repayments are not mandatory though necessary' (Eurostat, 2010);
• Many households refused to give accurate data about amounts of their arrears, probably because of the sensitive nature of this information;
• In some countries only a part of the questions included in the survey were asked;• The sum of “missing” and “not applicable” answers is very high compared with the total
(sometimes near to 100%) and in some cases answers collected are few tens for a whole country;
• The standard deviation of almost all data about arrears is very high compared with the average, making data themselves rather questionable in terms of significance;
• Some countries (e.g. Poland) appear devoid (or almost devoid) of certain kind of arrears and Eurostat itself declared these cases should be further investigated (Eurostat, 2010);
• Questions asked were not the same in all countries, making data difficult to compare, e.g. for bank overdrafts there were three different questions, according to country: 'do you... have an overdraft in a bank account?', 'Does your household have an overdraft due to economic/financial difficulties?', ‘Is anyone in the household currently paying interests on an overdraft?' (Eurostat, 2010)
• Broadly speaking, it's difficult to separate the case of people in arrears caused by momentary liquidity difficulties and that of over-indebted or in severe financial trouble households;
• There are also some divergences in the reference period definition between countries (e.g. arrears in the last 3 or 12 months);
• In some countries banking and financial services are little used, because of the prevalence of cash;
• Some inconsistency have been observed between information provided in the ad hoc module and in the ordinary EU SILC survey referred to the same year;
• At last some confusion has been noticed for self-employed people between overdrafts due to professional and familiar reasons. An analogous problem (in particular in some countries) regarded the difference between personal and familiar debts/arrears.
For these reasons, although it would have been interesting to check differences between countries using this particular source, it's not possible to get useful indications, according to our purpose. This doesn't mean that a survey about over-indebtedness in the EU is not feasible. First of all, even if questions on which we focused suffered from these drawbacks, the survey contained much more useful information, e.g. about the reasons why a household doesn’t have a bank account or a credit card, which are very difficult to collect else how. Proposing it again, trying to overcome limits which were well identified by Eurostat itself and by the various national institutes of statistics involved, would be paramount to improve knowledge about over-indebtedness and create a historical series. In particular, currently, it would have been useful to analyze some data collected after crisis and make a comparison to try to identify which categories of households and in which countries suffered most for financial difficulties linked with global economic turmoil. In this regard, other studies (Manzoli et al, 2013) provided some evidence that the concentration of non-performing loans has increased in geographical areas characterized by a weak economy since the crisis broke out. A way to improve significance and reliability of data could be changing the manner in which data are collected. For example it would be possible to ask the same information to banks and other financial intermediaries, at an aggregate level. This should allow many of the drawbacks highlighted before to be overcome, if variables will also be defined unambiguously.

Subjective indicators of over-indebtedness
At last it's possible to analyze some subjective and risk indicators of over-indebtedness related to 2010, according to results of Eurobarometer survey. The limits and benefits of the use of a subjective indicator were described before, such as the caution with which it's necessary to evaluate data coming from a huge international survey. However, we can see that a significant part of European felt at risk of becoming over-indebted, as shown in the following table:
Table 6.1 – Percentage of European who feel at risk of over-indebtedness
Very at risk Fairly at risk Not very at risk Not at all at risk
6 19 31 41
Source: TNS Opinion & Social, 2010
People who felt at risk of over-indebtedness were mostly in the 25-54 year-old group, with a secondary education and among manual workers, house persons and unemployed, while people still studying, elder, with a good work and retired were the less worried about this problem (table 6.2). In the following table a ratio is used between the percentage of interviewed who declared to feel at risk of over-indebtedness and the European average taken from table 6.1 (sum of “very at risk” and “fairly at risk”). As said before, this technique is used to highlight categories far from the average both above and below.
Table 6.2 – Ratio between percentage of European who feel at risk of over-indebtedness by demographic characteristics and European average
Sex Male 1
Female 1
Age 15-24 0.96
25-39 1.32
40-54 1.2
55+ 0.68
Education (end of) 15- 0.96
16-19 1.32
20+ 1.2
Still studying 0.68
Occupation Self-employed 0.96
Managers 0.8
Other white collars 0.96
Manual workers 1.24
House persons 1.2
Unemployed 1.84
Retired 0.68
Students 0.84
the category of people feeling at risk of over-indebtedness is the sum of people feeling very at risk and fairly at risk
Source: own elaboration on data from TNS Opinion & Social, 2010
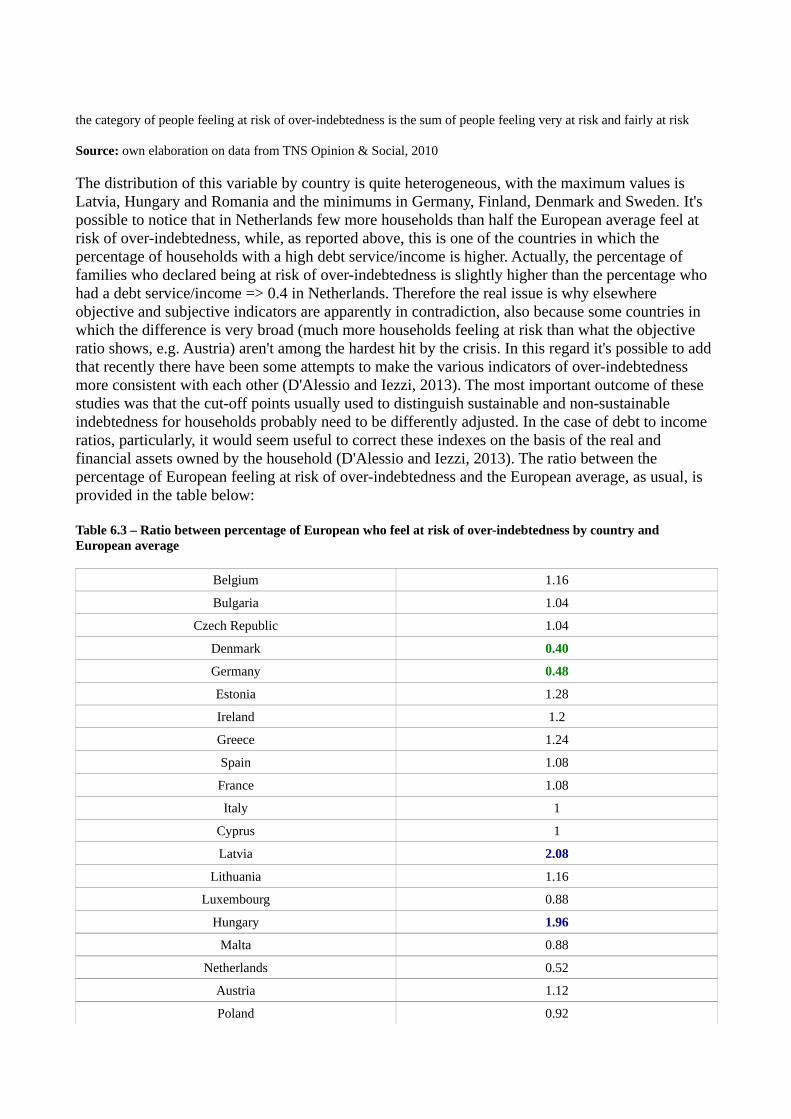
The distribution of this variable by country is quite heterogeneous, with the maximum values is Latvia, Hungary and Romania and the minimums in Germany, Finland, Denmark and Sweden. It's possible to notice that in Netherlands few more households than half the European average feel at risk of over-indebtedness, while, as reported above, this is one of the countries in which the percentage of households with a high debt service/income is higher. Actually, the percentage of families who declared being at risk of over-indebtedness is slightly higher than the percentage who had a debt service/income => 0.4 in Netherlands. Therefore the real issue is why elsewhere objective and subjective indicators are apparently in contradiction, also because some countries in which the difference is very broad (much more households feeling at risk than what the objective ratio shows, e.g. Austria) aren't among the hardest hit by the crisis. In this regard it's possible to add that recently there have been some attempts to make the various indicators of over-indebtedness more consistent with each other (D'Alessio and Iezzi, 2013). The most important outcome of these studies was that the cut-off points usually used to distinguish sustainable and non-sustainable indebtedness for households probably need to be differently adjusted. In the case of debt to income ratios, particularly, it would seem useful to correct these indexes on the basis of the real and financial assets owned by the household (D'Alessio and Iezzi, 2013). The ratio between the percentage of European feeling at risk of over-indebtedness and the European average, as usual, is provided in the table below:
Table 6.3 – Ratio between percentage of European who feel at risk of over-indebtedness by country and European average
Belgium 1.16
Bulgaria 1.04
Czech Republic 1.04
Denmark 0.40
Germany 0.48
Estonia 1.28
Ireland 1.2
Greece 1.24
Spain 1.08
France 1.08
Italy 1
Cyprus 1
Latvia 2.08
Lithuania 1.16
Luxembourg 0.88
Hungary 1.96
Malta 0.88
Netherlands 0.52
Austria 1.12
Poland 0.92

Portugal 1
Romania 1.88
Slovenia 0.6
Slovakia 0.84
Finland 0.44
Sweden 0.28
UK 1.40
the category of people feeling at risk of over-indebtedness is the sum of people feeling very at risk and fairly at risk
Source: own elaboration on data from TNS Opinion & Social, 2010
The same survey stated that a large share of Europeans felt they run the risk to fall into arrears (table 6.4). It's not easy to determine what kind of relationship links subjective risk of getting into arrears and an objective state of over-indebtedness. However, it's possible to say that a great group of households feels at risk to have financial difficulties linked with debt, that is, anyway, important information from our adopted perspective.
Table 6.4 – Percentage of Europeans who feel at risk of getting into arrears
Feel at risk not to paying on time
Utility bills Consumer loans Rent Food or other daily consumer items Mortgage
20 19 14 14 13
Source: TNS Opinion & Social, 2010
About geographical distribution, countries in which people are more confident to be able to face expenses on time are Netherlands, Denmark, Finland and Sweden while risk to get into arrears seems particularly high in Slovakia, Czech Republic, Hungary, Lithuania and Romania. In some countries like Ireland, Cyprus, Malta and Bulgaria the feeling to be at risk depends strongly from the event hypothesized: e.g. in Bulgaria utility bills and food appear very critical, while rents and mortgages wouldn't seem to represent a problem, in Cyprus issues are concentrated on consumer loans and in Malta on utility bills. It's not trivial to repeat that this information may not be as accurate as desirable for lots of different reasons, linked to typical drawbacks of subjective indicators. As usual the ratio between the percentage of Europeans feeling at risk of getting into arrears by country and the European average shown in table 6.4 is used in the following scheme:
Table 6.5 – Ratio between percentage of European who feel at risk of getting into arrears by country and European average
Country Feel at risk not to paying on time
Utility bills Consumer loans Rent Food or other daily consumer items Mortgage
Belgium 0.9 0.74 0.93 0.93 0.69
Bulgaria 2 1 0.29 2 0.23
Czech Republic 1.45 1.63 1.64 1.43 2.08
Denmark 0.2 0.32 0.29 0.29 0.23
Germany 0.35 0.47 0.36 0.43 0.46
Estonia 1.4 1.05 1.64 1.5 1.15

Ireland 1.25 1.47 1 0.93 0.85
Greece 1.85 1.42 1.14 1.29 0.92
Spain 1.05 1.63 1.29 0.93 1.54
France 0.8 0.58 0.93 0.86 0.38
Italy 1.2 1.21 1.43 1.14 1.69
Cyprus 0.95 2.21 0.43 0.43 1.15
Latvia 1.35 1 1.57 1.36 1.15
Lithuania 1.75 0.89 1.5 2 1.23
Luxembourg 0.5 0.47 0.57 0.43 0.69
Hungary 2.45 2.05 1.43 2.14 2.23
Malta 1.75 0.84 0.43 0.71 0.62
Netherlands 0.2 0.21 0.21 0.29 0.23
Austria 0.8 0.89 0.93 0.79 1.15
Poland 1.3 1.32 1.71 1.29 1.46
Portugal 1.25 1.16 1.64 1.5 1.46
Romania 2 1.68 1.5 2.14 1.69
Slovenia 0.75 0.63 0.50 0.79 0.54
Slovakia 1.3 1.68 1.64 1.57 2.23
Finland 0.3 0.42 0.36 0.43 0.54
Sweden 0.1 0.16 0.14 0.07 0.15
UK 0.90 0.74 0.71 0.93 0.69
Source: own elaboration on data from TNS Opinion & Social, 2010
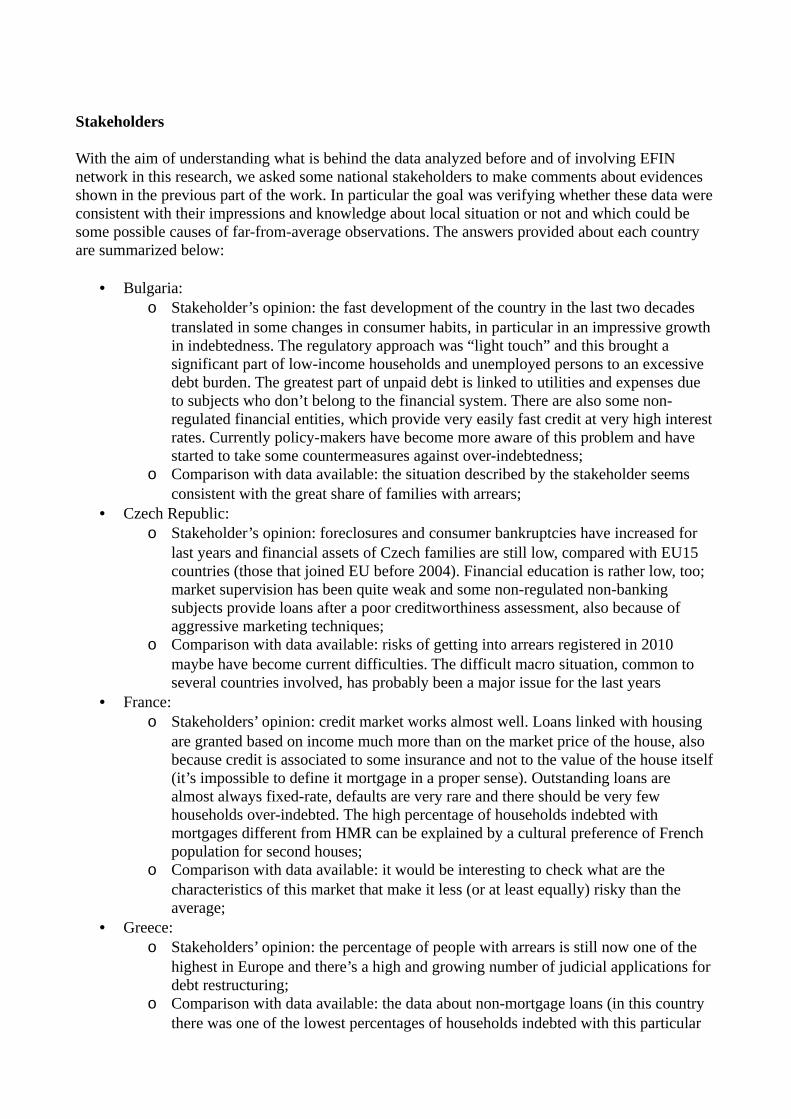
Stakeholders
With the aim of understanding what is behind the data analyzed before and of involving EFIN network in this research, we asked some national stakeholders to make comments about evidences shown in the previous part of the work. In particular the goal was verifying whether these data were consistent with their impressions and knowledge about local situation or not and which could be some possible causes of far-from-average observations. The answers provided about each country are summarized below:
• Bulgaria:o Stakeholder’s opinion: the fast development of the country in the last two decades
translated in some changes in consumer habits, in particular in an impressive growth in indebtedness. The regulatory approach was “light touch” and this brought a significant part of low-income households and unemployed persons to an excessive debt burden. The greatest part of unpaid debt is linked to utilities and expenses due to subjects who don’t belong to the financial system. There are also some non-regulated financial entities, which provide very easily fast credit at very high interest rates. Currently policy-makers have become more aware of this problem and have started to take some countermeasures against over-indebtedness;
o Comparison with data available: the situation described by the stakeholder seems consistent with the great share of families with arrears;
• Czech Republic:o Stakeholder’s opinion: foreclosures and consumer bankruptcies have increased for
last years and financial assets of Czech families are still low, compared with EU15 countries (those that joined EU before 2004). Financial education is rather low, too; market supervision has been quite weak and some non-regulated non-banking subjects provide loans after a poor creditworthiness assessment, also because of aggressive marketing techniques;
o Comparison with data available: risks of getting into arrears registered in 2010 maybe have become current difficulties. The difficult macro situation, common to several countries involved, has probably been a major issue for the last years
• France:o Stakeholders’ opinion: credit market works almost well. Loans linked with housing
are granted based on income much more than on the market price of the house, also because credit is associated to some insurance and not to the value of the house itself (it’s impossible to define it mortgage in a proper sense). Outstanding loans are almost always fixed-rate, defaults are very rare and there should be very few households over-indebted. The high percentage of households indebted with mortgages different from HMR can be explained by a cultural preference of French population for second houses;
o Comparison with data available: it would be interesting to check what are the characteristics of this market that make it less (or at least equally) risky than the average;
• Greece:o Stakeholders’ opinion: the percentage of people with arrears is still now one of the
highest in Europe and there’s a high and growing number of judicial applications for debt restructuring;
o Comparison with data available: the data about non-mortgage loans (in this country there was one of the lowest percentages of households indebted with this particular

credit form) weren’t confirmed by stakeholders. A part from this, the local situation seems determined by the consequences of the crisis, that hit Greece with a particular severity;
• Hungary:o Stakeholder’s opinion: the national GDP is quite low, even if compared with similar
EU countries and unemployment is very high. Many households applied for loans denominated in foreign currencies before 2008 and the subsequent changes in exchange rate and in their relative financial and social position brought them into difficulties. Also savings are quite low for a high proportion of households. Pessimistic feelings are led also by a certain progressive political lack of interest for lower-middle classes;
o Comparison with data available: it seems there are some problems, which are not linked with the global crisis in this country. However, data collected are consistent with stakeholder declarations;
• Netherlands:o Stakeholder’s opinion: mortgages are very high for several reasons. Interests paid are
deductible up to more than half their value, tax system is very unfriendly towards who’d like to pay off mortgage debt before maturity; it’s also quite common to borrow more than the house’s value. Banks are more interested in income of people requiring credit, which has been rather stable over the years, than in asset’s value. Dutch economy has been one of the strongest in Europe and borrowers tend to pay their debts because of cultural factors. Some statistics may be blurred by the existence of some overdraft facilities with the house as collateral, which could be considered mortgages de facto;
o Comparison with data available: Netherlands case seems very strange since common indicators of over-indebtedness should lead us to consider this country’s equilibrium quite risky. However, the particular cultural and economic characteristics of Dutch context appear to make it possible a very high indebtedness and very few households really in trouble. A deeper analysis may be interesting
• Portugal:o Stakeholder’s declaration: the situation worsened quickly after the crisis, in
particular after the agreement between the government and the so-called Troika. Unemployment had an impressive growth, credit defaults and bankruptcy files broke every record. Several households lost their dwelling in the last three years, because they weren’t able to pay relative instalments;
o Comparison with data available: according to the stakeholder, data previously shown about Portugal aren’t up-to-date enough. Also in this case the consequences of sovereign debt crisis in Europe had negative effects on households and their debt management;
• Spain:o Stakeholder’s opinion: Spaniards are more culturally oriented towards possession of
houses rather than renting and this explains their low non-mortgage indebtedness. After the crisis, the number of families with a mortgage decreased drastically. Banks are more reluctant and demanding and the economic downturn pushed households not to apply for credit. A significant part of the population is facing hard difficulties, mostly due to the rising unemployment and to drops in income;
o Comparison with data available: as in Portugal’s and Greece’s cases, issues related to the recent crisis (in particular for Spain the real estate bubble) made debt management more difficult for several households. It seems that crisis should be

overcome, before over-indebtedness will become a more limited phenomenon;• Sweden:
o Stakeholder’s opinion: the main issue is represented by housing loans. Interest rates are at a very low level, both in absolute and relative terms, and credit is really easy to get. Loans are characterized by long periods without amortization, house prices are getting higher, most of all in big urban areas, and the Swedish central bank is worried about a possible housing-bubble. Households with highest debt/income ratios are those with a middle-low income; moreover four out of ten borrowers are not reducing their debt and the other 60% is doing it very slowly;
o Comparison with data available: starting from Eurobarometer information, it should be said that households are really confident they won’t get into arrears or become over-indebted. Confidence seems in contrast with stakeholder’s declarations; therefore this situation deserves further investigation.
Although it’s very difficult to infer significant indications from stakeholders’ opinions, it’s possible to individuate some common points. In particular, according to their opinion:
• Households which suffer from a weak national macroeconomic situation (generated by the crisis or more local factors) would be generally more affected by a high debt burden;
• Lack of regulation seems another very important driver of debt difficulties;• In areas in which over-indebtedness appears limited, creditworthiness assessment by lenders
would be more focused on income rather than on assets (in particular for housing credit)

References
ALTUNBAS Y., BAZZANA F., YALDIZ E. (2010). Determinants of Informal Credit Use: A Cross Country Study [online]. Available at: http://jourdev.gretha.u-bordeaux4.fr/sites/jourdev.gretha/IMG/pdf/5e_yaldiz_altunbas_bazzana.pdf [Consulted on 4 July 2014];ANDERLONI L., VANDONE D. (2010). Risk of over-indebtedness and behavioral factors, Working paper no. 2010-25 [online]. Available at:http://www.researchgate.net/profile/Luisa_Anderloni/publication/46466330_Risk_of_over-indebtedness_and_behavioural_factors/file/50463518960cc53bc3.pdf [Consulted on 2 July 2014);BANK OF ITALY (2014). Annual Report on 2013 [online]. Available at: https://www.bancaditalia.it/pubblicazioni/relann/rel13/rel13it/rel_2013.pdf [Consulted on 27 June 2014);BANQUE DE FRANCE (2014). Le surendettement, Particuliers – la Banque de France vous informe [online]. Available at: https://www.banque-france.fr/fileadmin/user_upload/banque_de_france/La_Banque_de_France/guide-surendettement.pdf [Consulted on 1 July 2014);BETTI G., DOURMASHKIN N., ROSSI M.C., VERMA V.J., YIN Y. (2001). Study of the Problem of Consumer Indebtedness: Statistical Aspects, Final Report [online]. Available at: http://ec.europa.eu/consumers/cons_int/fina_serv/cons_directive/fina_serv06_en.pdf [Consulted on 27 June 2014];BRIDGES S., DISNEY R., GATHERGOOD J. (2008). Drivers of Over-indebtedness [online]. Available at: https://www.academia.edu/3444697/Drivers_of_Over-indebtedness [Consulted on 3 July 2014];CENTRE PERMANENT POUR LA CITOYENNETÉ ET LA PARTICIPATION (2013). Le surendettement, une menace latente. Collection “Au Quotidien” [online]. Available at: http://www.cpcp.be/index.php?option=com_cckjseblod&task=download&file=publications_fichier&id=1409 [Consulted on 1 July, 2014);CGAP (2011). Too Much Microcredit? A Survey on the Evidence of Over-Indebtedness, Occasional Paper no. 19 [online]. Available at: http://www.cgap.org/sites/default/files/CGAP-Occasional-Paper-Too-Much-Microcredit-A-Survey-of-the-Evidence-on-Overindebtedness-Sep-2011.pdf [Consulted on 2 July 2014];CIVIC CONSULTING OF THE CONSUMER POLICY EVALUATION CONSORTIUM, DIRECTORATE GENERAL HEALTH AND CONSUMERS (2013). The over-indebtedness of European households: updated mapping of the situation, nature and causes, effects and initiatives to alleviate its impact [online]. Available at: http://www.ecosocdoc.be/static/module/bibliographyDocument/document/003/2704.pdf [Consulted on 3 July 2014];COIN D., CONTI A.M., LEVA L., VACCA V. (2013). L'indebitamento e la vulnerabilità finanziaria delle famiglie in VACCA V. (curated by), L'indebitamento e la vulnerabilità finanziaria delle famiglie nelle regioni italiane, Occasional Papers no. 163 [online]. Available at: http://www.bancaditalia.it/pubblicazioni/econo/quest_ecofin_2/qef163/QEF_163.pdf [Consulted on 27 June 2014];COMBAT POVERTY AGENCY (2009). A Policy Framework for Addressing Over-indebtedness. Stuart Stamp [online]. Available at: http://www.combatpoverty.ie/publications/APolicyFrameworkForAddressingOverIndebtedness_2009.pdf [Consulted on 1 July 2014].D'ALESSIO G., IEZZI S. (2013). Household over-indebtedness: definition and measurement within Italian data, Occasional Paper no. 149 [online]. Available at: http://www.bancaditalia.it/pubblicazioni/econo/quest_ecofin_2/qef149/QEF_149.pdf [Consulted on

27 June 2014);DREGER C., KHOLODILIN K. (2011). Speculative Bubble on Housing Markets: Elements of an Early Warning System, in DIW Economic Bulletin 4, 2011, pp. 3-9 [online]. Avauilable at: http://www.diw.de/documents/publikationen/73/diw_01.c.386687.de/diw_econ_bull_2011-04-1.pdf [Consulted on 28 July 2014];DUYGAN-BUMP B., GRANT C. (2008). Household Debt Repayment Behaviour: what role do institutions play?, Working paper no. QAU08-3, Federal Reserve Bank of Boston [online]. Available at: https://www.bostonfed.org/bankinfo/qau/wp/2008/qau0803.pdf [Consulted on 15 July 2014];EUROFINAS (2013). Eurofinas response to the European Commission's consultation on European households' over-indebtedness [online]. Available at: http://www.eurofinas.org/uploads/documents/positions/130206_Eurofinas%20Response_Over-indebtedness.pdf [Consulted on 2 July 2014);EUROPEAN CENTRAL BANK (2013). The Eurosystem household finance and consumption survey, Results from the first wave, Statistics paper series no. 2, April 2013 [online]. Available at: http://www.ecb.europa.eu/pub/pdf/other/ecbsp2en.pdf [Consulted on 27 June];EUROPEAN COMMISSION (2008). Towards a common operational European definition of over-indebtedness [online]. Available at: http://ec.europa.eu/social/BlobServlet?docId=5093&langId=en [Consulted on 30 June 2014);EUROPEAN ECONOMIC AND SOCIAL COMMITTEE (2014). Opinion of the Risk of over-indebtedness and behavioral factors EESC on Consumer protection and appropriate treatment of over-indebtedness to prevent social exclusion [online]. Available at: http://eescopinions.eesc.europa.eu/viewdoc.aspx?doc=ces/int/int726/en/eesc-2014-00791-00-00-ac-tra-en.doc [Consulted on 3 July 2014);EUROSTAT (2008). Over-indebtedness and financial exclusion, ad hoc module in European Survey on Income and Living Conditions [online]. Available at: http://epp.eurostat.ec.europa.eu/portal/page/portal/income_social_inclusion_living_conditions/data/ad_hoc_modules [Consulted on 27 June 2014];EUROSTAT (2010). EU-SILC Module on Over-Indebtedness and Financial Exclusion, Assessment of the Implementation [online]. Available at: http://epp.eurostat.ec.europa.eu/portal/page/portal/income_social_inclusion_living_conditions/documents/tab6/2008%20Module%20assessment.pdf [Consulted on 29 July 2014];EUROSTAT (2012). Measuring material deprivation in the EU – Indicators for the whole ,population and child-specific indicators, Eurostat Methodologies and Working papers [online]. Available at: http://epp.eurostat.ec.europa.eu/cache/ITY_OFFPUB/KS-RA-12-018/EN/KS-RA-12-018-EN.PDF [Consulted on 22 July 2014];EUROSTAT (2014). Economic strain, module of European Survey on Income and Living Conditions [online]. Available at: http://epp.eurostat.ec.europa.eu/portal/page/portal/income_social_inclusion_living_conditions/data/database [Consulted on 17 July 2014];FONDEVILLE N., ŐZDEMIR E., WARD T. (2010). Over-indebtedness, new evidence from the EU-SILC special module, Research note 4/2010, European Commission [online]. Available at: http://ec.europa.eu/social/BlobServlet?docId=6708&langId=en [Consulted on 30 June 2014] ;FRADE, C., LOPES, C. (2009). Overindebtedness and Financial Stress: a Comparative Study in Europe, in NIEMI J., RAMSAY I., WHITFORD W., Consumer credit, debt and bankruptcy: Comparative and international perspectives (pp. 249-271). Oxford: Hart Publishing [online]. Available at: http://www.ces.uc.pt/myces/UserFiles/livros/1097_(N)_Nieme_Ch12.pdf [Consulted on 27 June 2014);FÜRTH S., GEORGARAKOS D. (2010). Household Repayment Behavior: The Role of Social Capital, Institutional, Political and Religious Beliefs [online]. Available at:

http://www.ebs.edu/fileadmin/redakteur/funkt.dept.economics/Colloquium/Papers_ST_2011/Georgarakos_HH%20Repayment%20Behavior_10_2010.pdf [Consulted on 15 July 2014];GLOUKOVIEZOFF G. (2008). The link between financial exclusion and over-indebtedness [online]. Available at: http://gloukoviezoff.files.wordpress.com/2009/01/wp-link-fe-oi.pdf [Consulted on 3 July 2014];HAAS O.J. (2006). Overindebtedness in Germany , Working Paper no. 44, International Labor Office [online]. Available at: http://www.ilo.org/wcmsp5/groups/public/@ed_emp/documents/publication/wcms_117963.pdf [Consulted on 8 July 2014];LUSARDI A., TUFANO P. (2009). Debt literacy, financial experiences, and overindebtedness , Working Paper 14808, National Bureau of Economic Research [online]. Available at: http://www.nber.org/papers/w14808.pdf [Consulted on 8 July 2014];MANZOLI E., MARANGONI D., MOCETTI S. (2013). Le caratteristiche e la rischiosità dei prestiti alle famiglie in VACCA V. (curated by), L'indebitamento e la vulnerabilità finanziaria delle famiglie nelle regioni italiane, Questioni di Economia e Finanza no. 163 [online]. Available at: http://www.bancaditalia.it/pubblicazioni/econo/quest_ecofin_2/qef163/QEF_163.pdf [Consulted on 27 June 2014];MUTTILAINEN V., VALKAMA E. (2008). Payment difficulties associated with SMS loans, Research Communications no. 86, National Research Institute of Legal Policy [online]. Available at: http://www.optula.om.fi/material/attachments/optula/julkaisut/tutkimustiedonantoja-sarja/nZgxPpkuN/Summary_PaymentD.pdf [Consulted on 15 July 2014];OXERA (2004). Are UK households over-indebted? [online]. Available at: http://www.oxera.com/Oxera/media/Oxera/downloads/reports/Are-UK-households-overindebted.pdf?ext=.pdf [Consulted on 8 July 2014];SCHICKS J. (2010). Microfinance Over-Indebtedness: Understanding its drivers and challenging the common myths, Centre Emile Bernheim Working Paper no. 10/048 [online]. Available at: http://www.microfinancegateway.org/gm/document-1.9.49427/Microfinance%20Over-Indebtedness.pdf [Consulted on 3 July 2014];SCRIVENS K., SMITH C. (2013). Four Interpretations of Social Capital: An Agenda for Measurement, OECD Statistics Working Paper 2013/06 [online]. Available at: http://www.oecd-ilibrary.org/docserver/download/5jzbcx010wmt.pdf?expires=1405431955&id=id&accname=guest&checksum=CD4B6E01CE146E7D1B7EDB238B874946 [Consulted on 15 July 2014];TEKÇE B. (2013). What factors affect behavioral biases? Evidence from Turkish individual stock investors [online]. Available at: http://www.unicreditanduniversities.eu/uploads/assets/UniCRedit_BPA_4th_ed/WhatFactorsAffectBehavioralBiasesEvidencefromTurkishIndividualStockInvestors_Bulent_Tekce.pdf [Consulted on 8 July 2014];TNS OPINION & SOCIAL (2010). Eurobarometer 74,1 – Poverty and Social Exclusion, European Commission [online]. Available at: http://ec.europa.eu/public_opinion/archives/ebs/ebs_355_en.pdf [Consulted on 17 July 2014]