overall evidence matrix synthesis methodology · web viewanalyze, extract and synthesize relevant...
TRANSCRIPT

10th Edition
Evidence matrix
Instructions for synthesizing evidence and perform quality assessment of studies
2017
TEAM
Principal investigator: Experts for validation: Data synthesis: Reviewer:

TABLE OF CONTENTS
1 OVERALL EVIDENCE MATRIX SYNTHESIS METHODOLOGY.......................................................8
2 LITERATURE REVIEW AND DATA COLLECTION...........................................................................8
3 HIGHLY SYNTHESIZED EVIDENCE – EXECUTIVE LEVEL.............................................................9
DOMAINS / DECISION CRITERIA............................................................................................................10
3.1 CORE MODEL...............................................................................................................10
3.1.1 NEED FOR INTERVENTION...................................................................................10
Disease severity................................................................................................................................................10Size of affected population................................................................................................................................10Unmet needs.....................................................................................................................................................10
3.1.2 COMPARATIVE OUTCOMES OF INTERVENTION...............................................10Comparative effectiveness................................................................................................................................10Comparative safety / tolerability........................................................................................................................10Comparative patient-perceived health / patient-reported outcomes..................................................................11
3.1.3 TYPE OF BENEFIT OF INTERVENTION................................................................11
Type of preventive benefit.................................................................................................................................11Type of therapeutic benefit................................................................................................................................11
3.1.4 Economic consequences of intervention.................................................................11
Comparative cost consequences – cost of intervention....................................................................................11Comparative cost consequences – other medical costs...................................................................................11Comparative cost consequences – non-medical costs.....................................................................................11
3.1.5 Knowledge about intervention..................................................................................13Quality of evidence............................................................................................................................................13Expert consensus / clinical practice guidelines.................................................................................................13
3.2 CONTEXTUAL TOOL.....................................................................................................13
3.2.1 Normative contextual criteria...................................................................................13Mandate and scope of healthcare system.........................................................................................................13Population priorities and access........................................................................................................................13Common goal and specific interests..................................................................................................................13Environmental impact........................................................................................................................................13
3.2.2 Feasibility contextual criteria....................................................................................13System capacity and appropriate use of intervention........................................................................................13Political / historical / cultural context..................................................................................................................14
3.3 OPPORTUNITY COSTS................................................................................................14Opportunity costs and affordability....................................................................................................................14
4 SYNTHESISED EVIDENCE: EVIDENCE MATRIX - REPORT LEVEL.............................................15
CRITERIA.................................................................................................................................................. 16
4.1 CORE MODEL...............................................................................................................16
4.1.1 Need for intervention................................................................................................16
Disease severity................................................................................................................................................16Size of affected population................................................................................................................................17
2

Unmet needs.....................................................................................................................................................184.1.2 Comparative outcomes of intervention....................................................................18
Comparative effectiveness................................................................................................................................18Comparative safety / tolerability........................................................................................................................20Comparative patient-perceived health / patient-reported outcomes..................................................................21
4.1.3 Type of benefit of intervention..................................................................................22
Type of preventive benefit.................................................................................................................................22Type of therapeutic benefit................................................................................................................................22
4.1.4 Economic consequences of intervention.................................................................22
Comparative cost consequences – cost of intervention....................................................................................22Comparative cost consequences – other medical costs...................................................................................24Comparative cost consequences – non-medical costs.....................................................................................24
4.1.5 Knowledge about intervention..................................................................................26Quality of evidence............................................................................................................................................26Expert consensus / clinical practice guidelines.................................................................................................27
CRITERIA.................................................................................................................................................. 28
4.2 CONTEXTUAL TOOL.....................................................................................................28
4.2.1 Normative contextual criteria...................................................................................28Mandate and scope of healthcare system.........................................................................................................28Population priorities and access........................................................................................................................28Common goal and specific interests..................................................................................................................29Environmental impact........................................................................................................................................29
4.2.2 Feasibility contextual criteria....................................................................................29System capacity and appropriate use of intervention........................................................................................29Political / historical / cultural context..................................................................................................................29
4.3 OPPORTUNITY COST...................................................................................................31Opportunity costs and affordability....................................................................................................................31
5 REFERENCE LIST............................................................................................................................ 32
6 EVIDENCE TABLES......................................................................................................................... 32
7 QUALITY ASSESSMENT TOOLS....................................................................................................34
7.1 Epidemiological data......................................................................................................34
7.1.1 Tool for assessing the quality of single epidemiological study.................................34
7.1.2 Overall assessment tool for epidemiological studies...............................................35
7.2 Efficacy, effectiveness and patient-reported outcomes data..........................................36
7.2.1 Tool for assessing the quality of a single interventional study.................................36
7.2.2 Tool for assessing the quality of a single observational study.................................38
7.2.3 Tool for assessing the quality of an intervention outcomes modelling study...........40
7.2.4 Overall assessment tool for efficacy, effectiveness and patient-reported outcomes studies 41
7.3 Economic evaluations data.............................................................................................42
7.3.1 Tool for assessing the quality of cost-consequence modelling studies...................42
3

7.3.2 Tool for assessing the quality of cost-effectiveness modelling studies....................44
7.3.3 Tool for assessing the quality of budget impact model studies...............................46
4
IMPORTANT NOTICE - SUMMARY
Please read before using EVIDEM
EVIDEM is a reflective multicriteria approach designed to support the culture of reasonable decision-making by promoting procedural and substantive legitimacy; this includes selection of representative decisionmakers, relevance of reasons for the decision, publicity, appeal, and implementation – based on the ethical framework of accountability of reasonableness (A4R). Goetghebeur et al. Lancet 17 Jun 2017
To help insure that decisions are based on relevant reasons (substantive legitimacy), EVIDEM provides a set of generic decision criteria derived from the ethical imperatives that underlie the common goal of healthcare and its ultimate motivation: compassion. This represents a generic interpretive frame (MCDA reflective grid) that can be used to elicit individual values and facilitate sharing of diverse perspectives during committee deliberations or for other applications (e.g., patient-clinician shared decisionmaking). These generic criteria can be further concretized to reflect specificities of therapeutic areas or types of interventions. EVIDEM also provides a common structure for all members to express their interpretation of the evidence for each criterion and thereby share their reasoning with others. These interpretations can be expressed quantitatively through interpretive scores (quantitative criteria), qualitatively through impacts (qualitative criteria) as well as narratively through comments (all criteria).
To pursue its objectives, EVIDEM was designed to reduce constraints of the natural decision and deliberation process by ensuring that: all relevant generic criteria are included (whether they are considered qualitatively or quantitatively); scientific and colloquial evidence relevant to each criterion is made available through an efficient synthesis methodology; and face validity is checked at each step of the process (weights, scores and corresponding narratives, aggregated measures) to ensure that visual representations of quantitative outputs reflect the reasoning of individuals or, for system level decisions (e.g., for HTA or MoH), of the committee within and across assessments.

5
IMPORTANT NOTICE - DETAILSPlease read before using EVIDEM
Although EVIDEM does use some features of MCDA, its roots are not in the methodology itself but rather in the natural decision and deliberation process. Its goal is to stimulate reflection, deliberation and reasonable decisions rather than algorithms approaches that traditional MCDA tends to promote. Each aspect of its design is geared to support the natural thinking process. It is built to minimize constraints of the natural reasoning in decisionmaking by providing a generic interpretive frame that can be shared across policy committee members, patients and physicians, and healthcare stakeholders at large.
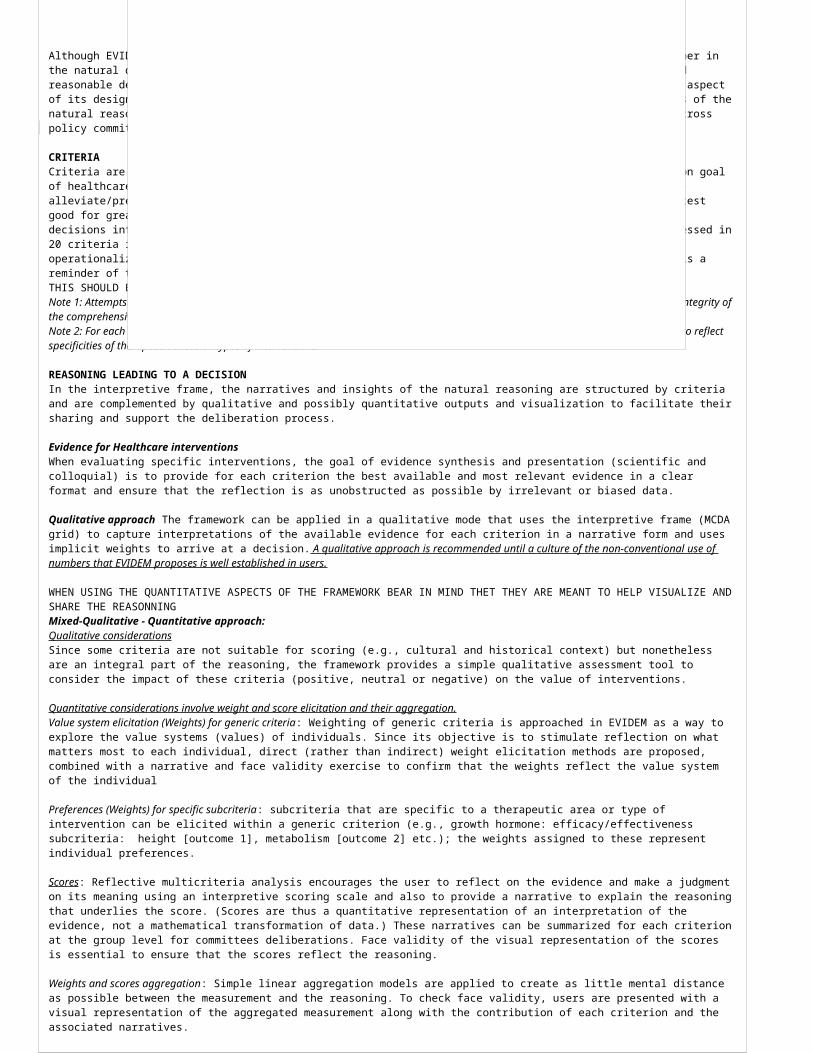
CRITERIACriteria are selected to support the substantive legitimacy of the decision with regard to the common goal of healthcare systems. The goal is articulated in three normative aspects (ethical imperatives): 1 - alleviate/prevent suffering of patients; 2 – prioritize those who are worst off while ensuring greatest good for greatest number; and 3- ensure sustainability. This is combined with the wisdom of making decisions informed by knowledge and adapted to context (feasibility aspect). These aspects are expressed in 20 criteria in agreement with MCDA methodological principles of non-redundancy, independence, operationalizability and completeness. This creates a generic interpretive frame which, by design, is a reminder of the common goal of healthcare. THIS SHOULD BE BORNE IN MIND WHEN ADAPATING THE FRAMEWORK BY REMOVING/ADDING GENERIC CRITERIA Note 1: Attempts to limit the number of generic criteria for methodological reasons may constrain the reasoning and compromise the integrity of the comprehensive interpretive frame on which EVIDEM is built.Note 2: For each generic criterion, a number of subcriteria are proposed in EVIDEM, which can be broken down further and integrated to reflect specificities of therapeutic areas or types of interventions.
REASONING LEADING TO A DECISIONIn the interpretive frame, the narratives and insights of the natural reasoning are structured by criteria and are complemented by qualitative and possibly quantitative outputs and visualization to facilitate their sharing and support the deliberation process.
Evidence for Healthcare interventionsWhen evaluating specific interventions, the goal of evidence synthesis and presentation (scientific and colloquial) is to provide for each criterion the best available and most relevant evidence in a clear format and ensure that the reflection is as unobstructed as possible by irrelevant or biased data.
Qualitative approach The framework can be applied in a qualitative mode that uses the interpretive frame (MCDA grid) to capture interpretations of the available evidence for each criterion in a narrative form and uses implicit weights to arrive at a decision. A qualitative approach is recommended until a culture of the non-conventional use of numbers that EVIDEM proposes is well established in users.
WHEN USING THE QUANTITATIVE ASPECTS OF THE FRAMEWORK BEAR IN MIND THET THEY ARE MEANT TO HELP VISUALIZE AND SHARE THE REASONNING Mixed-Qualitative - Quantitative approach: Qualitative considerationsSince some criteria are not suitable for scoring (e.g., cultural and historical context) but nonetheless are an integral part of the reasoning, the framework provides a simple qualitative assessment tool to consider the impact of these criteria (positive, neutral or negative) on the value of interventions.
Quantitative considerations involve weight and score elicitation and their aggregation.Value system elicitation (Weights) for generic criteria: Weighting of generic criteria is approached in EVIDEM as a way to explore the value systems (values) of individuals. Since its objective is to stimulate reflection on what matters most to each individual, direct (rather than indirect) weight elicitation methods are proposed, combined with a narrative and face validity exercise to confirm that the weights reflect the value system of the individual
Preferences (Weights) for specific subcriteria: subcriteria that are specific to a therapeutic area or type of intervention can be elicited within a generic criterion (e.g., growth hormone: efficacy/effectiveness subcriteria: height [outcome 1], metabolism [outcome 2] etc.); the weights assigned to these represent individual preferences.
Scores: Reflective multicriteria analysis encourages the user to reflect on the evidence and make a judgment on its meaning using an interpretive scoring scale and also to provide a narrative to explain the reasoning that underlies the score. (Scores are thus a quantitative representation of an interpretation of the evidence, not a mathematical transformation of data.) These narratives can be summarized for each criterion at the group level for committees deliberations. Face validity of the visual representation of the scores is essential to ensure that the scores reflect the reasoning.
Weights and scores aggregation: Simple linear aggregation models are applied to create as little mental distance as possible between the measurement and the reasoning. To check face validity, users are presented with a visual representation of the aggregated measurement along with the contribution of each criterion and the associated narratives.
Modulation by qualitative criteria: the impact of each qualitative criteria on the aggregated measurement is considered. Face validity is checked at the group level, with a visual representation and associated narratives.
Last criteron for consideration: After the evaluation based on all the other criteria is completed, the criterion “Opportunity cost and financial feasibility” is considered through a budgeting exercise, the committee performs a final deliberation on all aspects brought up and the decision is made.
RankingAs the committee performs multiple assessments, face validity checks are carried out to ensure that the ranking based on the modulated aggregated measures does reflect the group reasoning within and across assessments. Adaptation of the framework is carried out as applicable over time.
THE MATHEMATICAL ASPECTS ARE THUS DESIGNED TO HELP EXPRESS AND SHARE THE REASONING
6
Note: Instructions to prepare synthesized evidence are in red and should be removed when complete
1 OVERALL EVIDENCE MATRIX SYNTHESIS METHODOLOGYOnce the preparation of the Evidence Matrix using the instructions below is completed, report the methodology used here indicating the following:
o Describe methodology used for identifying and selecting evidence and synthesizing it for the EVIDEM Core Model and EVIDEM Contextual Tool (sources, keywords, selection criteria, data extraction, etc.)
o Indicate which type of evidence was assessed for its quality (clinical, epidemiological, economic, model, etc.) an method used (see section below for EVIDEM tools)
o Indicate the review process and validation by experts, as applicable
2 LITERATURE REVIEW AND DATA COLLECTIONo Perform a literature review and collect unpublished data (as applicable) to identify data required for each
criterion o Tables below may be used to guide the process
SourcesSource Date SearchedPubMed/Medline,EmbaseCenters for Review and DisseminationTrial registriesDisease Association web sitesCochrane reviewsAssessment reports from AHRQ, NICE, CADTH, etc.Hand searching of bibliographiesOther (please specify)
Keywords Searches Searched terms: No. of records
retrievedTopic: impact on mortality, morbidity and QoL
1.2.3. Total articles selected
Topic: epidemiology1.2.3. Total articles selected
Topic: clinical guidelines1.2.3. Total articles selected
Topic: current treatment and unmet needs1.2.3.4. Total articles selected
Topic. Economic context of disease
1.2.3. Total articles selected
7

8
3 HIGHLY SYNTHESIZED EVIDENCE – EXECUTIVE LEVEL INTERVENTION DESCRIPTION
Intervention category (e.g., drug class):Indication (provide name of agency, e.g., EMA):Dosage/Administration:Intervention duration:Comparators:
ECONOMIC BURDEN OF DISEASE**Not considered a criterion that contributes to the value of an intervention but provides useful background information. The overall economic burden of the disease is a composite of disease severity, size of affected population and cost of current treatment, all of which are captured in 3 distinct criteria of the quantitative EVIDEM Core Model.
9

DOMAINS / DECISION CRITERIA Highly synthesized evidence
3.1 CORE MODEL
3.1.1 NEED FOR INTERVENTION
Disease severity Identify, analyze and report necessary and sufficient evidence to understand disease and consequences (description, impact on morbidity, mortality and quality of life)
Include potentially differentiating aspects of the intervention (e.g., special risks) All statements referenced
Size of affected population Identify, analyze and report size of population affected among a specified population at a specific time and its demographic characteristics
Include potentially differentiating aspects of the intervention (e.g., sub-population) All statements referenced
Unmet needs Identify, analyze and report the main limitations of the established interventions with respect to efficacy, safety, tolerability, eligible populations, adherence and compliance, patient-reported outcomes (including convenience and patient acceptance)
Include potentially differentiating aspects of the intervention (e.g., limitations in specific sub-populations)
All statements referenced
3.1.2 COMPARATIVE OUTCOMES OF INTERVENTION Describe clinical program (number of trials, design, population, comparators) Outcomes and their validity
Comparative effectiveness Identify, analyze and report efficacy and effectiveness data by outcome of interest For each trial or meta-analysis indicate key information on trial design (randomization,
blinding, duration, population of patients – N and description –, interventions compared, primary and secondary efficacy outcomes) and results and significance
Identify and indicate differentiating aspects between product and comparators regarding efficacy/effectiveness
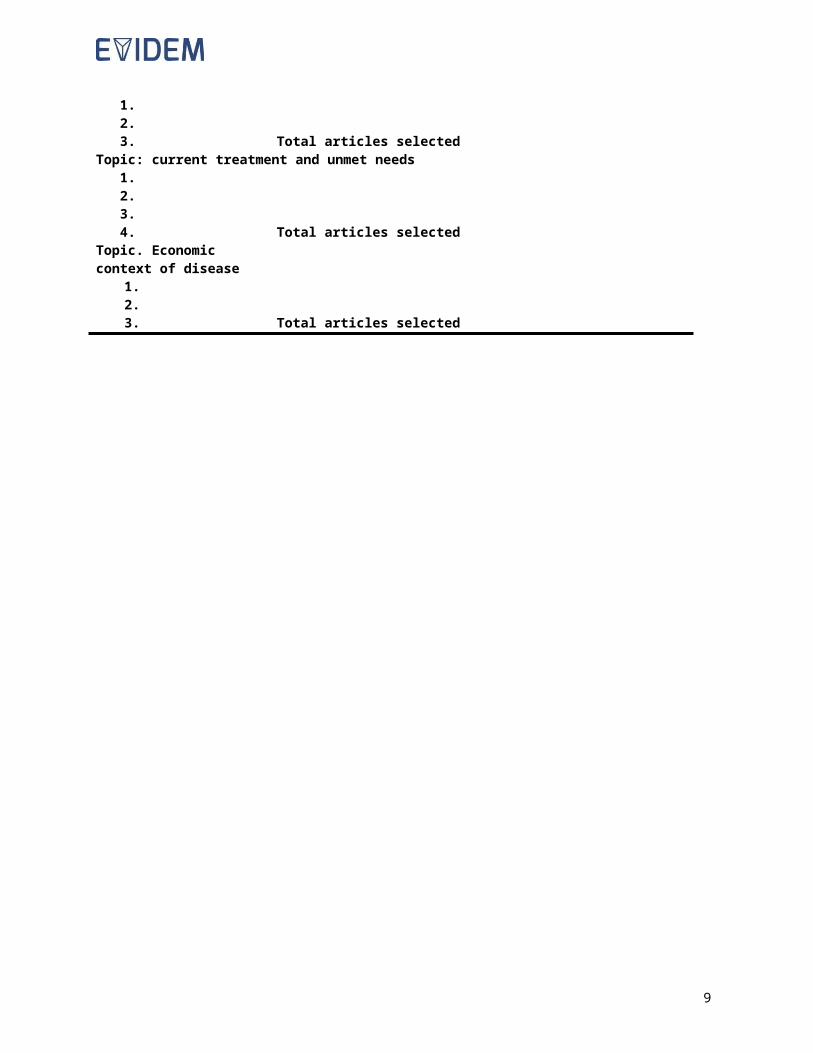
All statements referenced Example: In XX, an open-label, multicenter RCT in YY patients inadequately controlled on basal insulin, once-weekly product was superior to comparator with respect to outcome XX (at Week XX: -1.0 kg vs +1.7 kg, P<.0001).
Comparative safety / tolerability Identify and report most common and serious treatment-related adverse events for intervention and key comparator(s) in target population; specify exposure, duration of follow-up, and size of population
Identify and indicate differentiating aspects between product and comparators regarding safety
All statements referenced
Comparative patient-perceived health / patient- Identify, analyze and report patient-reported outcomes data on the intervention and
10

DOMAINS / DECISION CRITERIA Highly synthesized evidence
reported outcomes comparator(s), instrument used (specify whether it was validated for the population) and statistical significance of differences
If data not from the same studies covered under effectiveness/efficacy, provide key information on study design
Report patient convenience and adherence data for intervention and comparators Identify and indicate differentiating aspects between product and comparators
regarding PRO All statements referenced
3.1.3 TYPE OF BENEFIT OF INTERVENTION
Type of preventive benefit Provide information to identify the nature of the benefit that the intervention can provide to public health, i.e., at the population level (e.g., reduction of risk of disease and mortality, reduction of disease transmission, etc.), including risk reduction rates
Identify and indicate differentiating aspects between product and comparators All statements referenced
Type of therapeutic benefit Provide information to identify the nature of the benefit that the intervention can provide to individual patients (e.g., cure, prolonging life, or symptom relief)
Identify and indicate differentiating aspects between product and comparators All statements referenced
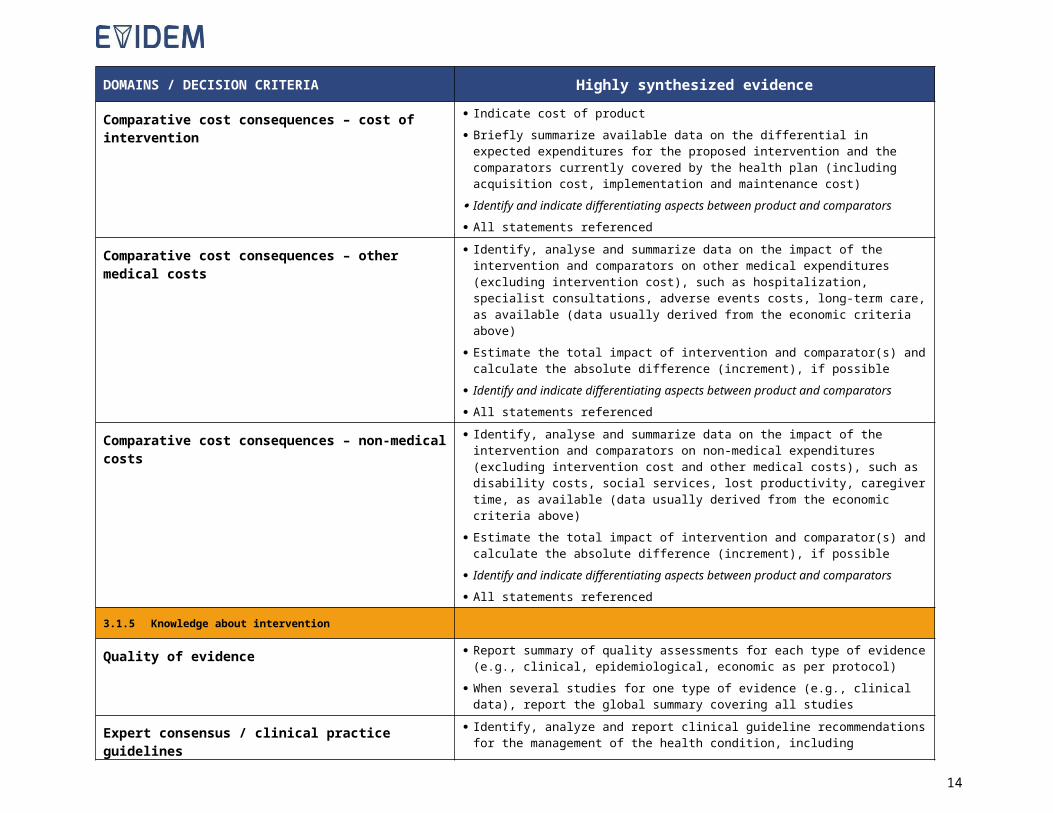
3.1.4 Economic consequences of intervention
Comparative cost consequences – cost of intervention
Indicate cost of product Briefly summarize available data on the differential in expected expenditures for the
proposed intervention and the comparators currently covered by the health plan (including acquisition cost, implementation and maintenance cost)
Identify and indicate differentiating aspects between product and comparators All statements referenced
Comparative cost consequences – other medical costs
Identify, analyse and summarize data on the impact of the intervention and comparators on other medical expenditures (excluding intervention cost), such as hospitalization, specialist consultations, adverse events costs, long-term care, as available (data usually derived from the economic criteria above)
Estimate the total impact of intervention and comparator(s) and calculate the absolute difference (increment), if possible
Identify and indicate differentiating aspects between product and comparators All statements referenced
Comparative cost consequences – non-medical costs Identify, analyse and summarize data on the impact of the intervention and comparators on non-medical expenditures (excluding intervention cost and other medical costs), such as disability costs, social services, lost productivity, caregiver time, as available (data usually derived from the economic criteria above)
Estimate the total impact of intervention and comparator(s) and calculate the absolute
11
DOMAINS / DECISION CRITERIA Highly synthesized evidencedifference (increment), if possible
Identify and indicate differentiating aspects between product and comparators All statements referenced
12

DOMAINS / DECISION CRITERIA Highly synthesized evidence
3.1.5 Knowledge about intervention
Quality of evidence Report summary of quality assessments for each type of evidence (e.g., clinical, epidemiological, economic as per protocol)
When several studies for one type of evidence (e.g., clinical data), report the global summary covering all studies
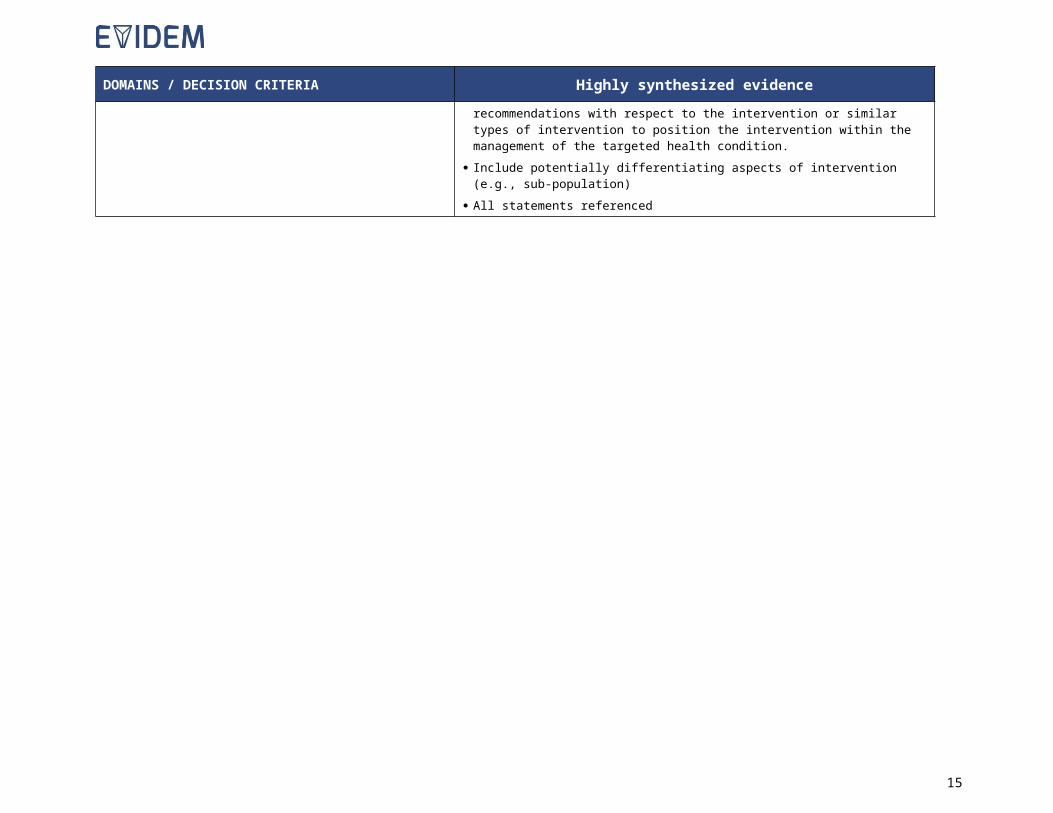
Expert consensus / clinical practice guidelines Identify, analyze and report clinical guideline recommendations for the management of the health condition, including recommendations with respect to the intervention or similar types of intervention to position the intervention within the management of the targeted health condition.
Include potentially differentiating aspects of intervention (e.g., sub-population) All statements referenced
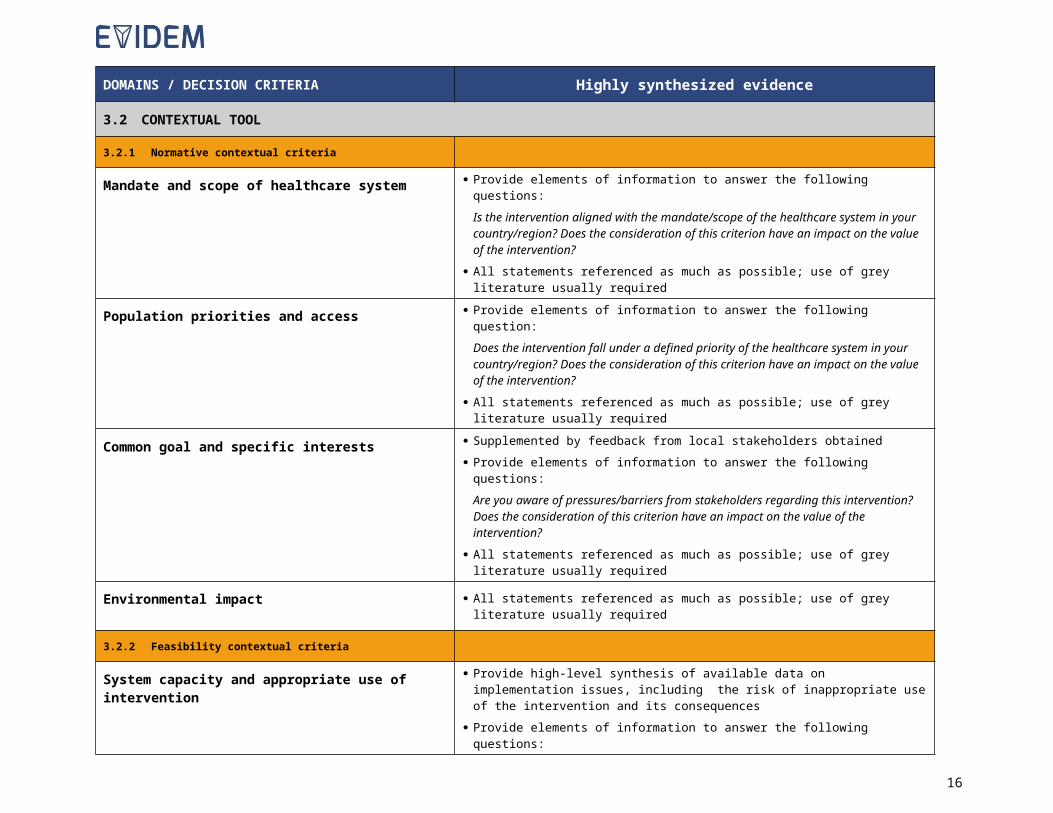
3.2 CONTEXTUAL TOOL
3.2.1 Normative contextual criteria
Mandate and scope of healthcare system Provide elements of information to answer the following questions:Is the intervention aligned with the mandate/scope of the healthcare system in your country/region? Does the consideration of this criterion have an impact on the value of the intervention?
All statements referenced as much as possible; use of grey literature usually required
Population priorities and access Provide elements of information to answer the following question:Does the intervention fall under a defined priority of the healthcare system in your country/region? Does the consideration of this criterion have an impact on the value of the intervention?
All statements referenced as much as possible; use of grey literature usually required
Common goal and specific interests Supplemented by feedback from local stakeholders obtained Provide elements of information to answer the following questions:
Are you aware of pressures/barriers from stakeholders regarding this intervention? Does the consideration of this criterion have an impact on the value of the intervention?
All statements referenced as much as possible; use of grey literature usually required
Environmental impact All statements referenced as much as possible; use of grey literature usually required
3.2.2 Feasibility contextual criteria
System capacity and appropriate use of intervention Provide high-level synthesis of available data on implementation issues, including the risk of inappropriate use of the intervention and its consequences
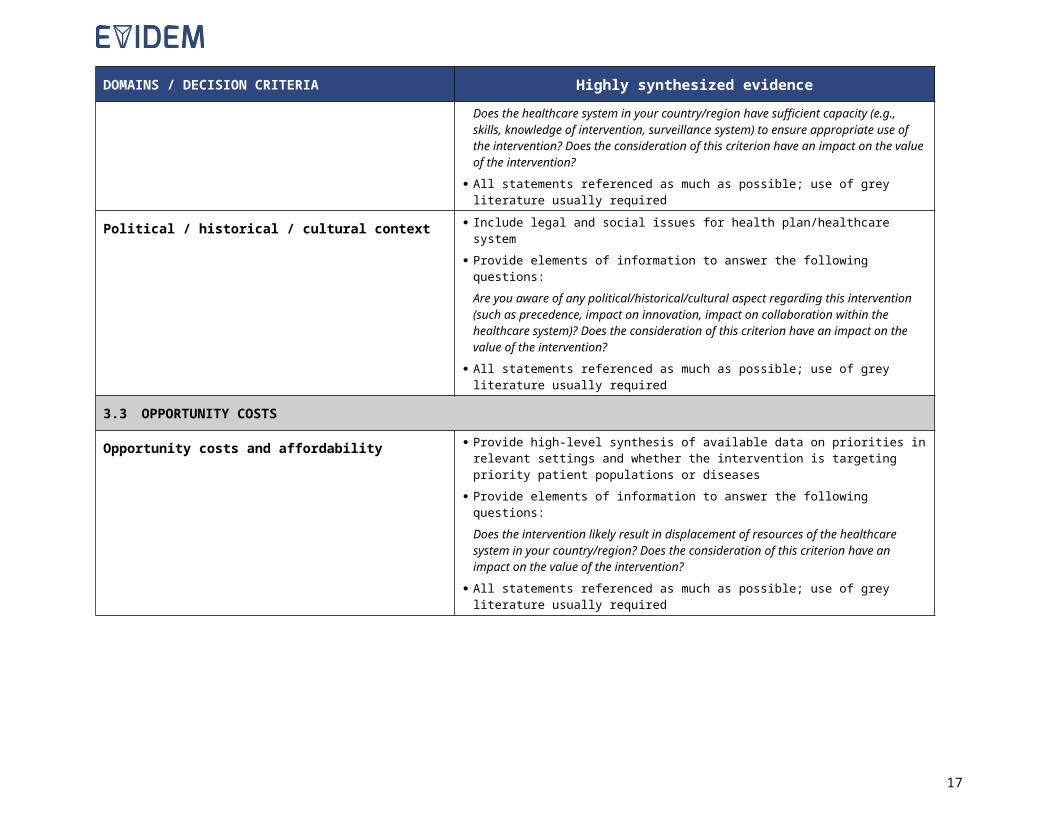
Provide elements of information to answer the following questions:Does the healthcare system in your country/region have sufficient capacity (e.g.,
13
DOMAINS / DECISION CRITERIA Highly synthesized evidenceskills, knowledge of intervention, surveillance system) to ensure appropriate use of the intervention? Does the consideration of this criterion have an impact on the value of the intervention?
All statements referenced as much as possible; use of grey literature usually required
Political / historical / cultural context Include legal and social issues for health plan/healthcare system Provide elements of information to answer the following questions:
Are you aware of any political/historical/cultural aspect regarding this intervention (such as precedence, impact on innovation, impact on collaboration within the healthcare system)? Does the consideration of this criterion have an impact on the value of the intervention?
All statements referenced as much as possible; use of grey literature usually required
3.3 OPPORTUNITY COSTS
Opportunity costs and affordability Provide high-level synthesis of available data on priorities in relevant settings and whether the intervention is targeting priority patient populations or diseases
Provide elements of information to answer the following questions:Does the intervention likely result in displacement of resources of the healthcare system in your country/region? Does the consideration of this criterion have an impact on the value of the intervention?
All statements referenced as much as possible; use of grey literature usually required
14
4 SYNTHESISED EVIDENCE: EVIDENCE MATRIX - REPORT LEVELInstructions for developing synthesized evidence on intervention:
o Analyze, extract and synthesize relevant data in a concise and transparent format (see detailed instructions with examples below – other examples on the Collaborative Registry website)
o Synthesized data should be reviewed by a data synthesis expert and validated by experts in relevant fields (clinical, economic)
Note: Once completed, remove the instructions and example column, and paste the table as an appendix in the EVIDEM v4.0 Adapt & pilot.
Disease:Intervention:Setting:
Intervention category (e.g., drug class): where applicableIndication (provide name of agency, e.g., EMA): insert information on approved indication (source: e.g., Product Monograph, Technical Sheet, Summary of Product Characteristics)Administration/Description: insert relevant information (e.g., dose and mode of administration for a drug; description of screening test) (source: e.g., Product Monograph, Technical Sheet)Intervention duration: where applicable (source: Product Monograph, Technical Sheet, clinical trials, practice patterns studies, expert opinion, etc., as available)Comparator(s): list comparators considered (with brief rationale for choice of comparators), and include indication for comparatorsEconomic burden of illness*: Brief overview of direct costs, indirect costs and total costs (as available) associated with the treatment of patients with disease in key countries based on lit review Total costs Direct medical costs of current treatments (e.g., drug costs, costs of administration, follow-up, hospitalization, physician visits,
managing adverse events, supportive care, and other relevant costs) Direct non-medical cost (e.g., patient transportation) Indirect costs (e.g., productivity loss due to morbidity and pre-mature mortality) Main cost drivers
*Not considered a criterion that contributes to the value of an intervention but provides useful background information. The overall economic burden of the disease is a composite of disease severity, size of affected population and cost of current treatment, all of which are captured in 3 distinct criteria of the quantitative EVIDEM Core Model.
15
CRITERIA InstructionsExample – see EVIDEM web site for more examples under the
Collaborative Registry(references were removed for simplicity –
statements should be referenced with access to full text sources)
4.1 CORE MODEL
4.1.1 Need for intervention
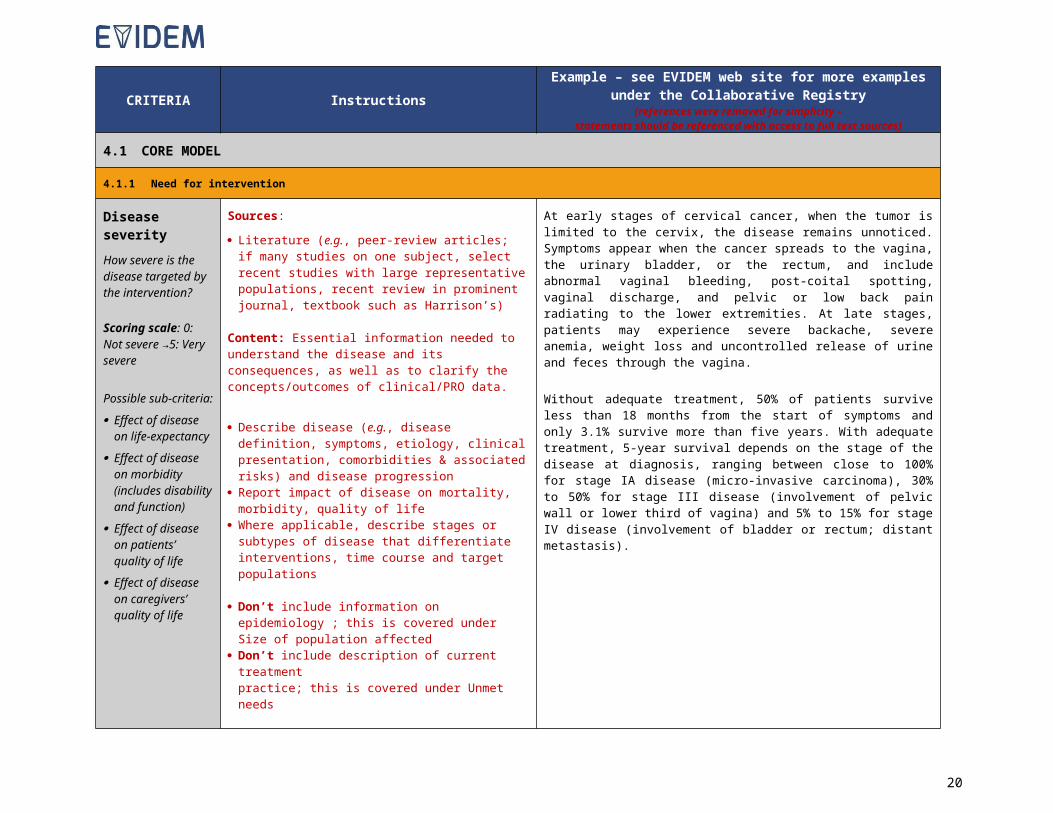
Disease severityHow severe is the disease targeted by the intervention?
Scoring scale: 0: Not severe →5: Very severe
Possible sub-criteria: Effect of disease
on life-expectancy Effect of disease
on morbidity (includes disability and function)
Effect of disease on patients’ quality of life
Effect of disease on caregivers’ quality of life
Sources:
Literature (e.g., peer-review articles; if many studies on one subject, select recent studies with large representative populations, recent review in prominent journal, textbook such as Harrison’s)
Content: Essential information needed to understand the disease and its consequences, as well as to clarify the concepts/outcomes of clinical/PRO data.
Describe disease (e.g., disease definition, symptoms, etiology, clinical presentation, comorbidities & associated risks) and disease progression
Report impact of disease on mortality, morbidity, quality of life
Where applicable, describe stages or subtypes of disease that differentiate interventions, time course and target populations
Don’t include information on epidemiology ; this is covered under Size of population affected
Don’t include description of current treatment practice; this is covered under Unmet needs
At early stages of cervical cancer, when the tumor is limited to the cervix, the disease remains unnoticed. Symptoms appear when the cancer spreads to the vagina, the urinary bladder, or the rectum, and include abnormal vaginal bleeding, post-coital spotting, vaginal discharge, and pelvic or low back pain radiating to the lower extremities. At late stages, patients may experience severe backache, severe anemia, weight loss and uncontrolled release of urine and feces through the vagina.
Without adequate treatment, 50% of patients survive less than 18 months from the start of symptoms and only 3.1% survive more than five years. With adequate treatment, 5-year survival depends on the stage of the disease at diagnosis, ranging between close to 100% for stage IA disease (micro-invasive carcinoma), 30% to 50% for stage III disease (involvement of pelvic wall or lower third of vagina) and 5% to 15% for stage IV disease (involvement of bladder or rectum; distant metastasis).
16
CRITERIA InstructionsExample – see EVIDEM web site for more examples under the
Collaborative Registry(references were removed for simplicity –
statements should be referenced with access to full text sources)
Size of affected population
What is the size of the population targeted by the intervention?
Scoring scale: 0: Very rare disease →5: Common disease
Possible sub-criteria: Prevalence Incidence
Sources: Literature (e.g., peer-reviewed studies, national
statistics, disease associations, recent reviews) Give priority to peer-reviewed epidemiological studies
and recent reviews based on these; if not available, consult national statistics, surveys and other non-peer-reviewed sources (e.g., databases)
Content: Size of the population affected by disease and its demographic characteristics (i.e., age, gender and ethnicity)
Report worldwide and local prevalence /incidence focusing on key markets; annual number of cases (if not available, use data from a comparable country/population)
Describe epidemiological data that differentiate the intervention from comparators (e.g., special populations, such as those with comorbidities)
Describe briefly study design (e.g., setting, number of individuals)
Don’t include information on proportion of patients receiving various interventions; this is covered under Unmet needs
Based on pooled data from cytogenetic studies from Canada, Japan, Russia, Denmark and Scotland that included a total of 48,744 newborn females, it was estimated that 50 out of 100,000 females are born with Turner syndrome (1 out of 2000 newborn females).
17

CRITERIA InstructionsExample – see EVIDEM web site for more examples under the
Collaborative Registry(references were removed for simplicity –
statements should be referenced with access to full text sources)
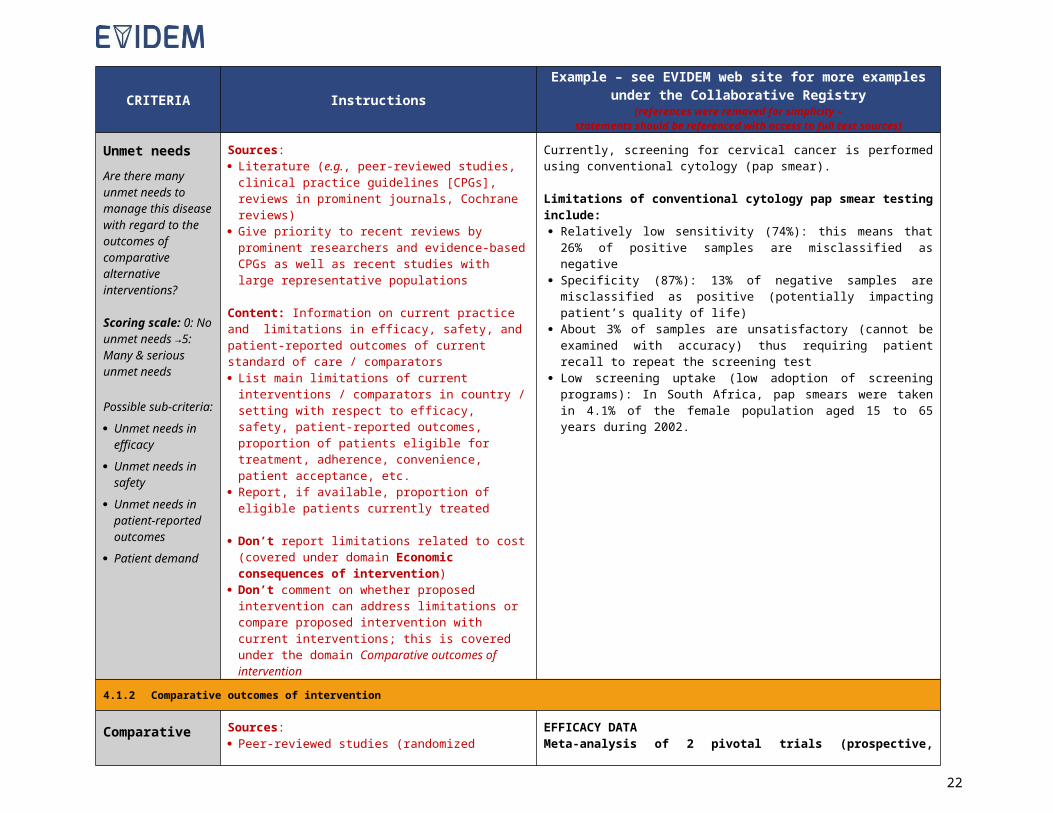
Unmet needsAre there many unmet needs to manage this disease with regard to the outcomes of comparative alternative interventions?
Scoring scale: 0: No unmet needs →5: Many & serious unmet needs
Possible sub-criteria: Unmet needs in
efficacy Unmet needs in
safety Unmet needs in
patient-reported outcomes
Patient demand
Sources: Literature (e.g., peer-reviewed studies, clinical practice
guidelines [CPGs], reviews in prominent journals, Cochrane reviews)
Give priority to recent reviews by prominent researchers and evidence-based CPGs as well as recent studies with large representative populations
Content: Information on current practice and limitations in efficacy, safety, and patient-reported outcomes of current standard of care / comparators List main limitations of current interventions /
comparators in country / setting with respect to efficacy, safety, patient-reported outcomes, proportion of patients eligible for treatment, adherence, convenience, patient acceptance, etc.
Report, if available, proportion of eligible patients currently treated
Don’t report limitations related to cost (covered under domain Economic consequences of intervention)
Don’t comment on whether proposed intervention can address limitations or compare proposed intervention with current interventions; this is covered under the domain Comparative outcomes of intervention
Currently, screening for cervical cancer is performed using conventional cytology (pap smear).
Limitations of conventional cytology pap smear testing include: Relatively low sensitivity (74%): this means that 26% of positive
samples are misclassified as negative Specificity (87%): 13% of negative samples are misclassified as
positive (potentially impacting patient’s quality of life) About 3% of samples are unsatisfactory (cannot be examined with
accuracy) thus requiring patient recall to repeat the screening test Low screening uptake (low adoption of screening programs): In South
Africa, pap smears were taken in 4.1% of the female population aged 15 to 65 years during 2002.
4.1.2 Comparative outcomes of intervention
Comparative effectiveness
How does this intervention compare to alternatives with respect to efficacy / effectiveness outcomes?
Scoring scale: -5: much worse than
Sources: Peer-reviewed studies (randomized controlled trials
[RCTs], meta-analyses, observational studies), trial registries
Unpublished data/reports (e.g., from manufacturer) Give priority to published peer-reviewed comparative
RCTs
Content: Efficacy and effectiveness data by outcome of interest. Key information on trial design to allow understanding of the trial and outcomes to identify differences between interventions
Use the generic evidence table at the end of this document to organize clinical trial data before
EFFICACY DATAMeta-analysis of 2 pivotal trials (prospective, randomized controlled trials; treatment-naïve patients; 24 months, Intention-to-treat analysis [ITT])
Trial 1: Treatment Y vs comparator 1 vs placebo Trial 2: Comparator 1 vs comparator 2
Inclusion criteria: Age > 50 years; all types of patients for treatment Y, comparator 1 and placebo; only patients with specific subtype of eye disease X for comparator 2 (comparator 2 indication)
Exclusion criteria: previous treatment/intervention for eye disease X; liver disease; eye surgery within last 2 months
18

CRITERIA InstructionsExample – see EVIDEM web site for more examples under the
Collaborative Registry(references were removed for simplicity –
statements should be referenced with access to full text sources)comparator (negative contribution)→5: much better than comparator(positive contribution)
Possible sub-criteria: Magnitude of
health gain
Percentage of the target population expected to realize the anticipated health gain
Onset and duration of health gain
Sub-criteria for the measure of efficacy specific to the therapeutic area
summarizing it Summarize pivotal trial(s) data; if many trials, select
large head-to-head RCTs using comparators most relevant to the setting:o Include brief description of trial(s) (type of study,
intervention, duration of treatment, number of patients, patient inclusion/ exclusion criteria, type of analysis, patient disposition)
o Report the most synthesized and most relevant efficacy data (i.e., most significant/ standard outcome measure; principal analysis) in a format that is most readable (e.g., use percentages instead of fractions; in tables, keep percentage signs with numbers; round numbers keeping only significant digits); report absolute data rather than relative if baseline is comparable; indicate statistical significance
When multiple publications are on the same patient population, report data by cohort not by publication (avoid double reporting of outcomes in the same population)
If available, report key findings of meta-analyses, effectiveness and observational studies
If available, report key findings of modeling studies If only placebo-controlled trials are available, provide
summaries of pivotal comparator trials Where applicable, indicate differences in population
eligibility between proposed intervention and comparators
Primary outcome at 24 months: Mean change in visual acuity, number of letters (standard outcome measure for eye disease X; a loss of 45 letters would be defined as legal blindness)
Treatment Y Comp. 1 Comp. 2 Placebo
All types of disease X -7* (n=200) -6* (n=300)
NA -15 (n=200)
Subtype only -6†
(n=100)-6†
(n=200)-8†
(n=100)-16(n=100)
Significant differences against placebo: *P<.01, †P<.05
Patient characteristics comparable across groups: mean age 62 years, 45% women, 56% with comorbidity, 38% smokers, 59% retired
Subgroup analyses showed that benefit decreases with age for all treatments; no differences observed between men and women
Patient disposition: approximately 90% of randomized patients completed the studies
Population of patients eligible for treatmentTreatment Y and comparator 1 are effective for all types of eye disease X; comparator 2 is effective only in one subtype of eye disease X.
EFFECTIVENESS DATANot available
19
CRITERIA InstructionsExample – see EVIDEM web site for more examples under the
Collaborative Registry(references were removed for simplicity –
statements should be referenced with access to full text sources)
Comparative safety / tolerabilityHow does this intervention compare to alternatives with respect to safety / tolerability outcomes?
Scoring scale: -5: much worse than comparator (negative contribution)→5: much better than comparator(positive contribution)
Possible sub-criteria: Adverse events Serious adverse
events Fatal adverse
events Short-term safety Long-term safety Tolerability
Sources: Peer-review studies (RCTs, observational studies,
case reports) Product monographs, technical sheets, surveillance &
clinical databases (e.g., from regulatory authorities) Integrated safety analyses Unpublished data /reports (e.g., from manufacturer)
Content: Potential harms (adverse events [AEs], warnings) related to the use of the intervention and its comparators.
Report AEs in tabular format (all-cause as well as treatment-related) for intervention and key comparator(s) in target population; specify exposure, duration of follow-up and size of population
If all-cause AEs list is very long, report only AEs with rates above a specific cut-off (report cut-off used)
Report for intervention and comparators: incidence of serious AEs & deaths, discontinuation due to AEs, warnings, and monitoring requirements
Present data for intervention and on comparators from head-to-head trials as available; otherwise from published studies or prescribing information
Identify and indicate differentiating aspects between intervention and comparators regarding safety
SAFETY DATABased on meta-analysis of pivotal trials (see details on trials under Comparative effectiveness)
Incidence of adverse events (AEs): 24-month follow-up
Treatment YN=200
Comp. 1N=300
Comp. 2N=100
PlaceboN=200
Common AEs, % of patients with all-cause AEs (treatment-related AEs)Eye pain 15 (1) 34 (9) 22 (4) 9 (0)Eye inflammation 6 (0.5) 17 (4) NA 4 (0.1)Vitreous opacities 8 (0) 22 (3) NA 7 (0)Photosensitivity 4 (0) 2 (0) 11 (2.5) 3 (0)Injection site AEs NA NA 12 (9) NA
Treatment related serious AEs , % of patientsEndophthalmitis 0 1 NA NAVitreous hemorrhage
0 2 NA NA
Traumatic cataract 0 1 NA NADiscontinuation due to AEs, % of patients
1 1 4 0
WARNINGS (from product monograph)Treatment Y: hypertension; proteinurea; renal failure; cardiac failure; hepatotoxicity
Comparator 1: hypersensitivity; haemorrhage; hypocalcemia;; dermatological toxicity; hypertension
MONITORING (from product monograph)Treatment Y: regularly monitor blood pressure, urine protein, clinical symptoms or signs of cardiac decompensation
Comparator 1: regularly monitor blood pressure, electrocardiograms and electrolytes and liver function
20

CRITERIA InstructionsExample – see EVIDEM web site for more examples under the
Collaborative Registry(references were removed for simplicity –
statements should be referenced with access to full text sources)
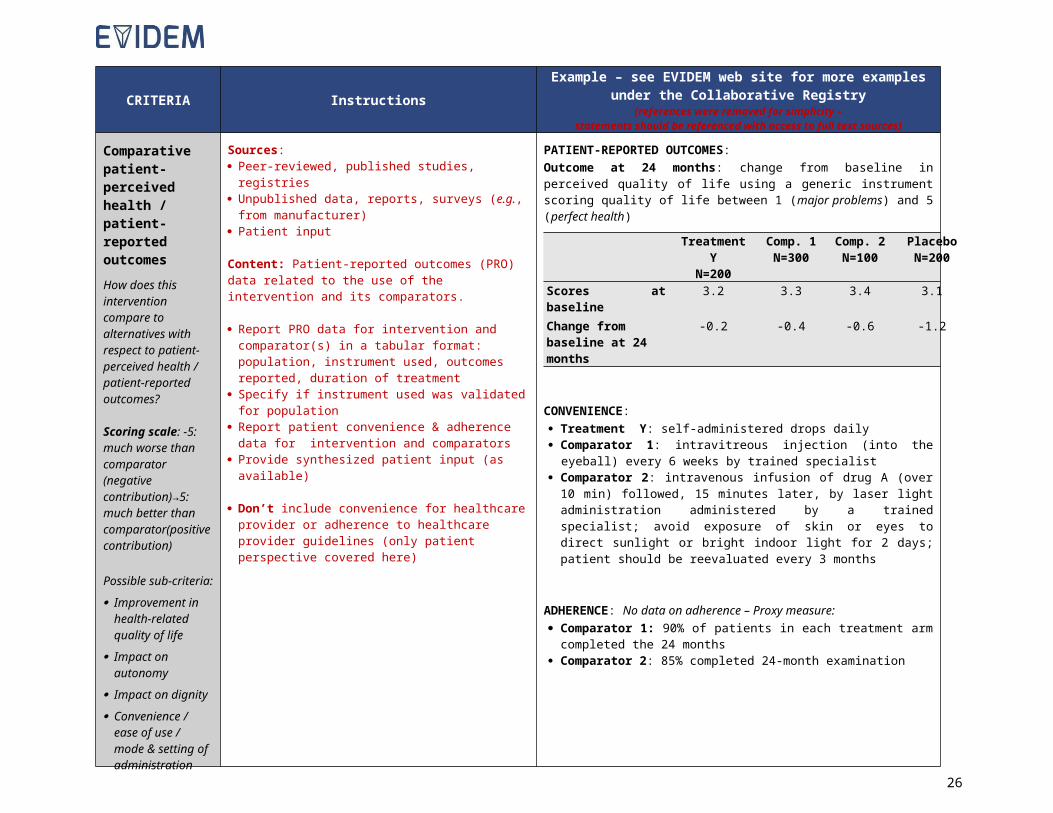
Comparative patient-perceived health / patient-reported outcomesHow does this intervention compare to alternatives with respect to patient-perceived health / patient-reported outcomes?
Scoring scale: -5: much worse than comparator (negative contribution)→5: much better than comparator(positive contribution)
Possible sub-criteria:
Improvement in health-related quality of life
Impact on autonomy
Impact on dignity Convenience /
ease of use / mode & setting of administration
Sources: Peer-reviewed, published studies, registries Unpublished data, reports, surveys (e.g., from
manufacturer) Patient input
Content: Patient-reported outcomes (PRO) data related to the use of the intervention and its comparators.
Report PRO data for intervention and comparator(s) in a tabular format: population, instrument used, outcomes reported, duration of treatment
Specify if instrument used was validated for population Report patient convenience & adherence data for
intervention and comparators Provide synthesized patient input (as available)
Don’t include convenience for healthcare provider or adherence to healthcare provider guidelines (only patient perspective covered here)
PATIENT-REPORTED OUTCOMES:Outcome at 24 months: change from baseline in perceived quality of life using a generic instrument scoring quality of life between 1 (major problems) and 5 (perfect health)
Treatment YN=200
Comp. 1N=300
Comp. 2N=100
PlaceboN=200
Scores at baseline 3.2 3.3 3.4 3.1Change from baseline at 24 months
-0.2 -0.4 -0.6 -1.2
CONVENIENCE: Treatment Y: self-administered drops daily Comparator 1: intravitreous injection (into the eyeball) every 6 weeks
by trained specialist Comparator 2: intravenous infusion of drug A (over 10 min) followed,
15 minutes later, by laser light administration administered by a trained specialist; avoid exposure of skin or eyes to direct sunlight or bright indoor light for 2 days; patient should be reevaluated every 3 months
ADHERENCE: No data on adherence – Proxy measure: Comparator 1: 90% of patients in each treatment arm completed the
24 months Comparator 2: 85% completed 24-month examination
21
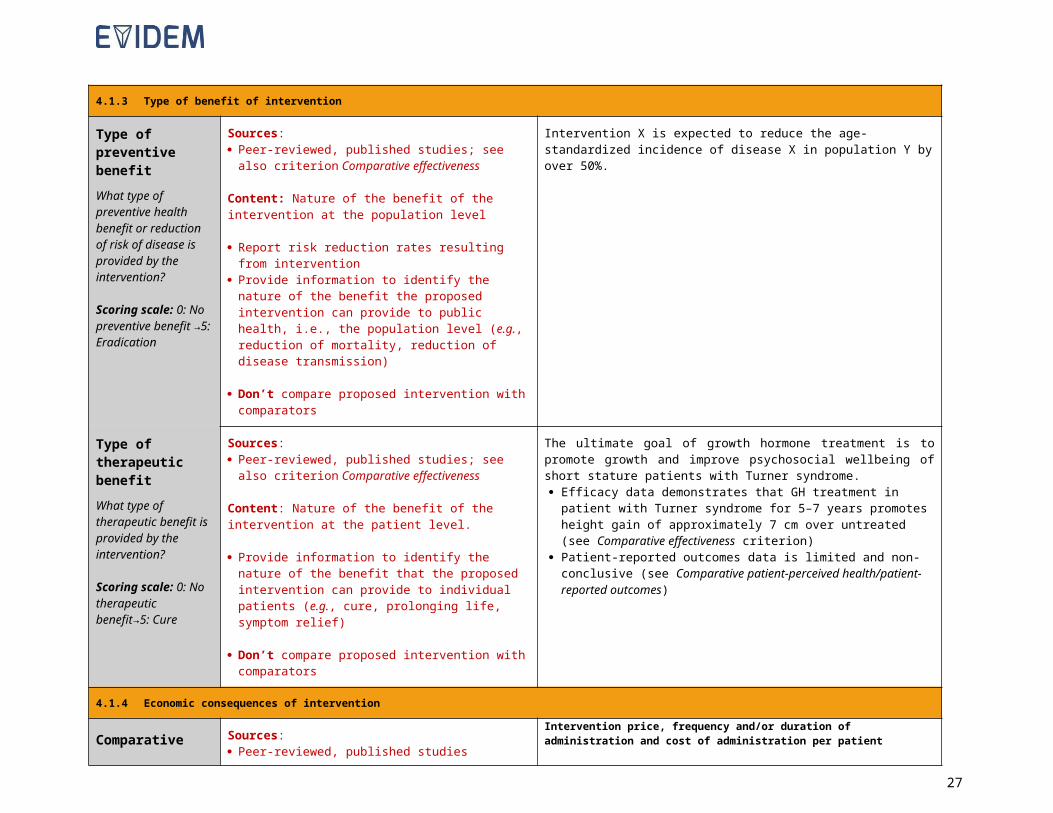
4.1.3 Type of benefit of intervention
Type of preventive benefitWhat type of preventive health benefit or reduction of risk of disease is provided by the intervention?
Scoring scale: 0: No preventive benefit →5: Eradication
Sources: Peer-reviewed, published studies; see also criterion
Comparative effectiveness
Content: Nature of the benefit of the intervention at the population level
Report risk reduction rates resulting from intervention Provide information to identify the nature of the benefit
the proposed intervention can provide to public health, i.e., the population level (e.g., reduction of mortality, reduction of disease transmission)
Don’t compare proposed intervention with comparators
Intervention X is expected to reduce the age-standardized incidence of disease X in population Y by over 50%.
Type of therapeutic benefitWhat type of therapeutic benefit is provided by the intervention?
Scoring scale: 0: No therapeutic benefit→5: Cure
Sources: Peer-reviewed, published studies; see also criterion
Comparative effectiveness
Content: Nature of the benefit of the intervention at the patient level.
Provide information to identify the nature of the benefit that the proposed intervention can provide to individual patients (e.g., cure, prolonging life, symptom relief)
Don’t compare proposed intervention with comparators
The ultimate goal of growth hormone treatment is to promote growth and improve psychosocial wellbeing of short stature patients with Turner syndrome. Efficacy data demonstrates that GH treatment in patient with Turner
syndrome for 5–7 years promotes height gain of approximately 7 cm over untreated (see Comparative effectiveness criterion)
Patient-reported outcomes data is limited and non-conclusive (see Comparative patient-perceived health/patient-reported outcomes)
4.1.4 Economic consequences of intervention
Comparative cost consequences – cost of intervention
What is the cost of the intervention (including acquisition, implementation and maintenance costs) compared to other current interventions (comparators)?
Sources: Peer-reviewed, published studies Unpublished data (e.g., from health plan or
manufacturer) Cost data, e.g., from databases
Content: Capture the extent of additional or reduced expenditures per patient stemming from covering the intervention.
Tabulate data on cost per patient of implementing the intervention and comparators (unit cost, frequency/duration of treatment, equipment associated costs, administration cost, annual estimate, etc.).
Intervention price, frequency and/or duration of administration and cost of administration per patient
Intervention Comparator a Comparator bDose and frequency of administration*
20 mg 2 × daily*
30 mg 3 × daily 20 U/kg/every
week
Average price per unit sold $7,000 for 60
20-mg capsules
$5,000 for 90 30-mg
capsules
$200 for 200-U vial
Average weight of patients
Not applicable 65 kg†
Cost per treatment $233 per day $167 per day $1,400 per infusion‡
Average number of treatments per year 329 days§
47 infusions§
Average annual $76,767 $54,833 $65,800
22

Scoring scale: -5: substantial additional expenditures (negative contribution)→5: substantial savings(positive contribution)
Possible sub-criteria: Net cost of
intervention Acquisition cost Implementation/
maintenance cost
Provide relevant data that may significantly affect estimate (e.g., generics if not included).
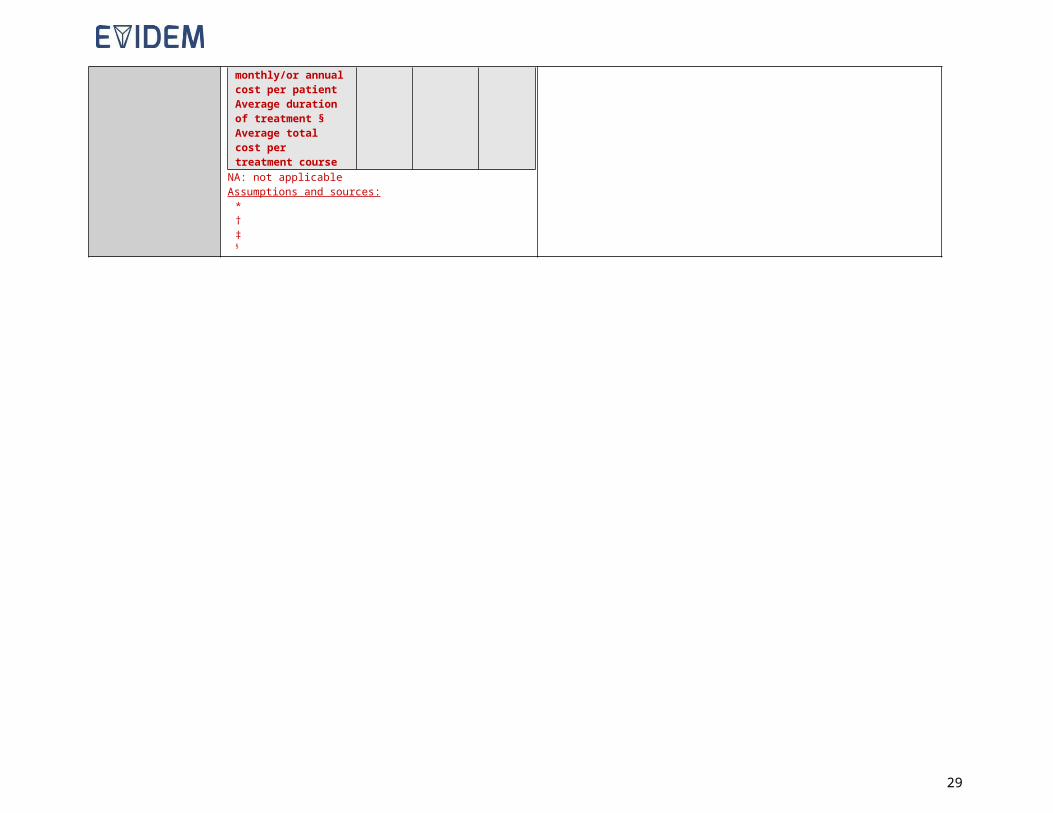
Intervention price, frequency and/or duration of administration and cost of administration Note: the table below is most applicable for drug products-it needs to be adapted for other types of interventions
Inter-vention
Compa-rator 1
Compa-rator 2
Price per unit (e.g., available dosing form)Recommended daily dose (e.g., from SmPC)Actual daily dose†Average daily drug cost per patient (based on actual dose)Average monthly/annual drug cost per patientAdministration cost per month‡Average total monthly/or annual cost per patientAverage duration of treatment §Average total cost per treatment course
NA: not applicableAssumptions and sources:
*†‡§
pharmaceutical costAverage annual cost of administration
0
$5,000¶
Average annual therapy cost per patient
$76,767 $54,833 $70,800
* Recommended dose based on SmPC† Based on mean weight of patients in study XX‡ Assuming that no drug is wasted and that unused contents of opened vials are discarded§ Assuming 90% adherence¶ IV infusion settings: 40% home, 60% hospital
23
Comparative cost consequences – other medical costsWhat is the impact of the intervention on other medical costs such as hospitalization, specialist consultations, adverse events costs, long-term care, etc.?
Scoring scale: -5: substantial additional expenditures (negative contribution)→5: substantial savings(positive contribution)
Possible sub-criteria: Impact on primary
care expenditures Impact on hospital
care expenditures Impact on long-term
care expenditures
Sources: Peer-reviewed, published studies; economic
evaluations Unpublished data (e.g., from health plan or
manufacturer) Data often derived from economic evaluations
Content: Capture the impact of providing coverage for the proposed intervention on other medical costs (excluding cost of intervention and its comparators)
Tabulate impact of intervention and comparators on other medical costs, such as hospitalization, specialist consultations, adverse events costs, long-term care, as available.
Estimate total impact of intervention and comparator(s) and calculate the absolute difference (increment), if possible
If no savings with intervention, explain why; if intervention results in net savings, explain why (if not obvious from the table)
Don’t report on cost of implementing intervention or comparators (e.g., acquisition cost for a drug, equipment associated cost); covered under Comparative cost consequences – Cost of intervention)
Don’t include potential for future cost increases for the intervention; this should be covered under Comparative cost consequences – cost of intervention
Don’t include data on non-medical costs of intervention (covered in Comparative cost consequences – non-medical costs)
Study description: indicate characteristics of the study from which the data presented is obtained including as applicable: Population; description of intervention (dose, duration) and comparators; model type, time horizon & key model features and assumptions including discounting; Costs included (except cost of intervention itself – see criteria above) (e.g., hospital costs, physician visits, adverse events, etc and how costs were obtained e.g. based on studies, expert opinion, assumptions); sensitivity analyses (on which data, based on which assumptions)
Study results:
Example
Impact of treatment Y on other medical expenditures (excluding drug cost, see Comparative cost consequences – cost of intervention)Includes hospitalization costs, adverse events costs and nursing home costs, based on data available in economic evaluation
Mean costs (CAD$) per patient: at 24 months
Treatment costs*
Adverse event costs†
Costs of nursing home Total
Treatment Y
savingsTreatment Y
600 2 5,0005,602
-
Comp 1 3,000 20 4,500 7,524 1,922Comp 2 2,900 10 5,500 8,408 2,806No treatment
300 1 8,0008,301 2,699
*includes physician visits, treatment administration and required tests; excludes drug cost†includes endophthalmitis, vitreous hemorrhage, traumatic cataract, intravenous injection site AEs, photosensitivity
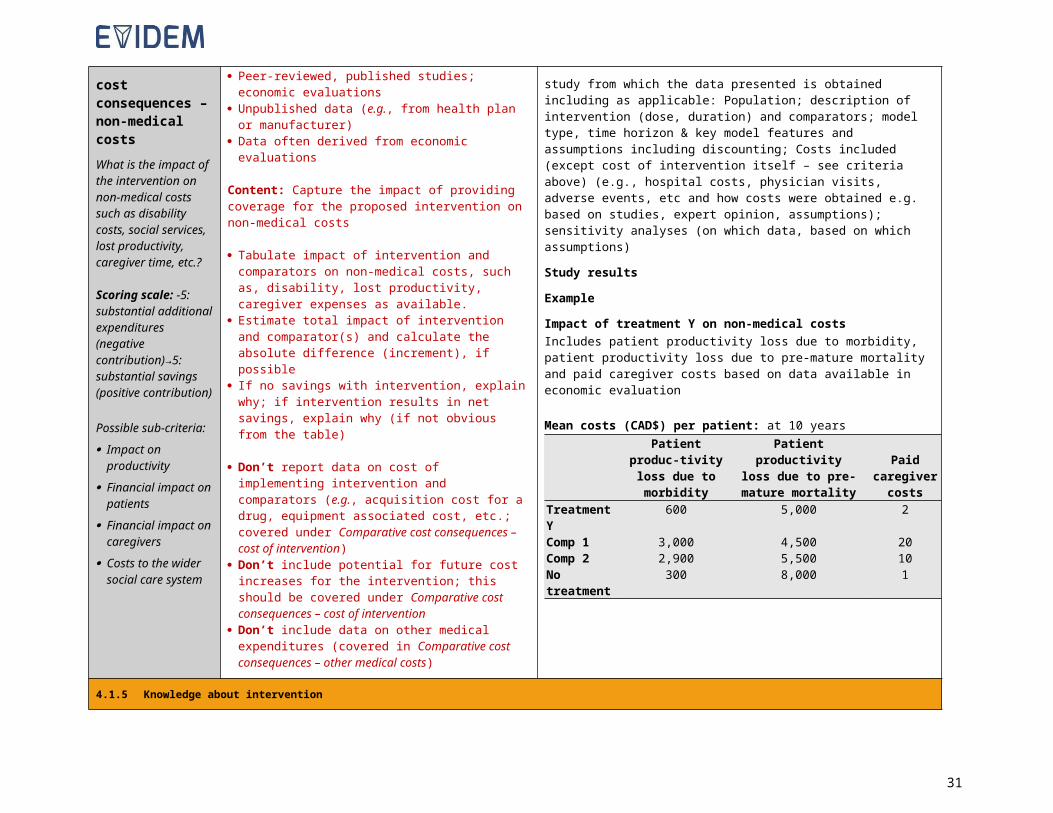
Comparative cost consequences – non-medical costsWhat is the impact of the intervention on non-medical costs such as disability costs, social services, lost productivity, caregiver time, etc.?
Scoring scale: -5: substantial additional expenditures
Sources: Peer-reviewed, published studies; economic
evaluations Unpublished data (e.g., from health plan or
manufacturer) Data often derived from economic evaluations
Content: Capture the impact of providing coverage for the proposed intervention on non-medical costs
Tabulate impact of intervention and comparators on non-medical costs, such as, disability, lost productivity, caregiver expenses as available.
Estimate total impact of intervention and comparator(s) and calculate the absolute difference (increment), if
Study description: indicate characteristics of the study from which the data presented is obtained including as applicable: Population; description of intervention (dose, duration) and comparators; model type, time horizon & key model features and assumptions including discounting; Costs included (except cost of intervention itself – see criteria above) (e.g., hospital costs, physician visits, adverse events, etc and how costs were obtained e.g. based on studies, expert opinion, assumptions); sensitivity analyses (on which data, based on which assumptions)
Study results
Example
Impact of treatment Y on non-medical costsIncludes patient productivity loss due to morbidity, patient productivity
24

(negative contribution)→5: substantial savings (positive contribution)
Possible sub-criteria: Impact on
productivity Financial impact on
patients Financial impact on
caregivers Costs to the wider
social care system
possible If no savings with intervention, explain why; if
intervention results in net savings, explain why (if not obvious from the table)
Don’t report data on cost of implementing intervention and comparators (e.g., acquisition cost for a drug, equipment associated cost, etc.; covered under Comparative cost consequences – cost of intervention)
Don’t include potential for future cost increases for the intervention; this should be covered under Comparative cost consequences – cost of intervention
Don’t include data on other medical expenditures (covered in Comparative cost consequences – other medical costs)
loss due to pre-mature mortality and paid caregiver costs based on data available in economic evaluation
Mean costs (CAD$) per patient: at 10 yearsPatient produc-
tivity loss due to morbidity
Patient productivity loss due to pre-mature mortality
Paid caregiver
costsTreatment Y 600 5,000 2Comp 1 3,000 4,500 20Comp 2 2,900 5,500 10No treatment
300 8,000 1
25
4.1.5 Knowledge about intervention
26
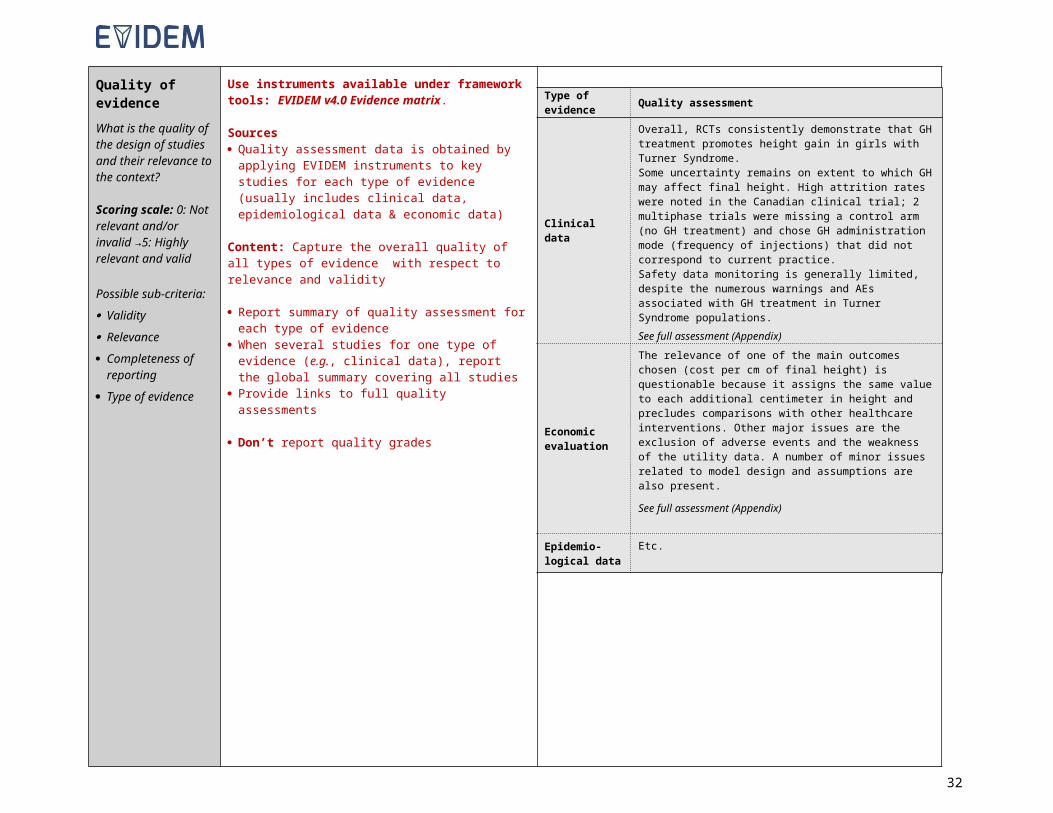
Quality of evidenceWhat is the quality of the design of studies and their relevance to the context?
Scoring scale: 0: Not relevant and/or invalid →5: Highly relevant and valid
Possible sub-criteria: Validity Relevance Completeness of
reporting Type of evidence
Use instruments available under framework tools: EVIDEM v4.0 Evidence matrix.
Sources Quality assessment data is obtained by applying
EVIDEM instruments to key studies for each type of evidence (usually includes clinical data, epidemiological data & economic data)
Content: Capture the overall quality of all types of evidence with respect to relevance and validity
Report summary of quality assessment for each type of evidence
When several studies for one type of evidence (e.g., clinical data), report the global summary covering all studies
Provide links to full quality assessments
Don’t report quality grades
27
Type of evidence Quality assessment
Clinical data
Overall, RCTs consistently demonstrate that GH treatment promotes height gain in girls with Turner Syndrome.Some uncertainty remains on extent to which GH may affect final height. High attrition rates were noted in the Canadian clinical trial; 2 multiphase trials were missing a control arm (no GH treatment) and chose GH administration mode (frequency of injections) that did not correspond to current practice.Safety data monitoring is generally limited, despite the numerous warnings and AEs associated with GH treatment in Turner Syndrome populations.See full assessment (Appendix)
Economic evaluation
The relevance of one of the main outcomes chosen (cost per cm of final height) is questionable because it assigns the same value to each additional centimeter in height and precludes comparisons with other healthcare interventions. Other major issues are the exclusion of adverse events and the weakness of the utility data. A number of minor issues related to model design and assumptions are also present.
See full assessment (Appendix)
Epidemio-logical data
Etc.
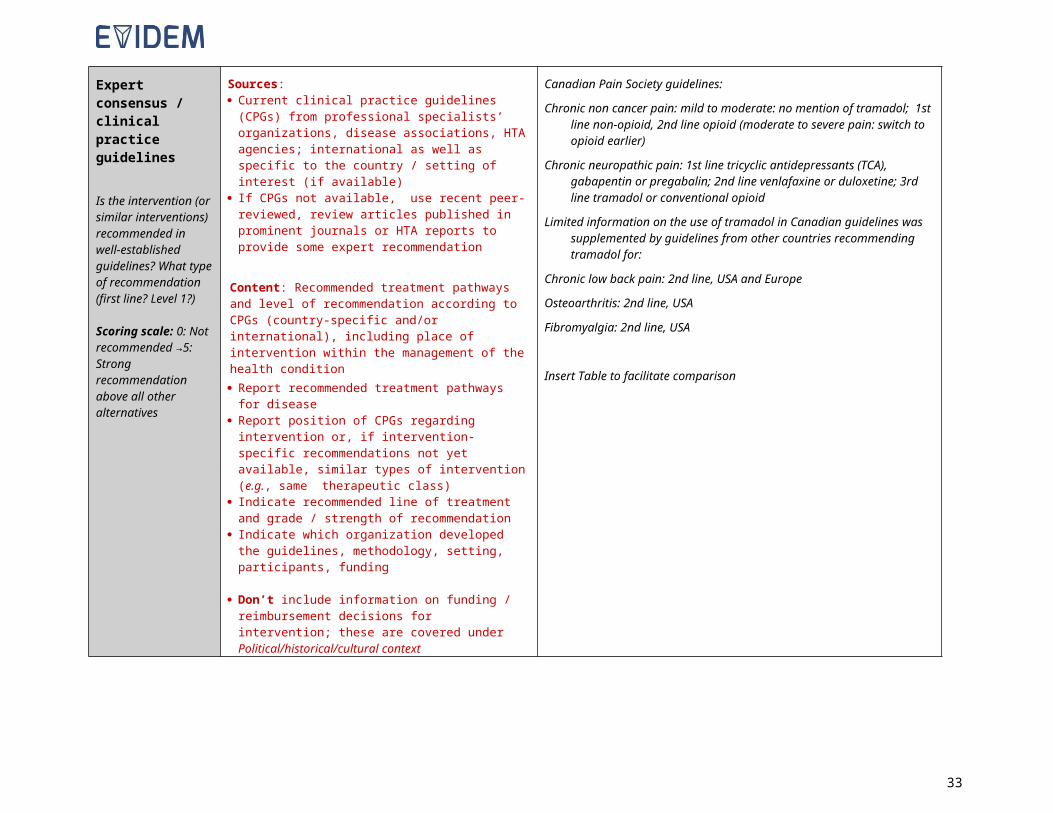
Expert consensus / clinical practice guidelines
Is the intervention (or similar interventions) recommended in well-established guidelines? What type of recommendation (first line? Level 1?)
Scoring scale: 0: Not recommended →5: Strong recommendation above all other alternatives
Sources: Current clinical practice guidelines (CPGs) from
professional specialists’ organizations, disease associations, HTA agencies; international as well as specific to the country / setting of interest (if available)
If CPGs not available, use recent peer-reviewed, review articles published in prominent journals or HTA reports to provide some expert recommendation
Content: Recommended treatment pathways and level of recommendation according to CPGs (country-specific and/or international), including place of intervention within the management of the health condition Report recommended treatment pathways for disease Report position of CPGs regarding intervention or, if
intervention-specific recommendations not yet available, similar types of intervention (e.g., same therapeutic class)
Indicate recommended line of treatment and grade / strength of recommendation
Indicate which organization developed the guidelines, methodology, setting, participants, funding
Don’t include information on funding / reimbursement decisions for intervention; these are covered under Political/historical/cultural context
Canadian Pain Society guidelines:
Chronic non cancer pain: mild to moderate: no mention of tramadol; 1st line non-opioid, 2nd line opioid (moderate to severe pain: switch to opioid earlier)
Chronic neuropathic pain: 1st line tricyclic antidepressants (TCA), gabapentin or pregabalin; 2nd line venlafaxine or duloxetine; 3rd line tramadol or conventional opioid
Limited information on the use of tramadol in Canadian guidelines was supplemented by guidelines from other countries recommending tramadol for:
Chronic low back pain: 2nd line, USA and Europe
Osteoarthritis: 2nd line, USA
Fibromyalgia: 2nd line, USA
Insert Table to facilitate comparison
28
CRITERIA Background and Instructions
4.2 CONTEXTUAL TOOL
4.2.1 Normative contextual criteria
Mandate and scope of healthcare system
BackgroundThis criterion is included to ensure consideration whether the intervention is actually producing a good that is a health benefit falling under the mandate and within the scope of the health plan/healthcare system (it often implicitly does). In general terms, the goal of healthcare is to maintain normal functioning. Such consideration is aligned with the positions of utilitarianism (producing the “greatest benefits for the greatest number”) and beneficence.
Sources: Literature, disease association web sites, discussing such issues regarding the intervention or related interventions (e.g.,
should healthcare systems cover lifestyle interventions; is the intervention addressing a medical or social issue) Information from health plan/system regarding explicitly defined mandate / scope (e.g., a health plan may not consider
lifestyle interventions to be part of its mandate). Other specific information from health plan
Content: Provide information that can support the discussion on whether the proposed intervention is in line with the goal of the health plan/healthcare system and whether it does produce an actual health benefit. For example, enhancement of otherwise normal traits (e.g., growth hormone for short stature) may not be considered a medical issue but rather a social issue, and thus not aligned with the mandate of a healthcare system/plan. One would question here whether such consideration impacts the value/appraisal of growth hormone for individuals with short stature.
Population priorities and access
Possible sub-criteria: Current priorities of health
system strategic plan (e.g., disabled; low socioeconomic status; specific age groups)
Special populations (e.g., ethnicity)
Remote communities Rare diseases Specific therapeutic areas
BackgroundThis criterion is included to ensure consideration of priorities defined by decisionmakers or society. Such priorities may not be clearly defined but this criterion is meant to stimulate reflection on priorities and whether the intervention targets a group of patients that falls under prioritized populations. Priorities for specific groups of patients are defined by societies/decisionmakers and reflect their moral values. Such considerations are aligned with the principle of fairness, which considers treating like cases alike and different cases differently and often gives priority to those who are worst-off (theory of justice).
Sources: Literature Laws & regulations for health plan/healthcare system outlining priorities, as available Other specific information from health plan
Content: Provide information on: Priorities in relevant settings (e.g., vulnerable populations, rare diseases, remote populations, prioritized therapeutic
areas, etc.) Characteristics of the intervention relevant to whether it is targeting a prioritized group. Are patients afflicted by the condition considered worst off and thus should be prioritized under the realm of the “theory of
justice”? Is the intervention associated with issues of access to care? Any discussion on whether the intervention triggers issues related to the concept of “treat like cases similarly”?
For example, interventions may be prioritized that target vulnerable populations and can be delivered in remote regions with limited facilities.
Common goal and Background
29

specific interests
Possible sub-criteria: Stakeholder pressures Stakeholder barriers Conflict of interest
This criterion is included to prompt explicit consideration of pressures/barriers from stakeholders and awareness of the interests at stake, which are often part of the context surrounding healthcare decisionmaking. Awareness of stakeholder pressures / barriers helps ensure that decisions are fair-minded and driven by the common goal and not unduly influenced by specific interests (practical wisdom).
Sources: Literature, disease association websites, popular media Other specific information from health plan
Content: Identify societal pressures and pressures from specific groups of stakeholders (clinicians, patients, industry, etc.), Example: pressures from specialists to use innovative technologies; pressures from patient groups for compassionate use.
Environmental impact
Possible sub-criteria: Environmental impact of
production Environmental impact of use Environmental impact of
implementation
BackgroundThis criterion is included to ensure explicit consideration of the environmental impact. The tool is used here to prompt identification of the potential environmental impact of the intervention from a qualitative standpoint. Its ethical implication is to protect the environment based on the ethical positions of utilitarianism and beneficence.
Sources: Literature
Content: Example: The intervention necessitates the use of radioactive isotopes which have a negative impact on the environment and require special containment.
4.2.2 Feasibility contextual criteria
System capacity and appropriate use of intervention
Possible sub-criteria: Organizational requirements
(e.g., process, premises, equipment)
Skill requirements Legislative requirements Surveillance requirements Risk of inappropriate use Institutional limitations to
uptake Ability to reach the whole
target region/population
BackgroundThis criterion is included to ensure consideration of the capacity of the healthcare system to implement the intervention and to ensure its appropriate use in order to realize its potential benefit and avoid unintended consequences (practical wisdom). This depends on its infrastructure, organization, skills, legislation, barriers and risks of inappropriate use. Such considerations include mapping current systems and estimating whether the use of the intervention under scrutiny requires additional capacities (note: if economic estimate is available, it could be included in the economic criteria of the EVIDEM Core Model).
Data sources Literature Specific information from health plan
Content: Provide information on: Risk of inappropriate use of intervention and its consequences Implementation issues (infrastructure, organization, skills, legislation, barriers including human barriers) Example: Ease of identifying patients who are most appropriate to receive the intervention Don’t include economic estimates (costs) here. This should be covered under the economic criteria of the EVIDEM
Core Model
Political / historical / cultural context
Possible sub-criteria: Political priorities and
context
BackgroundThis criterion is included to ensure consideration of specific political/historical/cultural context that may impact the decision in consideration of political situations and overall priorities (e.g., priority to innovation) as well as habits, traditions and precedence (practical wisdom).
Sources:
30
Cultural acceptability Precedence (congruence
with previous and future decisions)
Impact on innovation & research
Impact on partnership & collaboration among healthcare stakeholders
Literature, disease association web site, popular media Other specific information from health plan
Content: Provide information on: The political/historical/cultural context or precedence and traditions associated with the intervention or related
interventions Funding decisions for proposed intervention by other jurisdictions Explicit governmental /political priorities (e.g., innovation in healthcare, budget constraints in economic recession)
beyond healthcare priorities (covered in Opportunity costs and affordability) Example: This type of intervention has historically always been considered in a similar fashion and is likely to be
considered the same way (or for a new type of intervention, may set a precedent).
31
4.3 OPPORTUNITY COST
Opportunity costs and affordability
Possible sub-criteria: Opportunity costs for patient
(foregone resources) Opportunity costs for
population (foregone resources)
Affordability
BackgroundThis criterion is included to ensure consideration of what may not be available anymore if using/reimbursing intervention (identifying foregone intervention in context of limited budget) and whether available resources are actually maximized (at patient and societal level) in doing so. This criterion also covers the concept of affordability. Both affordability and opportunity cost considerations require a financial/budgeting exercise, proposed below. It reflects the principle of efficiency (utilitarianism, practical wisdom).
Sources and content:
Opportunity cost and affordability at patient level: Discuss the role and cost of the intervention taking in account other types of interventions to manage/treat the condition (e.g., psychological support for short stature rather than growth hormone treatment). Sources: Literature, disease association web sites, etc.
Health plan level (cost at population level; comparative cost at patient level is covered under the cost criteria of the Core Model) : Opportunity costs: after establishing the cost of the intervention for your population (see calculations below for
affordability), explore with health plan which intervention could be disinvested if intervention under scrutiny is adopted/reimbursed ;
Affordability: Net impact of reimbursing the intervention on the budget of health plan (may include only intervention expenditures, but also other spending. Cost data on which these calculations are based should be those used in the Core Model (see Comparative cost criteria)Present methods and results of a relevant budget impact model:o Indicate type of model (claim based, epidemiological), costs included (e.g., dispensing fees, mark-up, cost of
treatment administration, hospitalization, etc.) & major assumptions (number of patients, market share and switching from comparators a, b, etc., disease management patterns with intervention and comparators, etc.)
o Tabulate projected budget impact (number of patients, cost to health plan, incremental budget impact) as below:
Projected annual impact of covering intervention on health plan/setting spending for indication (includes intervention and implementation/administration and etc. costs, based on origin and type of budget impact model)Scenario : Brief description of scenario including availability of comparators
Number of patients receiving
intervention (Ni)
Average annual cost per patient
receiving intervention (Ci)
Annual intervention
cost(Ti = Ni Ci)
Total annual cost if intervention is
covered (Tic=Ti +Na,ic Ca +
Nb,icCb + …)
Total annual cost if intervention is
not covered (Tinc=Na,incCa + Nb,incCb + …)
Incremental (net) impact of intervention
on spending for indication
(Tic -Tinc)Year 1Year 2Year 3Year 4Year 5Total
5 years
ic: intervention covered; inc: intervention not covered
Provide explanation on difference between cost to health plan and incremental budget impact Provide relevant data that may significantly affect estimate (e.g., generics if not included in model) Report results of sensitivity analyses
32
EXAMPLE:Projected annual impact of covering the intervention on Canadian provincial / territorial drug plan spending for disease (includes intervention and administration cost, based on health plans’ epidemiological model)Scenario: Year 5 after full reimbursement of intervention; intervention replaces comparators a and b
Annual number of patients receiving intervention per
100,000 population
Average annual cost per patient receiving
intervention
Annual intervention cost of per
100,000 population
Total annual cost per 100,000
population if intervention is
covered
Total annual cost per 100,000 population if
intervention is not covered
Incremental (net) impact of intervention on total spending for disease
per 100,000 population
150 $76,767 $11.5 million $21.7 million $20.3 million + $1.4 millionAssumptions:
Prevalence of disease: 375 /100,000; 80% of patients are treated (i.e., 300 per 100,000) Treatment mix in Year 5: If intervention not covered: comparator a: 20%, comparator b: 80%; If intervention covered: intervention:
50%, comparator a: 10%, comparator b: 40% Mark-up, dispensing fees and discounts not included
The projected additional expenditures are due to replacement of lower-cost therapies (comparators a and b) with intervention.Incremental budget impact sensitive to:
Cost of comparator b (depends strongly on dose [U/kg], patient weight, and annual number of infusions): savings of $2.0 million if mean comparator b dose increases to 30 U/kg/week (actual dose observed in some studies)
If treatment rate increases to 90%: incremental net impact of intervention increases to $4.1 million
5 REFERENCE LIST
List bibliography cited Once completed, paste the list as an appendix in the EVIDEM v4.0 Adapt & pilot.
6 EVIDENCE TABLES
o Evidence tables can be used to organized data from individual studies to facilitate the synthesis for the EVIDEM Evidence Matrix. The following template includes instructions and an example to facilitate the process.
o In the EVIDEM Evidence Matrix (see above), data is presented by outcome rather than by study, and data from the same cohort (but potentially presented in different publications) is presented only once in agreement with good HTA practices.
Note: Once completed, remove instructions and paste table as an appendix in the EVIDEM v4.0 Adapt & pilot.
33
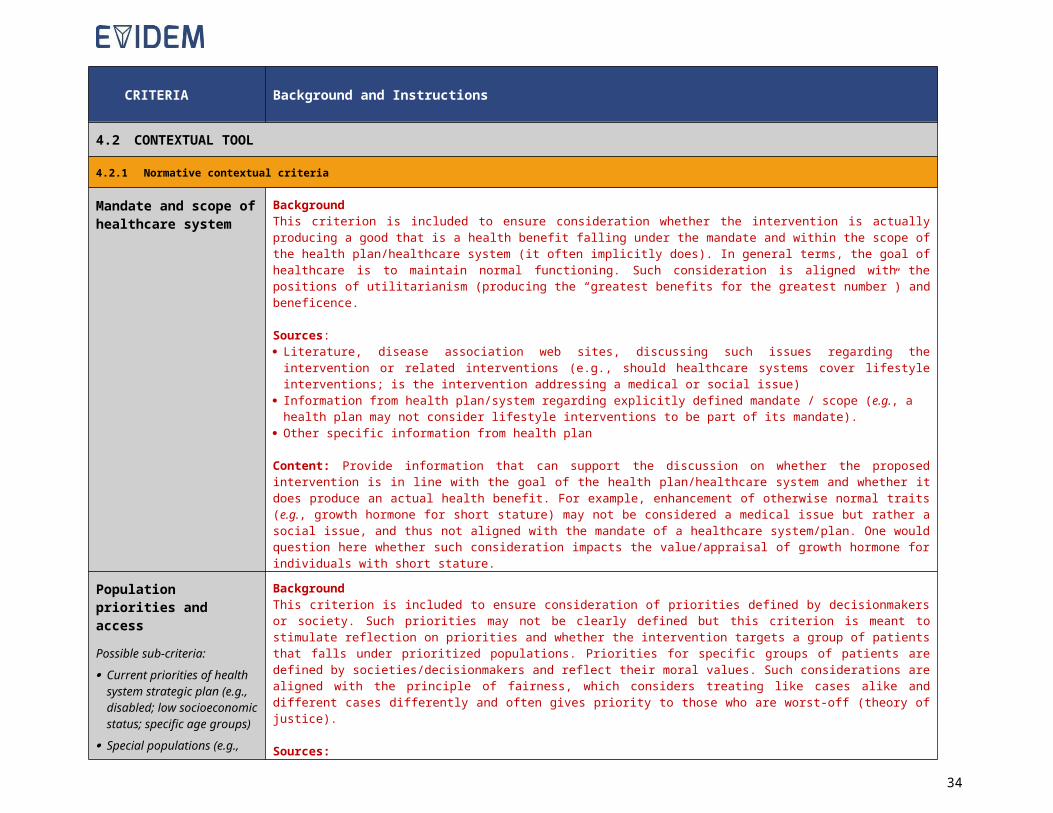
Study Design Population Intervention Outcomes Main findings
Name or citation,country, CEBM level
Type of study, type of analysis setting,
Patients/disease state, N, attrition (drop out), n & age per cohort, inclusion and/or exclusion criteria
Treatments and dosages, duration, other interventions
Primary, secondary
Comparative table (outcome, intervention, comparators, P-value); data with stats (e.g., SD, IQR)
Example
John et al. 2011
Netherlands
CEBM level: 2(hyperlink)
Critical analysis (hyperlink)
Design: RCT comparing GH treatment versus no treatment (control)
Analyses: per protocol
Setting: 20 Dutch hospital centers
Patient: infants and prepubertal children with PWS
Enrolled: n = 91
Attrition: 2 withdrawal due to adverse events IGF levels increased, spinal surgery, CPAP, psychotic events), 18 excluded from analyses (data not yet available at time of analyses)
Population 1 - Infants,n= 42GH: enrolled: n=20 (age 2.0 years); analyzed: n= 16 yr 1Control: enrolled: n=22 (age 1.3 years); analyzed: n= 15 yr 1
Population 2: Prepubertal children,n= 49GH: enrolled: n=25 (age 6.8 years)analyzed: n= 21 (yr 1), n= 20 (yr 2)Control: enrolled: n=22 (age 5.9 years)analyzed: n= 21 (yr 1), n= 20 (yr 2)
Inclusion/exclusion criteria:
GH; 1 mg/m2/day s.c.
Control: no treatment
Treatment durationGroup 1: 1 year (after yr1, infants were offered a year of GH treatment – not reported here as no control group)
Group 2: 2 years
Other interventions:
PrimaryLean body mass (DEXA Lunar Prodigy);% fat (DEXA lunar Prodigy)Head circumference (not reported here);
Secondary:Etc.
InfantsOutcome(median [IQR]) GH Control Pa
Height SDS
Baseline -2.3 (-2.8 - -0.7)
-2.1 (-3.2 - -1.0)
Year 1 -1.0 (-1.9 – 0.1)
-1.8 (-3.5 - -1.4) <0.001
etcaChange from baseline vs control
Prebubertal childrenOutcome(median (IQR) GH Control P
Fasting LDL (mmol/L)BaselineYear 1Year 1etc
34

7 QUALITY ASSESSMENT TOOLS
7.1 Epidemiological data
7.1.1 Tool for assessing the quality of single epidemiological study
Epidemiological dataInstructions for assessment of quality of evidence
o Perform a critical analysis of study(ies) to comment on all dimensions below, provide a critical overview and a quality grade
o Circulate to reviewer and to an expert for validation of content and to reach a consensus on critical overview and quality grade
Study:Disease:Setting:
Questions Critical overview Quality grade
Overall assessment of epidemiological data
Is the study question relevant (setting, condition of interest, outcome measures)?
Is the design appropriate (sample type and size, data sources and measurements, analyses, statistics)?See dimensions below
1 Low2 Moderate3 High4 Excellent
Dimension Questions Comment
1 Study population
Is the study population (sample) representative of the target population (usually the general population) for which prevalence or incidence estimates are sought?
Were the sampling method (e.g., random sampling) and the sampling frame (e.g., registry, insurance claims database) to select the study population valid? Were valid methods used to assess and address sampling bias?
Are the items above fully reported?
2 Setting and period of data collection
Are the setting, including locations, clinical setting and period of data collection, reported? Are they relevant and valid?
3 Condition of interest
Is the condition, for which prevalence or incidence estimates are reported, clearly defined, including case definition, diagnostic criteria and codes, disease stage, age of onset, duration, frequency of symptoms, comorbidities?
Is the condition, for which prevalence or incidence estimates are reported (as defined above), relevant and valid? Does it correspond to the indication in which the intervention is envisioned to be used?
4 Outcome measures
Are the reported outcome measures (e.g., prevalence at birth, point prevalence, incidence density, cumulative incidence) clearly defined? Are they relevant with respect to the condition of interest?
35
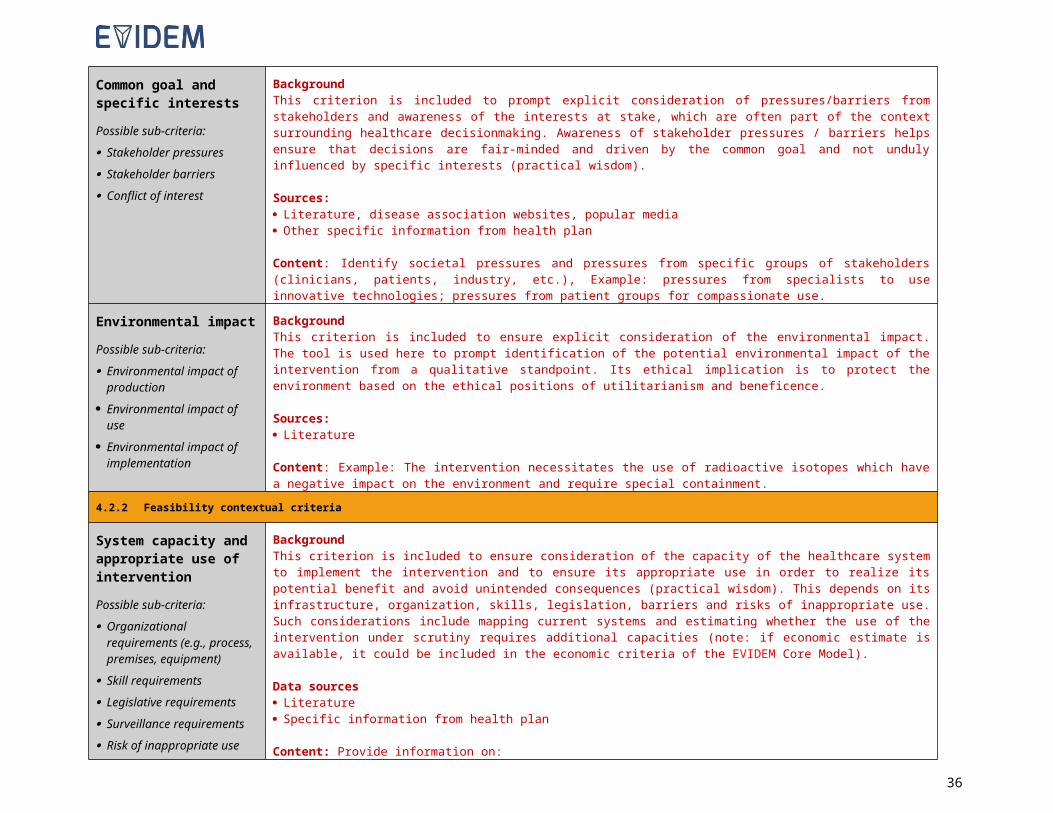
5 Data sources/ measurements
Are the methods used to establish the presence/absence of the condition fully reported? Are these methods valid (e.g., validity of diagnostic test, frequency of examination [for incidence studies])?
Are the sources used to establish the occurrence of the condition (e.g., outcomes measured specifically for the study, medical records, insurance claims databases, registries, self-report) reported? Are they valid? (All diagnosable cases in study sample identified? Any misclassification prevented?)
6 Study sample size Was the study sample size sufficient to arrive at reliable epidemiological estimates, including estimates for population subgroups?
7 AnalysesAre the analyses performed clearly described? Are the analyses appropriate and comprehensive with sound and relevant statistics (e.g., missing data; control of confounding; population subgroup analyses)?
8 Conclusion Are the conclusions supported by the results?
7.1.2 Overall assessment tool for epidemiological studies
SUMMARYEpidemiological studies
Disease:Setting:
Series of studieso List individual studies included; a detailed assessment using
instrument above should be available for each study prior to summarizing for the series of studies for a given type of evidence
Type of evidence Questions Critical overview Quality grade
Epidemiological data
How relevant is the research program with regard to epidemiological data? Are conclusions valid across the range of studies (conclusions across studies consistent or conflicting)?Are individual trials relevant and valid? COMPLETE THE INSTRUMENT ABOVE FOR EACH INDIVIDUAL STUDY
1 Low2 Moderate3 High4 Excellent
36
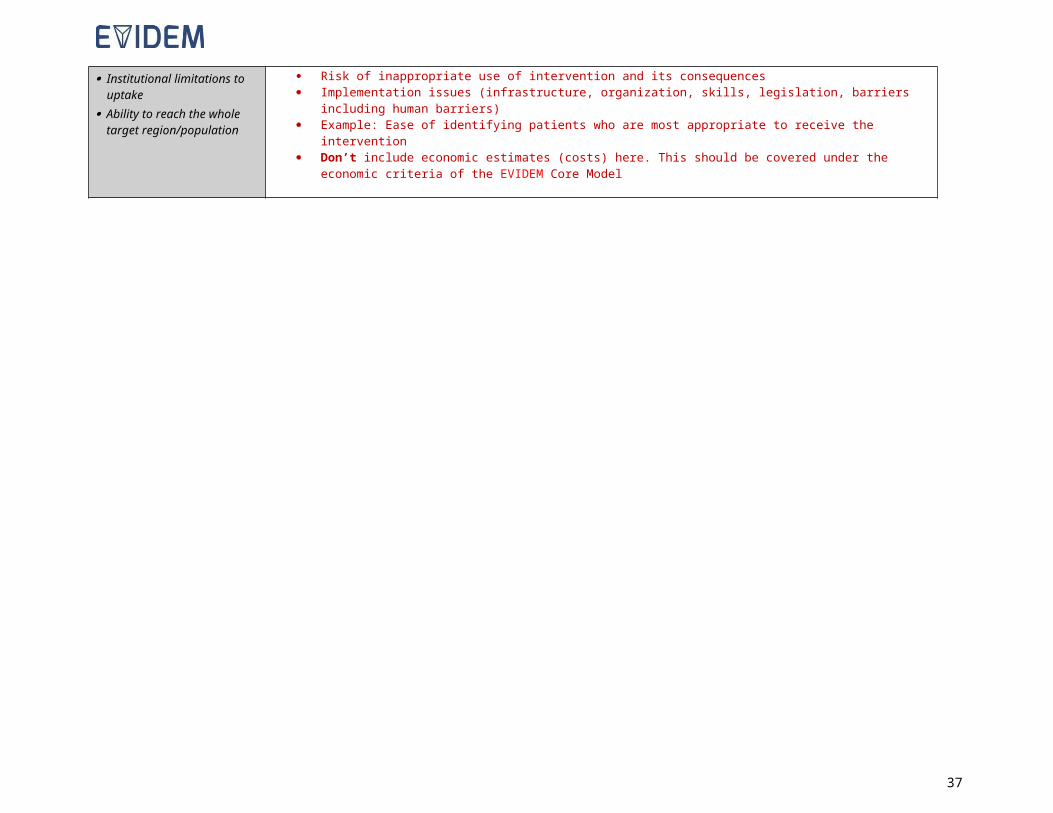
7.2 Efficacy, effectiveness and patient-reported outcomes data
7.2.1 Tool for assessing the quality of a single interventional study
INTERVENTIONAL STUDY Efficacy, effectiveness, safety, and patient-reported outcomes dataInstructions for assessment of quality of evidence
o Perform a critical analysis of study(ies) to comment on all dimensions below, provide a critical overview and a quality grade
o Circulate to reviewer and to an expert for validation of content and to reach a consensus on critical overview and quality grade
Study:Disease:Intervention:Setting:
Questions Critical overview Quality grade
Overall assessment of efficacy / effectiveness, safety and patient-reported outcomes data
Is the study question relevant (choice of comparator, time horizon, patient population, and outcome measures)?
Is the design appropriate with a low risk of bias (setting & design, sample size, patient allocation, analyses, statistics)?See dimensions below
1 Low2 Moderate3 High4 Excellent
Dimension Questions Comment
1 Target population
Are population characteristics fully reported? Is the setting clearly described?
Is the target population relevant (age, gender, disease stage, comorbidities, inclusion criteria/exclusion criteria, setting, etc.)? Does it correspond to the actual population in which the intervention is envisioned to be used?
2 Intervention & comparators
Is the intervention in agreement with expected use? Does the choice of comparators reflect standard of care?
3 Outcome measures
Are all outcomes measures well defined (efficacy, safety and PRO)? Are the selected outcome measures (efficacy, safety and PRO) relevant? Are rationales for outcomes selection reported? Are they valid?
Are the instruments/methods/units used to measure outcomes reported? Are the instruments/methods/units used to measure outcomes (efficacy, safety, PRO) valid?
37
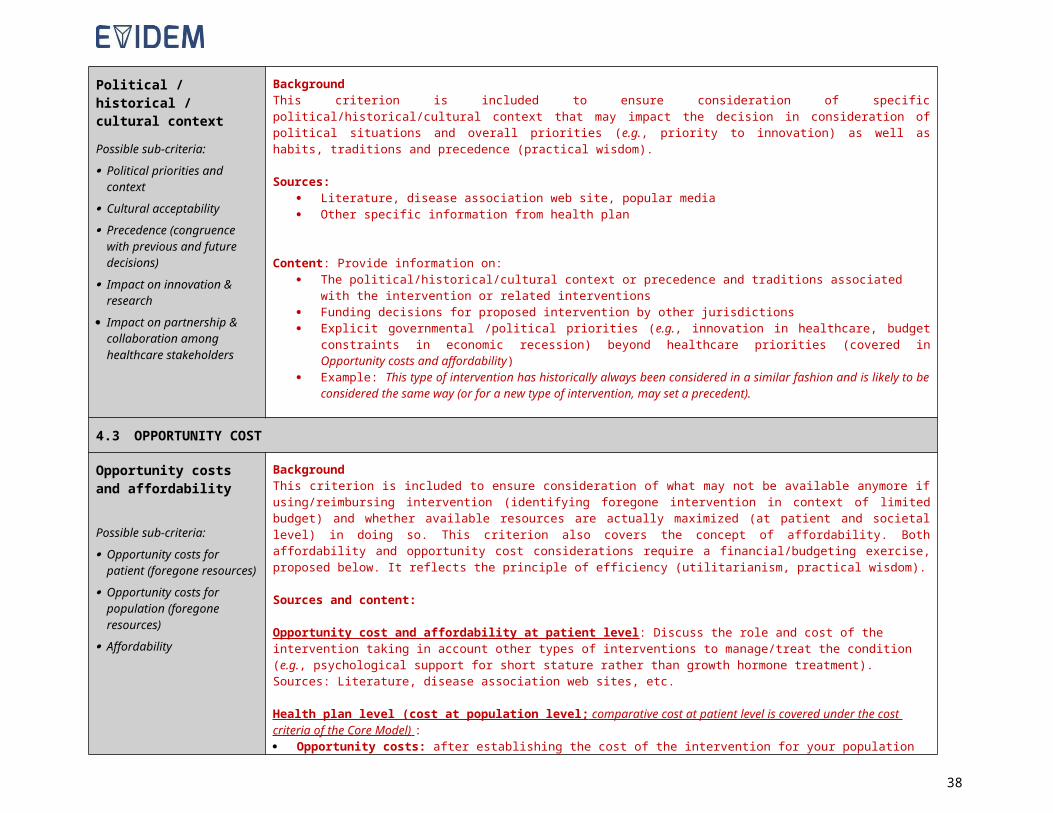
4 Study design
Was the sample size appropriate?
Is the design fully detailed? Is the design appropriate? For RCTs, this includes: randomization; patient allocation concealment; blinding as appropriate; completeness of follow-up; avoidance of carry-over effects.
Were the groups similar at the outset of the study in terms of prognostic factors (e.g., severity of disease)?
5 Adverse events
Are methods for monitoring the occurrence of adverse events and assumptions with regard to which adverse events are related to the intervention(s) relevant and valid in light of previous experience with similar interventions/populations?
Are all relevant adverse events reported (deaths, serious, common, discontinuations), both treatment-related and all-cause?
6 Time horizonIs time horizon long enough to capture all meaningful differences in key outcomes between the intervention and comparators? (e.g., Was the study stopped prematurely because of observed benefits or harms?)
7 AnalysesAre the analyses clearly described?
Are the analyses appropriate and comprehensive with sound and relevant statistics (e.g., intention-to-treat; missing data; control of confounding; subgroup analyses)?
8Results (precision and strength of effect)
Are results clearly reported, including patient disposition (population flow)?
Are differences observed meaningful (clinically and statistically)? Is there evidence of a dose-response relationship?
9 Conclusion Are the conclusions supported by the results?
38
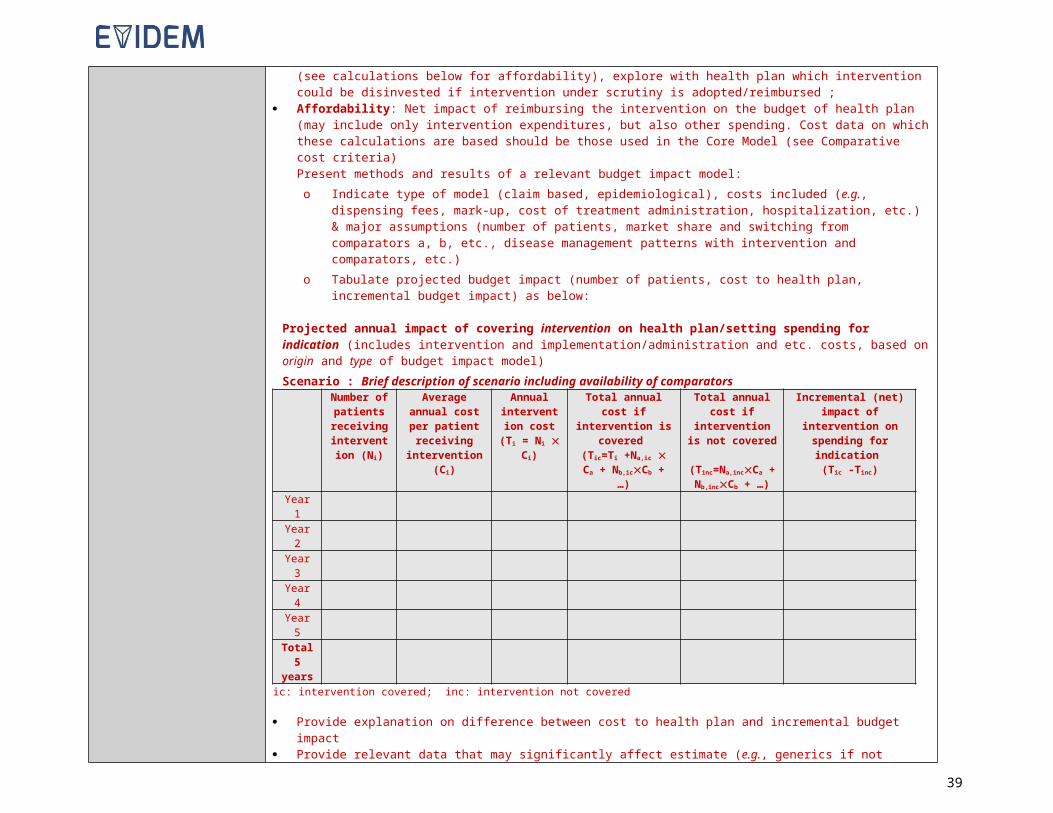
7.2.2 Tool for assessing the quality of a single observational study
OBERVATIONAL STUDY: Efficacy, effectiveness, safety, and patient-reported outcomes dataInstructions for assessment of quality of evidence
o Perform a critical analysis of study(ies) to comment on all dimensions below, provide a critical overview and a quality grade
o Circulate to reviewer and to an expert for validation of content and to reach a consensus on critical overview and quality grade
Study:Disease:Intervention:Setting:
Questions Critical overview Quality grade
Overall assessment of efficacy / effectiveness, safety and patient-reported outcomes data
Is the study question relevant (choice of comparator, time horizon, patient population, and outcome measures)?
Is the design appropriate with a low risk of bias (setting & design, sample size, patient allocation, analyses, statistics)?See dimensions below
1 Low2 Moderate3 High4 Excellent
Dimension Questions Comment
1 Population
Are the population characteristics fully reported? Is the setting clearly described?
Is the study population relevant (age, gender, disease stage, comorbidities, inclusion criteria/exclusion criteria, setting, etc.)? Does it correspond to the actual population in which the intervention is envisioned to be used?
2 Exposures Are the exposures investigated relevant with respect to the intervention being assessed, in terms of type, dose and duration?
3 Outcome measures
Are all outcomes measures well defined (efficacy, safety and PRO)?
Are the selected outcome measures (efficacy, safety and PRO) relevant?
Are assumptions for outcomes selection reported? Are rationales for outcome selection valid?
Are the instruments/methods/units used to measure outcomes reported? Are the instruments/methods/units used to measure outcomes (e.g., database analysis, patient interviews, surveys, etc.) valid?
39

4 Study design
Was the sample size appropriate?
Is the design fully detailed? Was the design appropriate? This includes: avoidance of carry-over effects; completeness of follow-up; appropriate matching algorithm (others?). Were the groups similar (i.e., well matched) in terms of prognostic factors (e.g., severity of disease)?
5 Time horizon
Is the period of data collection clearly described?
For cohort studies, was the time horizon adequate to capture all meaningful differences in key outcomes between the exposed and un-exposed? For cross-sectional and case-control studies, was the study carried out recently?
6 Analyses
Are the analyses clearly described?
Are the analyses appropriate and comprehensive with sound and relevant statistics (e.g., adherence to intention-to-treat principle; handling of missing data; control of confounding; subgroup analyses)?
7Results (precision and strength of effect)
Are results clearly reported, including patient disposition (population flow)?
Are differences observed meaningful (clinically and statistically)? Is there evidence of a dose-response relationship?
8 Conclusion Are the conclusions supported by the results?
40

7.2.3 Tool for assessing the quality of an intervention outcomes modelling study
INTERVENTION OUTCOMES MODELING STUDY: Efficacy, effectiveness, safety, and patient-reported outcomes data
Instructions for assessment of quality of evidenceo Perform a critical analysis of study(ies) to comment on all dimensions below, provide a critical overview and a quality grade
o Circulate to reviewer and to an expert for validation of content and to reach a consensus on critical overview and quality grade
Disease:Intervention:Setting:
Study:
Questions Critical overview Quality grade
Overall assessment of outcomes models
Is the study question relevant (choice of comparator, time horizon, patient population, outcomes)?
Is the design appropriate (i.e., how close to real disease progression, strength of assumptions, sensitivity analyses, quality of sources [clinical and natural history])?See dimensions below
1 Low2 Moderate3 High4 Excellent
Dimension Questions Comment
1 Target population
Is the target population fully defined?
Is the target population relevant (age, gender, disease stage, co-morbidities, etc.)? Is it comparable to the trial/study population in which efficacy/effectiveness data was obtained? Does it correspond to the actual population in which the treatment is envisioned to be used?
2 Intervention and setting
Are the interventions (comparators) fully described? Is the setting reported?
Are assumptions/design regarding interventions (dose & duration, mode of delivery) & setting (hospital/community, country, etc.) reported? Are these valid with respect to the indication/proposed coverage & clinical context?
3 Comparators Does the choice of comparators reflect current practice?
4 Outcome measuresAre the selected outcome measures (efficacy, safety and patient reported outcomes [PRO]) relevant? Are the primary efficacy/effectiveness measures used, and major side effects included? Are instruments to estimate PROs valid? Are assumptions for outcomes selection valid?
5 Time horizonIs the time horizon reported? Is the time horizon long enough to capture all meaningful differences in outcomes between the intervention and comparators?
Are all assumptions made reported? Are they valid?
41
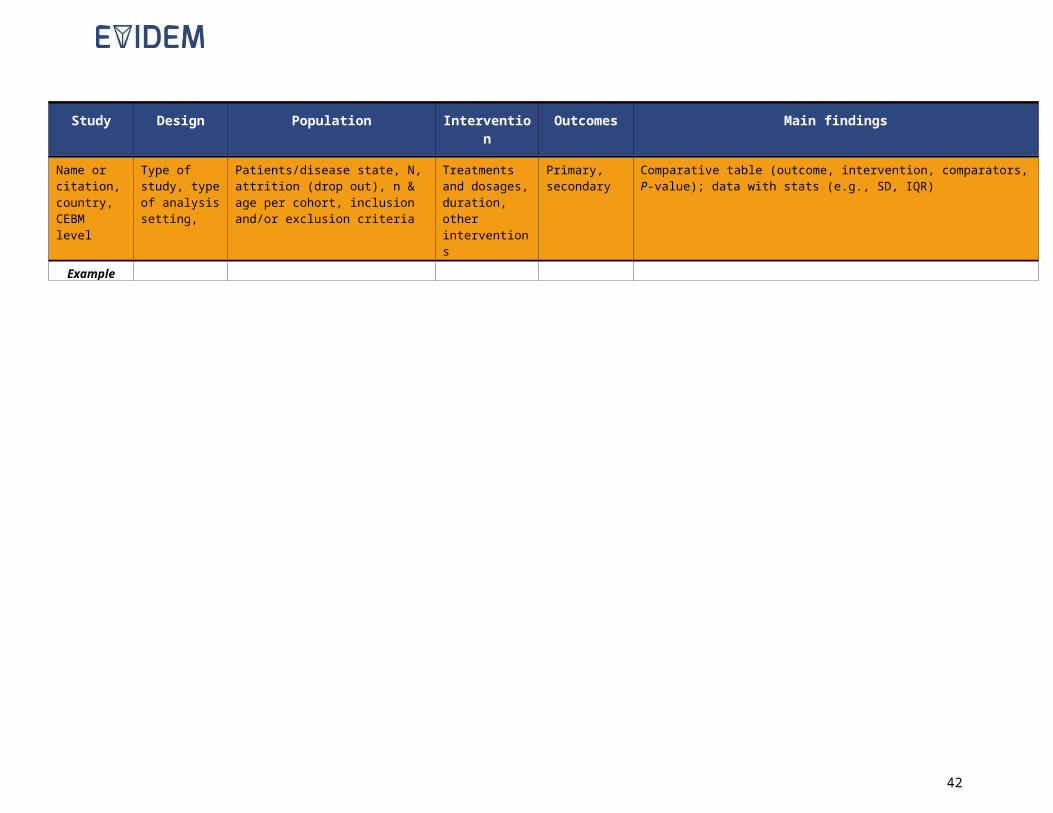
6 Clinical event pathway
Is the event pathway fully reported? Does the model reflect a realistic event pathway according to current knowledge?
7 Parameters
Are all parameters used in the model/study (effectiveness data, adverse event probabilities, health states, PROs) reported?
Are the sources and methods used to estimate the parameters reported (effectiveness data, adverse event probabilities, health states, PROs)? Are they solid?
Are all assumptions made reported? Are they valid?
8 Sensitivity analyses Do sensitivity analyses cover the most critical parameters within a valid range?
9 Results Are disaggregated results reported? Are sensitivity analyses fully reported?
10 Conclusion Are conclusions supported by results?
7.2.4 Overall assessment tool for efficacy, effectiveness and patient-reported outcomes studies
SUMMARYEfficacy, effectiveness and patient-reported outcomes studies (interventional, observational,
modeling)Disease:Intervention:Setting:
Series of studieso List individual studies included; a detailed assessment using
instruments above should be available for each study prior to summarizing for the series of studies for a given type of evidence
Type of evidence Questions Critical overview Quality grade
Overall assessment of efficacy / effectiveness, safety and patient-reported outcomes data
How relevant is the research program with regard to interventional and observational data? Are conclusions valid over the range of studies (conclusions across studies consistent or conflicting)?Are individual trials relevant and valid? COMPLETE INSTRUMENT ABOVE FOR EACH INDIVIDUAL STUDY
1 Low2 Moderate3 High4 Excellent
42

7.3 Economic evaluations data
7.3.1 Tool for assessing the quality of cost-consequence modelling studies
Economic modelling study – Cost-consequenceInstructions for assessment of quality of evidence
o Perform a critical analysis of study(ies) to comment on all dimensions below, provide a critical overview and a quality grade
o Circulate to reviewer and to an expert for validation of content and to reach a consensus on critical overview and quality grade
Disease:Intervention:Setting:
Study:
Questions Critical overview Quality grade
Overall assessment of economic models
Is the study question relevant (choice of comparator, time horizon, patient population, types of costs included)?
Is the design appropriate (i.e., how close to real disease progression, strength of assumptions, intervention use projections [if performed], sensitivity analyses, quality of sources [unit costs, resource use])?See dimensions below
1 Low2 Moderate3 High4 Excellent
Dimension Questions Comment
1 Target population
Is the target population fully defined?
Is the target population relevant (age, gender, disease stage, co-morbidities, etc.)? Is it comparable to the trial/study population in which efficacy/effectiveness data was obtained? Does it correspond to the actual population in which the treatment is envisioned to be used?
2 Intervention and setting
Are the interventions (comparators) fully described? Is the setting reported?
Are assumptions/design regarding interventions (dose & duration, mode of delivery) & setting (hospital/community, country, etc.) reported? Are they valid with respect to the indication/proposed coverage & clinical context?
3 Comparators Does the choice of comparators reflect current practice? For drugs, are generics included?
4 Perspective and costs included
Is the perspective of the analysis reported? Are all costs relevant to the chosen perspective included (e.g., cost of intervention [for drugs, dispensing fees], healthcare professional visits & procedures, hospitalization, long-term care, lab tests)? Are assumptions for cost inclusion/ exclusion valid?
43

5 Time horizonIs the time horizon reported? Is the time horizon long enough to capture all meaningful differences in costs between the intervention and comparators? Are assumptions used valid?
6 Clinical event pathway
Is the event pathway fully reported? Does the model reflect a realistic event pathway according to current knowledge?
7 Parameters estimates
Are all parameters used in the model/study (resource use, unit costs, clinical event probabilities) reported?
Are the sources and methods used to estimate the model parameters valid (resource use, unit costs, claims, number of patients, clinical event probabilities)? Are assumptions and sources used valid?
8 Discount rate Is the recommended discount rate applied?
9 Sensitivity analyses Do sensitivity analyses cover the most critical parameters within a valid range?
10 Results Are disaggregated results reported? Are sensitivity analyses fully reported?
11 Conclusion Are conclusions supported by results?
44
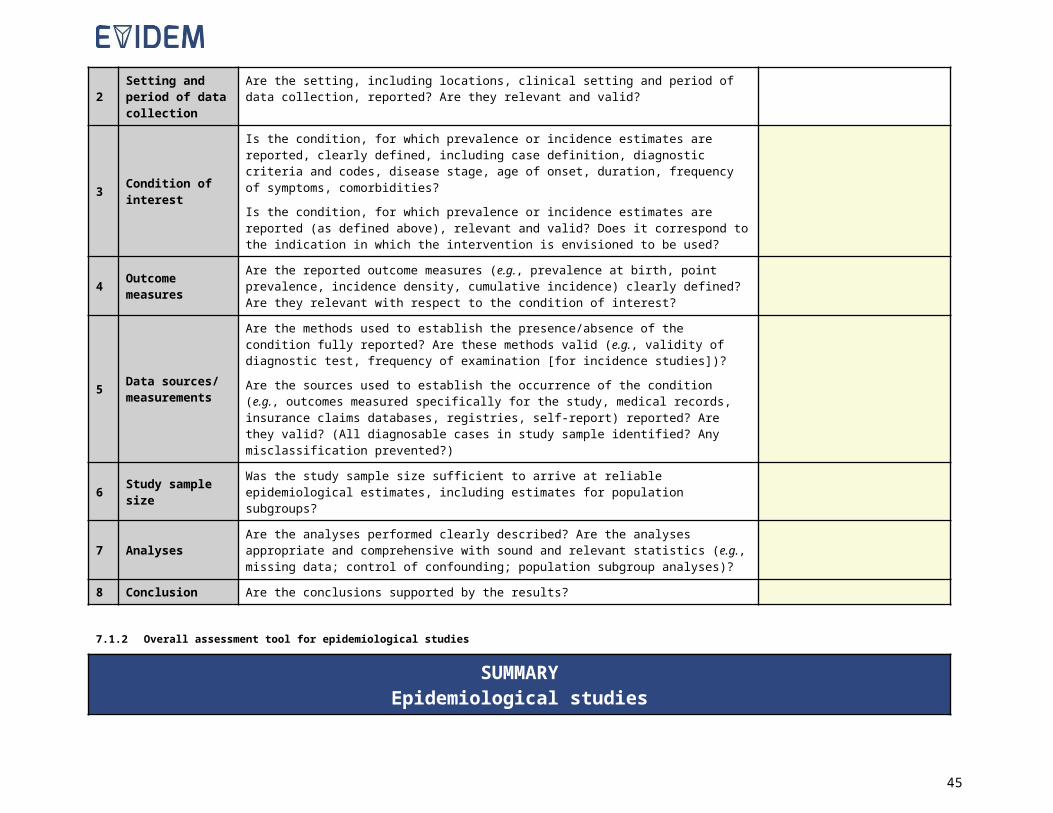
7.3.2 Tool for assessing the quality of cost-effectiveness modelling studies
Economic modelling study – Cost-EffectivenessInstructions for assessment of quality of evidence
o Perform a critical analysis of study(ies) to comment on all dimensions below, provide a critical overview and a quality grade
o Circulate to reviewer and to an expert for validation of content and to reach a consensus on critical overview and quality grade
Disease:Intervention:Setting:
Study:
Questions Critical overview Quality grade
Overall assessment of economic evaluation
Is the study question relevant (choice of comparator, time horizon, patient population, outcome, perspective)?
Is the design appropriate (i.e., how close to real disease progression, costs included, strength of assumptions, sensitivity analyses, quality of sources [clinical, costs, epidemiology, and utilities])?See dimensions below
1 Low2 Moderate3 High4 Excellent
Dimension Questions Comment
1 Target population
Is the target population fully defined?
Is the target population relevant (age, gender, disease stage, co-morbidities, etc.)? Is it comparable to the trial/study population in which efficacy/effectiveness data was obtained? Does it correspond to the actual population in which the treatment is envisioned to be used?
2 Intervention and setting
Are the interventions (comparators) fully described? Is the setting reported?
Are assumptions/design regarding interventions (dose & duration, mode of delivery) & setting (hospital/community, country, etc.) reported? Are they valid with respect to the indication/proposed coverage & clinical context?
3 Comparators Does the choice of comparators reflect current practice? For drugs, are generics included?
4 Perspective and costs included
Is the perspective of the analysis reported? Are all costs relevant to the chosen perspective included (e.g., cost of intervention [for drugs, dispensing fees], healthcare professional visits & procedures, hospitalization, long-term care, lab tests)? Are assumptions for cost inclusion/ exclusion valid?
5 Time horizonIs the time horizon reported? Is the time horizon long enough to capture all meaningful differences in costs and outcomes between the intervention and comparator? Are assumptions used valid?
45
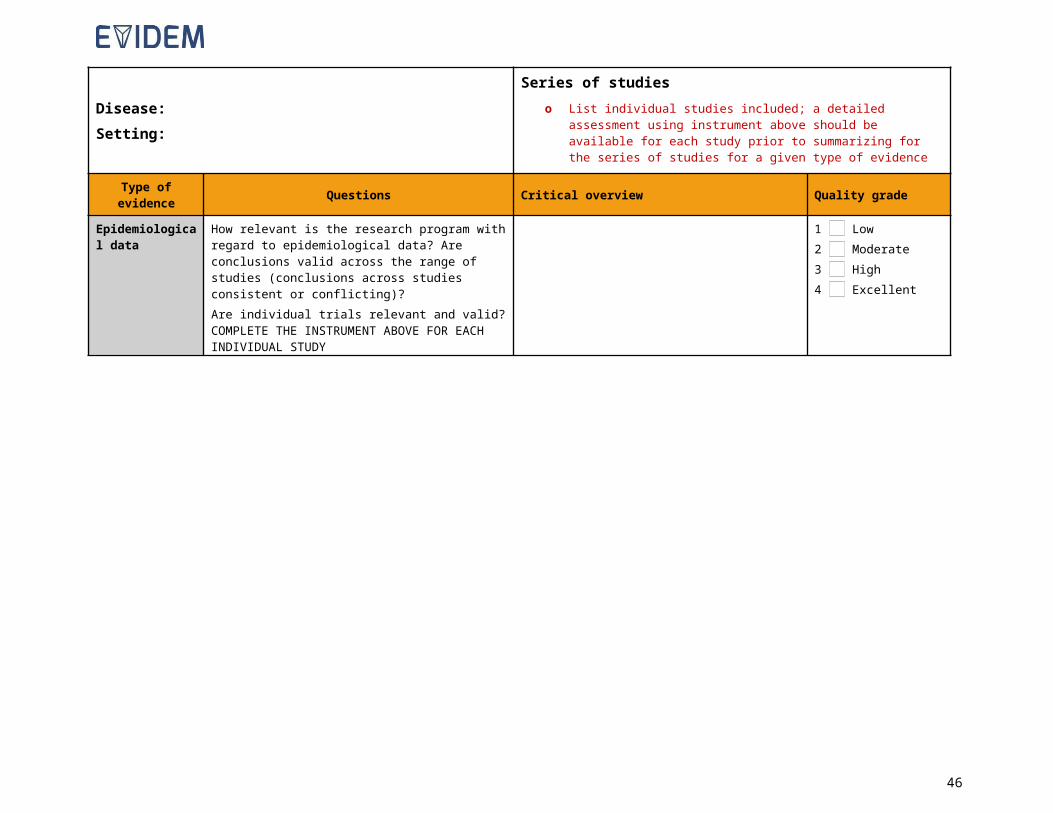
6 Clinical event pathway
Is the event pathway fully reported? Does the model reflect a realistic event pathway according to current knowledge?
7 Parameter estimates
Are all parameters used in the model/study (resource use, unit costs, clinical event probabilities, utilities) reported?
Are the sources and methods used to estimate the model parameters valid (resource use, unit costs, claims, number of patients, clinical event probabilities)? Are assumptions and sources used valid?
8 Outcome measuresAre the selected outcome measures (efficacy, safety and patient-reported outcomes [PRO]) relevant? Are the primary efficacy/effectiveness measures used, and major side effects included? Are instruments to estimate PRO valid? Are assumptions for outcomes selection valid?
9 Discount rate Is the recommended discount rate applied?
10 Sensitivity analyses Do sensitivity analyses cover the most critical parameters within a valid range?
11 Results Are disaggregated results reported? Are sensitivity analyses fully reported?
12 Conclusion Are conclusions supported by results?
46

7.3.3 Tool for assessing the quality of budget impact model studies
Budget impact modelInstructions for assessment of quality of evidence
o Perform a critical analysis of study(ies) to comment on all dimensions below, provide a critical overview and a quality grade
o Circulate to reviewer and to an expert for validation of content and to reach a consensus on critical overview and quality grade
Disease:Intervention:Setting:
Study:
Questions Critical overview Quality grade
Overall assessment of budget impact model
Is the study question relevant (perspective, choice of comparators, time horizon, and patient population)?
Is the design appropriate (how close to real market evolution, costs included [dispensing fees and wholesaler mark-up], strength of assumptions, sensitivity analyses, quality of sources [clinical, costs, epidemiology])?Are generics included?See dimensions below
1 Low2 Moderate3 High4 Excellent
Dimension Question Comment
1 Target population Does the target population correspond to the expected use/target coverage (age, disease stage, comorbidities, first line, second line after failure with XX, etc.)?
2 Intervention and setting
Are assumptions/design regarding interventions (treatment dose, treatment duration, mode of delivery) valid with respect to indication/proposed coverage & clinical context?
3 Model & projectionsIs the model structure valid? Are rationales for projections (new patients, switching between interventions, market movement & future introduction of other interventions) based on evidence? Is it realistic according to current knowledge? Is time horizon long enough?
4 Input data Are input data, their sources and methods for estimates valid (claims, patients, epidemiology, unit costs for intervention, clinical data)? For drugs, are generics included?
5 Cost of intervention Are all relevant costs of the intervention considered (e.g., for drugs, dispensing fees)? Are assumptions for cost estimates valid?
6 Sensitivity analyses Do sensitivity analyses cover the most critical parameters within a valid range?
7 Conclusion Are conclusions supported by results?
47

8 Transparency of reporting
Are the target population, event pathway and interventions fully reported? Is the design/model fully described? Are all the parameters used in the model/study and their sources/methods to obtain reported? Are all assumptions listed? Is the design fully detailed? Are the analyses clearly described and disaggregated results and sensitivity analyses fully reported?
48