overall index - instituto nacional de estadistica ... · pdf file15 february 2017 cpi –...
TRANSCRIPT

15 February 2017
CPI – JANUARY 2017 (1/15)
Consumer Price Index (CPI). Base 2016 January 2017
Overall index Monthly variation Accumulated variation Annual variation January -0.5 -0.5 3.0
Main results
− The annual variation of the CPI for the month of January stands at 3.0%, almost one and a half percentage point above that registered in the previous month.
− The annual rate of core inflation increases one tenth, reaching 1.1%.
− The monthly variation of the overall index is -0.5%.
− The annual rate of the Harmonised Index of Consumer Prices (HICP) stands at 2.9%, increasing one and a half percentage point as compared with December.
− The INE is today publishing the first Consumer Price Index in base 2016.
Annual evolution of consumer prices
The annual variation rate of the overall Consumer Price Index (CPI) in the month of January was 3,0%, almost one and a half percentage point above that registered in the previous month and the greatest since October 2012.
The groups with the greatest positive influence in this annual rate increase were:
• Housing, which registered a variation rate of 7.4%, more than six and a half percentage points above that of the previous month, mainly due to the increase in the prices of electricity, as compared to the decrease they experienced in 2016.
Another reason for this variation–though to a lesser extent–was the increase in the prices of heating gas oil and gas, which decreased in 2016.

CPI – JANUARY 2017 (2/15)
• Transport, with a variation of 7.6%, almost three points above that of December, caused almost entirely by the increase in the prices of fuels this month, compared with the decrease registered in January 2016.
On the other hand, the groups with the most negative influence were:
• Other goods and services, which variation rate decreased five tenths to 1.4%, due to the behaviour of Insurance.
• Communications, that registered an annual rate of 2.6%, seven tenths lower than that of the previous month, mainly due to the decrease in the prices of Telephone services, which increased in 2016.
0.040
0.026
0.132
0.810
-0.007
0.031
0.417
-0.023
0.006
0.000
-0.022
-0.050
1. Food and non-alcoholic beverages
2. Alcoholic beverages and tobacco
3. Clothing and footwear
4. Housing
5. Furnishing and household equipment
6. Health
7. Transport
8. Communications
9. Leisure and culture
10. Education
11. Hotels, cafes and restaurants
12. Other goods and services
DIFERENCE IN THE ANNUAL CHANGE OF THE OVERALL CPI 1.4
Contribution of the groups to the annual change of the CPI
The annual variation of core inflation (overall index excluding unprocessed food and energy products) increased one tenth up to 1.1%, standing almost two points below the overall CPI rate.

CPI – JANUARY 2017 (3/15)
-0.3
-0.8 -0.8 -1.1 -1.0 -0.8-0.6
-0.10.2
0.7 0.7
1.6
3.0
0.9 1.0 1.1
0.7 0.7 0.6 0.70.9 0.8 0.8 0.8
1.0 1.1
-1.5
-0.5
0.5
1.5
2.5
2016
Jan
uary
Febr
uary
Mar
ch
April
May
June July
Augu
st
Sept
embe
r
Oct
ober
Nov
embe
r
Dec
embe
r
2017
Jan
uary
Annual evolution of the CPI Overall and core
Overall Core
Monthly evolution of consumer prices
In January, the monthly variation rate of the overall CPI was -0.5%.
The groups with the greatest negative contribution to the overall index were:
• Clothing and footwear, with a variation rate of -15.3%, which includes the effect of the winter sales. Its contribution to the overall CPI was -1.032.
• Leisure and culture, with a variation of -1.5% and a contribution of -0.129, mainly due to the decrease in the prices of tourist packages.
• Furniture and household equipment, which registered a variation rate of -0.9%, due to the decrease in the prices of most of its components. The contribution of this group to the overall CPI was -0.050.
In turn, the groups with greater positive contribution to the overall index were:
• Housing, with a variation rate of 2.8%, mainly due to the increase in the prices of electricity. Its contribution to the overall CPI was 0.377.
• Food and non-alcoholic beverages, whose 0.7% rate contributed by 0.143. Worth noting in this behaviour was the increase in the prices of fresh vegetables and fish and seafood.
• Transport, which registered a variation rate of 1.0% and a contribution of 0.140, due to the increase in the prices of fuels.

CPI – JANUARY 2017 (4/15)
-1.9
-0.4
0.6 0.7 0.5 0.5
-0.7
0.1 0.0
1.1
0.4 0.6
-0.5
-2.5-2.0-1.5-1.0-0.50.00.51.01.5
2016
Jan
uary
Febr
uary
Mar
ch
April
May
June July
Augu
st
Sept
embe
r
Oct
ober
Nov
embe
r
Dec
embe
r
2017
Jan
uary
Monthly evolution of the CPIOverall index
A more detailed analysis showed the divisions that had the greatest contribution to the monthly rate of the CPI during the month of January.
Activities with the greatest negative contribution to the monthly rate of the CPI Monthly rate
(%) Contribution
Food products Fruit -0.3 -0.005
Other divisions Clothes -16.8 -0.818 Footwear -11.3 -0.187 Tourist packages -6.4 -0.102 Accommodation services -4.5 -0.044 Other clothing and haberdashery articles -19.3 -0.027 Household textiles -4.9 -0.026
Divisions with the greatest positive contribution to the monthly change of the CPI Monthly rate
(%) Contribution
Food products
Fresh vegetables 4.0 0.076 Fish and seafood 2.9 0.070
Other divisions Electricity 8.8 0.309 Fuels and lubricants for personal vehicles 2.4 0.140 Gas 3.0 0.045 Tobacco 1.2 0.027

CPI – JANUARY 2017 (5/15)
Results by Autonomous Community. Annual variation rates
The annual rate of the CPI increased in all the Autonomous Communities. The highest increases were registered in Castilla y León, with an increment of 1.8 points, and in Comunitat Valenciana and Castilla–La Mancha, with an increase of 1.7 points in both.
In turn, Comunidad Foral de Navarra, Canarias and Cataluña registered the lowest increases, of 1.1, 1.2 and 1.2 points respectively.
3.4
3.3
3.2
3.1
3.1
3.1
3.0
3.0
3.0
3.0
3.0
2.9
2.9
2.9
2.9
2.9
2.8
2.7
2.5
2.5
1.6
1.6
1.6
1.5
1.9
1.5
1.6
1.6
1.3
1.6
1.6
1.6
1.6
1.5
1.8
1.5
1.4
1.4
1.3
1.1
Castilla y León
Castilla-La Mancha
Galicia
Cantabria
Cataluña
La Rioja
Andalucía
Asturias, Principado de
Comunitat Valenciana
Murcia, Región de
NACIONAL
Aragón
Balears, IIles
Extremadura
Navarra, Comunidad Foral de
País Vasco
Melilla
Madrid, Comunidad de
Canarias
Ceuta
Annual CPI ratesAutonomous Cities and Communities
January 2017 December 2016

CPI – JANUARY 2017 (6/15)
Harmonised Index of Consumer Prices (HICP)
In January, the annual variation rate of the HICP stood at 2.9%, one and half percentage point above that registered in the previous month.
The monthly change of the HICP was -1.0%.
-0.4
-1.0 -1.0 -1.2 -1.1 -0.9 -0.7-0.3
0.00.5
1.4
2.9
0.3-0.2 0.0 -0.2 -0.1 0.1 0.2 0.2 0.4 0.5 0.6
1.1
1.8
-2.0
-1.0
0.0
1.0
2.0
3.0
4.0
2016
Jan
uary
Febr
uary
Mar
ch
April
May
June July
Augu
st
Sept
embe
r
Oct
ober
Nov
embe
r
Dec
embe
r
2017
Jan
uary
Annual evolution of the HICP, base 2005Overall index for Spain and Monetary Union1
Spain Monetary Union
1 The latest data from the Monetary Union refers to the flash estimate
Consumer Price Index at Constant Taxes
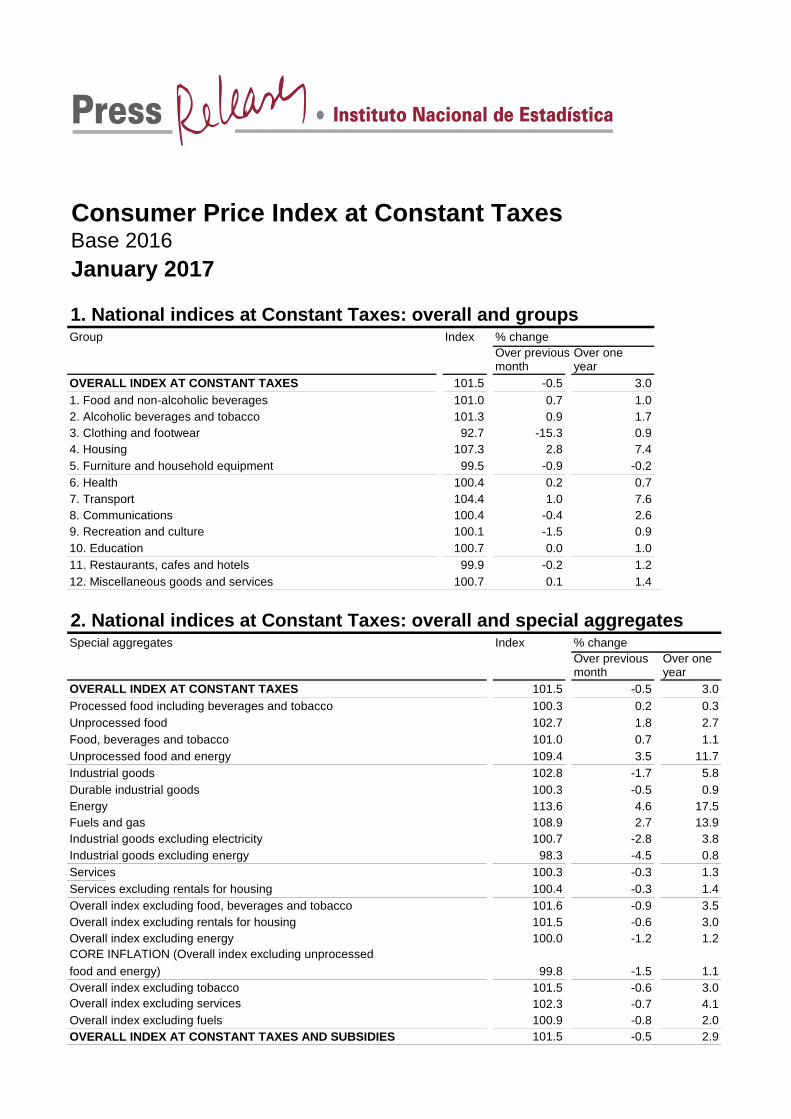
In January, the annual variation rate of the Consumer Price Index at Constant Taxes (CPI-CT) stood at 3.0%, remaining the same as that of the overall index.
The monthly change of the CPI-CT was -0.5%.
In turn, the CPI-CT registered an annual change of 2.9%, remaining the same as that of the HICP.
The monthly variation rate of the CPI-CT was -1.0%.

CPI – JANUARY 2017 (7/15)
Informative annex
Main features of the CPI base 2016
The INE is today publishing the first Consumer Price Index in base 2016. With the implementation of the new base, the objective is to improve the representative nature of this indicator via changes in the composition of the shopping basket and updating the weighting structure.
In addition, the CPI base 2016 incorporates the new European consumption classification, known as ECOICOP (European Classification of Individual Consumption by Purpose). This classification provides a further breakdown of the expenditure sections in which the information normally disseminated is structured. For example, the number of subclasses (aggregations of good and services at the highest level of detail) which was 126 in the base 2011 increases to 219 in the new base.
Changes in the shopping basket
The selection of the products representative of the household consumption comprising the CPI shopping basket is carried out based on the importance of the expenditure made on each one of them. The composition of the basket is reviewed annually and updated to include new products whenever their consumption begins to be significant and to exclude those that are no longer purchased by households.
The most significant changes in the configuration of the shopping basket base 2016 are the incorporation of music and video on-line services, gambling or the single-serve coffee in the food products. On the other hand, some examples of articles which disappear in the basket are the brandy, the video camera or the recordable DVD, among others.
As a results of these adjustments, the shopping basket of the CPI base 2016 will now have 479 items, as compared with the 489 items for the previous base.
Updating of the weightings
The ongoing adaptation of the CPI to changes in consumer behaviour also includes the permanent revision of its weighting structure. Each year, the weight and importance of the large aggregates comprising this indicator are updated, thus maintaining the current nature thereof.
In addition, the complete structure is updated every five years for all levels of disaggregation. Therefore, CPI base 2016 includes a new weighting structure that more precisely represents household consumption patterns.
For this purpose, the Household Budget Survey (HBS) is used as the main source of information, and it is supplemented by information from the National Accounts, the CPI itself and other sources provided by the different sectors.
The following table includes the weight of each of the 12 large groups, and their comparisons with the weights valid until the year 2016.

CPI – JANUARY 2017 (8/15)
Group weightings (so much per hundred)
Group 2016 2017 Variation (%) 01. Food and non-alcoholic beverages 18.74 19.77 5.5 02. Alcoholic beverages and tobacco 2.77 3.02 9.1 03. Clothing and footwear 7.60 6.73 -11.4 04. Housing 12.51 13.30 6.4 05. Furniture and household equipment 6.14 5.88 -4.3 06. Health 3.40 3.96 16.4 07. Transport 15.60 14.67 -5.9 08. Communication 3.44 3.60 4.5 09. Leisure and culture 7.00 8.52 21.8 10. Education 1.59 1.68 5.4 11. Restaurants, cafés and hotels. 11.60 12.12 4.5 12. Other goods and services 9.61 6.75 -29.8 TOTAL 100 100 :
The detailed information regarding the new weightings is available on the INE website (www.ine.es).
Conceptual changes in the consumption area
A new definition in the consumption area has been introduced into the new CPI base 2016, based on the concept of final consumption expenditure of households of the European System of Accounts (ESA). This requires to adjust some of the estimates of the expenditure from the HBS in order to adapt the CPI to these conceptual requirements.
This adaptation affects the weighting of Insurance, where the amount in remuneration received by households is deducted from the gross expenditure from the HBS, and of second-hand cars, whose expenditure shifts from including all transactions to incorporate only those between households and companies.
Treatment of seasonal items
The CPI considers seasonal items to be those goods or services that cease to be available for sale during certain periods throughout the year, and this situation is repeated cyclically. The items to which this definition refers are fresh fruit and fresh vegetables.
A new methodological approach has been incorporated in the new base, which consists in the estimation of prices of goods that are not available in the market. In this way a more precise measurement in the evolution of prices is achieved.
Chained series
The changes introduced in the CPI have caused some of the elements involved in the computation of this indicator to differ from those used for base 2011.
With the aim that the results of the CPI wont be affected by the incorporation of changes in the new base, the INE will elaborate the corresponding chained series, so as to provide continuity to the information that has been published until now.

15 February 2017
Consumer Price Index. Base 2016January 2017
1. National indices: overall and groupsGroup Index % change Contribution
Over previous Over last Over one Over previous Over last month December year month December
OVERALL INDEX 101.5 -0.5 -0.5 3.01. Food and non-alcoholic beverages 101.0 0.7 0.7 1.0 0.143 0.1432. Alcoholic beverages and tobacco 101.3 0.9 0.9 1.7 0.026 0.0263. Clothing and footwear 92.7 -15.3 -15.3 0.9 -1.032 -1.0324. Housing 107.3 2.8 2.8 7.4 0.377 0.3775. Furniture and household equipment 99.5 -0.9 -0.9 -0.2 -0.050 -0.0506. Health 100.4 0.2 0.2 0.7 0.006 0.0067. Transport 104.4 1.0 1.0 7.6 0.140 0.1408. Communications 100.4 -0.4 -0.4 2.6 -0.015 -0.0159. Recreation and culture 100.1 -1.5 -1.5 0.9 -0.129 -0.12910. Education 100.7 0.0 0.0 1.0 0.001 0.00111. Restaurants, cafes and hotels 99.9 -0.2 -0.2 1.2 -0.024 -0.02412. Miscellaneous goods and services 100.7 0.1 0.1 1.4 0.008 0.008
2. National special aggregates indicesSpecial aggregates Index % change
Over previous Over last Over one month December year
Processed food including beverages and tobacco 100.3 0.2 0.2 0.3Unprocessed food 102.7 1.8 1.8 2.7Food, beverages and tobacco 101.0 0.7 0.7 1.1Unprocessed food and energy 109.4 3.5 3.5 11.7Industrial goods 102.8 -1.7 -1.7 5.8Durable industrial goods 100.3 -0.5 -0.5 0.9Energy 113.6 4.6 4.6 17.5Fuels and gas 108.9 2.7 2.7 13.9Industrial goods excluding electricity 100.7 -2.8 -2.8 3.8Industrial goods excluding energy 98.3 -4.5 -4.5 0.8Services 100.3 -0.3 -0.3 1.3Services excluding rentals for housing 100.4 -0.3 -0.3 1.4Overall index excluding food, beverages and tobacco 101.6 -0.9 -0.9 3.5Overall index excluding rentals for housing 101.5 -0.6 -0.6 3.0Overall index excluding energy 100.0 -1.2 -1.2 1.2CORE INFLATION (Overall index excluding unprocessed food and energy) 99.8 -1.5 -1.5 1.1Overall index excluding tobacco 101.5 -0.6 -0.6 3.0Overall index excluding tobacco 102.3 -0.7 -0.7 4.1Overall index excluding fuels 100.9 -0.8 -0.8 2.0
CPI – JANUARY 2017 (7/13)

3. National headings indicesIndex Over previous month Over last December Over one year
% change Contribution % change Contribution % change01. Cereals and by-products 99.7 -0.1 -0.001 -0.1 -0.001 -0.102. Bread 100.0 0.0 0.000 0.0 0.000 0.003. Bovine meat 100.3 0.2 0.002 0.2 0.002 0.004. Sheep meat 102.7 -2.7 -0.006 -2.7 -0.006 0.505. Swine meat 100.5 -0.1 -0.001 -0.1 -0.001 0.306. Poultry meat 100.7 0.7 0.006 0.7 0.006 0.007. Other meats 100.0 -0.2 -0.004 -0.2 -0.004 -0.408. Fresh and frozen fish 108.0 5.6 0.064 5.6 0.064 -0.309. Seafood and processed fish 102.7 0.5 0.006 0.5 0.006 3.910. Eggs 100.5 -0.1 0.000 -0.1 0.000 0.211. Milk 99.3 0.3 0.002 0.3 0.002 -2.212. Milk-based products 99.7 0.0 0.000 0.0 0.000 -0.613. Oils and fats 98.7 0.2 0.001 0.2 0.001 -2.714. Fresh fruit 95.4 -0.3 -0.005 -0.3 -0.005 -0.315. Canned and dried fruit 100.7 0.0 0.000 0.0 0.000 1.816. Fresh vegetables 113.5 7.3 0.074 7.3 0.074 17.917. Processed vegetables 100.8 0.1 0.001 0.1 0.001 2.518. Fresh potatoes and potatoes preparations 102.0 0.3 0.001 0.3 0.001 7.019. Coffee, cocoa and infusions 99.4 -0.1 0.000 -0.1 0.000 -1.320. Sugar 99.0 1.0 0.001 1.0 0.001 -2.821. Other food products 100.0 0.1 0.001 0.1 0.001 0.522. Mineral waters, soft drinks and juices 99.9 0.2 0.002 0.2 0.002 0.423. Alcoholic beverages 99.9 -0.1 -0.001 -0.1 -0.001 0.524. Tobacco 101.9 1.2 0.027 1.2 0.027 2.225. Garments for men 92.7 -17.7 -0.293 -17.7 -0.293 0.626. Garments for women 91.8 -17.2 -0.404 -17.2 -0.404 0.927. Garments for children and babyclothes 90.4 -13.9 -0.121 -13.9 -0.121 0.828. Clothing accesories and repair 94.2 -14.0 -0.027 -14.0 -0.027 0.729. Footwear for men 95.5 -9.7 -0.058 -9.7 -0.058 0.930. Footwear for women 94.8 -11.6 -0.089 -11.6 -0.089 0.831. Footwear for children and infants 88.6 -14.2 -0.041 -14.2 -0.041 -3.532. Repair of footwear 100.2 -0.5 0.000 -0.5 0.000 0.633. Rentals for housing 100.0 0.0 0.001 0.0 0.001 0.134. Heating, electricity and water supply 115.0 5.8 0.374 5.8 0.374 15.035. Maintenance and repair of the dwelling 100.2 0.1 0.003 0.1 0.003 0.636. Furniture and floor coverings 99.6 -1.2 -0.015 -1.2 -0.015 0.437. Household textiles and decorations 97.5 -4.5 -0.026 -4.5 -0.026 -1.638. Household appliances including repair 98.7 -0.4 -0.004 -0.4 -0.004 -2.139. Household utensils and tools 99.4 -0.7 -0.003 -0.7 -0.003 -0.240. Non-durable household goods 99.8 -0.3 -0.004 -0.3 -0.004 0.341. Household services 100.4 0.1 0.002 0.1 0.002 1.742. Medical, dental and paramedical services 100.6 0.5 0.011 0.5 0.011 0.843. Medical products, appliances and equipment 100.5 0.2 0.003 0.2 0.003 0.944. Personal transport 104.7 1.1 0.148 1.1 0.148 8.145. Local transport 100.2 0.1 0.001 0.1 0.001 0.246. Long-distance transport 98.4 -1.0 -0.009 -1.0 -0.009 -2.447. Communications 100.4 -0.4 -0.015 -0.4 -0.015 2.648. Recreational items 97.8 -0.5 -0.012 -0.5 -0.012 -3.449. Printed matter 101.3 -0.3 -0.002 -0.3 -0.002 1.950. Recreational services 100.1 -0.4 -0.014 -0.4 -0.014 0.751. Pre-primary and primary education 101.0 0.0 0.000 0.0 0.000 1.452. Secondary education 100.9 0.0 0.000 0.0 0.000 1.353. Tertiary education 100.6 0.0 0.000 0.0 0.000 0.854. Other educational goods and services 100.5 0.2 0.001 0.2 0.001 0.755. Personal effects 99.4 -0.6 -0.011 -0.6 -0.011 -0.556. Tourism, catering and accommodation services 100.1 -1.0 -0.126 -1.0 -0.126 1.757. Other goods and services 100.9 0.3 0.011 0.3 0.011 1.4
CPI – JANUARY 2017 (8/13)

(Continues)
4. Indices of Autonomous City and Community: overall and groupsGrupos Index % change Index % change Index % change
Over previous month
Over last December
Over one year
Over previous month
Over last December
Over one year
Over previous month
Over last December
Over one year
Andalucía Aragón Asturias, Principado deOVERALL INDEX 101.4 -0.6 -0.6 3.0 101.5 -0.6 -0.6 2.9 101.4 -0.8 -0.8 3.01. Food and non-alcoholic beverages 101.0 0.7 0.7 1.1 100.8 0.4 0.4 0.7 100.7 0.6 0.6 0.22. Alcoholic beverages and tobacco 101.5 0.9 0.9 1.7 101.2 0.8 0.8 1.6 101.4 0.8 0.8 1.33. Clothing and footwear 91.6 -16.3 -16.3 0.8 92.7 -14.5 -14.5 1.1 91.6 -17.1 -17.1 0.64. Housing 108.2 3.1 3.1 8.0 107.9 2.9 2.9 8.2 107.8 3.0 3.0 8.35. Furniture and household equipment 99.2 -1.0 -1.0 -0.4 98.8 -1.4 -1.4 -0.6 99.3 -1.2 -1.2 -0.36. Health 100.4 0.0 0.0 0.9 100.6 0.1 0.1 1.0 100.5 0.1 0.1 1.57. Transport 104.5 1.0 1.0 7.6 104.5 1.0 1.0 7.5 104.6 1.1 1.1 7.98. Communications 100.4 -0.4 -0.4 2.6 100.4 -0.4 -0.4 2.6 100.3 -0.4 -0.4 2.69. Recreation and culture 100.1 -1.0 -1.0 0.8 100.1 -1.3 -1.3 0.2 99.5 -1.9 -1.9 0.510. Education 100.9 0.0 0.0 1.3 100.5 0.0 0.0 1.0 101.8 0.0 0.0 2.411. Restaurants, cafes and hotels 99.8 -0.4 -0.4 1.2 99.9 -0.1 -0.1 0.6 100.1 -0.1 -0.1 1.412. Miscellaneous goods and services 100.5 0.0 0.0 1.2 100.2 -0.4 -0.4 0.9 100.5 0.0 0.0 1.3
Balears, Illes Canarias CantabriaOVERALL INDEX 101.5 -0.3 -0.3 2.9 101.1 -0.6 -0.6 2.5 101.8 -0.4 -0.4 3.11. Food and non-alcoholic beverages 100.6 0.4 0.4 0.8 100.5 0.4 0.4 0.9 100.9 0.6 0.6 0.52. Alcoholic beverages and tobacco 101.3 0.6 0.6 1.8 100.3 0.8 0.8 4.5 101.4 1.1 1.1 1.63. Clothing and footwear 94.7 -13.4 -13.4 0.7 91.8 -15.1 -15.1 -0.2 95.8 -12.9 -12.9 0.84. Housing 106.9 2.6 2.6 7.0 106.1 2.4 2.4 5.9 107.1 2.8 2.8 6.95. Furniture and household equipment 99.3 -0.9 -0.9 -0.3 99.0 -1.3 -1.3 -0.9 100.2 -0.7 -0.7 1.66. Health 100.0 0.0 0.0 0.3 100.1 0.1 0.1 0.4 100.1 0.2 0.2 0.37. Transport 104.1 0.9 0.9 7.1 103.1 0.2 0.2 5.5 105.0 1.1 1.1 8.38. Communications 100.4 -0.4 -0.4 2.7 100.4 -0.4 -0.4 2.6 100.5 -0.3 -0.3 2.79. Recreation and culture 100.1 -1.2 -1.2 -0.2 99.5 -1.0 -1.0 -0.3 100.3 -1.3 -1.3 0.810. Education 100.7 0.0 0.0 1.1 101.2 0.0 0.0 1.6 100.6 0.0 0.0 0.911. Restaurants, cafes and hotels 99.2 -0.1 -0.1 1.7 101.0 0.4 0.4 2.0 100.0 0.2 0.2 0.812. Miscellaneous goods and services 101.2 0.8 0.8 1.9 100.7 0.0 0.0 1.4 101.0 0.2 0.2 1.9

(Continuation)
4. Indices of Autonomous City and Community: overall and groupsGrupos Index % change Index % change Index % change
Over previous month
Over last December
Over one year
Over previous month
Over last December
Over one year
Over previous month
Over last December
Over one year
Castilla y León Castilla-La Mancha CataluñaOVERALL INDEX 101.8 -0.6 -0.6 3.4 101.7 -0.6 -0.6 3.3 101.6 -0.5 -0.5 3.11. Food and non-alcoholic beverages 101.4 0.7 0.7 1.2 101.2 0.7 0.7 1.2 101.3 0.8 0.8 1.52. Alcoholic beverages and tobacco 101.3 0.8 0.8 1.4 101.5 1.0 1.0 1.8 101.3 0.7 0.7 1.73. Clothing and footwear 92.8 -15.5 -15.5 1.2 92.5 -15.8 -15.8 0.8 93.4 -15.4 -15.4 0.94. Housing 108.6 3.1 3.1 9.2 109.5 3.4 3.4 10.2 106.3 2.5 2.5 6.45. Furniture and household equipment 99.6 -0.7 -0.7 -0.2 99.4 -0.9 -0.9 -0.4 100.0 -0.7 -0.7 0.96. Health 100.6 0.1 0.1 1.2 100.0 0.1 0.1 0.3 100.2 0.2 0.2 0.47. Transport 104.7 1.0 1.0 7.9 104.7 1.0 1.0 7.9 104.6 1.0 1.0 8.08. Communications 100.4 -0.4 -0.4 2.6 100.4 -0.4 -0.4 2.7 100.4 -0.4 -0.4 2.69. Recreation and culture 100.3 -1.4 -1.4 0.9 99.8 -1.3 -1.3 0.1 100.2 -2.2 -2.2 1.310. Education 100.8 0.0 0.0 1.0 100.4 0.0 0.0 0.5 100.8 0.0 0.0 1.111. Restaurants, cafes and hotels 99.4 -0.8 -0.8 1.4 99.7 -0.6 -0.6 0.3 99.8 -0.2 -0.2 1.512. Miscellaneous goods and services 100.6 0.1 0.1 1.2 100.6 0.2 0.2 1.3 100.8 0.2 0.2 1.5
Comunitat Valenciana Extremadura GaliciaOVERALL INDEX 101.5 -0.4 -0.4 3.0 101.4 -0.7 -0.7 2.9 101.6 -0.7 -0.7 3.21. Food and non-alcoholic beverages 100.8 0.7 0.7 0.9 100.5 0.7 0.7 0.5 101.0 0.7 0.7 1.02. Alcoholic beverages and tobacco 101.2 1.0 1.0 1.3 101.5 0.9 0.9 1.7 101.4 0.8 0.8 1.73. Clothing and footwear 92.8 -14.6 -14.6 0.9 91.5 -16.0 -16.0 0.6 93.0 -16.0 -16.0 0.94. Housing 108.7 3.4 3.4 8.9 109.0 3.4 3.4 8.6 108.5 3.2 3.2 8.65. Furniture and household equipment 99.1 -1.3 -1.3 -0.6 99.4 -0.7 -0.7 -0.3 99.6 -0.5 -0.5 -0.16. Health 100.4 0.3 0.3 0.5 99.8 -0.2 -0.2 0.1 100.9 0.2 0.2 1.37. Transport 104.5 1.1 1.1 7.8 104.5 1.0 1.0 7.7 104.4 1.0 1.0 7.68. Communications 100.3 -0.5 -0.5 2.5 100.3 -0.4 -0.4 2.6 100.4 -0.4 -0.4 2.69. Recreation and culture 99.9 -1.3 -1.3 0.3 100.3 -1.1 -1.1 1.1 100.1 -1.3 -1.3 0.610. Education 100.6 0.0 0.0 0.9 100.7 0.0 0.0 1.5 101.1 0.0 0.0 1.611. Restaurants, cafes and hotels 99.8 0.0 0.0 1.2 99.8 -1.0 -1.0 0.9 100.2 0.2 0.2 1.312. Miscellaneous goods and services 100.6 0.1 0.1 1.4 100.6 0.0 0.0 1.2 100.6 -0.1 -0.1 1.1

(Completion)
4. Indices of Autonomous City and Community: overall and groupsGroups Index % change Index % change Index % change
Over previous month
Over last December
Over one year
Over previous month
Over last December
Over one year
Over previous month
Over last December
Over one year
Madrid, Comunidad de Murcia, Región de Navarra, C. Foral deOVERALL INDEX 101.4 -0.4 -0.4 2.7 101.4 -0.7 -0.7 3.0 101.3 -0.9 -0.9 2.91. Food and non-alcoholic beverages 101.0 0.9 0.9 0.5 100.9 0.8 0.8 0.9 100.8 0.5 0.5 0.62. Alcoholic beverages and tobacco 101.3 0.9 0.9 1.5 101.6 1.1 1.1 1.9 101.4 0.8 0.8 2.03. Clothing and footwear 93.4 -13.7 -13.7 0.9 91.3 -16.8 -16.8 1.1 92.8 -15.3 -15.3 1.04. Housing 105.5 2.3 2.3 5.7 106.9 2.7 2.7 6.7 107.6 2.8 2.8 8.15. Furniture and household equipment 99.4 -0.4 -0.4 -0.6 99.5 -0.7 -0.7 -0.4 99.2 -0.8 -0.8 -1.06. Health 100.5 0.1 0.1 0.8 100.9 0.1 0.1 1.5 99.9 0.1 0.1 0.07. Transport 104.2 0.9 0.9 7.2 105.0 1.1 1.1 8.8 103.6 0.2 0.2 6.88. Communications 100.4 -0.4 -0.4 2.7 100.4 -0.4 -0.4 2.6 100.3 -0.5 -0.5 2.59. Recreation and culture 100.1 -1.6 -1.6 1.4 99.7 -1.4 -1.4 0.3 100.8 -1.8 -1.8 1.810. Education 100.2 0.1 0.1 0.2 100.8 0.0 0.0 1.2 100.8 0.1 0.1 1.111. Restaurants, cafes and hotels 100.2 -0.2 -0.2 1.1 100.5 0.2 0.2 0.8 100.2 0.1 0.1 2.012. Miscellaneous goods and services 100.7 0.2 0.2 1.5 100.6 0.0 0.0 1.3 100.3 -0.3 -0.3 1.1
País Vasco Rioja, La CeutaOVERALL INDEX 101.5 -0.6 -0.6 2.9 101.6 -1.0 -1.0 3.1 101.1 -0.7 -0.7 2.51. Food and non-alcoholic beverages 101.2 0.8 0.8 0.8 101.4 0.8 0.8 0.8 100.8 0.7 0.7 1.02. Alcoholic beverages and tobacco 101.2 0.8 0.8 1.5 101.1 0.7 0.7 1.3 102.1 0.9 0.9 2.43. Clothing and footwear 92.3 -15.8 -15.8 0.9 90.0 -20.5 -20.5 0.9 89.0 -18.0 -18.0 0.74. Housing 107.6 3.2 3.2 7.4 108.7 3.5 3.5 8.9 106.6 2.9 2.9 6.25. Furniture and household equipment 99.9 -0.9 -0.9 0.7 100.0 -1.4 -1.4 -0.2 100.3 -1.1 -1.1 -0.16. Health 100.8 0.4 0.4 1.2 100.4 0.1 0.1 0.2 100.5 0.1 0.1 0.57. Transport 104.4 1.0 1.0 7.5 104.7 1.1 1.1 8.1 104.3 1.5 1.5 6.38. Communications 100.4 -0.4 -0.4 2.6 100.4 -0.4 -0.4 2.6 100.5 -0.3 -0.3 2.89. Recreation and culture 100.8 -1.2 -1.2 1.7 100.2 -1.9 -1.9 0.6 101.0 -1.0 -1.0 1.410. Education 100.9 0.1 0.1 1.2 100.9 0.0 0.0 1.3 101.1 0.0 0.0 1.511. Restaurants, cafes and hotels 99.8 -0.1 -0.1 0.9 99.3 -1.1 -1.1 0.8 101.0 0.7 0.7 1.612. Miscellaneous goods and services 101.0 0.4 0.4 1.7 100.5 -0.2 -0.2 1.5 100.2 -0.2 -0.2 0.9
MelillaOVERALL INDEX 101.2 -1.1 -1.1 2.81. Food and non-alcoholic beverages 101.1 0.6 0.6 1.42. Alcoholic beverages and tobacco 102.1 1.1 1.1 2.13. Clothing and footwear 90.7 -17.7 -17.7 0.84. Housing 108.1 2.7 2.7 8.15. Furniture and household equipment 100.3 0.0 0.0 0.66. Health 98.9 -1.2 -1.2 -0.87. Transport 103.9 0.9 0.9 6.18. Communications 100.3 -0.4 -0.4 2.69. Recreation and culture 100.6 -0.9 -0.9 1.210. Education 100.5 0.0 0.0 0.611. Restaurants, cafes and hotels 100.1 -0.1 -0.1 0.712. Miscellaneous goods and services 100.4 -0.4 -0.4 1.3
Consumer Price Index at Constant TaxesBase 2016January 2017
1. National indices at Constant Taxes: overall and groupsGroup Index % change
Over previous Over one month year
OVERALL INDEX AT CONSTANT TAXES 101.5 -0.5 3.01. Food and non-alcoholic beverages 101.0 0.7 1.02. Alcoholic beverages and tobacco 101.3 0.9 1.73. Clothing and footwear 92.7 -15.3 0.94. Housing 107.3 2.8 7.45. Furniture and household equipment 99.5 -0.9 -0.26. Health 100.4 0.2 0.77. Transport 104.4 1.0 7.68. Communications 100.4 -0.4 2.69. Recreation and culture 100.1 -1.5 0.910. Education 100.7 0.0 1.011. Restaurants, cafes and hotels 99.9 -0.2 1.212. Miscellaneous goods and services 100.7 0.1 1.4
2. National indices at Constant Taxes: overall and special aggregatesSpecial aggregates Index % change
Over previous Over one month year
OVERALL INDEX AT CONSTANT TAXES 101.5 -0.5 3.0Processed food including beverages and tobacco 100.3 0.2 0.3Unprocessed food 102.7 1.8 2.7Food, beverages and tobacco 101.0 0.7 1.1Unprocessed food and energy 109.4 3.5 11.7Industrial goods 102.8 -1.7 5.8Durable industrial goods 100.3 -0.5 0.9Energy 113.6 4.6 17.5Fuels and gas 108.9 2.7 13.9Industrial goods excluding electricity 100.7 -2.8 3.8Industrial goods excluding energy 98.3 -4.5 0.8Services 100.3 -0.3 1.3Services excluding rentals for housing 100.4 -0.3 1.4Overall index excluding food, beverages and tobacco 101.6 -0.9 3.5Overall index excluding rentals for housing 101.5 -0.6 3.0Overall index excluding energy 100.0 -1.2 1.2CORE INFLATION (Overall index excluding unprocessed food and energy) 99.8 -1.5 1.1Overall index excluding tobacco 101.5 -0.6 3.0Overall index excluding services 102.3 -0.7 4.1Overall index excluding fuels 100.9 -0.8 2.0OVERALL INDEX AT CONSTANT TAXES AND SUBSIDIES 101.5 -0.5 2.9

15 February 2017
Harmonized Index of Consumer Prices. 2015=100January 2017
1. National indices: Overall and groups Group Index % change
Over previous Over onemonth year
OVERALL INDEX 100.50 -1.0 2.91. Food and non-alcoholic beverages 102.41 0.7 1.02. Alcoholic beverages and tobacco 101.81 0.9 1.73. Clothing and footwear 84.83 -21.5 1.04. Housing 102.67 2.8 7.45. Furniture and household equipment 99.62 -0.9 -0.26. Health 100.82 0.1 0.77. Transport 101.23 0.9 7.18. Communications 102.95 -0.4 2.69. Recreation and culture 98.88 -1.8 0.610. Education 101.34 0.0 1.011. Restaurants, cafes and hotels 100.81 -0.5 1.012. Miscellaneous goods and services 101.48 0.2 1.1
2. National index and at constant taxesGeneral Index % change
Over previous Over onemonth year
HICP at Constant Taxes 100.50 -1.0 2.9HICP 100.50 -1.0 2.9
Press Office: Telephone numbers: 91 583 93 63 / 94 08 – Fax: 91 583 90 87 - [email protected] Area: Telephone number: 91 583 91 00 – Fax: 91 583 91 58 – www.ine.es/infoine/?L=1
CPI – JANUARY 2017 (13/13)
For further information see INEbase - www.ine.es/en/ All press releases at: www.ine.es/en/prensa/prensa_en.htm