overcoming small data limitations in heart disease
TRANSCRIPT

SMU Data Science Review
Volume 1 | Number 3 Article 12
2018
Overcoming Small Data Limitations in HeartDisease Prediction by Using Surrogate DataAlfeo SabaySouthern Methodist University, [email protected]
Laurie HarrisSouthern Methodist University, [email protected]
Vivek BejugamaSouthern Methodist University, [email protected]
Karen Jaceldo-SieglLoma Linda University, [email protected]
Follow this and additional works at: https://scholar.smu.edu/datasciencereview
Part of the Cardiology Commons, Statistical Models Commons, and the Statistical TheoryCommons
This Article is brought to you for free and open access by SMU Scholar. It has been accepted for inclusion in SMU Data Science Review by anauthorized administrator of SMU Scholar. For more information, please visit http://digitalrepository.smu.edu.
Recommended CitationSabay, Alfeo; Harris, Laurie; Bejugama, Vivek; and Jaceldo-Siegl, Karen (2018) "Overcoming Small Data Limitations in Heart DiseasePrediction by Using Surrogate Data," SMU Data Science Review: Vol. 1 : No. 3 , Article 12.Available at: https://scholar.smu.edu/datasciencereview/vol1/iss3/12

Overcoming Small Data Limitations in Heart DiseasePrediction by Using Surrogate Data
Alfeo Sabay1, Laurie Harris1, Vivek Bejugama1, Karen Jaceldo-Siegl DrPH2
1 Southern Methodist University (SMU), 6425 Boaz Lane, Dallas, TX 75205, USA2Loma Linda Unversity, School of Public Health, 24951 North Circle Drive, Loma Linda, CA
92350, USA{asabay,llharris,vbejugama}@smu.edu,[email protected]
Abstract. In this paper, we present a heart disease prediction use case showinghow synthetic data can be used to address privacy concerns and overcome con-straints inherent in small medical research data sets. While advanced machinelearning algorithms, such as neural networks models, can be implemented to im-prove prediction accuracy, these require very large data sets which are often notavailable in medical or clinical research. We examine the use of surrogate datasets comprised of synthetic observations for modeling heart disease prediction.We generate surrogate data, based on the characteristics of original observations,and compare prediction accuracy results achieved from traditional machine learn-ing models using both the original observations and the synthetic data. We alsouse a large surrogate data set to build a neural network model (Perceptron) andcompare the prediction results to the traditional machine learning algorithms (Lo-gistic Regression, Decision Tree and Random Forest). Using traditional MachineLearning models with surrogate data, we achieved improved prediction stabilitywithin 2 percent variance at around 81 percent using ten fold validation. Usingthe neural network model with surrogate data we are able to improve the accuracyof heart disease prediction by nearly 16 percent to 96.7 percent while maintainingstability at 1 percent. We find the use of surrogate data to be a valuable tool, as ameans to anonymize sensitive data and improve classification prediction.
1 Introduction
Traditional classification algorithms such as logistic regression and decision trees havehistorically been employed to design prediction models for medical data sets [1]. Theseapproaches can provide very good accuracy of classification prediction. As machinelearning algorithms become more popular and accessible, researchers may be temptedto apply neural network models to medical data sets in an attempt to improve classifi-cation prediction accuracy. However, medical data are often constricted by smaller setsof observations than what is usually preferred to allow for sufficient training and testingof models built using machine learning algorithms [2]. Without sufficiently sized datasets, it is very difficult to determine if a model is generalizable to previously unseen setsof data [3].
Using synthetic data to overcome constraints inherent in small medical researchdata sets could be a solution to protect patient privacy and allow for application of
1
Sabay et al.: Heart Disease Prediction Using Surrogate Data
Published by SMU Scholar, 2018

machine learning algorithms. With tools such as the Synthpop package in R, researchersare able to efficiently generate extremely large data sets with the same characteristicsof the original data to be used in machine learning algorithms. The larger data setsallow for sufficiently sized training and testing partitions which enable the machinelearning algorithm to learn from experience by exposure to a large set of observations,and then to be tested upon another large set of observations that have not previouslybeen introduced to the model.
In this paper, we examine the application of synthetic data generation to a heartdisease prediction problem. Heart disease prediction is a well-studied classificationproblem and prior analyses serve as adequate baselines for our review. This analysisis completed in three stages. In stage one, we examine previously published results andreplicate logistic regression, decision tree, and random forest models using the Cleve-land Heart Disease data, as points of reference for our synthetic data research. In stagetwo, a surrogate data set of 50,000 observations is generated, based on the character-istics of the Cleveland data, using the Synthpop package in R. This surrogate data setserves as a stand in for the original observations. We carefully compare the surrogatedata set to the original observations to determine that the original characteristics aremaintained. We show that the distribution of the variables is consistent between thesurrogate and original observations.
Using the synthetic data, we train and validate the Machine Learning Models thencompare the prediction outcome accuracy to that using the original observations. Oncesatisfied with the consistency of classification prediction between the original data setand the surrogate data set, we generate an expanded surrogate data set in stage three.While based on the Cleveland data set, this expanded set contains previously unstudiedattributes. This expanded data set is used to test and train a neural network model usingthe Keras API for Python, having partitioned the synthetic data into large testing andtraining subsets. We then compare the outcome of the prediction accuracy of the neu-ral network model to the traditional logistic regression models. We find that using theexpanded surrogate data set to build a neural network model results in the best classi-fication prediction accuracy and stability. We pursue this model only after examiningthe synthetic data output and comparing it to the original observations. Finding that thecharacteristics of the original Cleveland data are maintained in the surrogate data sets,we find the use of surrogate data to be appropriate.
We conclude that the Synthpop package is a viable option to generate syntheticobservations which can conceal sensitive data points and be used for deep learning. Weare able to improve the accuracy of heart disease classification prediction by nearly 16percent, using this approach. Based on these results, we consider this method to be auseful approach when analyzing relatively small clinical data sets.
The remainder of this paper is organized as follows. In section 2, we introduce theheart disease prediction problem, and describe the medical condition and risk factors.We also examine prior heart disease prediction analyses, noting prediction accuracyand modeling algorithms employed. In section 3, we describe the well-studied Cleve-land heart disease data set, including the explanatory variables. Our design methods arepresented in section 4 with a detailed explanation of the Synthpop package and dis-cussion of our workflow process, describing each stage of our analysis. Our results are
2
SMU Data Science Review, Vol. 1 [2018], No. 3, Art. 12
https://scholar.smu.edu/datasciencereview/vol1/iss3/12

presented in section 5, followed by the related analyses in section 6. In section 7, we of-fer a discussion of ethical concerns specific to medical data sets and the use of syntheticdata. In section 8 we discuss potential research work to be done in the future usingsurrogate data generated from geographically diverse patient data sources. Finally, insection 9 we conclude on the work that is presented in this paper.
2 Coronary Heart Disease and Prediction
Heart Disease is a cardiovascular condition that affects 11.7 percent of American adults,with estimated costs, including healthcare, medications and lost productivity, of approx-imately 200 billion dollars [5]. Coronary Heart Disease (CHD), the most common typeof heart disease, is a condition where the blood flow in the coronary arteries is im-paired due to the narrowing effect of plaque buildup within the coronary arteries. Thereare well known causes to this condition including diet high in fat and cholesterol, in-adequate physical activity, excess body weight, and tobacco and alcohol use. Withoutearly detection and clinical intervention, studies show that almost half of the patientsdiagnosed with CHD will eventually die of the disease [7]. According to the NationalCenter for Health Statistics report of 2016, heart disease was the leading cause of deathcausing 23.4 percent of the total reported deaths in 2015[8].
According to the American Heart Association1, the terms Coronary Arterial Disease(CAD) and CHD are frequently used interchangeably. However, to be specific, a diag-nosis of CAD is often a prequel to a diagnosis of the more general CHD[9]. In medicalpractice, CHD is a common term for the buildup of plaque in the arteries leading to andfrom the heart where restricted blood flow of the heart muscle, known as ischemia, willeventually lead to a heart attack.
2.1 Risk Factors for Heart Disease
There are multiple risk factors that can contribute to the development of CHD. A sum-mary of the significant factors is shown in Table 1 below.
Although age, gender and family history are factors that cannot be changed or con-trolled, acknowledging them as risk factors can empower an individual to take initiativein monitoring for the controllable factors. Risk of CHD increases with age and positivefamily history of heart disease. In addition, men have more heart attacks than womenand heart attacks in men occur earlier in age than women [10].
Many risk factors are routinely monitored by physicians. Blood pressure readingsare measured at almost every clinic encounter. High blood pressure is one of the sideeffects of restricted blood flow. Arterial blockage which restricts blood flow in the bloodvessels causes Hypertension due to increased resistance in blood flow when the heartis pumping. Blood pressure measurements higher than 140/90 are associated with in-creased heart disease risk.
Cholesterol readings are also frequently monitored for patients. Low Density Lipopro-tein (LDL) Cholesterol, also known as the bad cholesterol, is carried in the blood stream
1 Coronary Artery Disease - Coronary Heart Disease. http://www.heart.org/en/health-topics/consumer-healthcare/what-is-cardiovascular-disease/coronary-artery-disease
3
Sabay et al.: Heart Disease Prediction Using Surrogate Data
Published by SMU Scholar, 2018
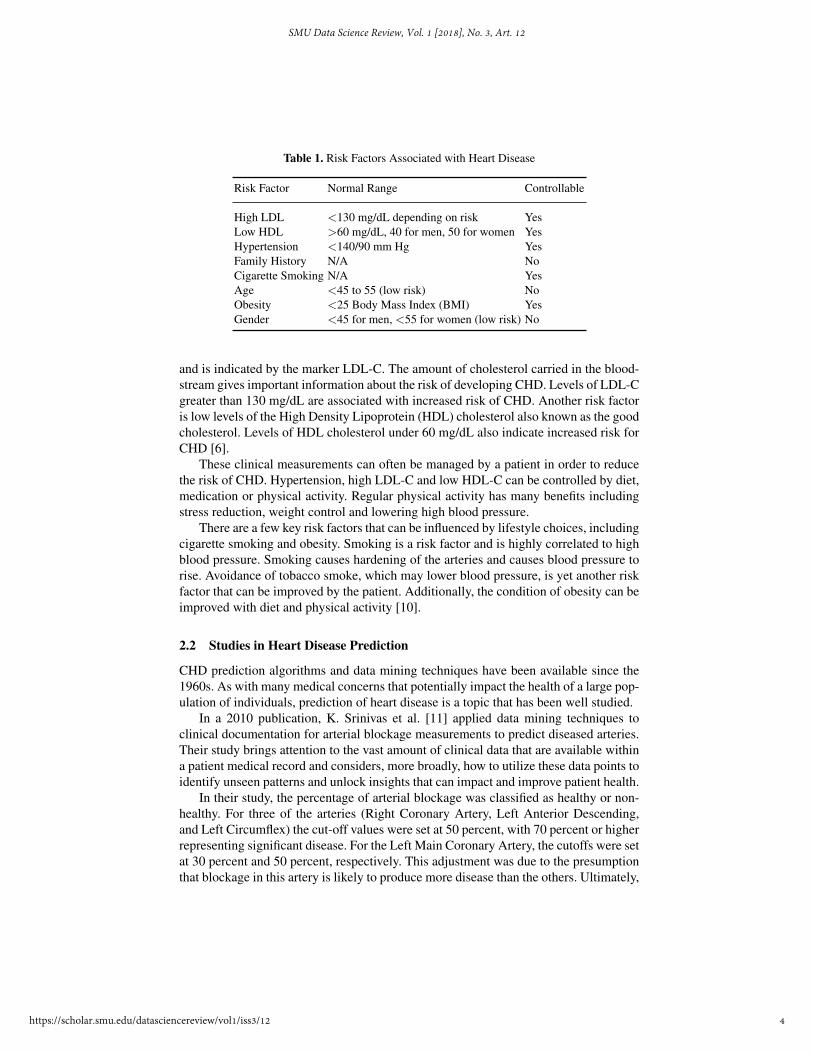
Table 1. Risk Factors Associated with Heart Disease
Risk Factor Normal Range Controllable
High LDL <130 mg/dL depending on risk YesLow HDL >60 mg/dL, 40 for men, 50 for women YesHypertension <140/90 mm Hg YesFamily History N/A NoCigarette Smoking N/A YesAge <45 to 55 (low risk) NoObesity <25 Body Mass Index (BMI) YesGender <45 for men, <55 for women (low risk) No
and is indicated by the marker LDL-C. The amount of cholesterol carried in the blood-stream gives important information about the risk of developing CHD. Levels of LDL-Cgreater than 130 mg/dL are associated with increased risk of CHD. Another risk factoris low levels of the High Density Lipoprotein (HDL) cholesterol also known as the goodcholesterol. Levels of HDL cholesterol under 60 mg/dL also indicate increased risk forCHD [6].
These clinical measurements can often be managed by a patient in order to reducethe risk of CHD. Hypertension, high LDL-C and low HDL-C can be controlled by diet,medication or physical activity. Regular physical activity has many benefits includingstress reduction, weight control and lowering high blood pressure.
There are a few key risk factors that can be influenced by lifestyle choices, includingcigarette smoking and obesity. Smoking is a risk factor and is highly correlated to highblood pressure. Smoking causes hardening of the arteries and causes blood pressure torise. Avoidance of tobacco smoke, which may lower blood pressure, is yet another riskfactor that can be improved by the patient. Additionally, the condition of obesity can beimproved with diet and physical activity [10].
2.2 Studies in Heart Disease Prediction
CHD prediction algorithms and data mining techniques have been available since the1960s. As with many medical concerns that potentially impact the health of a large pop-ulation of individuals, prediction of heart disease is a topic that has been well studied.
In a 2010 publication, K. Srinivas et al. [11] applied data mining techniques toclinical documentation for arterial blockage measurements to predict diseased arteries.Their study brings attention to the vast amount of clinical data that are available withina patient medical record and considers, more broadly, how to utilize these data points toidentify unseen patterns and unlock insights that can impact and improve patient health.
In their study, the percentage of arterial blockage was classified as healthy or non-healthy. For three of the arteries (Right Coronary Artery, Left Anterior Descending,and Left Circumflex) the cut-off values were set at 50 percent, with 70 percent or higherrepresenting significant disease. For the Left Main Coronary Artery, the cutoffs were setat 30 percent and 50 percent, respectively. This adjustment was due to the presumptionthat blockage in this artery is likely to produce more disease than the others. Ultimately,
4
SMU Data Science Review, Vol. 1 [2018], No. 3, Art. 12
https://scholar.smu.edu/datasciencereview/vol1/iss3/12

the authors identify a Naive Bayes model that can be used to predict heart disease withaccuracy in the low to mid 80 percent range.
In a 2011 publication, Jabbar et al. utilized the Cleveland Heart Disease Data setto examine association rule techniques in predicting heart disease [12]. Their studytransformed the measurements from the Cleveland data into binary classifications ofvariables. For example, where the data contained a specific cholesterol measurementfor the subject (e.g., 200, 205, 262), the researchers transformed that value into either a0 or 1 based on their established criteria. In their study, cholesterol values greater than240 would have a binary value of 1 and those less than that threshold would have avalue of 0.
This process of scoring clinical results enabled the researchers to apply clusteringtechniques and develop a Cluster Based Association Rule Mining Based on SequenceNumber (CBARBSM) model. The model ultimately examined frequent item sets andresults concluded that the association rule for heart disease includes the following: agegreater than 45, systolic blood pressure greater than 120, maximum heart rate greaterthan 100 and old Peak (stress test depression) greater than 0 and Thallium (measurementof defect) greater than 3.
In 2012, Shouman et al., researchers built upon prior studies to combine decisiontree techniques with k-means clustering to determine if heart disease prediction accu-racy of existing models can be improved [13]. In the Shouman study, the researchersfound that the best technique was to apply the k-means clustering to the age variable anduse the remaining 13 attributes for the decision tree. Their results showed that their opti-mal design, using two clusters, produced approximately 83.9 percent accuracy of heartdisease prediction. The researchers opined that their model be improved by adding moreclusters or application to a larger data set.
A 2015 publication by El-Bialy et al. reinforces the motivation for the volume ofresearch around the topic of cardiovascular disease, as it notes the fatality of the con-dition in that the illness causes over one million deaths each year and that almost onehalf of individuals with the condition will eventually die from the disease [7]. The studyalso discusses challenges associated with accumulating and using clinical data. Some ofthese include the sparse nature of the data, measurement errors, recording inaccuracies,and variations in professional interpretation, etc. As researchers, we also recognize thisproblem and acknowledge the delicate balance between the desire to utilize all the datathat are available and simultaneously, build the most accurate model for use.
The authors concluded that applying the same machine learning techniques to dif-ferent data sets can produce different results and noted that the accuracy of the modelsdeveloped using C4.5 and fast decision trees were in the mid to high 70 percent rangewhen applied to four distinct data sets. Table 2 below summaries the findings of theseprior research studies.
In all of the above studies, the researchers’ focus was mainly on the machine learn-ing algorithms used in predicting heart disease. Machine learning algorithms such aslogistic regression, decision tree, K-means clustering and fuzzy rule based models wereused in their analysis. These models used the processed version of the Cleveland datasetand the models were fine tuned to maximize the accuracy metrics of the models [14].These studies did not appear to consider techniques that could be applied to the data
5
Sabay et al.: Heart Disease Prediction Using Surrogate Data
Published by SMU Scholar, 2018

Table 2. Summary of Prior Heart Disease Prediction Studies
Research Study Year Accuracy
K.Srinivas B.Kavihta Rani Dr. A.Govrdhan 2010 Low to mid 80%Mai Shouman, Tim Turner, Rob Stocker 2012 83.90%Randa El-Bialy, Mostafa A. Salamay, et al. 2015 Mid to high 70%
set used by the models in order to improve the accuracy and stability of the predictionaccuracy.
2.3 Challenges Associated with Medical Data Sets
Application of today’s Machine Learning techniques in heart disease prediction havechallenges in data size and confidentiality matters. Processing times for statistical mod-els that are core to modern day machine learning classification and Artificial NeuralNetwork (ANN) algorithms have been greatly reduced thereby allowing for deeper anal-ysis and enhanced validation techniques [7]. However, application of machine learningtechniques often require very large data sets, much larger than what is traditionallyavailable from medical research experiments, where observation sizes are constrainedby cost, complexity and patient confidentiality compliance requirements. Such smalldatasets are typical in healthcare where they are adequate for human comprehensionbut insufficient in volume for machine learning models [2]. One reason for the smallsize of medical data sets is due to the lack of centralized medical databases. Hospitals,insurance companies, clinics and research organizations all maintain and protect theirown patient databases. Patient privacy laws are the main reason for this fragmentation[22]. These data sets are categorized as small-data and often come in less than 500 ob-servations and can be as small as 10 observations. Machine learning algorithms suchas ANN are built through a process of model training where the machine is trained tolearn by experience and exposure to data observations. The models are then tested usingpreviously unseen data to assess model performance and ensure trained models can begeneralized to new sets of data.
A novel solution for satisfying data volume requirements for machine learning mod-els was developed by Torgyn Shaikhina and Natalia A. Khovanova in a 2016 publica-tion titled Handling Limited Datasets with Neural Networks in Medical Applications:A Small-Data Approach [3]. In this research, a framework for generating surrogate datafrom small data sets (as small as ten observations) was developed and validated usingneural network techniques. This technique utilizes multiple runs of 2000 neural net-works in order to generate robust data sets that mimic the characteristics of the realdata set and provides adequate data volumes to satisfy modern machine learning basedprediction. The number of neurons required for this technique requires large computingresources therefore, in this experiment, we chose an alternative solution for surrogatedata generation.
There are several tools available for surrogate data generation. Synthpop is an R lan-guage library that provides data synthesis and data comparison functions [26]. Simpop
6
SMU Data Science Review, Vol. 1 [2018], No. 3, Art. 12
https://scholar.smu.edu/datasciencereview/vol1/iss3/12

is also an R language library that provides surrogate data synthesis utilizing S4 classimplementation, but without the comparison tools provided by Synthpop to comparethe seed data to the surrogate data [27]. There are numerous other methods that use theR ”boot” package (bootstrap) to re-sample small data sets for surrogate data generation,but this was found to be a low level implementation and lacking built-in comparisontools like those provided by Synthpop [28]. Synthpop was chosen as the tool for surro-gate data generation in this study because of the ease of use and the built-in tools thatprovide comparisons of the seed data to the surrogate data characteristics.
3 Heart Disease Data Set
Our analysis was performed using data from the Heart Disease Database availablefrom the UCI Repository (Center for Machine Learning and Intelligent Systems) [14].This data has been available since 1988, and is considered the gold standard in heartdisease prediction research because of its availability and widespread use in research[13][24][25].
There are four available database categories as shown in Table 3 below. Of thesefour sources, the Hungarian, Switzerland, and Long Beach data sets have many missingvalues; therefore, the Cleveland dataset has been used the most due to its completenessof observations [15]. Although well documented in previous studies, we explored all ofthese data sets during the data preparation stage and have chosen to utilize the Clevelanddata set because it has the least number (only six observations) of missing data.
Table 3. UCI Repository for Machine Learning Heart Disease Databases
Database Donor Author Instances
Cleveland Cleveland Clinic Foundation Robert Detrano, M.D., Ph.D. 303Hungarian Hungarian Institute of Cardiology, Budapest Andras Janosi, M.D. 294Switzerland University Hospital, Zurich, Switzerland William Steinbrunn, M.D. 123Long Beach V.A. Medical Center, Long Beach Robert Detrano, M.D., Ph.D. 200
The four Heart Disease data sets are available in raw and processed formats2. Theraw format is space delimited text and where there is missing data, a ”-9” was inserted.The Cleveland raw data set contains 76 attributes, but half (38) of the attributes are notusable due to missing or undefined data. The number of final usable records from theraw data set after the data cleanup was 282 records with 38 attributes. The processeddata (the Cleveland 14 data set) is a comma delimited text file and has been reducedto 14 attributes as a result of past research [7]. In the processed databases, the missingdata encoding (-9) still exists. Of the four processed databases, the Cleveland 14 data isthe most complete with only 6 records of missing data making the total usable size 297records with 14 attributes.
2 Relevant Information (4): http://archive.ics.uci.edu/ml/machine-learning-databases/heart-disease/heart-disease.names
7
Sabay et al.: Heart Disease Prediction Using Surrogate Data
Published by SMU Scholar, 2018

Most of the recent research utilizes the processed Cleveland database containing 14attributes (Table 4) [7]. The response variable (diag) indicates the presence or absence ofheart disease. In the raw data, the values range from zero (0) to four (4). Zero indicatesless than fifty percent arterial blockage and is classified as no disease, while one to four(1-4) is an indication of the degree of arterial blockage of over fifty (50) percent. Formost studies the values of 1 through 4 are coded into a one (1) value so the predictionis based solely on whether heart disease is present or not. In addition to the responsevariable, there are 13 features used in this study from the Cleveland data set includingage, sex, chest pain, resting blood pressure, cholesterol, fasting blood sugar, restingelectrocardiography (ECG), maximum heart rate from Thallium test, exercise inducedangina, ST depression (an ECG reading indicating blood flow), the slope of the STdepression, the number of blood vessels colored by fluoroscopy, and the heart defectstatus code. Table 4 lists the variables and descriptions. In this study, we refer to theprocessed Cleveland dataset as Cleveland 14.
All four datasets include variables which are patient readings collected from whatis known as Stress or Exercise Test. Exercise Testing is performed by a Cardio ImagingTechnician at the supervision of a Cardiologist where the patients heart rate is elevatedby means of treadmill activity or by injection of a drug that makes the heart pumpfaster. The patients heart pumping activity is monitored both at rest and with elevatedheart rate. Thallium, which is a radioactive material, is injected into the patients bloodstream so that the medical imaging equipment can capture the patients blood flow andheart activity both at rest and with elevated heart rate [10]. Some Stress Test relatedmetrics such as maximum heart rate, oldpeak and slope (electrocardiogram readings)are captured in the Cleveland 14 dataset.
Table 4. Cleveland 14 Data Set Variables
Attribute Description
age Age in years; continuoussex Gender; categoricalchest pain Scale of 1 to 4; categoricalresting bp Diastolic blood pressure; continous (mmHg)cholesterol Total Cholesterol; continuous (mg/dl)fast bsugar Scale of 0 to 1; categoricalresting ecg Scale of 0 to 2; categoricalmax hrate max heartrate from thalium test; continuousexer angina Scale of 0 to 1; categoricalOldpeak ST depression relative to rest; continuousSlope Scale of 1 to 3; categoricalca mavessel Scale of 0 to 4; categoricalheart def status One of 3 values (per thalium test); categoricaldiag Response variable; 0 no disease, 1 disease; categorical
8
SMU Data Science Review, Vol. 1 [2018], No. 3, Art. 12
https://scholar.smu.edu/datasciencereview/vol1/iss3/12

Management of the missing data was done in two ways. In the early stages of thisstudy, a decision was made not to impute or substitute the missing data in the processedCleveland data set in order to be consistent with the data used in past heart diseaseprediction studies [13]. In the final stage of this study, the raw Cleveland data (no com-ponent reduction) set was used to take advantage of the larger number of variables totrain the Perceptron Neural Network Model. There were five (5) records with missingdata and the missing data were filled in with imputed values (mean value of the at-tribute column). After data cleaning, the original 76 variables were reduced to 38 dueto columns with all missing or unknown data. The final shape of the raw Cleveland dataset after data cleaning was 38 x 282 (38 attributes and 282 samples).
The volume size of both the Cleveland 14 and the raw Cleveland data sets, whichcontain less than 300 records, are small and not ideal for stable performance of machinelearning prediction models. This is because the training and validation steps for machinelearning models involve splitting the data set into training and testing partitions. In atypical 10 fold cross validation process, the data set can be split where 80% of therecords are used to train the models and 20% for testing. The training and test sets arefurther split into 10 partitions during the cross validation stage in order to observe thestability of the model. It is expected that the small volume size of both the Cleveland 14and the raw Cleveland data sets will be problematic in the training and cross validationprocess and will result in unstable performance measurements. In order to introducestability to the training and cross validation stages, we applied the use of data synthesisto produce surrogate data in this study.
4 Methods and Experiments
The usefulness of a good heart disease prediction model depends largely on its accuracyand stability. To achieve this, we divided this experiment into three (3) stages (Figure 1).In stage 1 of the experiment we established baseline models and their results. The mainobjective of Stage 1 was to validate and compare the accuracy and stability of the resultsof our own machine learning models with those of the results in prior research studiesusing the Cleveland 14 dataset [13][25][24]. In Stage 2, we introduced a variation ofthe Cleveland 14 dataset by generating synthetic data based on the Cleveland 14 datausing the R Programming Language and the Synthpop Library. We used Synthpop togenerate fifty thousand (50,000) records that mimic the characteristics of the Cleveland14 data (containing 297 records). We then used this larger surrogate dataset to trainand test the previous logistic regression, decision tree and random forest models. Thepurpose of Stage 2 was to see if there was an improvement in accuracy and stabilityof the same machine learning models by comparing the results to the baseline in Stage1. In Stage 3 of this experiment, we generated sixty thousand records from the rawCleveland dataset and used the surrogate data to train and test an ANN model of thePerceptron Forward and Back Propagation algorithm type. ANN models in general havethe advantage of simpler feature selection because the models make no assumptionsabout the data input. We used the raw Cleveland dataset with 37 Explanatory Variablesand 1 Response Variable. The Perceptron model performs well with large datasets, soa surrogate dataset of 60,000 records was generated from the raw Cleveland Dataset
9
Sabay et al.: Heart Disease Prediction Using Surrogate Data
Published by SMU Scholar, 2018

(shape of 38 X 282). The purpose of Stage 3 was to compare the accuracy and stabilityof the Perceptron model to the Stage 1 and Stage 2 model accuracy and stability.
Fig. 1. Machine Learning Experiment Stages
4.1 Synthetic Data Generation using Synthpop
As previously mentioned, in stages 2 and 3, we expanded the volume of the data by gen-erating a surrogate dataset from the original data. This was accomplished by a processof data synthesis using the R language Synthpop library. Synthpop generates syntheticdata from the original dataset and produces a surrogate dataset that mimics the charac-teristics of the original dataset. The resulting surrogate dataset volume can be adjustedto a higher or lower volume to increase or decrease the total number of records in thesurrogate dataset. The motivation behind the creation of Synthpop by its authors was toconceal confidential data by generating synthetic versions of the data without disclosingreal data values while preserving the characteristics and the relationships between thevariables [26].
Synthpop produces synthetic data using statistical techniques. The generation of thesynthetic data is done via the function syn(). At its simplest usage, the function syn()
only requires the argument data which is a data frame or matrix that contains the orig-inal data and can be supplied with the k argument that specifies the record size of thesynthetic data. Other arguments specify random number seed and drop.not.used
which if TRUE, variables not used in the synthesis are not saved in the synthesized data.Internally, the synthetic data is produced column by column based on the estimateddistribution of the original data’s column. The creation of the synthetic data is done by
10
SMU Data Science Review, Vol. 1 [2018], No. 3, Art. 12
https://scholar.smu.edu/datasciencereview/vol1/iss3/12
projecting and fitting general linear/logistic models using the original data and by im-plementing Classification and Regression Trees (CART). The projection of the originaldata via the general linear/logistic models into surrogates of varied sizes allows for vali-dation of the synthetic dataset by fitting the synthetic data via the general linear/logisticmodel and comparing the statistical characteristic to the original dataset via the functioncompare(). The compare() function plots a frequency plot of the percentage makeupof the original data versus the synthetic data. Depending on the argument passed tocompare(), a comparison of the coefficient or Z confidence interval can also be plot-ted. The utility of the compare()function was used in stages 2 and 3 to demonstratethat the data characteristics of the Surrogate data set were preserved.
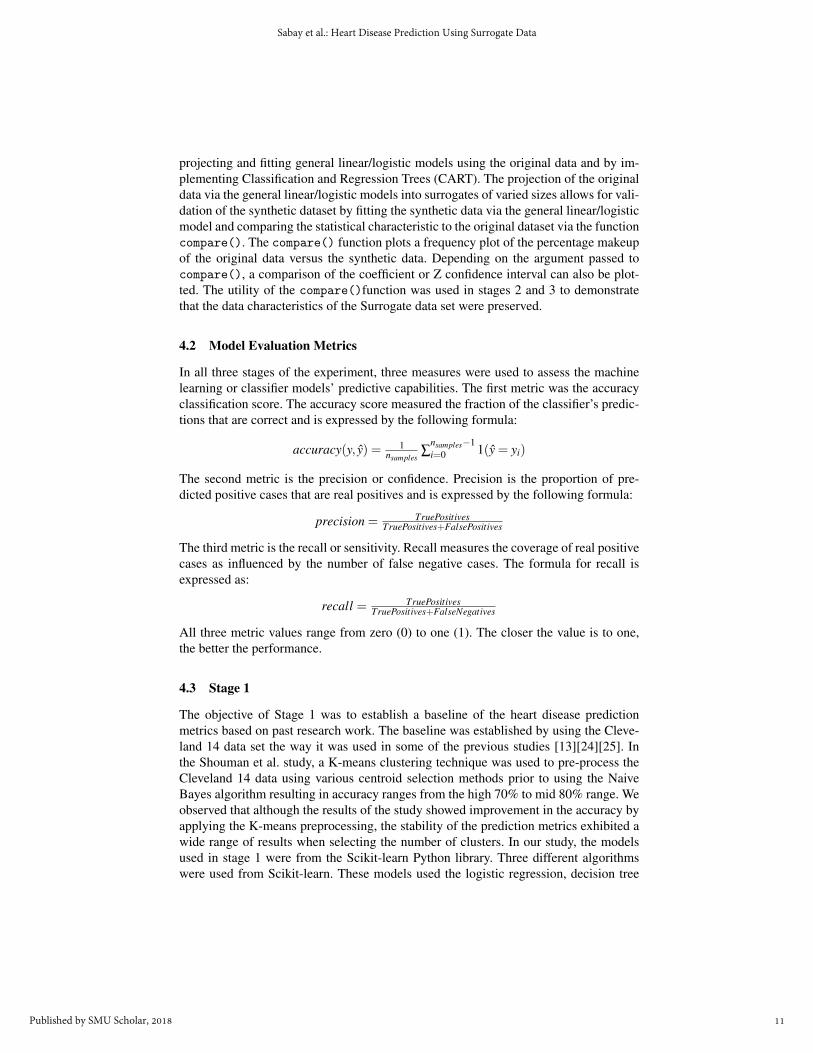
4.2 Model Evaluation Metrics
In all three stages of the experiment, three measures were used to assess the machinelearning or classifier models’ predictive capabilities. The first metric was the accuracyclassification score. The accuracy score measured the fraction of the classifier’s predic-tions that are correct and is expressed by the following formula:
accuracy(y, y) = 1nsamples
∑nsamples−1i=0 1(y = yi)
The second metric is the precision or confidence. Precision is the proportion of pre-dicted positive cases that are real positives and is expressed by the following formula:
precision = TruePositivesTruePositives+FalsePositives
The third metric is the recall or sensitivity. Recall measures the coverage of real positivecases as influenced by the number of false negative cases. The formula for recall isexpressed as:
recall = TruePositivesTruePositives+FalseNegatives
All three metric values range from zero (0) to one (1). The closer the value is to one,the better the performance.
4.3 Stage 1
The objective of Stage 1 was to establish a baseline of the heart disease predictionmetrics based on past research work. The baseline was established by using the Cleve-land 14 data set the way it was used in some of the previous studies [13][24][25]. Inthe Shouman et al. study, a K-means clustering technique was used to pre-process theCleveland 14 data using various centroid selection methods prior to using the NaiveBayes algorithm resulting in accuracy ranges from the high 70% to mid 80% range. Weobserved that although the results of the study showed improvement in the accuracy byapplying the K-means preprocessing, the stability of the prediction metrics exhibited awide range of results when selecting the number of clusters. In our study, the modelsused in stage 1 were from the Scikit-learn Python library. Three different algorithmswere used from Scikit-learn. These models used the logistic regression, decision tree
11
Sabay et al.: Heart Disease Prediction Using Surrogate Data
Published by SMU Scholar, 2018

and the random forest algorithms. In all three models, the model hyperparameters werefine tuned to the Cleveland 14 dataset using GridSearchCV. These models though singlelayer with no pre-processing, obtained similar results to the studies in the Shouman etal., Sumathi et al. and Marateb et al. studies shown in Table 2 with our own results asshown in Table 5. We were able to achieve comparable results with the logistic regres-sion, decision tree and random forest models.
4.4 Stage 2
The objective in Stage 2 of the research was to improve the stability of the modelsused in Stage 1. The small number of observations (297 records) of the Cleveland 14Dataset which is typical of real healthcare data does not meet volume requirements ofMachine Learning models and will cause instability in the performance metrics resultsduring 10 fold cross-validation on the Machine Learning models. Therefore, in Stage2 we generated a 50,000 observation surrogate dataset based on subject characteristicsfrom the Cleveland 14 dataset. We applied the Synthpop library in R Studio to generatethe surrogate dataset and assessed the same prediction metrics using logistic regression,decision tree and random forest models.
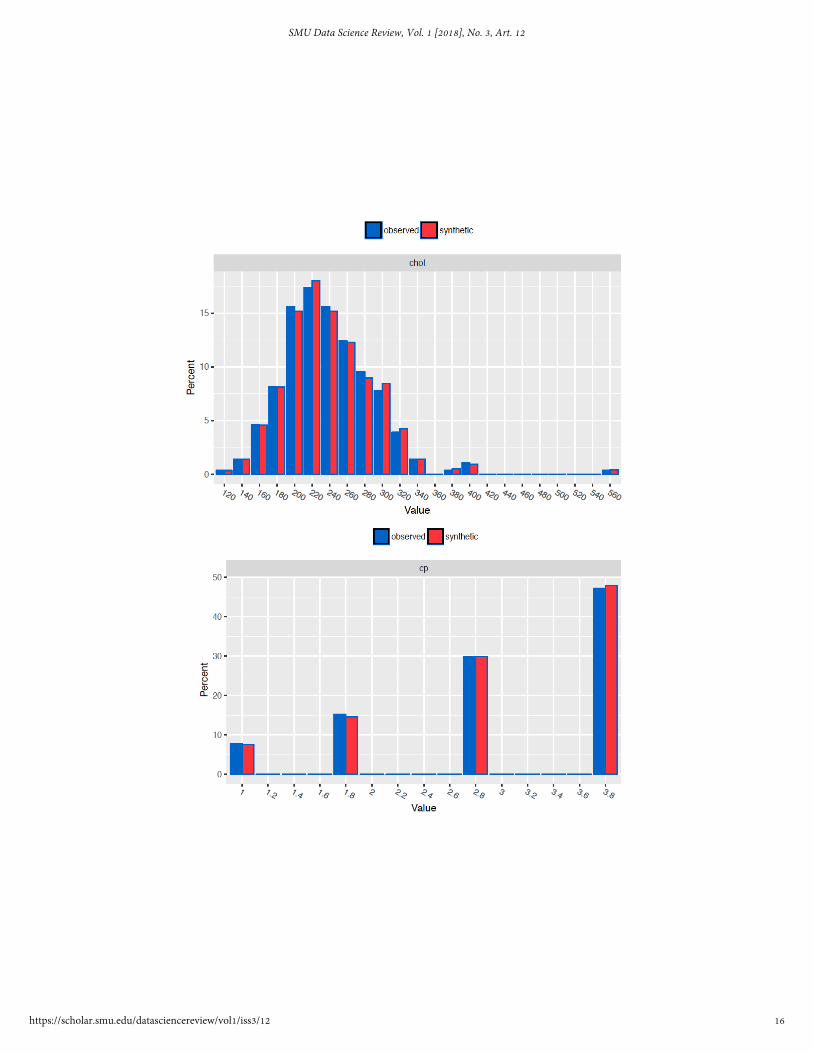
The Synthpop library was used in R Studio to generate the surrogate dataset. Toshow that the surrogate dataset mimics the characteristics of the Cleveland dataset,all attributes of the synthetic data were compared on frequency plots to the Clevelanddataset (Figure 5). As an added comparison, the surrogate data were fitted to the generallinear/logistic model used in the Synthpop data synthesis of the Cleveland 14 surrogatedata and the resulting coefficients of the Cleveland 14 and the surrogate data set werecompared and shown to overlap each other with a 95% confidence limit (Figure 2).
4.5 Stage 3
The objective of Stage 3 was to improve the accuracy, precision and recall results fromStage 2. We used a Perceptron Neural Network Model that was configured with 3 hid-den layers and 3 dropout layers. Neural Network models, in general, produce higheraccuracy measurements than traditional machine learning models; however, they havehigher data volume training requirements [18]. To satisfy this, we generated a 60,000record surrogate data set from the raw Cleveland dataset. The surrogate data set has37 explanatory and one response variable and a shape of 38 X 60,000. To show thatthe Cleveland data set characteristics were preserved in the surrogate data set, we usedthe Synthpop compare function to plot frequency plots of all the data sets for compari-son (Figure 5). In addition, the coefficient confidence interval was plotted to show thatboth the raw Cleveland dataset and the surrogate dataset coefficients have the same fitresponse to the general linear/logistic model used in Synthpop (Figure 3).
5 Results
In Stage 1, the results of our preliminary classification models (logistic regression, deci-sion tree, and random forest) performed using the Cleveland 14 data set were consistent
12
SMU Data Science Review, Vol. 1 [2018], No. 3, Art. 12
https://scholar.smu.edu/datasciencereview/vol1/iss3/12

Fig. 2. Cleveland 14 Versus Surrogate Coefficient Confidence Interval Comparison
13
Sabay et al.: Heart Disease Prediction Using Surrogate Data
Published by SMU Scholar, 2018

Fig. 3. Raw Cleveland Versus Surrogate Coefficient Confidence Interval Comparison
14
SMU Data Science Review, Vol. 1 [2018], No. 3, Art. 12
https://scholar.smu.edu/datasciencereview/vol1/iss3/12

with results from previous research. Accuracy ranged from 83% - 88% using logisticregression, 74%-79% using a decision tree classifier, and 77%-81% using a randomforest classifier.
Of the three, the logistic regression model produced superior accuracy predictionmetrics - up to the 88 percent range. The recall metric score for logistic tegression hasa 7 percent variation compared to that of the random forest model with a variation of11 percent. The stability of the recall metric is of high interest since it is an indicationof the false negative prediction rates. Figure 4 and Table 5 summarizes the accuracy,precision and recall results for the three models.
Fig. 4. Stage 1 Results: Range of accuracy, precision and recall values for 10-fold cross validationmodels for Logistic Regression, Decision Tree, and Random Forest.
Table 5. Stage 1 Machine Learning Metric Results
Machine Learning Model Accuracy Precision Recall
Logistic Regression 83 - 88% 82 - 92% 75 - 82%Decision Tree 74 - 79% 71 - 75% 69 - 77%Random Forest 77 - 81% 74 - 84% 70 - 81%
The characteristics of the synthetic data that were generated using the originalCleveland 14 data set in stage 2 of our analysis shared very similar distributions com-pared to the original data. The distribution for each variable was reviewed and someexamples are shown in Figure 5.
In stage 2, we applied the logistic regression model to the synthetic Cleveland 14data in order to determine what the results would be using the same logistic regressionmodel (as in stage 1) with the surrogate data. The results show that accuracy, precision
15
Sabay et al.: Heart Disease Prediction Using Surrogate Data
Published by SMU Scholar, 2018
16
SMU Data Science Review, Vol. 1 [2018], No. 3, Art. 12
https://scholar.smu.edu/datasciencereview/vol1/iss3/12

Fig. 5. Example Raw Cleveland to Surrogate Frequency Plots for Cholesterol, Chest Pain Type,Peak Exercise Blood Pressure and Age
17
Sabay et al.: Heart Disease Prediction Using Surrogate Data
Published by SMU Scholar, 2018

and recall have similar levels between the original Cleveland 14 data in stage 1 versusthe Cleveland 14 Surrogate data in Figure 6. The main difference is that the ranges aremuch narrower (within 2 percent) when using the surrogate data indicating a more sta-ble performance of the logistic regression model when the data volume is significantlyincreased.
Fig. 6. Stage 2 results: Logistic Regression Model Accuracy, Precision and Recall Metrics forStage 1 (left) compared to Stage 2 (right)
Finally in stage 3, after achieving improved stability with the application of the lo-gistic regression model to the larger surrogate Cleveland 14 data set as compared to theoriginal Cleveland 14 data set, we implemented a neural network model (Perceptron)using an expanded surrogate data set (60,000 samples) based on the raw Cleveland dataset (38 attributes from 76, after data cleaning). Recall that the Cleveland 14 data set fromthe UCI Repository used in previous studies (also in stages 1 and 2) was also derivedfrom the same raw Cleveland data set in this case. The performance of the Perceptrondeep learning model shows the accuracy, precision and recall scores consistently at 96.7percent with a 1 percent variation shown in Figure 7.
6 Analysis
As shown from the results of the traditional classification models, performance wasconsistent with what has been produced with prior studies. This outcome is consistentwith what we expect from reviewing reproducible research and serves as a baseline forour additional analysis.
The primary focus of our analysis was to examine the synthetic data observationsand compare them to the original observations from the Cleveland data set. We firstlooked at the response variable, which is the presence or absence of heart disease. Forthe presence of heart disease the Cleveland data set had 44.3 percent positive compared
18
SMU Data Science Review, Vol. 1 [2018], No. 3, Art. 12
https://scholar.smu.edu/datasciencereview/vol1/iss3/12

Fig. 7. Stage 3 results: Accuracy, Precision and Recall Metrics using Neural Network PerceptronModel with Surrogate Data.
to 55.7 percent negative. The surrogate data is similarly split with 43.8 percent positivecompared to 56.2 percent negative.
In an effort to compare the mean distribution values, we calculated a 95 percentconfidence interval for the proportion of individuals with heart disease and plotted theinterval ranges in Figure 8. As expected, the variance for the synthetic data is verysmall due to the massive amount of observations. However, we find that the mean of theproportion for the surrogate data set is contained within the confidence interval for theproportion for the Cleveland data set.
Fig. 8. 95 percent Confidence Interval of Mean Proportion of Heart Disease for Synthetic andOriginal Data Sets
Although we did not statistically test the values for the other variables we visuallyexamine the distributions for each attribute. Those plots for a few of the more familiarattributes are shown in Figure 5. We are satisfied that the surrogate data set appropri-ately mimicked the original observations, therefore we used it to build a neural networkmodel.
As shown in Figure 9, the neural network model built using the surrogate data setproduces superior accuracy precision and recall compared to the traditional logisticregression models.
19
Sabay et al.: Heart Disease Prediction Using Surrogate Data
Published by SMU Scholar, 2018

Fig. 9. Stage 1, 2 and 3 Results: Progression of improvement in Accuracy, Precision and RecallMetrics and Stability for Stage 1 (left), Stage 2 (middle) and Stage 3 (right). Stage 3 shows thehighest scores for all 3 metrics at 96.7 percent with only 1 percent variation.
7 Ethics
Studies involving medical research require careful consideration of ethical concerns.Addressing those concerns often begins at the design stage of an experiment where apatient is required to give informed consent to participate in the study. During this stage,the patient is informed of the purpose of the study, the benefits and risks are explainedand he is asked to voluntarily agree to participate.
However, even after a specific study is concluded, data gathered during the courseof an experiment continues to live. Since much of the purpose of data mining is to iden-tify previously unseen patterns, utilization of data collected in medical research maycontinue for many years and extend beyond original intents of a given study. Patientsare not capable of giving specific consent for use of their information for unforeseenuses [19].
This motivates the need to protect patient privacy. Although many personally iden-tifying elements are anonymized in medical research data sets, knowledge of the pa-tient privacy protections allowed in the Health Insurance Portability and AccountabilityAct (HIPAA) of 1996 is critical to ensure compliance. HIPAA very explicitly providesfor patient privacy protection by requiring de-identification of Protected Health Infor-mation (PHI). PHI describes any data element which could allow identification of theindividual for which the health information pertains to. The following is the definitionfrom the Code of Federal Regulations that defines health information subject to privacyprotection [22].
From 45 CFR 160.103Health information means any information, including genetic information,
whether oral or recorded in any form or medium, that:
20
SMU Data Science Review, Vol. 1 [2018], No. 3, Art. 12
https://scholar.smu.edu/datasciencereview/vol1/iss3/12

(1) Is created or received by a health care provider, health plan, public healthauthority, employer, life insurer, school or university, or health care clearinghouse;and
(2) Relates to the past, present, or future physical or mental health or conditionof an individual; the provision of health care to an individual; or the past, present,or future payment for the provision of health care to an individual.
PHI must be removed from medical research data or masked to ensure patient pri-vacy is protected under HIPAA. As stated in the description, this goes beyond anonymiz-ing patient numbers and names. Any data element, or combination of data elements, thatcould reasonably be linked to an individual, including genetic data, is included in thismeasure.
To make data from medical research available, only the minimal necessary informa-tion should be disclosed. Although it can be difficult to determine the threshold for theminimally necessary information for each use, CFR 164 [23] contains an extensive list-ing of information elements that are potential identifiers and should be excluded fromall data sets as shown in Table 6.
Table 6. Potential Identifying Elements
Potential Identifying Elements
NamesPostal AddressTelephone/Fax NumbersElectronic Mail AddressesSocial Security NumbersMedical Record NumbersHealth Plan NumbersPatient Account NumbersCertificate/License NumbersVehicle Identification / Serial NumbersDevice Identification NumberInternet Protocol AddressesBiometric IdentifiersFull face photographic imagesWeb URLs
We view the opportunity to create surrogate data sets as a potential solution to min-imize the risk of disclosing any potential individual identifying data related to medicalresearch. Because the surrogate data is comprised of synthetic observations, there isno disclosure of any true patient identifying elements. The surrogate data sets wouldmimic the original observations. Depending upon the research purpose and analytictools used, surrogate data sets of varying sizes can be generated. However, caution
21
Sabay et al.: Heart Disease Prediction Using Surrogate Data
Published by SMU Scholar, 2018
should be taken to ensure that surrogate data sets are not used beyond research objec-tives and researchers should be transparent regarding the use of synthetic data.
8 Future Work
The use of surrogate data to train machine and deep learning models in this study ap-pears to be an effective step towards improving heart disease prediction, but with limi-tations. The origin of the patient data used in this study was from the Cleveland, Ohioarea and is not geographically diverse. From a global perspective, each geographicalregion has its own characteristic diet, lifestyle and availability of healthcare resources.According to the World Health Organization, in 2017, Turkmenistan had the highestdeath rate due to cardiovascular disease at 411.1 deaths per 100,000 while South Koreahas the lowest at 30.76 [4]. Application of surrogate data in heart disease prediction us-ing machine or deep learning techniques with patient data from geographically diversesources would be interesting to explore in the future. By doing so, we can potentiallydiscover data patterns that are not easily seen by using a geographically focused patientdata set such as the Cleveland data set.
9 Conclusions
We find that the Synthpop package produces an adequate surrogate set of syntheticdata which closely mimics the characteristics of the original observations. Our analysisshows, by comparison, that classification prediction outcomes from traditional machinelearning models such as logistic regression, are reasonably similar whether the surrogatedata set or the original observations are used. Variability of the prediction measurementsare improved, in this case, due to the increased number of observations in the surrogatedata set.
In addition, we improved heart disease prediction using surrogate data. Due to thelarge volume of synthetic observations that can be produced, the surrogate data aresuitable for use with deep learning models such as ANN. Creating synthetic observa-tions upon which the neural network can be trained and tested allows for an increase inclassification prediction of nearly 16 percent.
These findings provide a basis for additional testing to be performed with othersmall clinical data sets. The use of surrogate data as a means to anonymize sensitive dataand potential to improve classification prediction is a worthwhile area for additionalexploration and research.
References
1. S. Aswal, N. J. Ahuja and Ritika, ”Experimental analysis of traditional classification algo-rithms on bio medical dtatasets,” 2016 2nd International Conference on Next GenerationComputing Technologies (NGCT), Dehradun, 2016, pp. 566-568.
2. Justin Collins, BS; Jordan Brown, BS; Christine Schammel, PhD; Kevin Hutson, PhD; andW. Jeffery Edenfield, MD: ”Meaningful Analysis of Small Data Sets: A Clinicians Guide”,Greenville Health System Proc.June 2017; 2 (1): 16-19
22
SMU Data Science Review, Vol. 1 [2018], No. 3, Art. 12
https://scholar.smu.edu/datasciencereview/vol1/iss3/12

3. Shaikhina, Torgyn, and Natalia A. Khovanova. ”Handling limited datasets with neural net-works in medical applications: A small-data approach.” Artificial intelligence in medicine 75(2017): 51-63.
4. World health statistics 2017: Monitoring health for the SDGs, Sustainable DevelopmentGoals. Geneva: World Health Organization; 2017. Licence: CC BY-NC-SA 3.0 IGO.
5. National Institute of Health. ”Know the Differences: Cardiovascular Disease, Heart Disease,Coronary Heart Disease”. Available at https://www.nhlbi.nih.gov
6. U.S. Department of Health and Human Services. ”High Blood Cholesterol, What You NeedTo Know”, NIH Publication No. 05-3290 Originally printed May 2001 Revised June 2005Available at https://www.nhlbi.nih.gov/files/docs/public/heart/wyntk.pdf
7. Randa El-Bialy, Mostafa A. Salamay, Omar H. Karam, M. Essam Khalifa: Feature Analysisof Coronary Artery Heart Disease Data Sets, Procedia Computer Science, Vol. 65 (2015)pp459-468.
8. National Center for Health Statistics. Health, United States, 2016 With Chartbook on Long-term Trends in Health. Hyattsville, MD. 2017.
9. Gibbons, R. (2002). ACC/AHA 2002 Guideline Update for Exercise Testing: Summary Arti-cle: A Report of the American College of Cardiology/American Heart Association Task Forceon Practice Guidelines (Committee to Update the 1997 Exercise Testing Guidelines). Circu-lation, 106(14), pp.1883-1892.
10. Gibbons, R. (2003). ACC/AHA 2002 Guideline Update for the Management of PatientsWith Chronic Stable Angina–Summary Article: A Report of the American College of Car-diology/American Heart Association Task Force on Practice Guidelines (Committee on theManagement of Patients With Chronic Stable Angina). Circulation, 107(1), pp.149-158.
11. Srinivas, K., B. Kavihta Rani, and A. Govrdhan. ”Applications of data mining techniquesin healthcare and prediction of heart attacks.” International Journal on Computer Science andEngineering (IJCSE) 2.02 (2010): 250-255
12. Jabbar, M. A., Priti Chandra, and B. L. Deekshatulu. ”Cluster based association rule miningfor heart attack prediction.” Journal of Theoretical and Applied Information Technology 32.2(2011): 196-201
13. Shouman, Mai, Tim Turner, and Rob Stocker. ”Integrating decision tree and k-means clus-tering with different initial centroid selection methods in the diagnosis of heart disease pa-tients.” Proceedings of the International Conference on Data Mining (DMIN). The SteeringCommittee of The World Congress in Computer Science, Computer Engineering and AppliedComputing (WorldComp), 2012
14. Andras Janosi, M.D., William Steinbrunn, M.D., Matthias Pfisterer, M.D., RobertDetrano, M.D., Ph.D. The UCI machine learning repository online. Available athttp://archive.ics.uci.edu/ml/datasets/Heart+Disease
15. Gadaras, I. and Mikhailov, L. (2009). An interpretable fuzzy rule-based classificationmethodology for medical diagnosis. Artificial Intelligence in Medicine, 47(1), pp.25-41.
16. Kohavi, Ron. ”A study of cross-validation and bootstrap for accuracy estimation and modelselection.” Ijcai. Vol. 14. No. 2. 1995.
17. Nowok, Beata, Gillian M. Raab, and Chris Dibben. ”synthpop: Bespoke creation of syntheticdata in R.” Journal of statistical software 74.11 (2016): 1-26.
18. Gulli, Antonio, and Sujit Pal. Deep Learning with Keras. Packt Publishing Ltd, 2017.19. Mittelstadt, Brent Daniel, and Luciano Floridi. ”The ethics of big data: current and foresee-
able issues in biomedical contexts.” Science and Engineering Ethics 22.2 (2016): 303-341.20. Eggers, K., Ellenius, J., Dellborg, M., Groth, T., Oldgren, J., Swahn, E. and Lindahl, B.
(2007). Artificial neural network algorithms for early diagnosis of acute myocardial infarc-tion and prediction of infarct size in chest pain patients. International Journal of Cardiology,114(3), pp.366-374.
23
Sabay et al.: Heart Disease Prediction Using Surrogate Data
Published by SMU Scholar, 2018

21. Lee TH, Goldman L.: Evaluation of the Patient with Acute Chest Pain, New England Journalof Medicine. (2018).
22. HIPAA Privacy Rule. 45 CFR 160.103 2013.23. Other requirements relating to uses and disclosures of protected health information. 45 CFR
164.514 2013.24. R. Sumathi, E. Kirubakaran: ”Enhanced Weighted K-means Clustering Based Risk Level
Prediction For Coronary Heart Disease”, ResearchGate, Volume 71 (2012), pp. 490-500.Available at https://www.researchgate.net
25. Hamid Reza Marateb, Sobhan Goudarzi: ”A noninvasive method for coronary artery dis-eases diagnosis using a clinically-interpretable fuzzy rule-based system”, ResearchGate,Volume 20 Journal of Research in Medical Sciences (2015), pp. 214-224. Available athttps://www.researchgate.net
26. Beata Nowok, Gillian Raab and Chris Dibben: ”Synthpop: Bespoke Creation of SyntheticData in R”, Journal of Statistical Software, Articles. Volume 74, pp. 1-26 (2016). Available athttps://www.jstatsoft.org/v074/i11
27. Matthias Templ, Bernhard Meindl, Alexander Kowarik, Olivier Dupriez:”Simulation of Syn-thetic Complex Data: The R Package simPop”, Journal of Statistical Software, Articles, Vol-ume 79, pp. 1-38 (2017). Available at https://github.com/statistikat/simPop
28. A. C. Davison, D. V. Hinkley:”Bootstrap Methods and Their Applications”, Cambridge Uni-versity Press (1997) ISBN 0-521-57391-2. Available at http://statwww.epfl.ch/davison/BMA/
24
SMU Data Science Review, Vol. 1 [2018], No. 3, Art. 12
https://scholar.smu.edu/datasciencereview/vol1/iss3/12