overcoming the range limitation of medium-duty … · overcoming the range limitation of ......
TRANSCRIPT

____________________________________
NREL/CP-5400-60053. Posted with permission. Presented at the SAE 2013 Commercial Vehicle Engineering Congress.
2013-01-2471 Published 09/24/2013
doi:10.4271/2013-01-2471saecomveh.saejournals.org
Overcoming the Range Limitation of Medium-Duty BatteryElectric Vehicles through the use of Hydrogen Fuel-Cells
Eric Wood, Lijuan Wang, Jeffrey Gonder, and Michael UlshNational Renewable Energy Laboratory
ABSTRACT Battery electric vehicles possess great potential for decreasing lifecycle costs in medium-duty applications, a market
segment currently dominated by internal combustion technology. Characterized by frequent repetition of similar routes and daily return to a central depot, medium-duty vocations are well positioned to leverage the low operating costs of battery electric vehicles. Unfortunately, the range limitation of commercially available battery electric vehicles acts as a barrier to widespread adoption. This paper describes the National Renewable Energy Laboratory's collaboration with the U.S. Department of Energy and industry partners to analyze the use of small hydrogen fuel-cell stacks to extend the range of battery electric vehicles as a means of improving utility, and presumably, increasing market adoption. This analysis employs real-world vocational data and near-term economic assumptions to (1) identify optimal component configurations for minimizing lifecycle costs, (2) benchmark economic performance relative to both battery electric and conventional powertrains, and (3) understand how the optimal design and its competitiveness change with respect to duty cycle and economic climate. It is found that small fuel-cell power units provide extended range at significantly lower capital and lifecycle costs than additional battery capacity alone. And while fuel-cell range-extended vehicles are not deemed economically competitive with conventional vehicles given present-day economic conditions, this paper identifies potential future scenarios where cost equivalency is achieved.
CITATION: Wood, E., Wang, L., Gonder, J., and Ulsh, M., "Overcoming the Range Limitation of Medium-Duty BatteryElectric Vehicles through the use of Hydrogen Fuel-Cells," SAE Int. J. Commer. Veh. 6(2):2013, doi:10.4271/2013-01-2471.
BEV and a battery price of $600/kWh, adding range with INTRODUCTION batteries alone increases the capital cost of the vehicle by
Battery electric vehicles (BEVs) possess great potential $600/mi (and this is before accounting for increasing the curb for decreasing lifecycle costs in medium-duty applications, a weight of the vehicle with additional batteries). With the market segment currently dominated by internal combustion present-day capital cost of BEVs already significantly higher technology. Characterized by frequent repetition of similar than CVs, the notion of increasing vehicle range exclusively routes and daily return to a central depot, medium-duty through electrical energy storage is difficult to justify.vocations are well positioned to leverage the low operating As an alternative to increasing battery size, the utility of costs of BEVs. BEVs could be improved through the use of an on-board
Unfortunately, the range limitation of commercially generator that produces electricity to supplement the battery available BEVs acts as a barrier to widespread adoption. pack as it nears depletion. This arrangement could allow the Unlike conventional vehicles (CVs), BEVs are constrained by vehicle to leverage the low operating costs of grid electricity long recharge times and a lack of ubiquitous access to public for the majority of miles traveled while having the capability refueling stations. Consequently, the BEV market is limited to utilize a higher cost fuel for range extension when to vocations where planned routes will rarely (if ever) exceed necessary.the fully charged driving range of the vehicle. For this analysis, we will focus on a hydrogen fuel cell as
Overcoming this range dilemma with batteries alone the range-extending hardware of choice. By employing proves problematic due to the high capital cost associated hydrogen as a range extending fuel, the vehicle can retain with electrical energy storage. For example, assuming an zero-emissions capability as well as the potential for electric consumption rate of 1 kWh/mi for a medium-duty operation using 100% renewably generated energy. Herein
563
564 Wood et al / SAE Int. J. Commer. Veh. / Volume 6, Issue 2(October 2013)
we will refer to such a powertrain arrangement as a fuel-cell range-extended vehicle (FC-REV).
The design space for a FC-REV quickly becomes complicated as the merits of battery capacity and fuel-cell power are pitted against one another. A singular range requirement could be satisfied using a number of different hardware configurations ranging from a capital cost intensive, battery-dominant design to an operating cost intensive, fuel cell-dominant design. The design space is further expanded by considering at what point during the depletion of the battery to engage the fuel cell. While many hardware/ software combinations capable of meeting a given range requirement exist, exploring the design space to identify a cost-optimal solution is a non-trivial task. The following section outlines a methodology for identifying cost-optimal FC-REV designs given inputs such as duty cycle, component costs, and energy costs.
VEHICLE MODELING Modeling Environment
All vehicle modeling done in this analysis was performed using the National Renewable Energy Laboratory's (NREL's) Future Automotive Systems Technology Simulator (FASTSim) [1]. FASTSim is a vehicle simulation tool developed by NREL to evaluate the impact of various technologies on vehicle performance, cost, and utility in conventional and advanced technology powertrains. Operating in the Excel/ Visual Basic environment, FASTSim calculates the power necessary to meet a given speed trace while considering component limitations, system losses, and auxiliary loads.
The baseline BEV model considered in this analysis was calibrated to real-world on-road data from a Smith Newton parcel delivery vehicle using the vehicle attributes and component sizes shown in Table 1 [2]. The simulated error in electricity consumption between simulation results and real-world data of <2% is used as justification for extrapolating this model in parametric studies.
Table 1. Baseline vehicle attributes and component sizes used to model the Smith Newton medium-duty BEV.
Operating Philosophy Three energy management strategies were considered, as
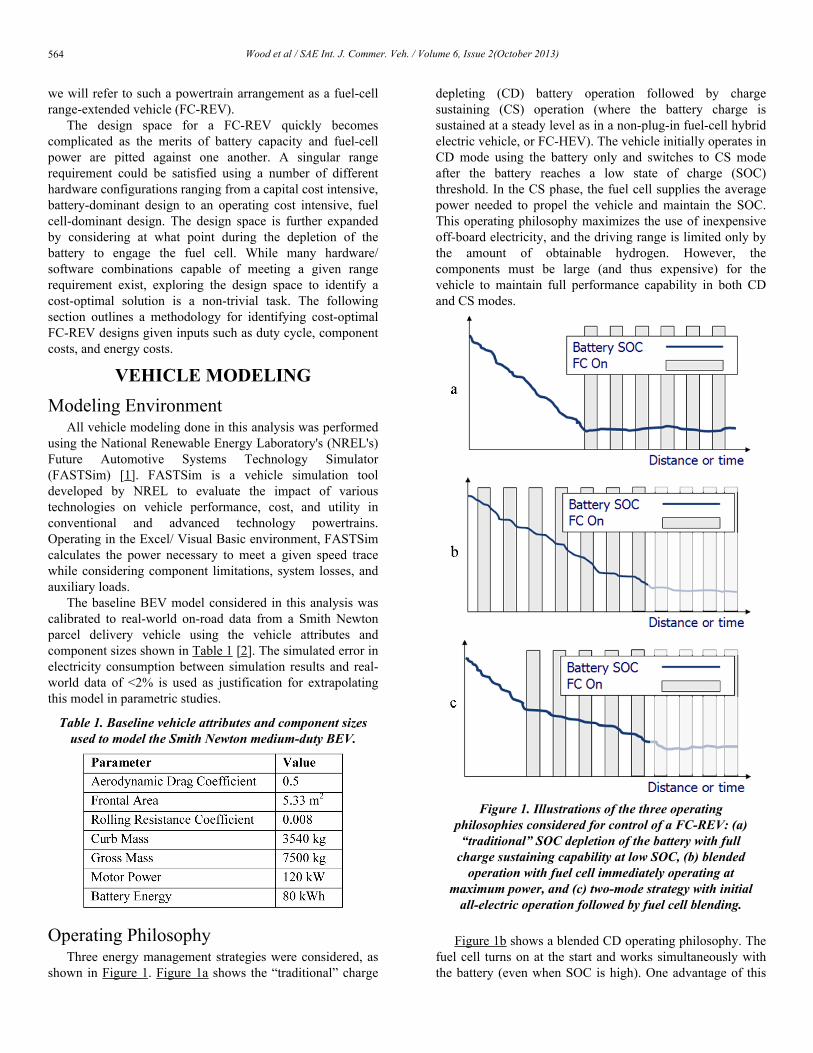
shown in Figure 1. Figure 1a shows the “traditional” charge
depleting (CD) battery operation followed by charge sustaining (CS) operation (where the battery charge is sustained at a steady level as in a non-plug-in fuel-cell hybrid electric vehicle, or FC-HEV). The vehicle initially operates in CD mode using the battery only and switches to CS mode after the battery reaches a low state of charge (SOC) threshold. In the CS phase, the fuel cell supplies the average power needed to propel the vehicle and maintain the SOC. This operating philosophy maximizes the use of inexpensive off-board electricity, and the driving range is limited only by the amount of obtainable hydrogen. However, the components must be large (and thus expensive) for the vehicle to maintain full performance capability in both CD and CS modes.
Figure 1. Illustrations of the three operating philosophies considered for control of a FC-REV: (a) “traditional” SOC depletion of the battery with full charge sustaining capability at low SOC, (b) blended operation with fuel cell immediately operating at
maximum power, and (c) two-mode strategy with initial all-electric operation followed by fuel cell blending.
Figure 1b shows a blended CD operating philosophy. The fuel cell turns on at the start and works simultaneously with the battery (even when SOC is high). One advantage of this

Wood et al / SAE Int. J. Commer. Veh. / Volume 6, Issue 2(October 2013) 565
operating philosophy is that it enables a lower capital cost design because a small, continuously operating fuel cell can satisfy the average drive cycle energy needs with a relatively low-energy battery simply providing supplemental power (and capturing regenerative braking energy) as needed. However, under this philosophy the vehicle's performance would become restricted when either the battery fully depletes or the fuel cell exhausts its hydrogen supply.
The operating philosophy in Figure 1c combines the first two options. The vehicle operates initially in a battery-only CD mode; then, once the battery has reached a predefined SOC trigger, a small fuel cell turns on to slow the rate of depletion for an extended range. This approach provides some balance: the operation biases toward using inexpensive off-board electricity when driving ranges are relatively short, and it only requires daily hydrogen fueling when driving ranges are long. The battery needs to be large enough for short-range independent operation, but both it and the fuel cell could be much smaller and less expensive than would be required for the “traditional” CD and CS operating philosophy illustrated in Figure 1a. Due to these favorable trade-offs, the compromise operating philosophy illustrated in Figure 1c was selected for the FC-REV modeling and simulation in FASTSim.
ANALYSIS Design of Experiments
To fully canvas the design space, a full factorial design of experiments was performed over a number of different battery, fuel cell, payload, drive cycle, operating mode, and SOC trigger combinations (see Table 2). The computational efficiency of FASTSim enabled the characterization of this large design space (over 63,000 simulations of 720 vehicle designs) in approximately 12 hours of simulation time on a single computer (less than one second per simulation). While the full experiment was simulated, the results across payload and drive cycle are aggregated to produce a three-dimensional design space using battery energy, fuel cell system maximum power, and SOC trigger (the SOC trigger is based on usable energy and not total energy).
The astute observer will note that hydrogen storage capacity was one design variable that was not swept in the design of experiments. This is a result of the authors' objective to aim for simultaneous depletion of electrical energy in the battery and chemical energy in the hydrogen storage system. To meet this objective, all simulations were performed with the hydrogen storage mass fixed and the simulated total vehicle mass varying exclusively as a function of battery energy and fuel cell maximum power. Consequently, the hydrogen storage necessary to achieve simultaneous battery and hydrogen depletion was calculated during post-processing and used to inform capital cost calculations for hydrogen storage. The effect of this constant mass assumption is believed to have minimal impact on simulation outcomes as the resultant hydrogen mass of the
designs considered was on the order of tens of kilograms while the total vehicle simulation mass was on the order of thousands of kilograms.
Table 2. Design of experiments matrix encompassing a number of hardware, software, duty cycle, and payload
configurations.
Evaluation of Vehicle Designs Upon completion of the design of experiments, capital
cost, operating cost, and net present value (NPV) are calculated for each vehicle design. These economic outputs will provide the basis for design evaluation in the subsequent sections of this document.
In order to calculate capital cost of each FC-REV design, cost models are employed for the battery, fuel cell system, and hydrogen storage. The battery cost model assumes a linear relationship between pack energy and cost with a coefficient of $388/kWh [3]. Fuel cell system and hydrogen storage costs are calculated as functions of fuel cell maximum power and storage capacity according to data from Strategic Analysis Incorporated (SA) for present day technology scaled up to 10,000 units/year (see Figure 2) [4]. As a limited number of data points for fuel cell system and hydrogen storage cost models were available, cost multipliers are held constant beyond 16 kW of fuel cell power and 4 kg of hydrogen storage.
Component costs are then marked up by 50% to represent the price a customer or fleet vehicle purchaser could expect to pay [5]. Beyond the cost of the battery, fuel cell system, and hydrogen storage, no other vehicle costs are calculated as these are assumed to remain constant across all FC-REV designs (i.e., chassis, electric motor, power electronics, etc.).
The ability of the proposed FC-REV designs to source energy from a battery and fuel cell makes the calculation of operating costs more involved. Following simulation, each vehicle design is assigned a per-mile consumption rate for electricity and hydrogen in both Mode 1 (prior to fuel cell engagement) and Mode 2 (following fuel cell engagement). These consumption rates are then translated to a per-mile cost in each mode using near-term prices for commercial electricity and hydrogen of $0.12/kWh [6] and $9.00/kg respectively (electricity price includes a markup for the vehicles' on-board charging efficiency, estimated at 85% [7]). A utility factor is then calculated for each design as the ratio

566 Wood et al / SAE Int. J. Commer. Veh. / Volume 6, Issue 2(October 2013)
of miles achieved in Mode 1 to the total miles achieved in both modes (see Equation 1).
Figure 2. Cost models for fuel cell system and hydrogenstorage. Data points sourced from SA predictions fornear-term technology rollout at 10,000 units per year.
(1)
This ratio is calculated using the range achievable in Mode 1 (from simulation) and a distribution of daily vehicle miles traveled sourced from NREL's Fleet Testing and Evaluation Team [8]. Summarized graphically in Figure 3, this composite dataset contains mileage information from 43 medium-duty parcel delivery vehicles collected over a total of 737 days. All utility factor calculations in this study assume the vehicle is fully charged exactly once per day.
Figure 3. Medium-duty parcel delivery drive profile data sourced from NREL's Fleet Testing and Evaluation
team.
Having derived a utility factor for each design, the per-mile cost from each mode is then weighted and summed using said utility factor to determine a singular per-mile cost ($/mi). This per-mile cost is then multiplied by vehicle miles traveled (VMT) to calculate single-year fueling costs and projected forward assuming a vehicle lifetime of 10 years with future fuel purchases discounted to present day value at 4.1% per year [9]. Annual VMT is calculated by taking average daily VMT and assuming operation five days/week (nominally 12,700 miles/year).
Economic assumptions employed in the baseline analysis are summarized in Table 3.
Table 3. Summary of assumptions used in baseline analysis of FC-REV, BEV, and CV powertrains.
Wood et al / SAE Int. J. Commer. Veh. / Volume 6, Issue 2(October 2013) 567
RESULTS FC-REV Optimization
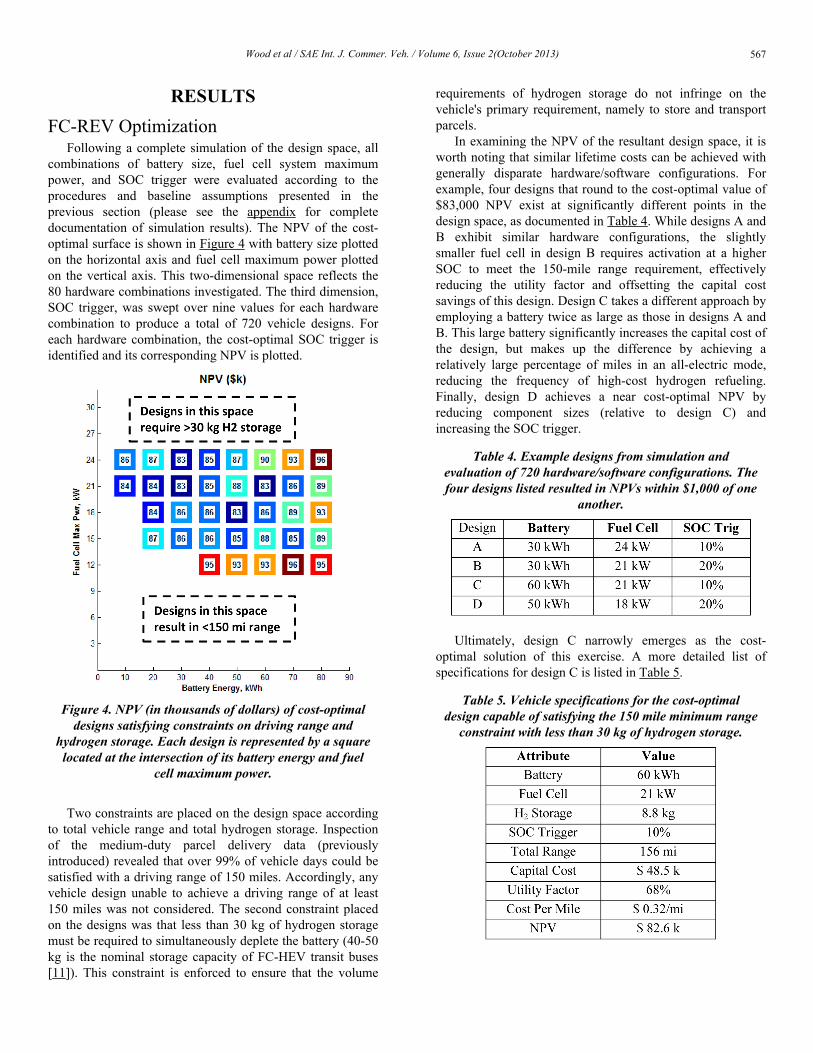
Following a complete simulation of the design space, all combinations of battery size, fuel cell system maximum power, and SOC trigger were evaluated according to the procedures and baseline assumptions presented in the previous section (please see the appendix for complete documentation of simulation results). The NPV of the cost-optimal surface is shown in Figure 4 with battery size plotted on the horizontal axis and fuel cell maximum power plotted on the vertical axis. This two-dimensional space reflects the 80 hardware combinations investigated. The third dimension, SOC trigger, was swept over nine values for each hardware combination to produce a total of 720 vehicle designs. For each hardware combination, the cost-optimal SOC trigger is identified and its corresponding NPV is plotted.
Figure 4. NPV (in thousands of dollars) of cost-optimal designs satisfying constraints on driving range and
hydrogen storage. Each design is represented by a square located at the intersection of its battery energy and fuel
cell maximum power.
Two constraints are placed on the design space according to total vehicle range and total hydrogen storage. Inspection of the medium-duty parcel delivery data (previously introduced) revealed that over 99% of vehicle days could be satisfied with a driving range of 150 miles. Accordingly, any vehicle design unable to achieve a driving range of at least 150 miles was not considered. The second constraint placed on the designs was that less than 30 kg of hydrogen storage must be required to simultaneously deplete the battery (40-50 kg is the nominal storage capacity of FC-HEV transit buses [11]). This constraint is enforced to ensure that the volume
requirements of hydrogen storage do not infringe on the vehicle's primary requirement, namely to store and transport parcels.
In examining the NPV of the resultant design space, it is worth noting that similar lifetime costs can be achieved with generally disparate hardware/software configurations. For example, four designs that round to the cost-optimal value of $83,000 NPV exist at significantly different points in the design space, as documented in Table 4. While designs A and B exhibit similar hardware configurations, the slightly smaller fuel cell in design B requires activation at a higher SOC to meet the 150-mile range requirement, effectively reducing the utility factor and offsetting the capital cost savings of this design. Design C takes a different approach by employing a battery twice as large as those in designs A and B. This large battery significantly increases the capital cost of the design, but makes up the difference by achieving a relatively large percentage of miles in an all-electric mode, reducing the frequency of high-cost hydrogen refueling. Finally, design D achieves a near cost-optimal NPV by reducing component sizes (relative to design C) and increasing the SOC trigger.
Table 4. Example designs from simulation and evaluation of 720 hardware/software configurations. The four designs listed resulted in NPVs within $1,000 of one
another.
Ultimately, design C narrowly emerges as the cost-optimal solution of this exercise. A more detailed list of specifications for design C is listed in Table 5.
Table 5. Vehicle specifications for the cost-optimal design capable of satisfying the 150 mile minimum range constraint with less than 30 kg of hydrogen storage.

568 Wood et al / SAE Int. J. Commer. Veh. / Volume 6, Issue 2(October 2013)
Comparison of FC-REV to BEV and CV While exploring the hardware/software combinations of a
FC-REV is an interesting exercise in multi-dimensional design space optimization, ultimately we would like to know how such a powertrain compares economically with currently available technology. Our expectation that the energy storage requirements of a medium-duty BEV capable of 150 miles of driving range would result in a cost-prohibitive solution leads us to re-optimize a FC-REV design around a 60-mile minimum driving range constraint for purposes of comparison.
In order to calculate fueling costs of a range-limited vehicle, our fleet parcel delivery vehicle data are appended to only include driving days less than 60 miles. Yearly VMT is then updated using the average daily distance of days less than 60 miles and the on-going assumption of operation five days/week. Updating annual VMT to consider the limitations of a 60-mile vehicle resulted in 9,800 miles/year of operation. A comparison of the optimized FC-REV design, a 60-mile BEV, and a CV is shown in Table 6.
Table 6. Comparison of three powertrains with a minimum of 60-mile driving range capability. (Note: The CV calculation of a $0 capital cost neglects the baseline cost of the chassis and engine as a comparable cost of chassis and electric motor are not considered in the
analysis of the electric powertrains.)
In making comparisons between the FC-REV design and the BEV, it is worth noting that while the hardware specifications of the two powertrains have little in common, their ultimate NPVs are very similar. We see that while the capital cost of the BEV is significantly higher than the FC-REV, the low operating costs of the BEV allow it to stay competitive in this space. In terms of consumer acceptance, an argument could be made in favor of either powertrain. The FC-REV affords lower capital cost, an issue that is consistently identified as a market barrier to advanced vehicle technology [12]. Alternatively, the BEV offers a potentially more reliable powertrain configuration (due to its relative simplicity) and foregoes the hydrogen infrastructure requirements of the FC-REV.
In the end, the near-term argument between FC-REVs and BEVs is merely academic in light of the heavy economic advantage possessed by CVs. The NPV of a comparable CV
is 38% less than either electric powertrain at this range; while the fueling costs of CVs appear relatively high, this difference is more than offset by the low capital cost of conventional technology.
An identical economic comparison is now conducted at incremented driving range capabilities from 30 to 210 miles. The effect of a maximum single-charge driving range on VMT and NPV is shown in Figure 5. It can be seen that the BEV is only able to remain competitive with the optimized FC-REV design at or below 60 miles of driving range. The NPV of high-range BEV designs escalates quickly as the capital cost of the battery pack substantially increases. The additional range afforded by high-range BEVs simply is not utilized sufficiently to make them a cost-effective proposition.
Figure 5. Extrapolation from parcel delivery data of how annual VMT changes as a function of maximum driving range. NPVs for a FC-REV, BEV, and CV are calculated for each driving range requirement and annual VMT
combination.
Alternatively, the FC-REV is able to achieve a high driving range without letting the NPV get out of control. Incremental capital cost increases are necessary to extend the driving range of a FC-REV, primarily in the form of increased fuel cell power and hydrogen storage. In addition to increases in capital cost, the FC-REV designs see fueling costs increase nearly proportional to VMT.
However, it is again the CV that wins out in this near-term lifecycle cost analysis. The CV design achieves the lowest NPV across all range requirements with NPV being
Wood et al / SAE Int. J. Commer. Veh. / Volume 6, Issue 2(October 2013) 569
directly proportional to VMT. And while markers have been placed for CV designs with <100 miles of range, it is not expected that any commercial CV would store less than 100 miles of diesel fuel, giving the CV an even greater advantage in the low range capability design space.
Given present day economic assumptions, the optimized FC-REV designs were unable to outpace the NPV of a CV under any driving range requirement. However, it is unclear how this comparison might change relative to a different set of economic conditions or under different distributions of daily VMT. The following section sheds light on the matter by exploring lifecycle costs under an array of hydrogen, battery, and diesel costs in addition to vehicle-specific drive patterns.
Sensitivity to Economic Climate and Duty Cycle
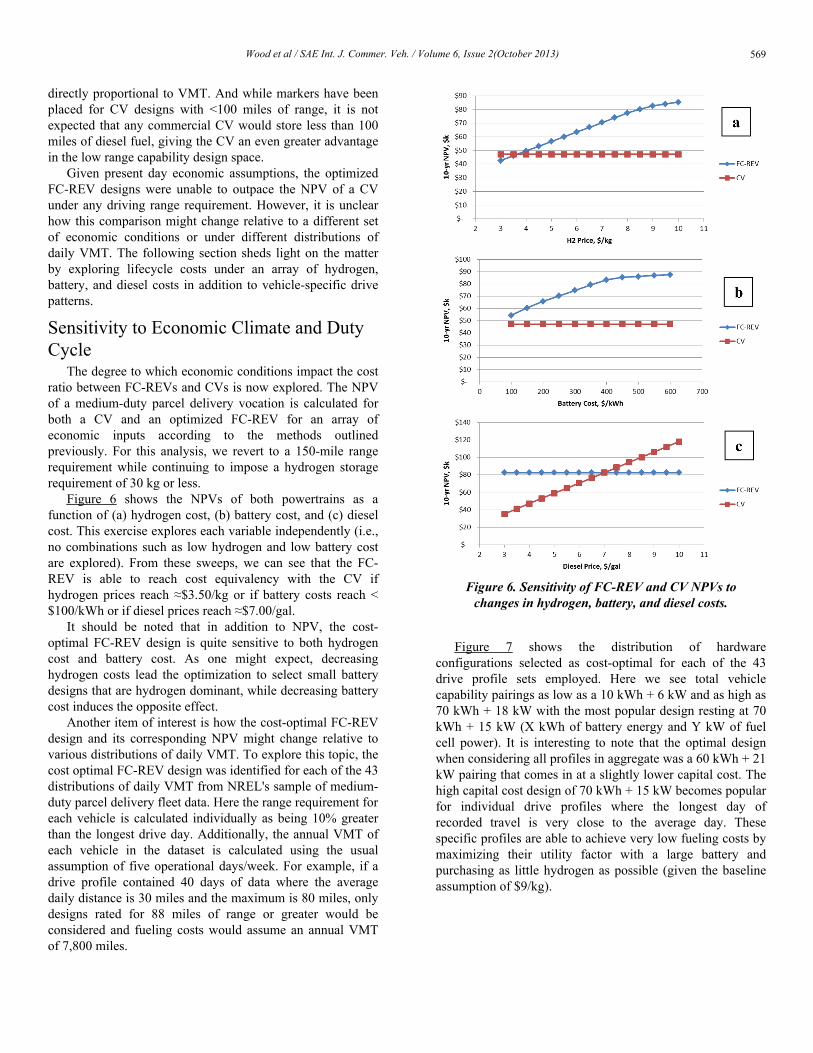
The degree to which economic conditions impact the cost ratio between FC-REVs and CVs is now explored. The NPV of a medium-duty parcel delivery vocation is calculated for both a CV and an optimized FC-REV for an array of economic inputs according to the methods outlined previously. For this analysis, we revert to a 150-mile range requirement while continuing to impose a hydrogen storage requirement of 30 kg or less.
Figure 6 shows the NPVs of both powertrains as a function of (a) hydrogen cost, (b) battery cost, and (c) diesel cost. This exercise explores each variable independently (i.e., no combinations such as low hydrogen and low battery cost are explored). From these sweeps, we can see that the FC-REV is able to reach cost equivalency with the CV if hydrogen prices reach ≈$3.50/kg or if battery costs reach < $100/kWh or if diesel prices reach ≈$7.00/gal.
It should be noted that in addition to NPV, the cost-optimal FC-REV design is quite sensitive to both hydrogen cost and battery cost. As one might expect, decreasing hydrogen costs lead the optimization to select small battery designs that are hydrogen dominant, while decreasing battery cost induces the opposite effect.
Another item of interest is how the cost-optimal FC-REV design and its corresponding NPV might change relative to various distributions of daily VMT. To explore this topic, the cost optimal FC-REV design was identified for each of the 43 distributions of daily VMT from NREL's sample of medium-duty parcel delivery fleet data. Here the range requirement for each vehicle is calculated individually as being 10% greater than the longest drive day. Additionally, the annual VMT of each vehicle in the dataset is calculated using the usual assumption of five operational days/week. For example, if a drive profile contained 40 days of data where the average daily distance is 30 miles and the maximum is 80 miles, only designs rated for 88 miles of range or greater would be considered and fueling costs would assume an annual VMT of 7,800 miles.
Figure 6. Sensitivity of FC-REV and CV NPVs to changes in hydrogen, battery, and diesel costs.
Figure 7 shows the distribution of hardware configurations selected as cost-optimal for each of the 43 drive profile sets employed. Here we see total vehicle capability pairings as low as a 10 kWh + 6 kW and as high as 70 kWh + 18 kW with the most popular design resting at 70 kWh + 15 kW (X kWh of battery energy and Y kW of fuel cell power). It is interesting to note that the optimal design when considering all profiles in aggregate was a 60 kWh + 21 kW pairing that comes in at a slightly lower capital cost. The high capital cost design of 70 kWh + 15 kW becomes popular for individual drive profiles where the longest day of recorded travel is very close to the average day. These specific profiles are able to achieve very low fueling costs by maximizing their utility factor with a large battery and purchasing as little hydrogen as possible (given the baseline assumption of $9/kg).

570 Wood et al / SAE Int. J. Commer. Veh. / Volume 6, Issue 2(October 2013)
Figure 7. Hardware distribution for FC-REVoptimization performed over 43 unique distributions of
daily distance traveled.
Figure 8. Distribution of cost ratios between individually optimized FC-REVs and their CV counterparts.
Lastly, the NPV of each of the individually optimized design is compared to the NPV of a CV over the identical distribution of daily VMT. In this way, a cost ratio for each vehicle is calculated as the NPV of the optimized FC-REV design divided by the NPV of the CV (i.e., a profile where the FC-REV NPV is less than the CV NPV would have a cost ratio less than one). Figure 8 shows the distribution of this cost ratio in addition to the cost ratio of the FC-REV
designed for 150 miles of range and applied to the fleet data in aggregate. While none of the individually optimized FC-REV designs are able to achieve cost equivalency with their CV counterparts (given the baseline assumptions), it can be seen that optimizing the design of the FC-REV to specific distributions of daily VMT can decrease NPV by up to 20%.
SUMMARY This analysis has examined the potential for hydrogen
fuel cells to be used as a range-extending power unit for medium-duty BEVs. Near-term economic conditions and real-world vocational data have been employed to make comparisons with battery electric and conventional vehicles. Market conditions necessary for FC-REVs to be competitive for conventional technology have been identified.
Major conclusions from this work include:
1. Specification of cost-optimal hardware/software combinations for FC-REVs is very sensitive to assumptions regarding economic climate and driving profile.
2. Equivalent NPV can be achieved using disparate combinations of battery size and fuel cell maximum power.
3. The FC-REV is an attractive powertrain configuration for achieving high single-charge driving range (>60 mi) with zero-emissions capability while maintaining reasonable capital costs.
4. While not currently cost effective with regard to conventional diesel technology, FC-REVs are expected to become increasingly competitive as the cost of hydrogen production and battery manufacturing come down and petroleum costs increase.
5. Accurate knowledge of a vehicle's driving profile offers the potential to significantly decrease lifecycle costs by selection of the cost-optimal FC-REV powertrain configuration.
REFERENCES 1. National Renewable Energy Laboratory, Transportation and Hydrogen
Systems Center, Future Automotive Systems Technology Simulator,http://www.nrel.gov/vehiclesandfuels/vsa/fastsim.html.
2. Field data from Smith Newton parcel delivery vehicle provided bySmith Electric Vehicles via personal communication, Jan 2013.
3. Howell, D., “U.S. Battery R&D Progress and Plans,” U.S. Departmentof Energy, Vehicle Technologies Office, Presented at the 2013 Hydrogen and Vehicle Technologies Annual Merit Review and PeerEvaluation Meetings, 13-17 May 2013, Arlington, Virginia.
4. Manufacturing cost assumptions generated by Strategic AnalysisIncorporated and provided via personal communication, Jan 2013.
5. Rogozhin, A., Gallaher, M., Helfand, G., and McManus, W., “UsingIndirect Cost Multipliers to Estimate the Total Cost of Adding NewTechnology in The Automobile Industry,” International Journal of Production Economics, Apr 2010, 124 (2) 360-368, http://www.sciencedirect.com/science/article/pii/S0925527309004344.
6. U.S. Energy Information Administration, “Electricity Prices,” accessedJuly 2013, http://www.eia.gov/electricity/monthly/
7. Douba, M., Rask, E., and Meyer, M., “Advanced Powertrain ResearchFacility AVTA Nissan Leaf Testing and Analysis” Argonne NationalLaboratory, Oct 2012, http://www.transportation.anl.gov/D3/data/2012_nissan_leaf/AVTALeaftestinganalysis_Major%20summary101212.pdf.

Wood et al / SAE Int. J. Commer. Veh. / Volume 6, Issue 2(October 2013) 571
8. National Renewable Energy Laboratory, Transportation and HydrogenSystems Center, Fleet Testing and Evaluation Activity, http://www.nrel.gov/vehiclesandfuels/fleettest/.
9. The New York Time, “In Investing, It's When You Start And When YouFinish,” accessed July 2013, http://www.nytimes.com/interactive/2011/01/02/business/20110102-metrics-graphic.html?_r=2&.
10.U.S. Energy Information Administration, “Gasoline and Diesel Prices,”accessed July 2013, http://www.eia.gov/petroleum/gasdiesel/.
11.Eudy, L., Chandler, K., and Gikakis, C., “Fuel Cell Buses in U.S.Transit Fleets: Current Status 2012,” NREL Technical PaperTP-5600-56406, November 2012. http://www.nrel.gov/docs/fy13osti/56406.pdf
12.High-Efficiency Truck Users Forum and CalStart, “Demand Assessmentof First-Mover Hybrid and Electric Truck Fleets, 2012-2016,” PublishedOctober 2012.
CONTACT INFORMATION Transportation and Hydrogen Systems Center National Renewable Energy Laboratory 15013 Denver West Pkwy MS 1634 Golden, CO 80401
Eric Wood (303) 275-3290 [email protected]
Lijuan (Joann) Wang (303) 275-4436 [email protected]
Jeffrey Gonder (303) 275-4462 [email protected]
Michael Ulsh (303) 275-3842 [email protected]
ACKNOWLEDGMENTS This study was supported by the Fuel Cell Technologies
Office under contract number DE-AC36-08-GO28308 by way of the U.S. Department of Energy's Office of Energy Efficiency and Renewable Energy. The authors would specifically like to thank Pete Devlin of the U.S. Department of Energy for his guidance and support. Use of the FASTSim vehicle modeling tool, developed at the National Renewable Energy Laboratory under funding from the U.S. Department of Energy's Vehicle Technologies Office, was critical to the completion of this study. Special thanks to Aaron Brooker for supporting our use of FASTSim.
DEFINITIONS/ABBREVIATIONS BEV - battery electric vehicle CD - charge depleting CS - charge sustaining CV - conventional vehicle
FASTSim - Future Automotive Systems Technology Simulator FC-HEV - fuel cell hybrid electric vehicle FC-REV - fuel cell range extended vehicle H2 - hydrogen
HD UDDS - Heavy Duty Urban Dynamometer Driving Schedule HEV - hybrid electric vehicle NPV - net present value NREL - National Renewable Energy Laboratory NYCC - New York City Cycle OC Bus - Orange County Bus SA - Strategic Analysis Incorporated SOC - state of charge VMT - vehicle miles traveled
572 Wood et al / SAE Int. J. Commer. Veh. / Volume 6, Issue 2(October 2013)
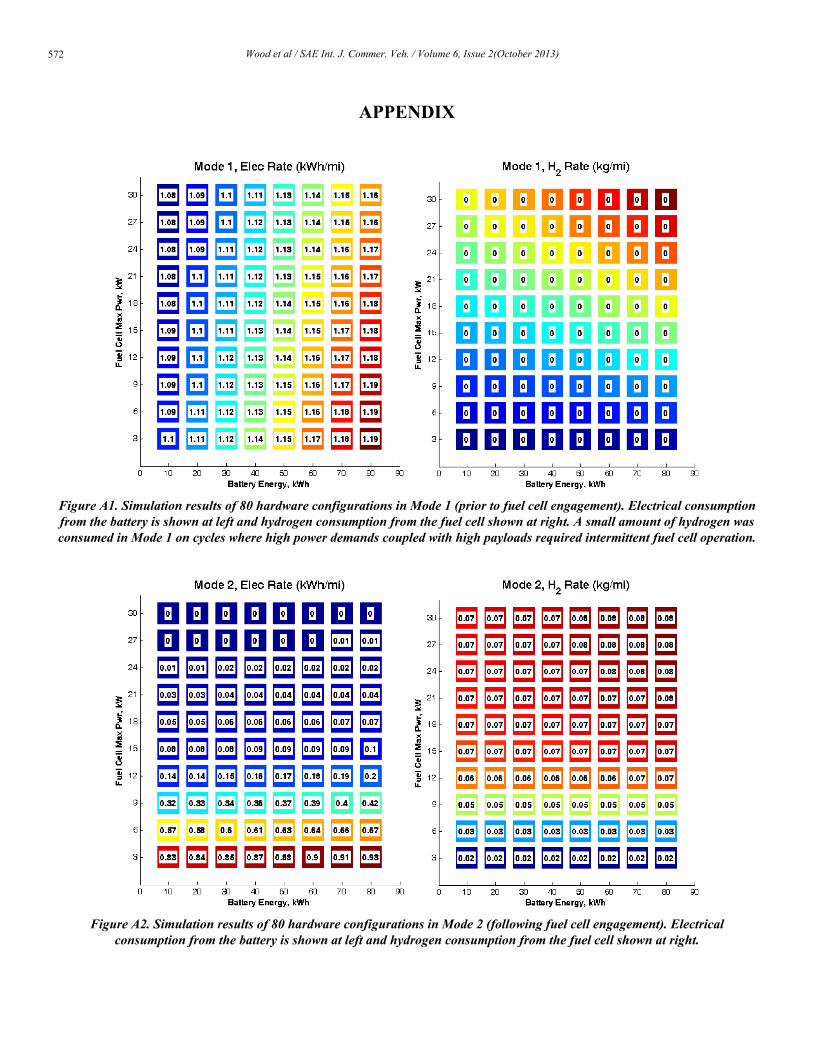
APPENDIX
Figure A1. Simulation results of 80 hardware configurations in Mode 1 (prior to fuel cell engagement). Electrical consumptionfrom the battery is shown at left and hydrogen consumption from the fuel cell shown at right. A small amount of hydrogen wasconsumed in Mode 1 on cycles where high power demands coupled with high payloads required intermittent fuel cell operation.
Figure A2. Simulation results of 80 hardware configurations in Mode 2 (following fuel cell engagement). Electricalconsumption from the battery is shown at left and hydrogen consumption from the fuel cell shown at right.

Wood et al / SAE Int. J. Commer. Veh. / Volume 6, Issue 2(October 2013) 573
Figure A3. Hydrogen storage required to achieve simultaneous battery and hydrogen depletion shown at left; resultant totaldriving range shown at right.
Figure A4. Capital cost of hardware combination (battery, fuel cell system, and hydrogen storage only) shown at left; combinedMode 1 and Mode 2 energy cost per mile shown at right.
574 Wood et al / SAE Int. J. Commer. Veh. / Volume 6, Issue 2(October 2013)
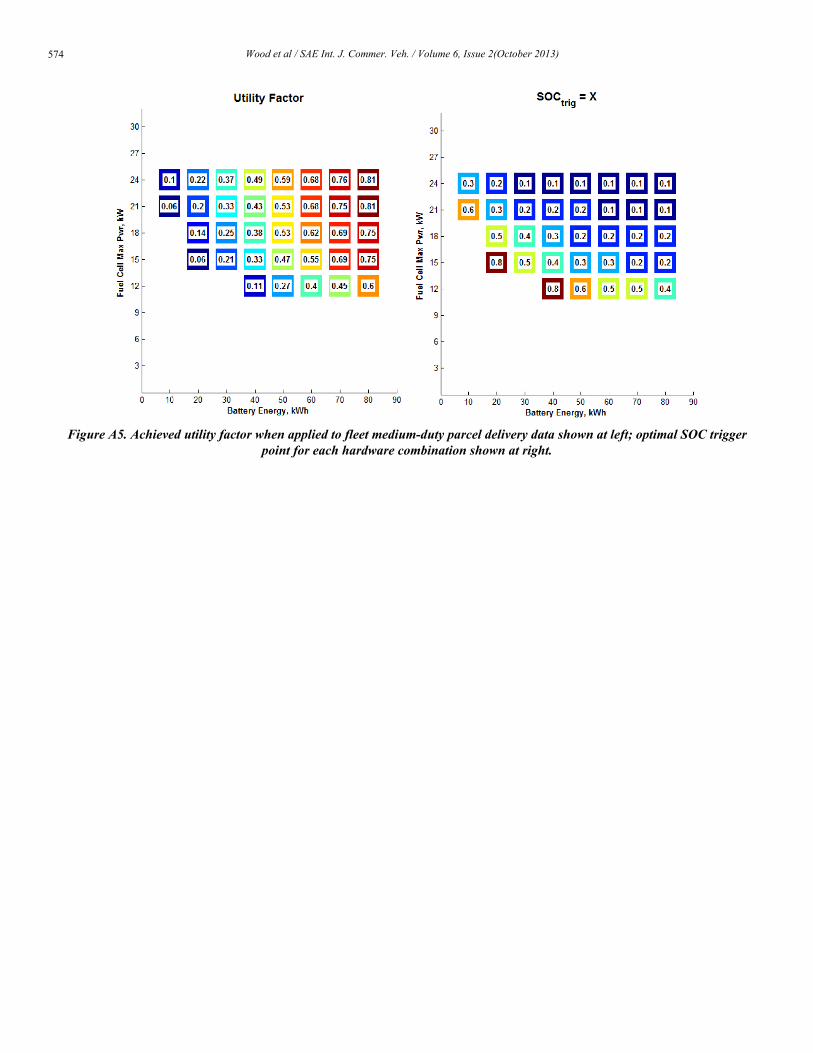
Figure A5. Achieved utility factor when applied to fleet medium-duty parcel delivery data shown at left; optimal SOC triggerpoint for each hardware combination shown at right.