overconsumption? our use of the world's natural resources · overconsumption? our use of the...
TRANSCRIPT
OVERCONSUMPTION? Our use of the world s natural resources
2 | OVERCONSUMPTION? Our use of the world’s natural resources
This repOrT was financially suppOrTed by
CREDITS: RESEARCH: Sustainable Europe Research Institute (SERI), Austria and GLOBAL 2000 (Friends of the Earth Austria) – IN COOPERATION WITH: Institute for Economic Structures Research (GWS), Germany – TEXT: Stefan Giljum, Friedrich Hinterberger, Martin Bruckner, Eva Burger, Johannes Frühmann, Stephan Lutter, Elke Pirgmaier, Christine Polzin, Hannes Waxwender, Lisa Kernegger, Michael Warhurst – INFO-GRAPHICS: Roswitha Peintner ACKNOWLEDGEMENTS: We thank Nicky Stocks, Becky Slater, Kenneth Richter and Hannah Griffiths from Friends of the Earth England, Wales and Northern Ireland (FoE EWNI) as well as Christian Lutz and Bernd Meyer from GWS for their assistance with the content of this report. – EDITING: Becky Slater and Michael Warhurst – PRODUCTION: Lisa Kernegger and Stefan Giljum – DESIGN: Hannes Hofbauer – PHOTO-EDITING: Steve Wyckoff – PHOTOS: Jiri Rezac/WWF-UK (p5), iStockphoto (p8, p11, p16, p18, p21, p22, p25, p28, p31), Elaine Gilligan/FoE EWNI (p12), Asociación Civil LABOR (p13), Aulia Erlangga/FoE EWNI (p14), Michael Common/Green Net (p19), Michael Warhurst/FoE EWNI (p30, p32), Cover: iStockphoto – PRINTING: Janetschek, A-3860 Heidenreichstein, www.janetschek.at – PRINTED ON 100% RECYCLED PAPER© SERI, GLOBAL 2000, Friends of the Earth Europe, September 2009
Federal Environment Agency, Germany
Federal Ministry of Agriculture, Forestry, Environment and Water Management, Austria
Friends of the Earth England, Wales and Northern Ireland
Working Committee “Forum mineralische Rohstoffe”of the Austrian association for building materials and ceramic industries
SUPPORTEDBY

OVERCONSUMPTION? Our use of the world’s natural resources | 3
N atural resources, including materials, water, energy and
fertile land, are the basis for our life on Earth. However,
humanity’s rapidly growing consumption of these resources
is causing severe damage. Our climate is changing; fresh
water reserves, fish stocks and forests are shrinking; fertile
land is being destroyed and species are becoming
extinct. In order to continue to thrive on this planet, our
lifestyles will need to become more sustainable, so that
we are able to protect our natural resource base and
the fragile eco-systems on our planet. We consider that
it is essential to start a debate about European resource
use and its environmental and social impacts around the
world. In order to help facilitate this debate, this report
aims to provide a compilation of information on current
trends in European and global resource use. This report
focuses on biotic and abiotic materials, and is intended
to be the first in a series of reports on different aspects of
natural resource use.
Humans today extract and use around 50% more natural resources than only 30 years ago, at about 60 billion tonnes of raw materials a year. This is
equivalent to the weight of around 41,000 Empire State
Buildings. Increasing resource extraction doesn’t just lead
to environmental problems, but is often also linked to
social problems such as human rights violations and poor
working conditions. These negative environmental and
social impacts are most strongly felt in African, Latin
American and Asian countries with low environmental
and social standards. Given current trends of growth, our
extraction of natural resources could increase to 100
billion tonnes by 2030.
People in rich countries consume up to 10 times more natural resources than those in the poorest countries. On average, an inhabitant of North America consumes
around 90 kilograms (kg) of resources each day. In Europe,
consumption is around 45 kg per day, while in Africa
people consume only around 10 kg per day.
With almost 3 tonnes per capita per year, Europe is the continent with the highest net-imports of resources.
Europe thus benefits from a major transfer of resources
from poorer, low consuming countries to richer, high con-
suming countries. The current world trade system helps
support substantial inequalities in the distribution of the
use of natural resources. This raises important questions
for global justice.
The world economy today uses around 30% fewer resources to produce one Euro or Dollar of GDP than 30 years ago; however, overall resource use is still increasing. Resource efficiency has improved steadily in
Europe and globally. However, as we consume growing
amounts of products and services, this positive trend is more
than outweighed by the overall growth of our economies.
In order to create a more sustainable and equitable world, regions with high levels of per-capita resource use, such as Europe, will need to sharply decrease their resource use in absolute terms. This reduction
in resource use in richer regions will give poorer regions
the chance to increase their resource use as they overcome
poverty and increase their quality of life. This principle is
already well established in the global debate on climate
targets, and it needs to be extended to the area of resource
use.
Short-term actions can get Europe and other rich countries on the right track. These include implementing
policy measures that increase the prices of natural resour-
ces and reward resource-efficient behaviour, exploiting
resource efficiency within companies, increasing recycling
and informing consumers about their options to reduce the
use of natural resources.
More fundamental questions about economics, deve-lopment and resources need to be addressed in the medium term. Most significantly, “How can new models of
development be created in Europe and other industrialised
countries that focus on well-being instead of increased
production and consumption?” This will require rethinking
the role of economic growth and the links between resource
use, quality of life and happiness.
execuTive summary
4 | OVERCONSUMPTION? Our use of the world’s natural resources
1. inTrOducTiOn ............................................................................................................................................................... 5
2. The hisTOry Of human resOurce use ....................................................................................................... 7
3. exTracTiOn Of resOurces .................................................................................................................................. 9
4. Trade in resOurces .............................................................................................................................................. 15
5. cOnsumpTiOn Of resOurces ......................................................................................................................... 20
6. resOurce efficiency ............................................................................................................................................ 23
7. scenariOs fOr fuTure resOurce use ..................................................................................................... 26
8. TOwards susTainable resOurce use ...................................................................................................... 29
Oil exTracTiOn and Gas flarinG in The niGer delTa ........................................................................ 12
cOpper mininG and smelTinG in peru .......................................................................................................... 13
palm Oil prOducTiOn in indOnesia and malaysia .............................................................................. 14
subsidised eurOpean milK flOOdinG The marKeT in burKina fasO ...................................... 18
expOrT Of fair Trade OrGanic hOm mali (Jasmine rice) frOm Thailand .......................... 19
mObile phOnes: relaTive imprOvemenTs, buT absOluTe GrOwTh ........................................... 25
recyclinG in flanders ............................................................................................................................................ 32
Table Of cOnTenTs
lisT Of case sTudies
OVERCONSUMPTION? Our use of the world’s natural resources | 5
1. inTrOducTiOn
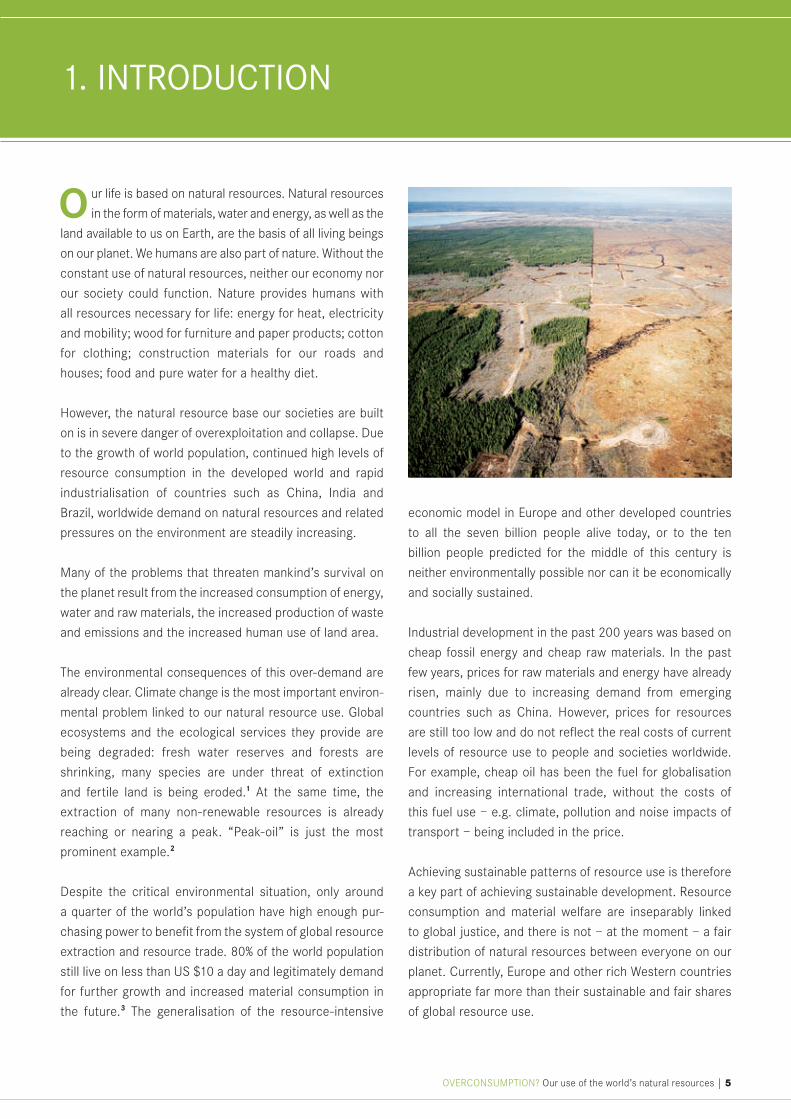
O ur life is based on natural resources. Natural resources
in the form of materials, water and energy, as well as the
land available to us on Earth, are the basis of all living beings
on our planet. We humans are also part of nature. Without the
constant use of natural resources, neither our economy nor
our society could function. Nature provides humans with
all resources necessary for life: energy for heat, electricity
and mobility; wood for furniture and paper products; cotton
for clothing; construction materials for our roads and
houses; food and pure water for a healthy diet.
However, the natural resource base our societies are built
on is in severe danger of overexploitation and collapse. Due
to the growth of world population, continued high levels of
resource consumption in the developed world and rapid
industrialisation of countries such as China, India and
Brazil, worldwide demand on natural resources and related
pressures on the environment are steadily increasing.
Many of the problems that threaten mankind’s survival on
the planet result from the increased consumption of energy,
water and raw materials, the increased production of waste
and emissions and the increased human use of land area.
The environmental consequences of this over-demand are
already clear. Climate change is the most important environ-
mental problem linked to our natural resource use. Global
ecosystems and the ecological services they provide are
being degraded: fresh water reserves and forests are
shrinking, many species are under threat of extinction
and fertile land is being eroded.1 At the same time, the
extraction of many non-renewable resources is already
reaching or nearing a peak. “Peak-oil” is just the most
prominent example.2
Despite the critical environmental situation, only around
a quarter of the world’s population have high enough pur-
chasing power to benefit from the system of global resource
extraction and resource trade. 80% of the world population
still live on less than US $10 a day and legitimately demand
for further growth and increased material consumption in
the future.3 The generalisation of the resource-intensive
economic model in Europe and other developed countries
to all the seven billion people alive today, or to the ten
billion people predicted for the middle of this century is
neither environmentally possible nor can it be economically
and socially sustained.
Industrial development in the past 200 years was based on
cheap fossil energy and cheap raw materials. In the past
few years, prices for raw materials and energy have already
risen, mainly due to increasing demand from emerging
countries such as China. However, prices for resources
are still too low and do not reflect the real costs of current
levels of resource use to people and societies worldwide.
For example, cheap oil has been the fuel for globalisation
and increasing international trade, without the costs of
this fuel use – e.g. climate, pollution and noise impacts of
transport – being included in the price.
Achieving sustainable patterns of resource use is therefore
a key part of achieving sustainable development. Resource
consumption and material welfare are inseparably linked
to global justice, and there is not – at the moment – a fair
distribution of natural resources between everyone on our
planet. Currently, Europe and other rich Western countries
appropriate far more than their sustainable and fair shares
of global resource use.
6 | OVERCONSUMPTION? Our use of the world’s natural resources
We need to start taking action now to move towards more
sustainable use of our natural resources. Rich countries
should support developing countries in overcoming poverty
and increasing the future material welfare of their inhabi-
tants. However, in a world increasingly facing physical limits
(most obviously the global climate system), this requires
that countries with high levels of per-capita resource con-
sumption sharply decrease their share of global resource
use in absolute terms. The group of G8 countries, with the
highest economic importance, recently stated the goal to
reduce their greenhouse gas emissions by 80% by 2050.
A similar if not even more ambitious target is also required
for our general resource use.4
A strategy of reducing resource use will not only diminish the
pressures on the global environment. Running a resource-
efficient economy will also be a competitive advantage in a
world with rising commodity prices and increased resource
constraints.
This report aims to provide empirical evidence on current
trends in resource use in different world regions and its
environmental and social impacts. We want to emphasise
the importance of resource use and resource management
for world-wide sustainable development and to support
related policy processes and campaigns.
Natural resources comprise a number of different env-
ironmental categories: biotic materials such as cereals or
timber, abiotic materials such as minerals and fossil fuels,
energy, water, land area and fertile soil.
This report focuses on biotic and abiotic materials, and is
intended to be the first in a series of reports on different
aspects of natural resource use. Future editions of the report
will focus on other resource categories, such as water and
land area.
In our globalised world, resources are used in complex
world-wide networks. These networks include countries
where resources are extracted, international trade in re-
sources and countries where resources are consumed. In
order to illustrate current challenges related to resource
use, many economic and environmental aspects have to
be addressed.
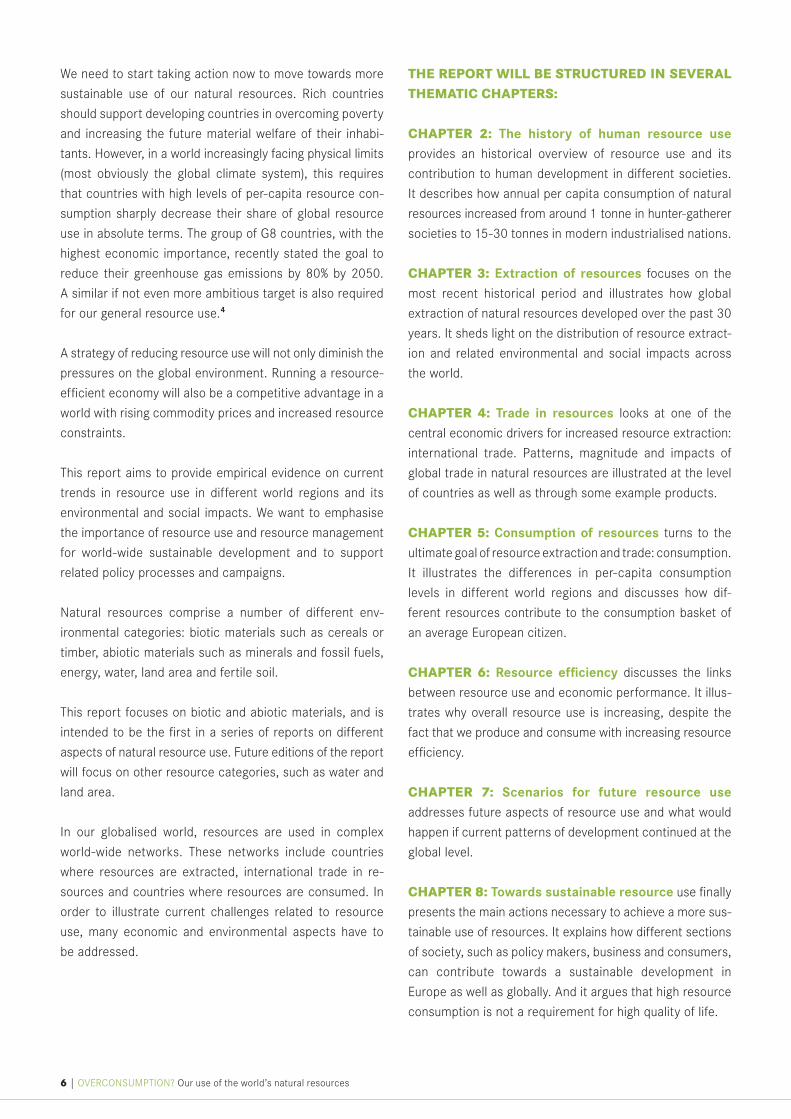
THE REPORT WILL BE STRUCTURED IN SEVERAL THEMATIC CHAPTERS:
CHAPTER 2: The history of human resource use
provides an historical overview of resource use and its
contribution to human development in different societies.
It describes how annual per capita consumption of natural
resources increased from around 1 tonne in hunter-gatherer
societies to 15-30 tonnes in modern industrialised nations.
CHAPTER 3: Extraction of resources focuses on the
most recent historical period and illustrates how global
extraction of natural resources developed over the past 30
years. It sheds light on the distribution of resource extract-
ion and related environmental and social impacts across
the world.
CHAPTER 4: Trade in resources looks at one of the
central economic drivers for increased resource extraction:
international trade. Patterns, magnitude and impacts of
global trade in natural resources are illustrated at the level
of countries as well as through some example products.
CHAPTER 5: Consumption of resources turns to the
ultimate goal of resource extraction and trade: consumption.
It illustrates the differences in per-capita consumption
levels in different world regions and discusses how dif-
ferent resources contribute to the consumption basket of
an average European citizen.
CHAPTER 6: Resource efficiency discusses the links
between resource use and economic performance. It illus-
trates why overall resource use is increasing, despite the
fact that we produce and consume with increasing resource
efficiency.
CHAPTER 7: Scenarios for future resource use addresses future aspects of resource use and what would
happen if current patterns of development continued at the
global level.
CHAPTER 8: Towards sustainable resource use finally
presents the main actions necessary to achieve a more sus-
tainable use of resources. It explains how different sections
of society, such as policy makers, business and consumers,
can contribute towards a sustainable development in
Europe as well as globally. And it argues that high resource
consumption is not a requirement for high quality of life.
OVERCONSUMPTION? Our use of the world’s natural resources | 7
2. The hisTOry Of human resOurce use
I n human history, societies were always dependent on the
use of natural resources. But different forms of societies
consumed dramatically different levels of natural resouces.
From the Stone Age until today, the per capita consumption
of natural resources has grown by a factor of 15 to 30. The
cultural development of mankind is also the history of an
ever intensified exploitation of natural resources.
Early social systems such as those of hunter-gatherers,
as well as early agrarian societies, were mainly dependent
upon the use of renewable natural resources such as wood
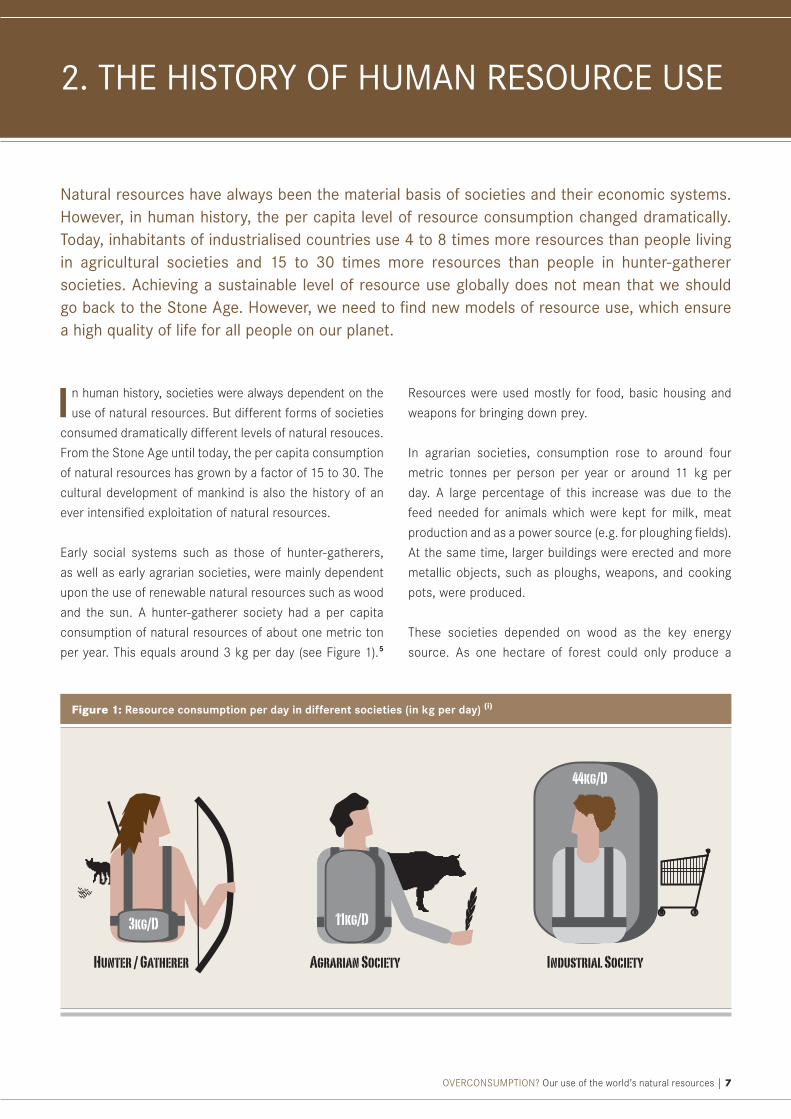
and the sun. A hunter-gatherer society had a per capita
consumption of natural resources of about one metric ton
per year. This equals around 3 kg per day (see Figure 1).5
Resources were used mostly for food, basic housing and
weapons for bringing down prey.
In agrarian societies, consumption rose to around four
metric tonnes per person per year or around 11 kg per
day. A large percentage of this increase was due to the
feed needed for animals which were kept for milk, meat
production and as a power source (e.g. for ploughing fields).
At the same time, larger buildings were erected and more
metallic objects, such as ploughs, weapons, and cooking
pots, were produced.
These societies depended on wood as the key energy
source. As one hectare of forest could only produce a
natural resources have always been the material basis of societies and their economic systems. however, in human history, the per capita level of resource consumption changed dramatically. Today, inhabitants of industrialised countries use 4 to 8 times more resources than people living in agricultural societies and 15 to 30 times more resources than people in hunter-gatherer societies. achieving a sustainable level of resource use globally does not mean that we should go back to the stone age. however, we need to find new models of resource use, which ensure a high quality of life for all people on our planet.
11kg/D
44kg/D
3kg/D
Hunter / Gatherer Agrarian Society Industrial Society
Figure 1: Resource consumption per day in different societies (in kg per day) (i)

8 | OVERCONSUMPTION? Our use of the world’s natural resources
limited amount of wood each year, the energy available to
these societies was limited. The population and the eco-
nomy, which both depend on energy, therefore faced a limit
to growth.
The Industrial Revolution in the 18th century launched the
most important change in natural resource use to date.
With the use of fossil fuels – at first coal, later also oil and
gas – suddenly much more energy was available to man-
kind. The use of fossil fuels, produced over millions of years,
created an apparent energy surplus for human societies.
This surplus was the precondition for the economic growth
that has continued until today. It was the availability of en-
ergy in a cheaper and more concentrated form that allowed
a sharp increase in the production of goods and services.
Population has also grown steadily since the Industrial
Revolution, mainly because the use of ever more machines
and ever greater amounts of fertiliser allowed a constant
increase in harvest yields per hectare of cultivated land.
Therefore, one hectare of arable land today feeds many
more people than it did in agrarian societies, which were
limited to the use of human and animal labour and had no
chemical fertilisers.
However, progress has had an environmental price, as
the consumption of resources has risen dramatically. One
resident of an industrialised country today uses fifteen to
thirty-five tonnes of raw materials and products annually –
a multi-fold increase in comparison to agrarian societies.6
Today, hunter-gatherer and agrarian societies are still pre-
sent on the planet. Hunter-gatherer societies are found in
the rainforests of Amazonia and Papua New Guinea. How-
ever, these forms of societies have been almost completely
eliminated. Agricultural societies make up large parts of the
global South, in Africa, Asia and Latin America. However,
an ever larger share of global population has moved into
industrial societies and urban lifestyles.
With a growing global population, economy and affluence,
our consumption of nature also grows. It would help us
tremendously if global ecosystems would grow accordingly
– but we cannot change the size of our planet.
How can we become more sustainable without going back
to the Stone Age and renouncing the comfort of modern
life? In a world increasingly facing physical limits, we need
to find alternative approaches to human development and
wellbeing. Finding new models of resource use is one corner-
stone of such a new way of development. The challenge is
to ensure a high quality of life for today’s global population
of nearly 7 billion people, and for the 9-10 billion people
predicted for the middle of this century, without exceeding
the environmental capacities of our planet.
OVERCONSUMPTION? Our use of the world’s natural resources | 9
A s the world economy grows, humans extract and
harvest increasing amounts of natural resources from
ecosystems and mines – around 60,000 billion kg (or 60
billion tonnes) annually.7
Global annual extraction of natural resources equals the
weight of more than 41,000 Empire State Buildings, each
weighing around 365,000 tonnes (or 112 Empire State
Buildings every day).
These natural resources comprise renewable and non-re-
newable resources. Renewable materials include agricultural
products and fish to feed us and our livestock, and timber
to produce furniture and paper. Non-renewable resources
include fossil fuels that provide energy, metal ores used in
the manufacture of cars and computers, and industrial and
construction minerals used to build our houses and roads.
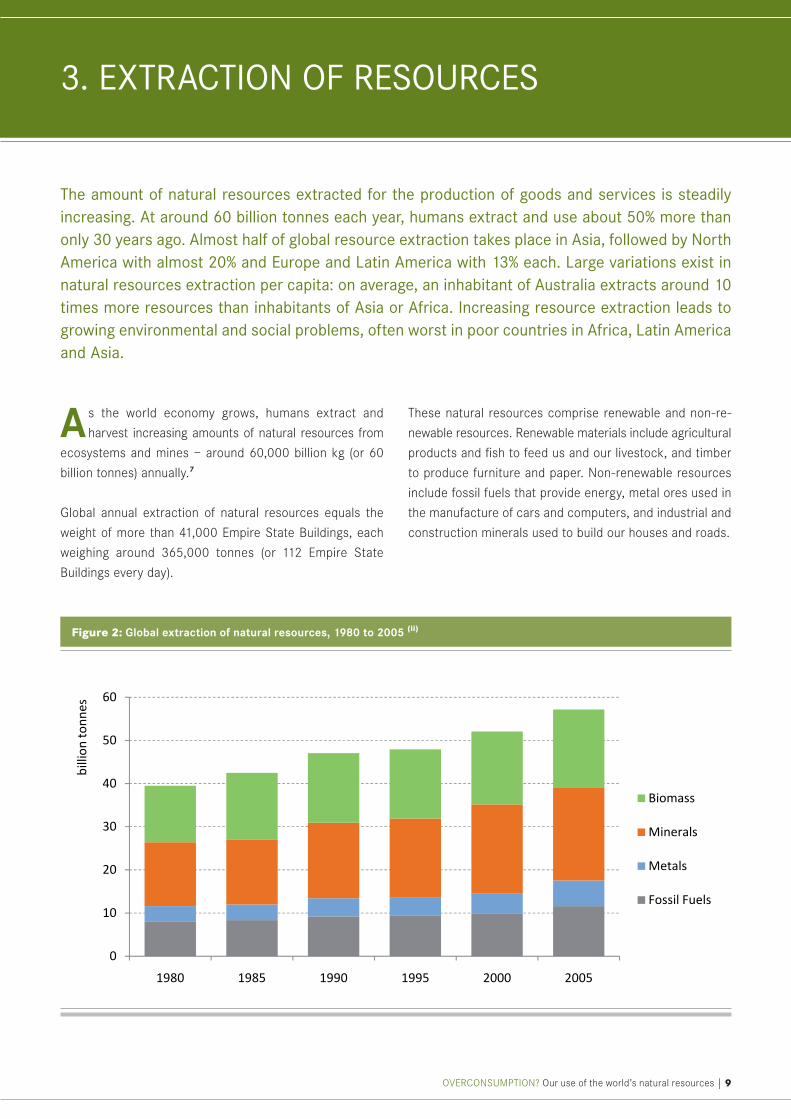
The amount of natural resources extracted for the production of goods and services is steadily increasing. at around 60 billion tonnes each year, humans extract and use about 50% more than only 30 years ago. almost half of global resource extraction takes place in asia, followed by north america with almost 20% and europe and latin america with 13% each. large variations exist in natural resources extraction per capita: on average, an inhabitant of australia extracts around 10 times more resources than inhabitants of asia or africa. increasing resource extraction leads to growing environmental and social problems, often worst in poor countries in africa, latin america and asia.
3. exTracTiOn Of resOurces
Figure 2: Global extraction of natural resources, 1980 to 2005 (ii)
10 | OVERCONSUMPTION? Our use of the world’s natural resources
Additional materials are extracted or removed from the soil
surface in order to get access to valuable resources, but are
not used in production processes themselves. Overburden
from mining activities is the most prominent example of
this. These materials account for a further annual extraction
of 40,000 billion kg (or 40 billion tonnes). All in all, we move
over 100 billion tonnes of material each year.
This annual extraction of natural resources is steadily in-
creasing. As more goods and services are produced each
year, more natural resources are required. In 1980, the
world economy extracted almost 40 billion tonnes. Up to
2005, this number grew to 58 billion tonnes, an increase of
almost 50% (Figure 2).
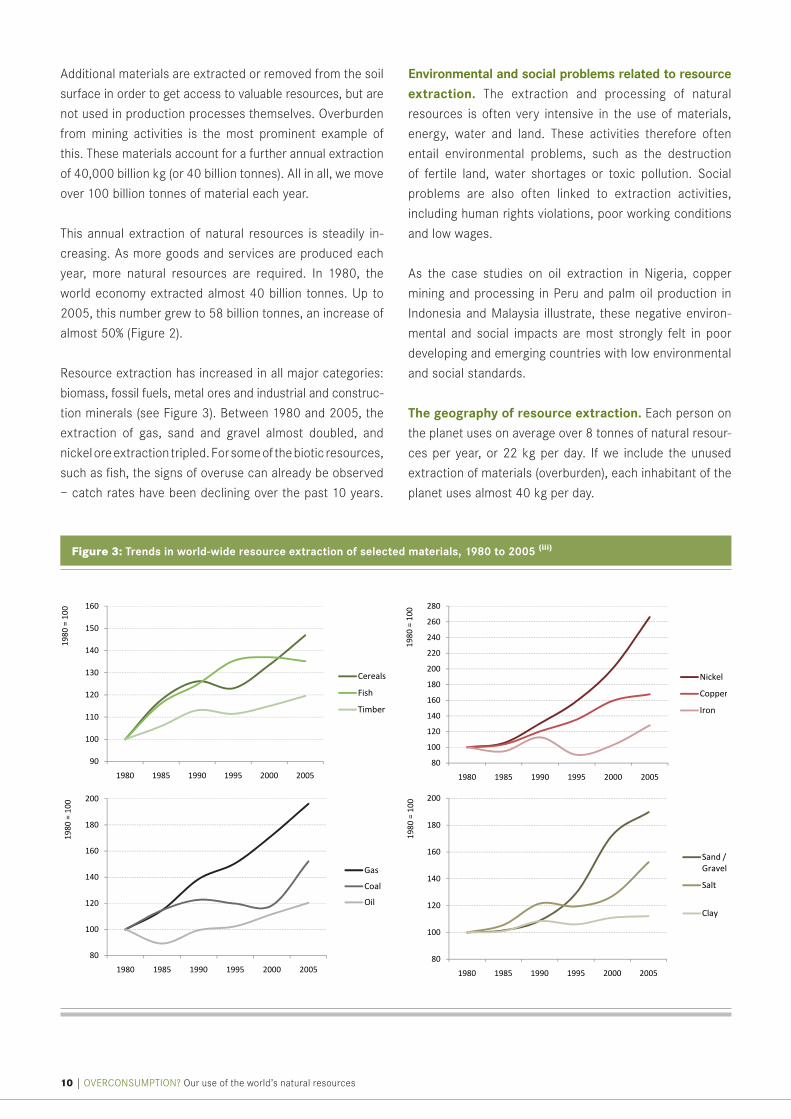
Resource extraction has increased in all major categories:
biomass, fossil fuels, metal ores and industrial and construc-
tion minerals (see Figure 3). Between 1980 and 2005, the
extraction of gas, sand and gravel almost doubled, and
nickel ore extraction tripled. For some of the biotic resources,
such as fish, the signs of overuse can already be observed
– catch rates have been declining over the past 10 years.
Environmental and social problems related to resource extraction. The extraction and processing of natural
resources is often very intensive in the use of materials,
energy, water and land. These activities therefore often
entail environmental problems, such as the destruction
of fertile land, water shortages or toxic pollution. Social
problems are also often linked to extraction activities,
including human rights violations, poor working conditions
and low wages.
As the case studies on oil extraction in Nigeria, copper
mining and processing in Peru and palm oil production in
Indonesia and Malaysia illustrate, these negative environ-
mental and social impacts are most strongly felt in poor
developing and emerging countries with low environmental
and social standards.
The geography of resource extraction. Each person on
the planet uses on average over 8 tonnes of natural resour-
ces per year, or 22 kg per day. If we include the unused
extraction of materials (overburden), each inhabitant of the
planet uses almost 40 kg per day.
Figure 3: Trends in world-wide resource extraction of selected materials, 1980 to 2005 (iii)
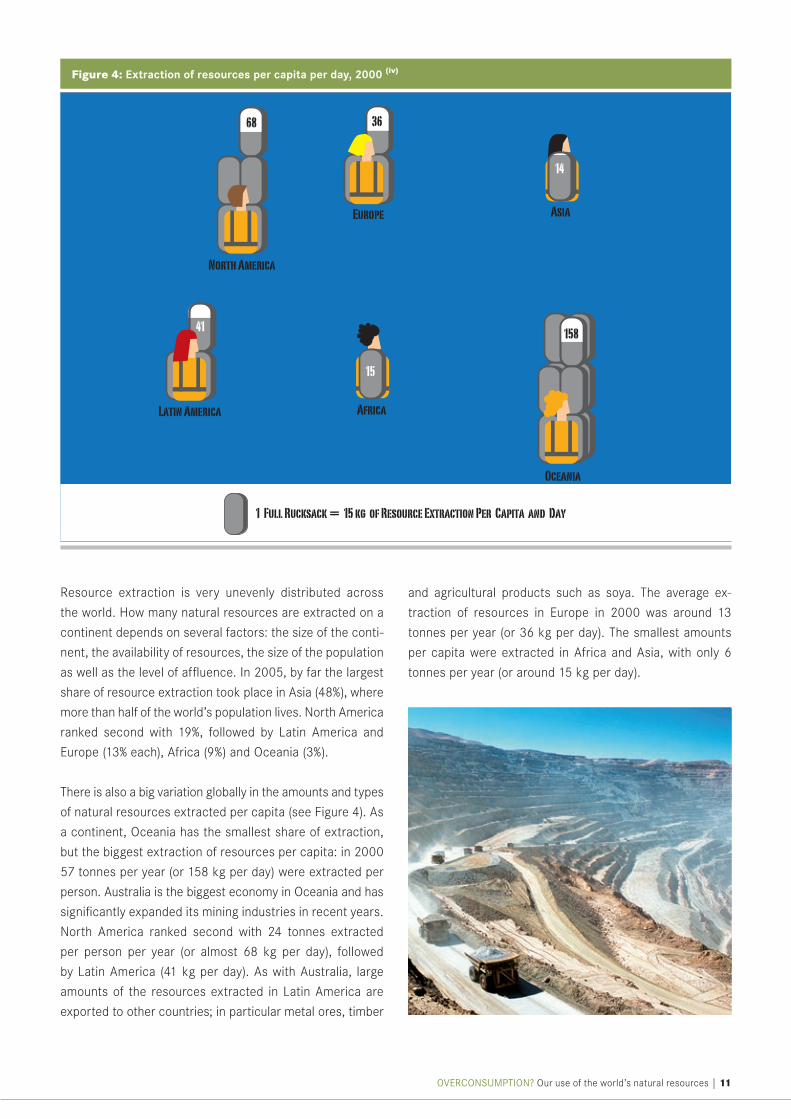
Resource extraction is very unevenly distributed across
the world. How many natural resources are extracted on a
continent depends on several factors: the size of the conti-
nent, the availability of resources, the size of the population
as well as the level of affluence. In 2005, by far the largest
share of resource extraction took place in Asia (48%), where
more than half of the world’s population lives. North America
ranked second with 19%, followed by Latin America and
Europe (13% each), Africa (9%) and Oceania (3%).
There is also a big variation globally in the amounts and types
of natural resources extracted per capita (see Figure 4). As
a continent, Oceania has the smallest share of extraction,
but the biggest extraction of resources per capita: in 2000
57 tonnes per year (or 158 kg per day) were extracted per
person. Australia is the biggest economy in Oceania and has
significantly expanded its mining industries in recent years.
North America ranked second with 24 tonnes extracted
per person per year (or almost 68 kg per day), followed
by Latin America (41 kg per day). As with Australia, large
amounts of the resources extracted in Latin America are
exported to other countries; in particular metal ores, timber
and agricultural products such as soya. The average ex-
traction of resources in Europe in 2000 was around 13
tonnes per year (or 36 kg per day). The smallest amounts
per capita were extracted in Africa and Asia, with only 6
tonnes per year (or around 15 kg per day).
1 Full Rucksack 15 kg of Resource Extraction Per Capita and Day — —
North America
Latin America
Europe Asia
Oceania
48,2 p.Day
88
100
14,40 kg/Day
10
34
Africa
14,40 kg/Day15
14
43 36
100
41
36
43 68
43 158
Figure 4: Extraction of resources per capita per day, 2000 (iv)
OVERCONSUMPTION? Our use of the world’s natural resources | 11
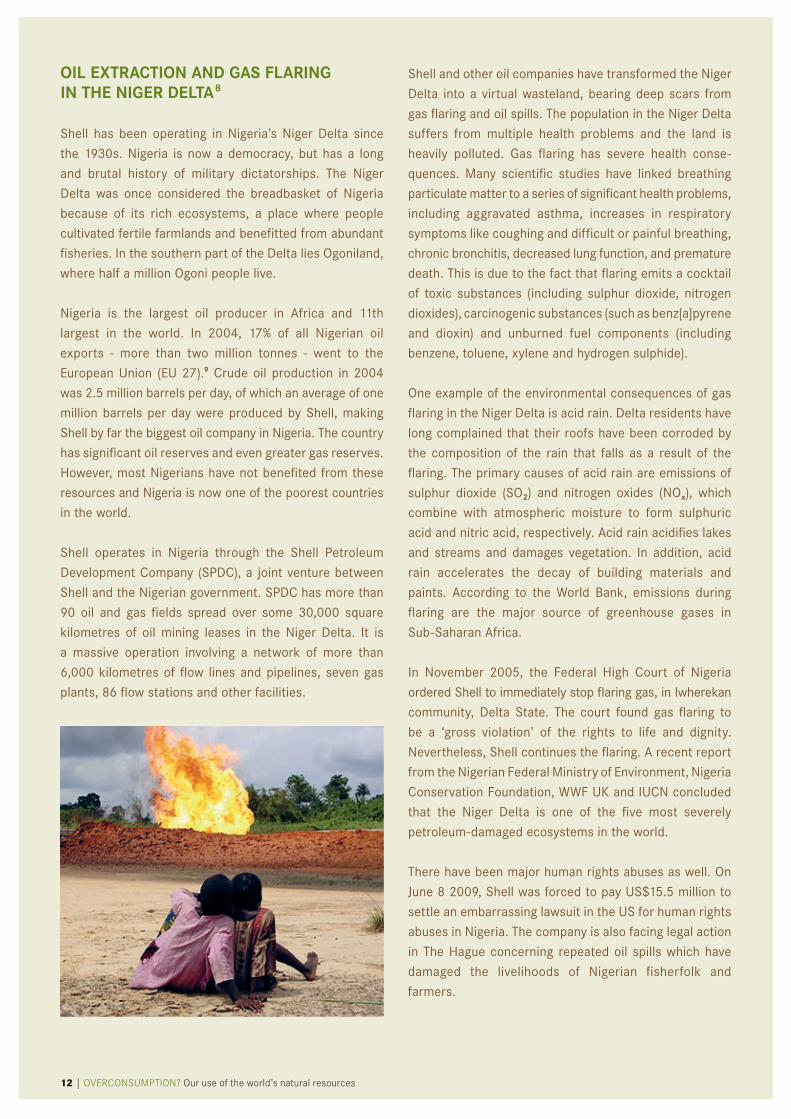
OIL EXTRACTION AND GAS FLARING IN THE NIGER DELTA 8
shell has been operating in nigeria’s niger delta since
the 1930s. nigeria is now a democracy, but has a long
and brutal history of military dictatorships. The niger
delta was once considered the breadbasket of nigeria
because of its rich ecosystems, a place where people
cultivated fertile farmlands and benefitted from abundant
fisheries. in the southern part of the delta lies Ogoniland,
where half a million Ogoni people live.
nigeria is the largest oil producer in africa and 11th
largest in the world. in 2004, 17% of all nigerian oil
exports - more than two million tonnes - went to the
european union (eu 27).9 crude oil production in 2004
was 2.5 million barrels per day, of which an average of one
million barrels per day were produced by shell, making
shell by far the biggest oil company in nigeria. The country
has significant oil reserves and even greater gas reserves.
however, most nigerians have not benefited from these
resources and nigeria is now one of the poorest countries
in the world.
shell operates in nigeria through the shell petroleum
development company (spdc), a joint venture between
shell and the nigerian government. spdc has more than
90 oil and gas fields spread over some 30,000 square
kilometres of oil mining leases in the niger delta. it is
a massive operation involving a network of more than
6,000 kilometres of flow lines and pipelines, seven gas
plants, 86 flow stations and other facilities.
shell and other oil companies have transformed the niger
delta into a virtual wasteland, bearing deep scars from
gas flaring and oil spills. The population in the niger delta
suffers from multiple health problems and the land is
heavily polluted. Gas flaring has severe health conse-
quences. many scientific studies have linked breathing
particulate matter to a series of significant health problems,
including aggravated asthma, increases in respiratory
symptoms like coughing and difficult or painful breathing,
chronic bronchitis, decreased lung function, and premature
death. This is due to the fact that flaring emits a cocktail
of toxic substances (including sulphur dioxide, nitrogen
dioxides), carcinogenic substances (such as benz[a]pyrene
and dioxin) and unburned fuel components (including
benzene, toluene, xylene and hydrogen sulphide).
One example of the environmental consequences of gas
flaring in the niger delta is acid rain. delta residents have
long complained that their roofs have been corroded by
the composition of the rain that falls as a result of the
flaring. The primary causes of acid rain are emissions of
sulphur dioxide (sO2) and nitrogen oxides (nOx), which
combine with atmospheric moisture to form sulphuric
acid and nitric acid, respectively. acid rain acidifies lakes
and streams and damages vegetation. in addition, acid
rain accelerates the decay of building materials and
paints. according to the world bank, emissions during
flaring are the major source of greenhouse gases in
sub-saharan africa.
in november 2005, the federal high court of nigeria
ordered shell to immediately stop flaring gas, in iwherekan
community, delta state. The court found gas flaring to
be a ‘gross violation’ of the rights to life and dignity.
nevertheless, shell continues the flaring. a recent report
from the nigerian federal ministry of environment, nigeria
conservation foundation, wwf uK and iucn concluded
that the niger delta is one of the five most severely
petroleum-damaged ecosystems in the world.
There have been major human rights abuses as well. On
June 8 2009, shell was forced to pay us$15.5 million to
settle an embarrassing lawsuit in the us for human rights
abuses in nigeria. The company is also facing legal action
in The hague concerning repeated oil spills which have
damaged the livelihoods of nigerian fisherfolk and
farmers.
12 | OVERCONSUMPTION? Our use of the world’s natural resources
OVERCONSUMPTION? Our use of the world’s natural resources | 13
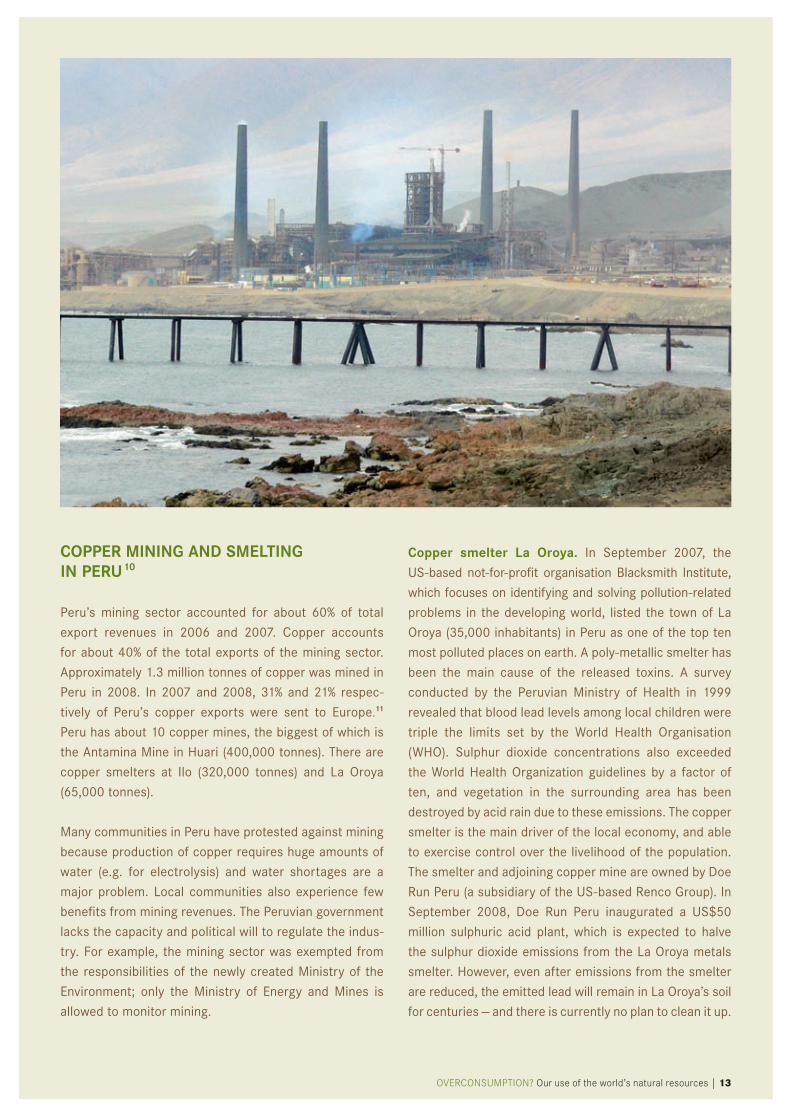
COPPER MINING AND SMELTING IN PERU 10
peru’s mining sector accounted for about 60% of total
export revenues in 2006 and 2007. copper accounts
for about 40% of the total exports of the mining sector.
approximately 1.3 million tonnes of copper was mined in
peru in 2008. in 2007 and 2008, 31% and 21% respec-
tively of peru’s copper exports were sent to europe.11
peru has about 10 copper mines, the biggest of which is
the antamina mine in huari (400,000 tonnes). There are
copper smelters at ilo (320,000 tonnes) and la Oroya
(65,000 tonnes).
many communities in peru have protested against mining
because production of copper requires huge amounts of
water (e.g. for electrolysis) and water shortages are a
major problem. local communities also experience few
benefits from mining revenues. The peruvian government
lacks the capacity and political will to regulate the indus-
try. for example, the mining sector was exempted from
the responsibilities of the newly created ministry of the
environment; only the ministry of energy and mines is
allowed to monitor mining.
Copper smelter La Oroya. in september 2007, the
us-based not-for-profit organisation blacksmith institute,
which focuses on identifying and solving pollution-related
problems in the developing world, listed the town of la
Oroya (35,000 inhabitants) in peru as one of the top ten
most polluted places on earth. a poly-metallic smelter has
been the main cause of the released toxins. a survey
conducted by the peruvian ministry of health in 1999
revealed that blood lead levels among local children were
triple the limits set by the world health Organisation
(whO). sulphur dioxide concentrations also exceeded
the world health Organization guidelines by a factor of
ten, and vegetation in the surrounding area has been
destroyed by acid rain due to these emissions. The copper
smelter is the main driver of the local economy, and able
to exercise control over the livelihood of the population.
The smelter and adjoining copper mine are owned by doe
run peru (a subsidiary of the us-based renco Group). in
september 2008, doe run peru inaugurated a us$50
million sulphuric acid plant, which is expected to halve
the sulphur dioxide emissions from the la Oroya metals
smelter. however, even after emissions from the smelter
are reduced, the emitted lead will remain in la Oroya’s soil
for centuries — and there is currently no plan to clean it up.
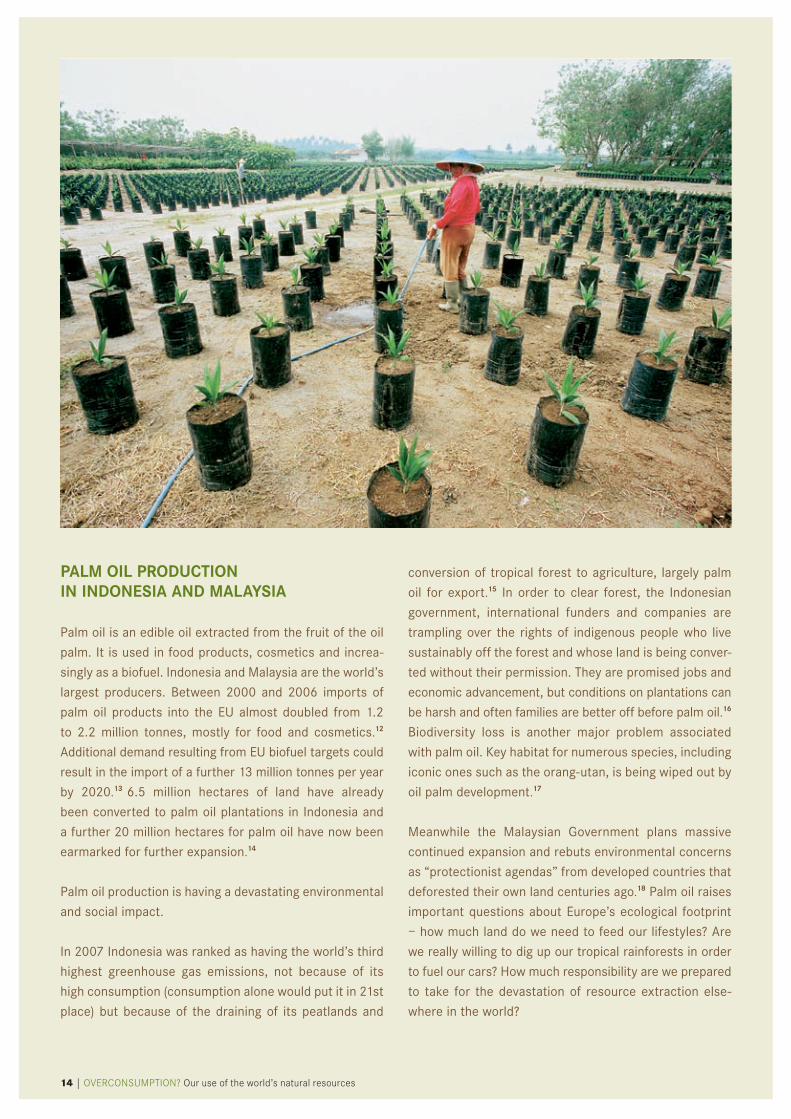
PALM OIL PRODUCTION IN INDONESIA AND MALAYSIA
palm oil is an edible oil extracted from the fruit of the oil
palm. it is used in food products, cosmetics and increa-
singly as a biofuel. indonesia and malaysia are the world’s
largest producers. between 2000 and 2006 imports of
palm oil products into the eu almost doubled from 1.2
to 2.2 million tonnes, mostly for food and cosmetics.12
additional demand resulting from eu biofuel targets could
result in the import of a further 13 million tonnes per year
by 2020.13 6.5 million hectares of land have already
been converted to palm oil plantations in indonesia and
a further 20 million hectares for palm oil have now been
earmarked for further expansion.14
palm oil production is having a devastating environmental
and social impact.
in 2007 indonesia was ranked as having the world’s third
highest greenhouse gas emissions, not because of its
high consumption (consumption alone would put it in 21st
place) but because of the draining of its peatlands and
conversion of tropical forest to agriculture, largely palm
oil for export.15 in order to clear forest, the indonesian
government, international funders and companies are
trampling over the rights of indigenous people who live
sustainably off the forest and whose land is being conver-
ted without their permission. They are promised jobs and
economic advancement, but conditions on plantations can
be harsh and often families are better off before palm oil.16
biodiversity loss is another major problem associated
with palm oil. Key habitat for numerous species, including
iconic ones such as the orang-utan, is being wiped out by
oil palm development.17
meanwhile the malaysian Government plans massive
continued expansion and rebuts environmental concerns
as “protectionist agendas” from developed countries that
deforested their own land centuries ago.18 palm oil raises
important questions about europe’s ecological footprint
– how much land do we need to feed our lifestyles? are
we really willing to dig up our tropical rainforests in order
to fuel our cars? how much responsibility are we prepared
to take for the devastation of resource extraction else-
where in the world?
14 | OVERCONSUMPTION? Our use of the world’s natural resources

OVERCONSUMPTION? Our use of the world’s natural resources | 15
T he preceding chapter illustrated that the extraction of
natural resources is very unevenly distributed across
the world. Consumption of products often takes place far
away from the origins of their raw materials (see Chapter 5).
International trade redistributes resources across the globe,
allowing some countries to export resources and to raise
revenues and other countries to increase their supply of
raw materials and products.
Growing world trade and its environmental impacts. Over the past 50 years, international trade of raw materials
and products has increased dramatically. Since 1950, in-
ternational trade volumes in monetary units have grown by
an average of 6% each year. Compared with 1950, in 2006
the value of trade was 60 times higher for manufactured
products, 10 times higher for fuels and mining products,
and 7 times higher for agricultural products (see Figure 5).19
international trade in raw materials and products has increased hugely in recent decades. Trade in natural resources can support economic development, as it enables resource-rich countries to export resources and raise revenues. if done to high environmental and social standards, trade can thereby contribute to sustainable development of poor countries. however, growing world trade also poses severe environmental and social threats. world trade accelerates resource ex-traction by linking local resources in all parts of the world with global demand. in addition, the current trade system reinforces unequal levels of resource consumption by shifting resources from poorer low consuming countries to richer, high consuming countries.
4. Trade in resOurces
Figure 5: Value of world trade volumes, 1950 to 2006 (v)
16 | OVERCONSUMPTION? Our use of the world’s natural resources
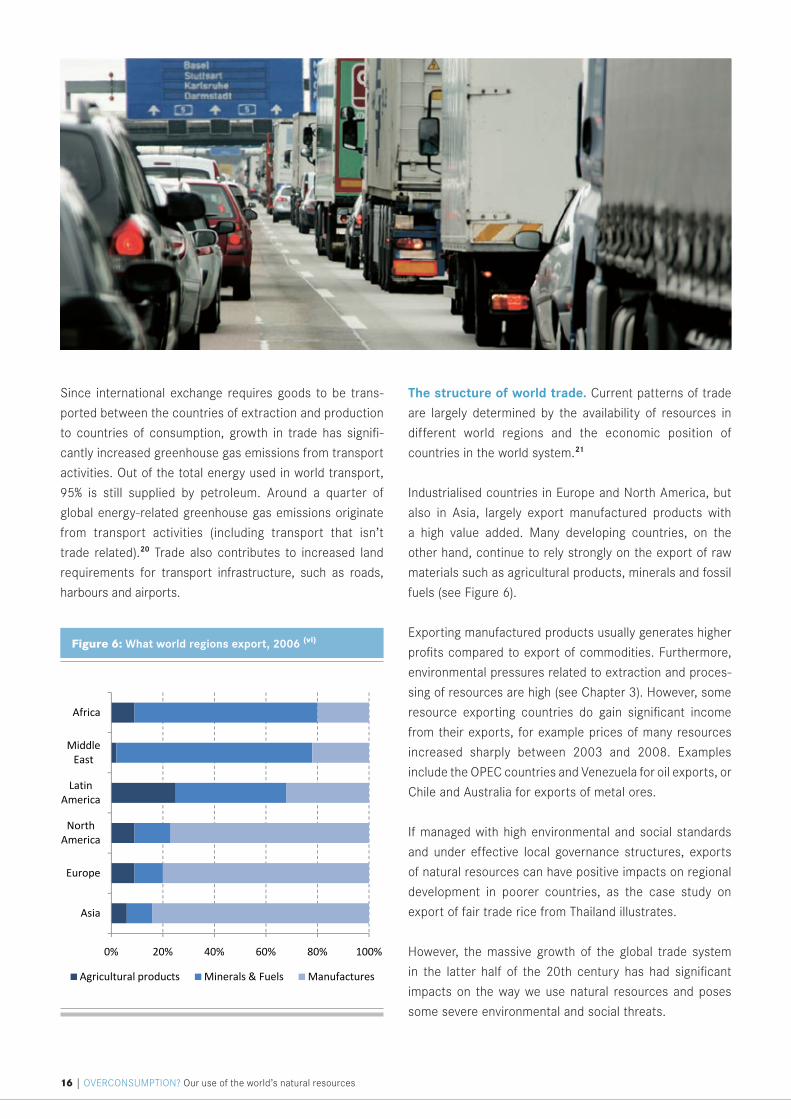
Since international exchange requires goods to be trans-
ported between the countries of extraction and production
to countries of consumption, growth in trade has signifi-
cantly increased greenhouse gas emissions from transport
activities. Out of the total energy used in world transport,
95% is still supplied by petroleum. Around a quarter of
global energy-related greenhouse gas emissions originate
from transport activities (including transport that isn’t
trade related).20 Trade also contributes to increased land
requirements for transport infrastructure, such as roads,
harbours and airports.
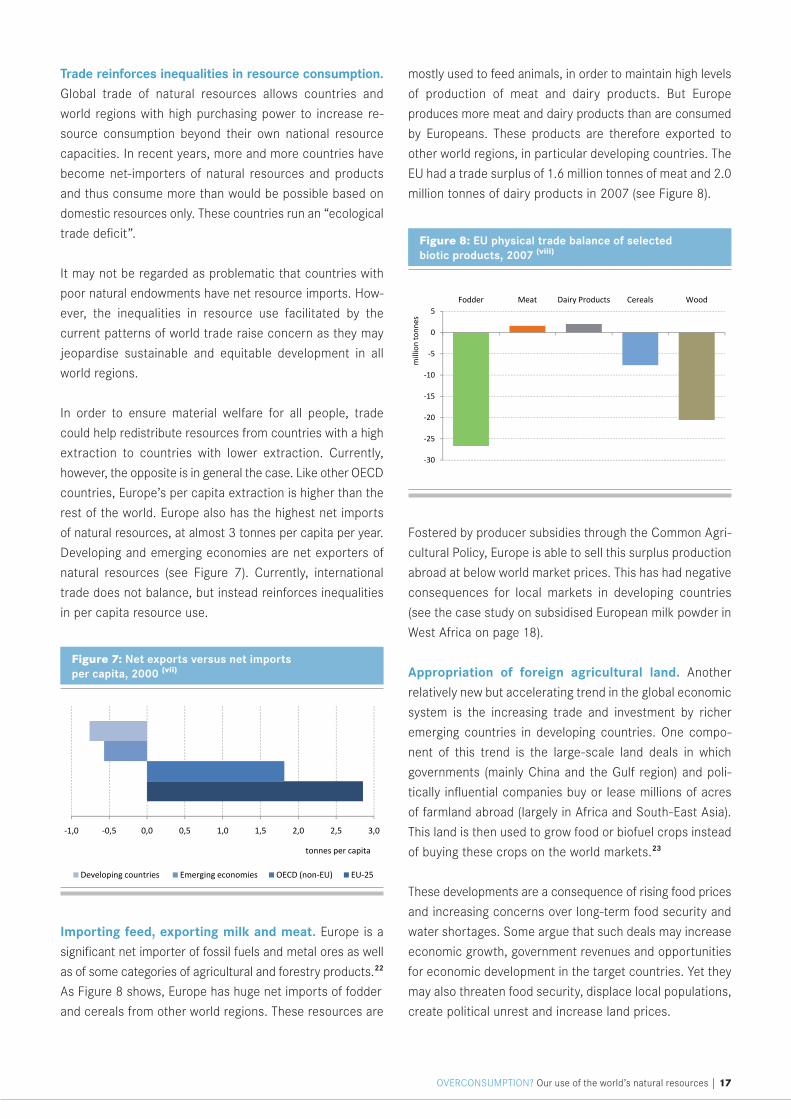
The structure of world trade. Current patterns of trade
are largely determined by the availability of resources in
different world regions and the economic position of
countries in the world system.21
Industrialised countries in Europe and North America, but
also in Asia, largely export manufactured products with
a high value added. Many developing countries, on the
other hand, continue to rely strongly on the export of raw
materials such as agricultural products, minerals and fossil
fuels (see Figure 6).
Exporting manufactured products usually generates higher
profits compared to export of commodities. Furthermore,
environmental pressures related to extraction and proces-
sing of resources are high (see Chapter 3). However, some
resource exporting countries do gain significant income
from their exports, for example prices of many resources
increased sharply between 2003 and 2008. Examples
include the OPEC countries and Venezuela for oil exports, or
Chile and Australia for exports of metal ores.
If managed with high environmental and social standards
and under effective local governance structures, exports
of natural resources can have positive impacts on regional
development in poorer countries, as the case study on
export of fair trade rice from Thailand illustrates.
However, the massive growth of the global trade system
in the latter half of the 20th century has had significant
impacts on the way we use natural resources and poses
some severe environmental and social threats.
Figure 6: What world regions export, 2006 (vi)
OVERCONSUMPTION? Our use of the world’s natural resources | 17
Trade reinforces inequalities in resource consumption. Global trade of natural resources allows countries and
world regions with high purchasing power to increase re-
source consumption beyond their own national resource
capacities. In recent years, more and more countries have
become net-importers of natural resources and products
and thus consume more than would be possible based on
domestic resources only. These countries run an “ecological
trade deficit”.
It may not be regarded as problematic that countries with
poor natural endowments have net resource imports. How-
ever, the inequalities in resource use facilitated by the
current patterns of world trade raise concern as they may
jeopardise sustainable and equitable development in all
world regions.
In order to ensure material welfare for all people, trade
could help redistribute resources from countries with a high
extraction to countries with lower extraction. Currently,
however, the opposite is in general the case. Like other OECD
countries, Europe’s per capita extraction is higher than the
rest of the world. Europe also has the highest net imports
of natural resources, at almost 3 tonnes per capita per year.
Developing and emerging economies are net exporters of
natural resources (see Figure 7). Currently, international
trade does not balance, but instead reinforces inequalities
in per capita resource use.
Importing feed, exporting milk and meat. Europe is a
significant net importer of fossil fuels and metal ores as well
as of some categories of agricultural and forestry products.22
As Figure 8 shows, Europe has huge net imports of fodder
and cereals from other world regions. These resources are
mostly used to feed animals, in order to maintain high levels
of production of meat and dairy products. But Europe
produces more meat and dairy products than are consumed
by Europeans. These products are therefore exported to
other world regions, in particular developing countries. The
EU had a trade surplus of 1.6 million tonnes of meat and 2.0
million tonnes of dairy products in 2007 (see Figure 8).
Fostered by producer subsidies through the Common Agri-
cultural Policy, Europe is able to sell this surplus production
abroad at below world market prices. This has had negative
consequences for local markets in developing countries
(see the case study on subsidised European milk powder in
West Africa on page 18).
Appropriation of foreign agricultural land. Another
relatively new but accelerating trend in the global economic
system is the increasing trade and investment by richer
emerging countries in developing countries. One compo-
nent of this trend is the large-scale land deals in which
governments (mainly China and the Gulf region) and poli-
tically influential companies buy or lease millions of acres
of farmland abroad (largely in Africa and South-East Asia).
This land is then used to grow food or biofuel crops instead
of buying these crops on the world markets.23
These developments are a consequence of rising food prices
and increasing concerns over long-term food security and
water shortages. Some argue that such deals may increase
economic growth, government revenues and opportunities
for economic development in the target countries. Yet they
may also threaten food security, displace local populations,
create political unrest and increase land prices.
Figure 7: Net exports versus net imports per capita, 2000 (vii)
Figure 8: EU physical trade balance of selected biotic products, 2007 (viii)
18 | OVERCONSUMPTION? Our use of the world’s natural resources
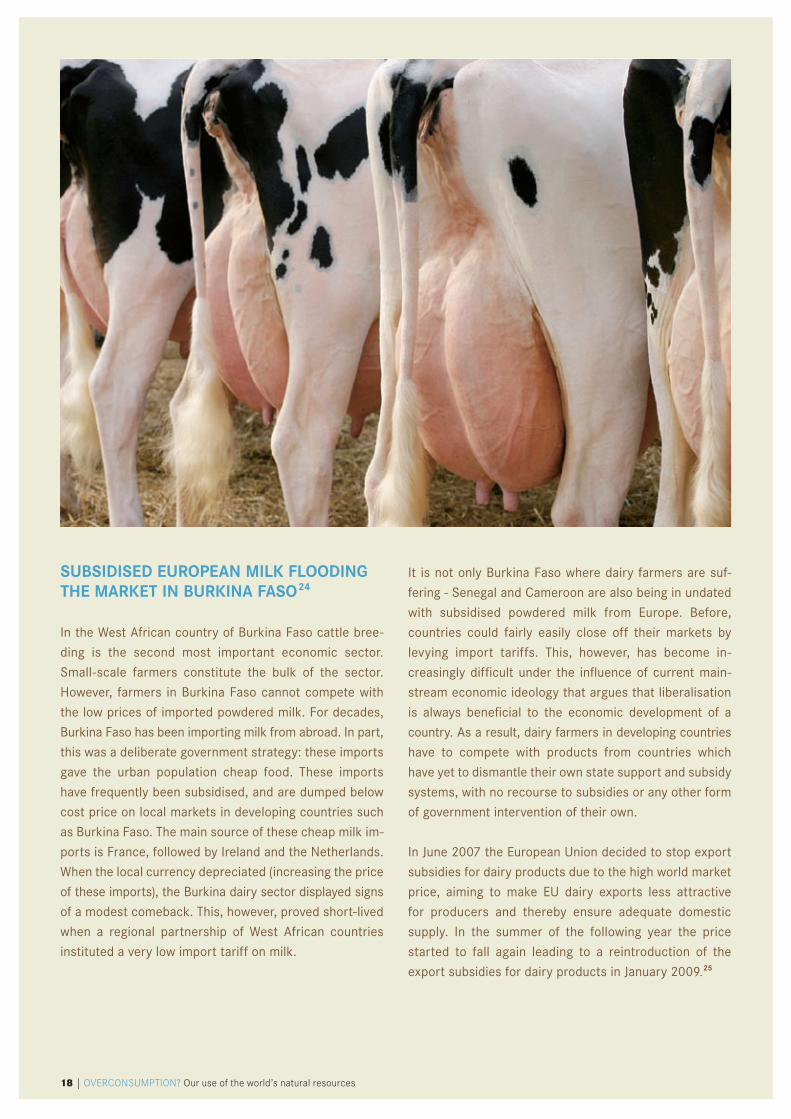
SUbSIDISED EUROPEAN MILK FLOODING THE MARKET IN bURKINA FASO 24
in the west african country of burkina faso cattle bree-
ding is the second most important economic sector.
small-scale farmers constitute the bulk of the sector.
however, farmers in burkina faso cannot compete with
the low prices of imported powdered milk. for decades,
burkina faso has been importing milk from abroad. in part,
this was a deliberate government strategy: these imports
gave the urban population cheap food. These imports
have frequently been subsidised, and are dumped below
cost price on local markets in developing countries such
as burkina faso. The main source of these cheap milk im-
ports is france, followed by ireland and the netherlands.
when the local currency depreciated (increasing the price
of these imports), the burkina dairy sector displayed signs
of a modest comeback. This, however, proved short-lived
when a regional partnership of west african countries
instituted a very low import tariff on milk.
it is not only burkina faso where dairy farmers are suf-
fering - senegal and cameroon are also being in undated
with subsidised powdered milk from europe. before,
countries could fairly easily close off their markets by
levying import tariffs. This, however, has become in-
creasingly difficult under the influence of current main-
stream economic ideology that argues that liberalisation
is always beneficial to the economic development of a
country. as a result, dairy farmers in developing countries
have to compete with products from countries which
have yet to dismantle their own state support and subsidy
systems, with no recourse to subsidies or any other form
of government intervention of their own.
in June 2007 the european union decided to stop export
subsidies for dairy products due to the high world market
price, aiming to make eu dairy exports less attractive
for producers and thereby ensure adequate domestic
supply. in the summer of the following year the price
started to fall again leading to a reintroduction of the
export subsidies for dairy products in January 2009.25
OVERCONSUMPTION? Our use of the world’s natural resources | 19
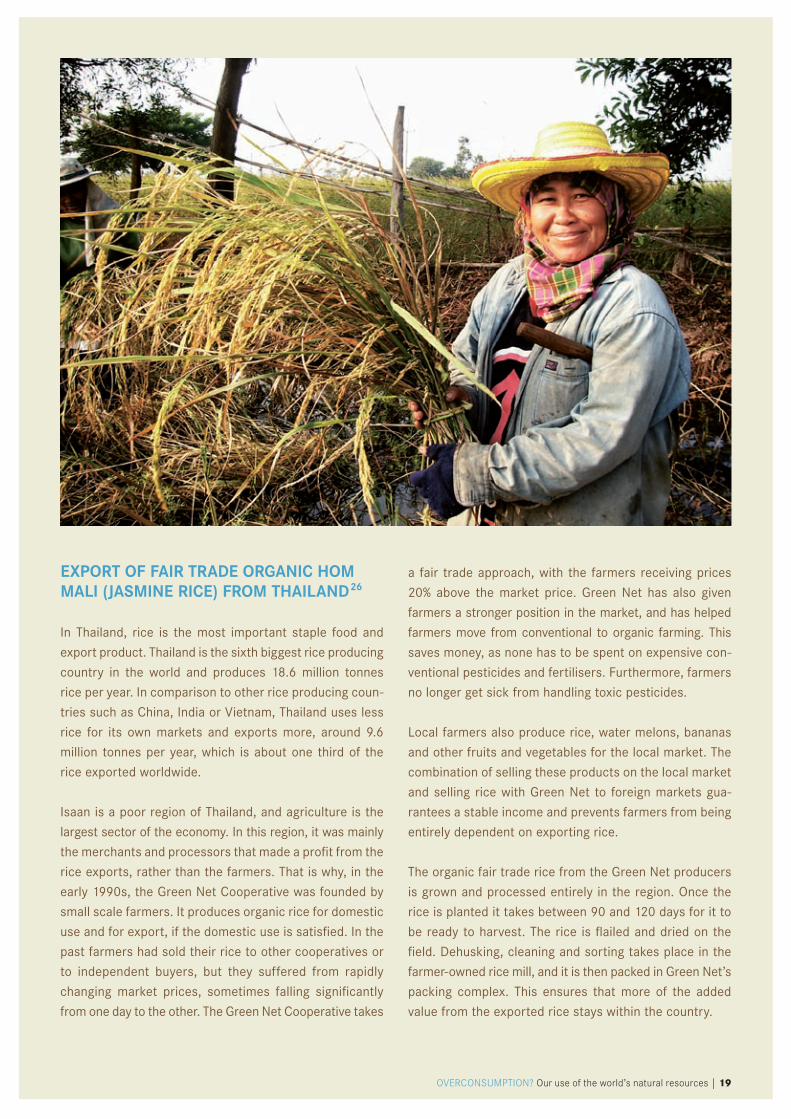
EXPORT OF FAIR TRADE ORGANIC HOM MALI (JASMINE RICE) FROM THAILAND 26
in Thailand, rice is the most important staple food and
export product. Thailand is the sixth biggest rice producing
country in the world and produces 18.6 million tonnes
rice per year. in comparison to other rice producing coun-
tries such as china, india or vietnam, Thailand uses less
rice for its own markets and exports more, around 9.6
million tonnes per year, which is about one third of the
rice exported worldwide.
isaan is a poor region of Thailand, and agriculture is the
largest sector of the economy. in this region, it was mainly
the merchants and processors that made a profit from the
rice exports, rather than the farmers. That is why, in the
early 1990s, the Green net cooperative was founded by
small scale farmers. it produces organic rice for domestic
use and for export, if the domestic use is satisfied. in the
past farmers had sold their rice to other cooperatives or
to independent buyers, but they suffered from rapidly
changing market prices, sometimes falling significantly
from one day to the other. The Green net cooperative takes
a fair trade approach, with the farmers receiving prices
20% above the market price. Green net has also given
farmers a stronger position in the market, and has helped
farmers move from conventional to organic farming. This
saves money, as none has to be spent on expensive con-
ventional pesticides and fertilisers. furthermore, farmers
no longer get sick from handling toxic pesticides.
local farmers also produce rice, water melons, bananas
and other fruits and vegetables for the local market. The
combination of selling these products on the local market
and selling rice with Green net to foreign markets gua-
rantees a stable income and prevents farmers from being
entirely dependent on exporting rice.
The organic fair trade rice from the Green net producers
is grown and processed entirely in the region. Once the
rice is planted it takes between 90 and 120 days for it to
be ready to harvest. The rice is flailed and dried on the
field. dehusking, cleaning and sorting takes place in the
farmer-owned rice mill, and it is then packed in Green net’s
packing complex. This ensures that more of the added
value from the exported rice stays within the country.
20 | OVERCONSUMPTION? Our use of the world’s natural resources
G lobal resource consumption equals global resource
extraction: the world economy uses around 60 billion
tonnes of resources each year to produce the goods and
services which we all consume.
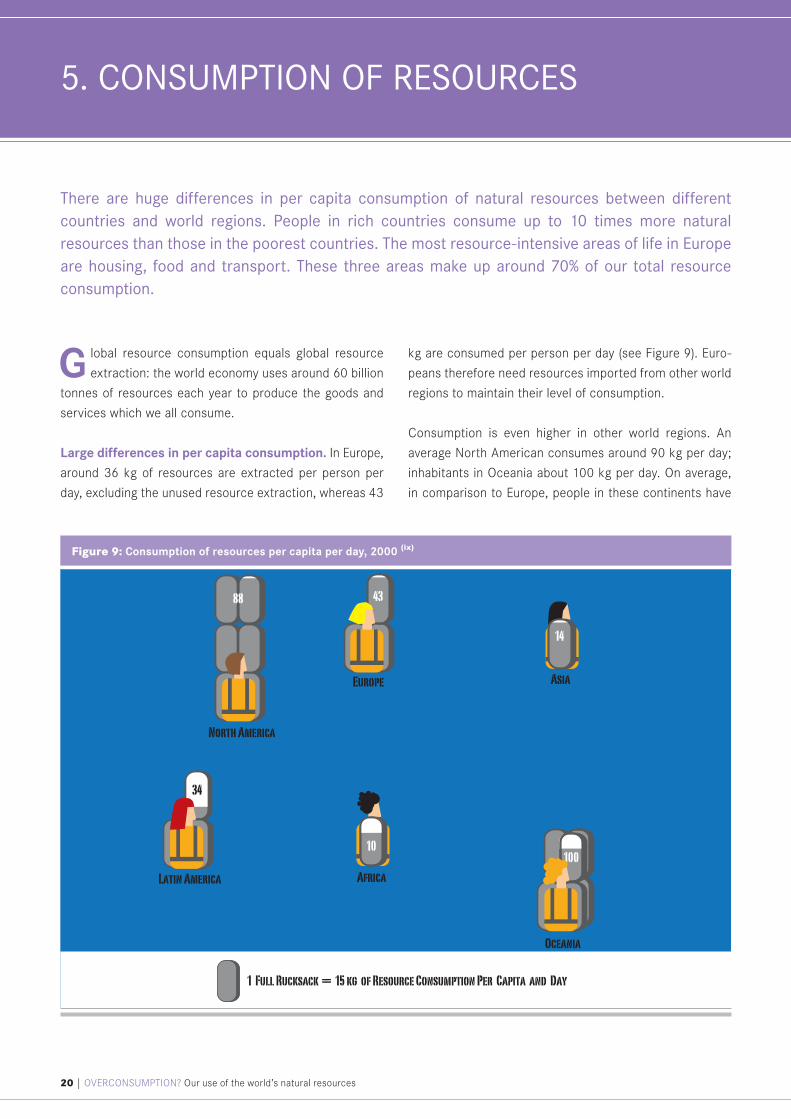
Large differences in per capita consumption. In Europe,
around 36 kg of resources are extracted per person per
day, excluding the unused resource extraction, whereas 43
kg are consumed per person per day (see Figure 9). Euro-
peans therefore need resources imported from other world
regions to maintain their level of consumption.
Consumption is even higher in other world regions. An
average North American consumes around 90 kg per day;
inhabitants in Oceania about 100 kg per day. On average,
in comparison to Europe, people in these continents have
There are huge differences in per capita consumption of natural resources between different countries and world regions. people in rich countries consume up to 10 times more natural resources than those in the poorest countries. The most resource-intensive areas of life in europe are housing, food and transport. These three areas make up around 70% of our total resource consumption.
5. cOnsumpTiOn Of resOurces
1 Full Rucksack 15 kg of Resource Consumption Per Capita and Day — —
North America
Latin America
Europe Asia
Oceania
Africa
48,2 p.Day43
88 43
14
100
43
14,40 kg/Day
10
34
88
Figure 9: Consumption of resources per capita per day, 2000 (ix)
OVERCONSUMPTION? Our use of the world’s natural resources | 21
larger houses, eat more meat and drive bigger cars. These
differences in lifestyle increase resource consumption.
Far fewer resources are consumed in other world regions.
In Asia, resource consumption is about equal to resource
extraction at around 14 kg per person per day. The average
resource consumption of an African is only 10 kg per day
(compared to the extraction of 15 kg per day).
This means in Europe we consume three times as many
resources as an inhabitant of Asia and more than four
times as much as an average African. Inhabitants of other
rich countries consume up to 10 times more than people
in developing countries. The difference would be even
greater if unused resource extraction were included in
these calculations.
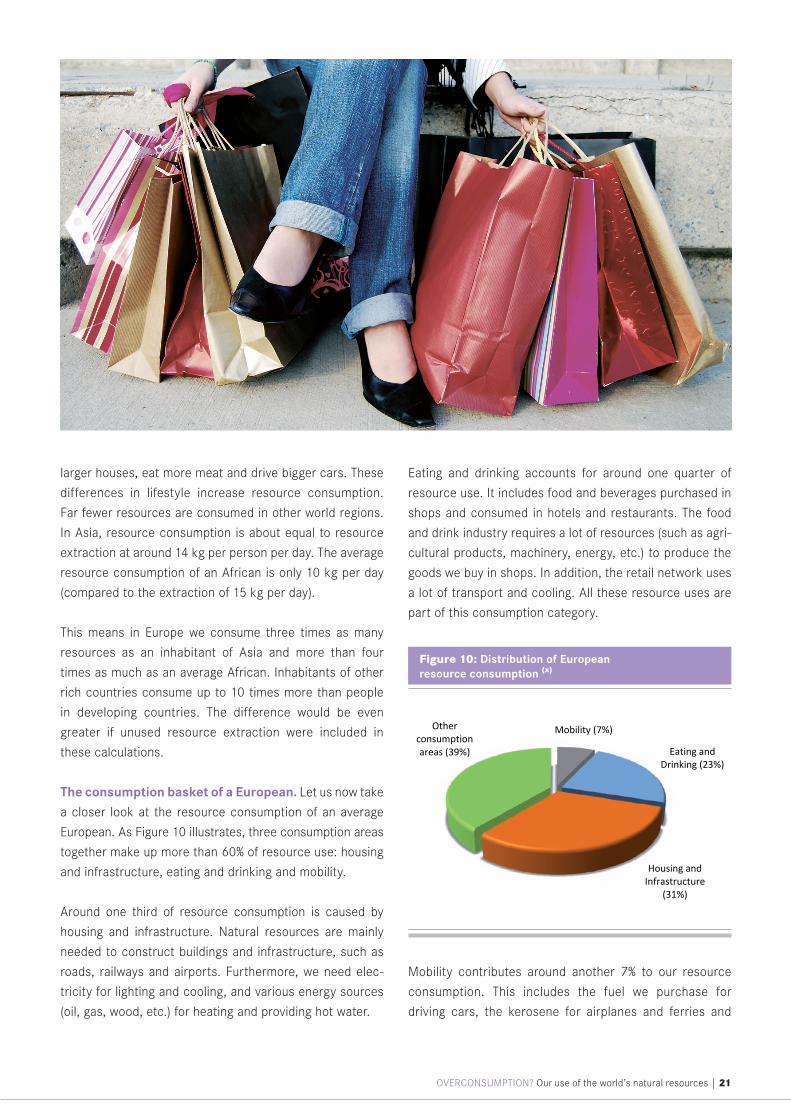
The consumption basket of a European. Let us now take
a closer look at the resource consumption of an average
European. As Figure 10 illustrates, three consumption areas
together make up more than 60% of resource use: housing
and infrastructure, eating and drinking and mobility.
Around one third of resource consumption is caused by
housing and infrastructure. Natural resources are mainly
needed to construct buildings and infrastructure, such as
roads, railways and airports. Furthermore, we need elec-
tricity for lighting and cooling, and various energy sources
(oil, gas, wood, etc.) for heating and providing hot water.
Eating and drinking accounts for around one quarter of
resource use. It includes food and beverages purchased in
shops and consumed in hotels and restaurants. The food
and drink industry requires a lot of resources (such as agri-
cultural products, machinery, energy, etc.) to produce the
goods we buy in shops. In addition, the retail network uses
a lot of transport and cooling. All these resource uses are
part of this consumption category.
Mobility contributes around another 7% to our resource
consumption. This includes the fuel we purchase for
driving cars, the kerosene for airplanes and ferries and
Figure 10: Distribution of European resource consumption (x)
22 | OVERCONSUMPTION? Our use of the world’s natural resources
the electricity for railways and public transport. All means
of transport also require huge amounts of resources in
manufacture: cars, ships and airplanes need a large number
of metals, such as steel, aluminium and copper, as well as
plastics, glass and textiles. These resource requirements
are also included in this category.
The remaining part of around 40% consists of a large
variety of other consumption areas, such as electronics
(computers, cameras, etc.), books and paper products.
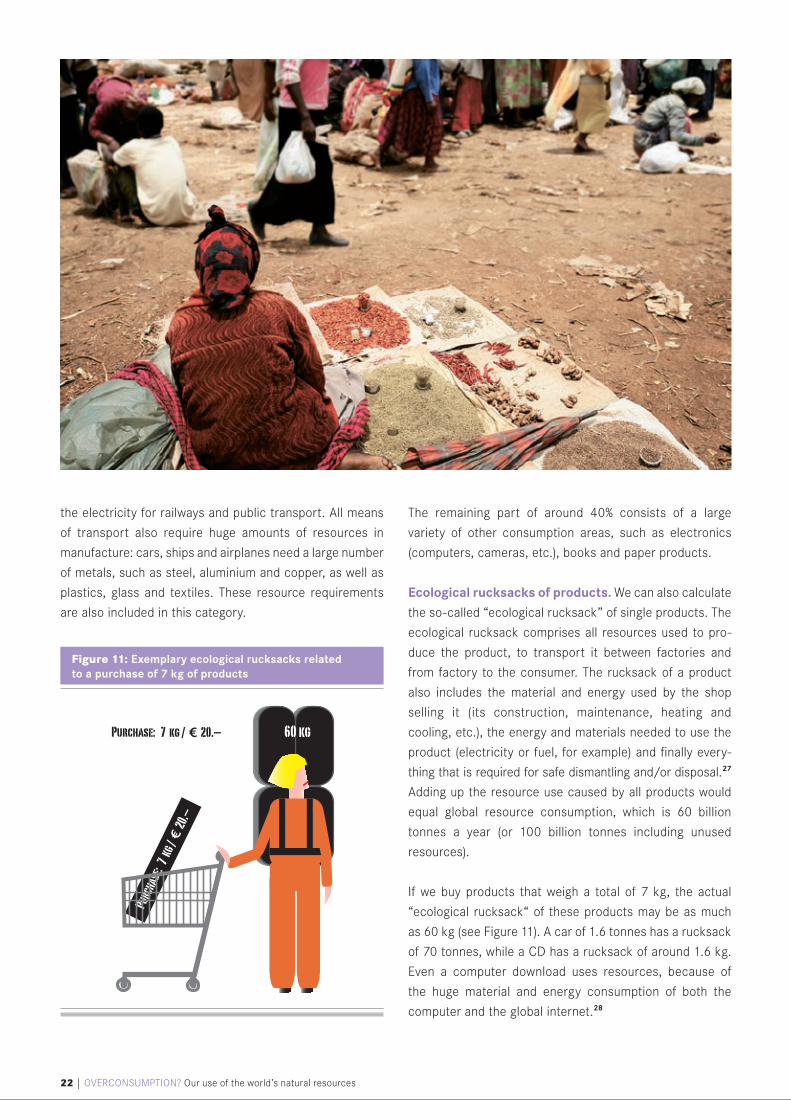
Ecological rucksacks of products. We can also calculate
the so-called “ecological rucksack” of single products. The
ecological rucksack comprises all resources used to pro-
duce the product, to transport it between factories and
from factory to the consumer. The rucksack of a product
also includes the material and energy used by the shop
selling it (its construction, maintenance, heating and
cooling, etc.), the energy and materials needed to use the
product (electricity or fuel, for example) and finally every-
thing that is required for safe dismantling and/or disposal.27
Adding up the resource use caused by all products would
equal global resource consumption, which is 60 billion
tonnes a year (or 100 billion tonnes including unused
resources).
If we buy products that weigh a total of 7 kg, the actual
“ecological rucksack“ of these products may be as much
as 60 kg (see Figure 11). A car of 1.6 tonnes has a rucksack
of 70 tonnes, while a CD has a rucksack of around 1.6 kg.
Even a computer download uses resources, because of
the huge material and energy consumption of both the
computer and the global internet.28
Purc
hase:
7 kg
/ 20
.–
60 kg Purchase: 7 kg / 20.–
Figure 11: Exemplary ecological rucksacks related to a purchase of 7 kg of products
OVERCONSUMPTION? Our use of the world’s natural resources | 23
I ncreasing the efficiency of production of goods and
services is one key driver for economic development and
growth. Traditionally, enterprises focused on labour costs
and aimed to increase labour productivity, i.e. economic
output produced per worker or employee. In the EU, for
example, labour productivity increased by more than 50%
between 1980 and 2005.29
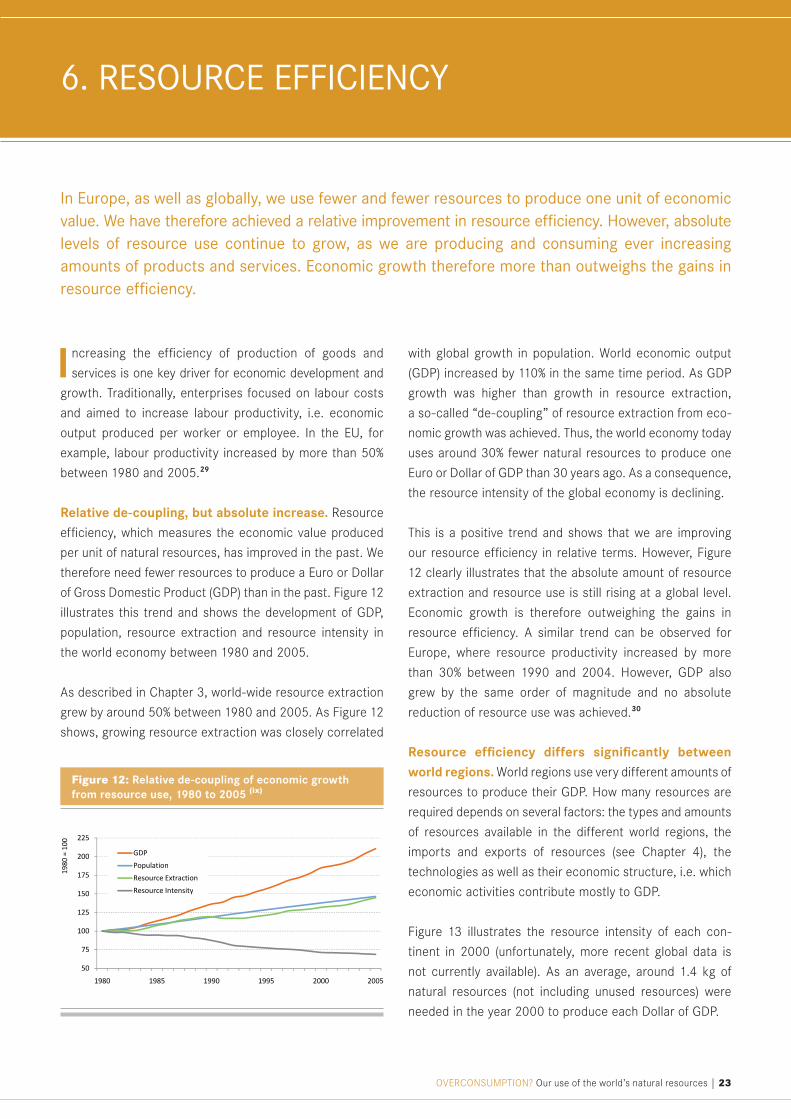
Relative de-coupling, but absolute increase. Resource
efficiency, which measures the economic value produced
per unit of natural resources, has improved in the past. We
therefore need fewer resources to produce a Euro or Dollar
of Gross Domestic Product (GDP) than in the past. Figure 12
illustrates this trend and shows the development of GDP,
population, resource extraction and resource intensity in
the world economy between 1980 and 2005.
As described in Chapter 3, world-wide resource extraction
grew by around 50% between 1980 and 2005. As Figure 12
shows, growing resource extraction was closely correlated
with global growth in population. World economic output
(GDP) increased by 110% in the same time period. As GDP
growth was higher than growth in resource extraction,
a so-called “de-coupling” of resource extraction from eco-
nomic growth was achieved. Thus, the world economy today
uses around 30% fewer natural resources to produce one
Euro or Dollar of GDP than 30 years ago. As a consequence,
the resource intensity of the global economy is declining.
This is a positive trend and shows that we are improving
our resource efficiency in relative terms. However, Figure
12 clearly illustrates that the absolute amount of resource
extraction and resource use is still rising at a global level.
Economic growth is therefore outweighing the gains in
resource efficiency. A similar trend can be observed for
Europe, where resource productivity increased by more
than 30% between 1990 and 2004. However, GDP also
grew by the same order of magnitude and no absolute
reduction of resource use was achieved.30
Resource efficiency differs significantly between world regions. World regions use very different amounts of
resources to produce their GDP. How many resources are
required depends on several factors: the types and amounts
of resources available in the different world regions, the
imports and exports of resources (see Chapter 4), the
technologies as well as their economic structure, i.e. which
economic activities contribute mostly to GDP.
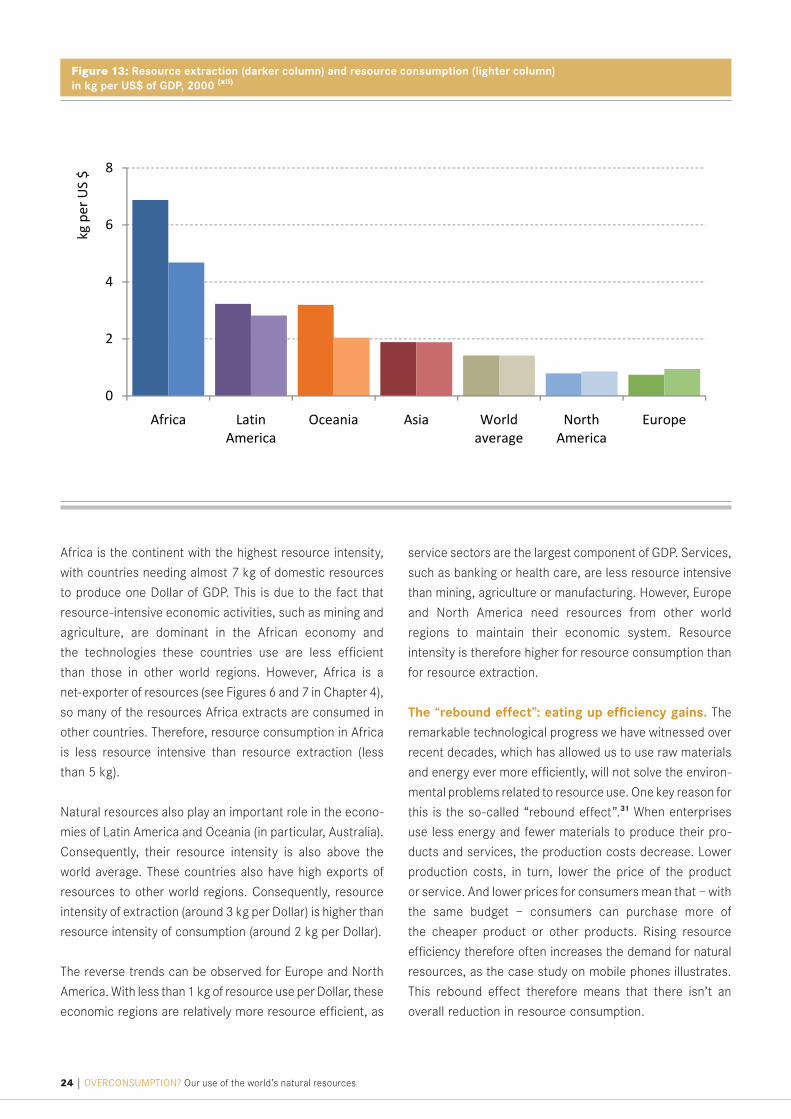
Figure 13 illustrates the resource intensity of each con-
tinent in 2000 (unfortunately, more recent global data is
not currently available). As an average, around 1.4 kg of
natural resources (not including unused resources) were
needed in the year 2000 to produce each Dollar of GDP.
in europe, as well as globally, we use fewer and fewer resources to produce one unit of economic value. we have therefore achieved a relative improvement in resource efficiency. however, absolute levels of resource use continue to grow, as we are producing and consuming ever increasing amounts of products and services. economic growth therefore more than outweighs the gains in resource efficiency.
6. resOurce efficiency
Figure 12: Relative de-coupling of economic growth from resource use, 1980 to 2005 (ix)
24 | OVERCONSUMPTION? Our use of the world’s natural resources
Africa is the continent with the highest resource intensity,
with countries needing almost 7 kg of domestic resources
to produce one Dollar of GDP. This is due to the fact that
resource-intensive economic activities, such as mining and
agriculture, are dominant in the African economy and
the technologies these countries use are less efficient
than those in other world regions. However, Africa is a
net-exporter of resources (see Figures 6 and 7 in Chapter 4),
so many of the resources Africa extracts are consumed in
other countries. Therefore, resource consumption in Africa
is less resource intensive than resource extraction (less
than 5 kg).
Natural resources also play an important role in the econo-
mies of Latin America and Oceania (in particular, Australia).
Consequently, their resource intensity is also above the
world average. These countries also have high exports of
resources to other world regions. Consequently, resource
intensity of extraction (around 3 kg per Dollar) is higher than
resource intensity of consumption (around 2 kg per Dollar).
The reverse trends can be observed for Europe and North
America. With less than 1 kg of resource use per Dollar, these
economic regions are relatively more resource efficient, as
service sectors are the largest component of GDP. Services,
such as banking or health care, are less resource intensive
than mining, agriculture or manufacturing. However, Europe
and North America need resources from other world
regions to maintain their economic system. Resource
intensity is therefore higher for resource consumption than
for resource extraction.
The “rebound effect”: eating up efficiency gains. The
remarkable technological progress we have witnessed over
recent decades, which has allowed us to use raw materials
and energy ever more efficiently, will not solve the environ-
mental problems related to resource use. One key reason for
this is the so-called “rebound effect”.31 When enterprises
use less energy and fewer materials to produce their pro-
ducts and services, the production costs decrease. Lower
production costs, in turn, lower the price of the product
or service. And lower prices for consumers mean that – with
the same budget – consumers can purchase more of
the cheaper product or other products. Rising resource
efficiency therefore often increases the demand for natural
resources, as the case study on mobile phones illustrates.
This rebound effect therefore means that there isn’t an
overall reduction in resource consumption.
Figure 13: Resource extraction (darker column) and resource consumption (lighter column) in kg per US$ of GDP, 2000 (xii)
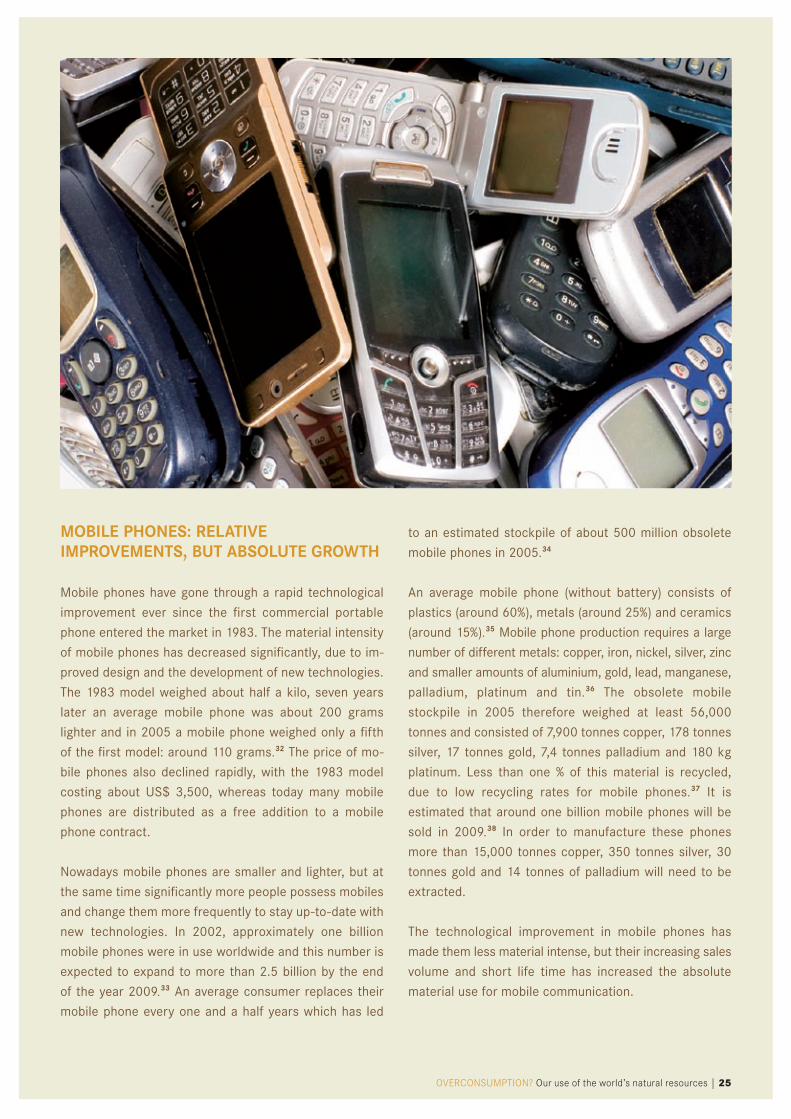
MObILE PHONES: RELATIVE IMPROVEMENTS, bUT AbSOLUTE GROWTH
mobile phones have gone through a rapid technological
improvement ever since the first commercial portable
phone entered the market in 1983. The material intensity
of mobile phones has decreased significantly, due to im-
proved design and the development of new technologies.
The 1983 model weighed about half a kilo, seven years
later an average mobile phone was about 200 grams
lighter and in 2005 a mobile phone weighed only a fifth
of the first model: around 110 grams.32 The price of mo-
bile phones also declined rapidly, with the 1983 model
costing about us$ 3,500, whereas today many mobile
phones are distributed as a free addition to a mobile
phone contract.
nowadays mobile phones are smaller and lighter, but at
the same time significantly more people possess mobiles
and change them more frequently to stay up-to-date with
new technologies. in 2002, approximately one billion
mobile phones were in use worldwide and this number is
expected to expand to more than 2.5 billion by the end
of the year 2009.33 an average consumer replaces their
mobile phone every one and a half years which has led
to an estimated stockpile of about 500 million obsolete
mobile phones in 2005.34
an average mobile phone (without battery) consists of
plastics (around 60%), metals (around 25%) and ceramics
(around 15%).35 mobile phone production requires a large
number of different metals: copper, iron, nickel, silver, zinc
and smaller amounts of aluminium, gold, lead, manganese,
palladium, platinum and tin.36 The obsolete mobile
stockpile in 2005 therefore weighed at least 56,000
tonnes and consisted of 7,900 tonnes copper, 178 tonnes
silver, 17 tonnes gold, 7,4 tonnes palladium and 180 kg
platinum. less than one % of this material is recycled,
due to low recycling rates for mobile phones.37 it is
estimated that around one billion mobile phones will be
sold in 2009.38 in order to manufacture these phones
more than 15,000 tonnes copper, 350 tonnes silver, 30
tonnes gold and 14 tonnes of palladium will need to be
extracted.
The technological improvement in mobile phones has
made them less material intense, but their increasing sales
volume and short life time has increased the absolute
material use for mobile communication.
OVERCONSUMPTION? Our use of the world’s natural resources | 25
26 | OVERCONSUMPTION? Our use of the world’s natural resources
S cenarios tell us stories about how the future might
look. In recent years, significant progress has been
made in the development of scenario modelling, which
allows us to simulate different scenarios of the future: of
economic growth, of the development of international
trade, but also of environmental pressures posed by the
economy on global ecosystems.
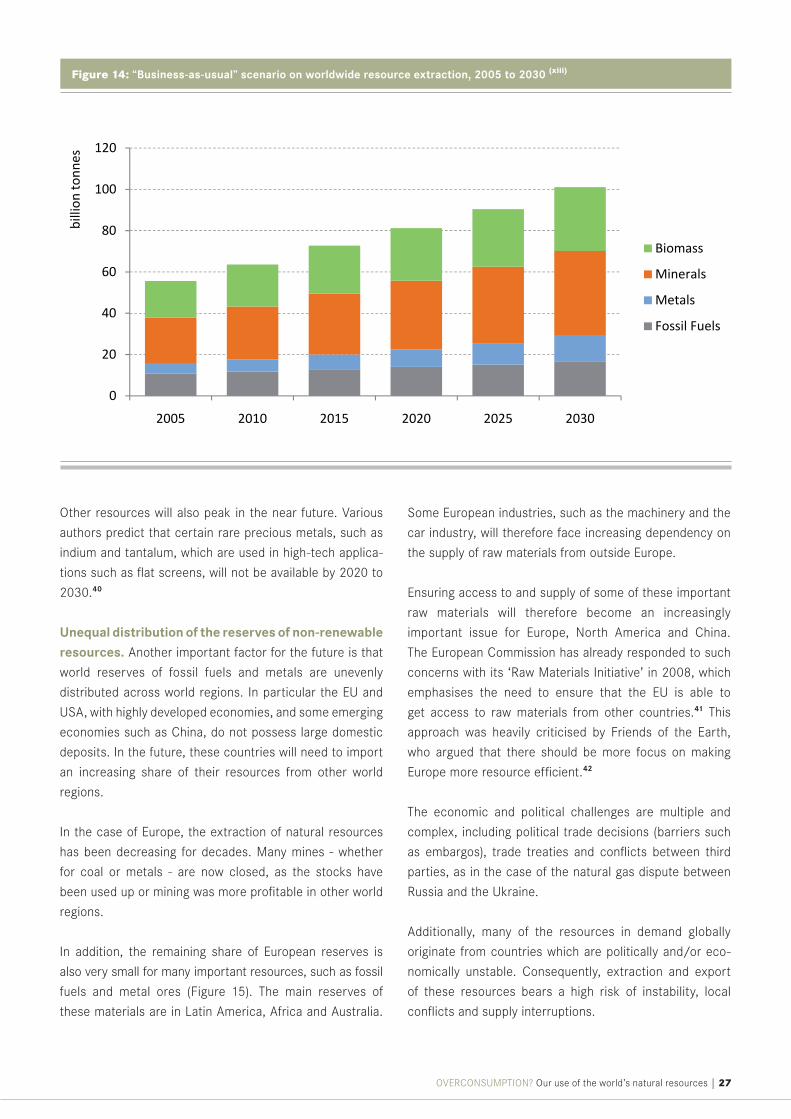
“business-as-usual”: growing without limits? Figure 14
presents the results of such a future scenario, illustrating
the trends in worldwide extraction of resources until the
year 2030. The scenario is a so-called “business-as-usual”
scenario and illustrates how many resources would be
extracted world-wide if the world economy continues
its current development path. An increase in extraction
can be seen to occur in all resource categories. As a
result, worldwide extraction of natural resources in the
year 2030 could be as high as 100 billion tonnes, which
means almost a doubling of extraction compared to 2005.
Various assumptions are made in order to create this
“business-as-usual” scenario. Resource consumption in
the industrialised countries will not decrease significantly
compared to today, world population will grow considerably,
and emerging and developing countries will increase their
per-capita resource consumption, as they aspire to the
same material welfare as people in the Western world are
already enjoying.
High prices and peak extraction of non-renewable resources. The results in Figure 14 assume that the future
demand for resources can be met. However, in the light of
such strong growth scenarios, one has to ask whether such
growth will actually be possible or whether the world eco-
nomy will face physical limits to grow in the (near) future.
The rapidly increasing demand for resources has already
caused an unprecedented boost in resource prices, parti-
cularly since 2003. Although the economic crisis of 2008
led to a downturn in resource prices, it is generally ex-
pected that the age of cheap resources is over. Countries
with large raw material deposits (or those companies who
own these deposits) will profit from this situation, and will
be able to export resources at higher prices, while countries
or regions with relative resource scarcity will be negatively
affected. These countries will face increasing competition
for resources in the future, and they will have to pay high,
and probably increasing, prices.
Additionally, for various commodities, the peak of extrac-
tion has already been reached or is about to be reached.
This means that future extraction of these materials will
decrease and their availability will be restricted. In the case
of oil, about half of the world’s reserves have been used al-
ready and peak-oil is expected between 2015 and 2030.39
For natural gas, the peak will probably occur within the
next 30 years. The reserves of coal seem to be extensive,
however the use of coal has a highly negative impact on the
world’s climate. Climate policy measures might therefore
be a more restrictive factor on coal use than its availability.
Global extraction and consumption of natural resources will continue to increase dramatically, unless measures are implemented to reduce the overall amounts of resource use. This growth will mainly be driven by increasing consumption in the emerging and developing countries. These countries legitimately aspire to obtain a similar life-style to that enjoyed in richer parts of the world. many non-renewable raw materials have already reached a peak of extraction, or are about to reach a peak in the near future. Growing global demand for resources on this limited planet will therefore increase competition and the possibilities of conflicts over the access to scarce resources.
7. scenariOs fOr fuTure resOurce use
OVERCONSUMPTION? Our use of the world’s natural resources | 27
Other resources will also peak in the near future. Various
authors predict that certain rare precious metals, such as
indium and tantalum, which are used in high-tech applica-
tions such as flat screens, will not be available by 2020 to
2030.40
Unequal distribution of the reserves of non-renewable resources. Another important factor for the future is that
world reserves of fossil fuels and metals are unevenly
distributed across world regions. In particular the EU and
USA, with highly developed economies, and some emerging
economies such as China, do not possess large domestic
deposits. In the future, these countries will need to import
an increasing share of their resources from other world
regions.
In the case of Europe, the extraction of natural resources
has been decreasing for decades. Many mines - whether
for coal or metals - are now closed, as the stocks have
been used up or mining was more profitable in other world
regions.
In addition, the remaining share of European reserves is
also very small for many important resources, such as fossil
fuels and metal ores (Figure 15). The main reserves of
these materials are in Latin America, Africa and Australia.
Some European industries, such as the machinery and the
car industry, will therefore face increasing dependency on
the supply of raw materials from outside Europe.
Ensuring access to and supply of some of these important
raw materials will therefore become an increasingly
important issue for Europe, North America and China.
The European Commission has already responded to such
concerns with its ‘Raw Materials Initiative’ in 2008, which
emphasises the need to ensure that the EU is able to
get access to raw materials from other countries.41 This
approach was heavily criticised by Friends of the Earth,
who argued that there should be more focus on making
Europe more resource efficient.42
The economic and political challenges are multiple and
complex, including political trade decisions (barriers such
as embargos), trade treaties and conflicts between third
parties, as in the case of the natural gas dispute between
Russia and the Ukraine.
Additionally, many of the resources in demand globally
originate from countries which are politically and/or eco-
nomically unstable. Consequently, extraction and export
of these resources bears a high risk of instability, local
conflicts and supply interruptions.
Figure 14: “business-as-usual” scenario on worldwide resource extraction, 2005 to 2030 (xiii)
28 | OVERCONSUMPTION? Our use of the world’s natural resources
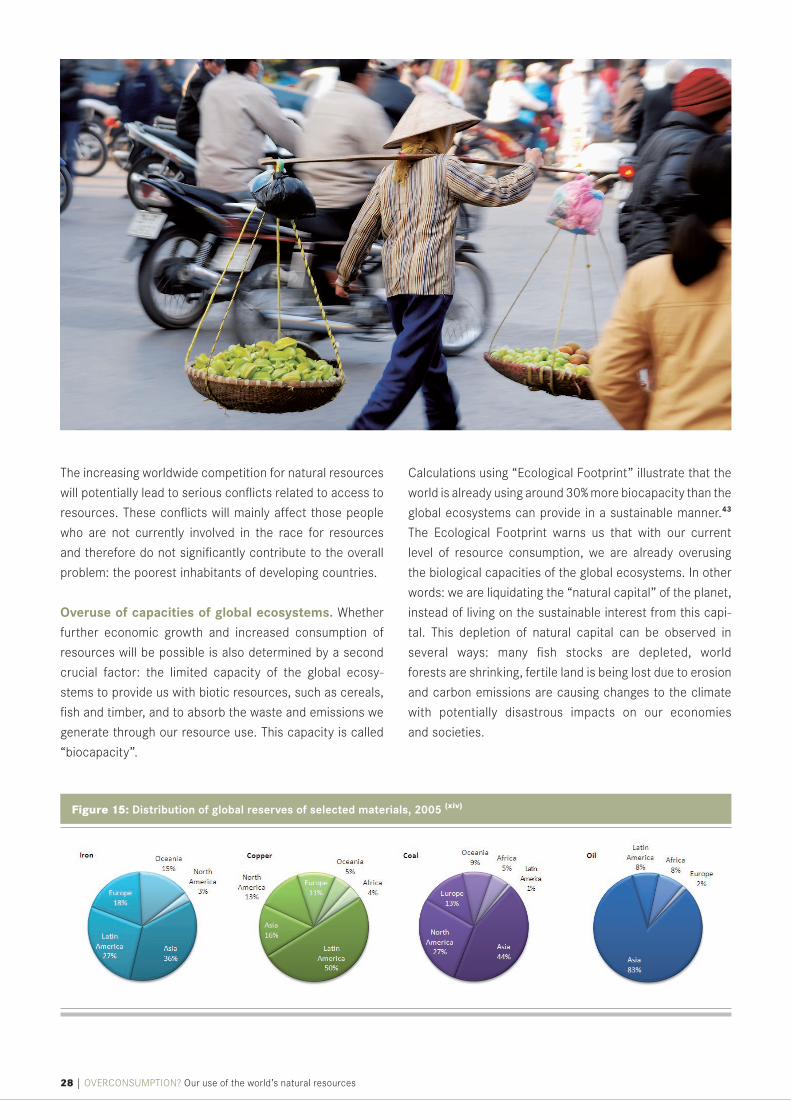
The increasing worldwide competition for natural resources
will potentially lead to serious conflicts related to access to
resources. These conflicts will mainly affect those people
who are not currently involved in the race for resources
and therefore do not significantly contribute to the overall
problem: the poorest inhabitants of developing countries.
Overuse of capacities of global ecosystems. Whether
further economic growth and increased consumption of
resources will be possible is also determined by a second
crucial factor: the limited capacity of the global ecosy-
stems to provide us with biotic resources, such as cereals,
fish and timber, and to absorb the waste and emissions we
generate through our resource use. This capacity is called
“biocapacity”.
Calculations using “Ecological Footprint” illustrate that the
world is already using around 30% more biocapacity than the
global ecosystems can provide in a sustainable manner.43
The Ecological Footprint warns us that with our current
level of resource consumption, we are already overusing
the biological capacities of the global ecosystems. In other
words: we are liquidating the “natural capital” of the planet,
instead of living on the sustainable interest from this capi-
tal. This depletion of natural capital can be observed in
several ways: many fish stocks are depleted, world
forests are shrinking, fertile land is being lost due to erosion
and carbon emissions are causing changes to the climate
with potentially disastrous impacts on our economies
and societies.
Figure 15: Distribution of global reserves of selected materials, 2005 (xiv)

OVERCONSUMPTION? Our use of the world’s natural resources | 29
C urrent global development is characterised by incre-
asing resource use and growing inequalities between
the rich and poor parts of the world population. These
inequalities are in both monetary income and resource
consumption.
A world in which the major part of the population lives in
poverty cannot be sustainable. Billions of people, mostly
in developing countries, legitimately demand further eco-
nomic growth and increased resource consumption in the
future. In a world with limits, economic growth and related
growth in resource use will only be possible in those world
regions if the currently high-consuming countries signifi-
cantly reduce their per-capita consumption and their share
of global resource use.
In order to achieve such a substantial reduction of our
resource use, we need a fundamental change in how our
economies deal with natural resources and the services
they provide. We need to profoundly transform the way we
produce and consume products and services.
Such an ambitious vision cannot be realised within a time-
frame of only a few years. However, in order to achieve the
significant absolute reduction in resource use required by
European and other western countries, we need to start
taking action now.
The rest of this chapter is split into two sections, the first
looking at measures that can be put in place quickly to set
us in the right direction, the second looking at the bigger
changes that we need to make in the medium to long term.
SECTION 1: SHORT TERM MEASURES TO GET US ON THE RIGHT TRACK
Ensure that resource use is measured, and that new policies are assessed for their impacts on resource use. An effective system for measuring EU resource use is
essential to enable progress to be monitored, and to enable
new policy options to be assessed as to their impact on
Europe’s resource use. SERI and Friends of the Earth Europe
have recently proposed such a measurement system for
natural resource use in Europe. In addition to the use of
biotic and abiotic materials, which is the focus of this
report, we suggest calculating our use of water, land area,
and greenhouse gas emissions. Each of these indicators
should incorporate the full ‘rucksack’ of resource use, for
example soya imported into Europe would have a rucksack
of land and water use.44
Using increased prices of raw materials in order to incentivise efficiency. Increased prices for raw materials
will incentivise companies to raise their resource productivity
and invest in the development of new resource efficient
technologies. Higher prices would also mean that consumers
sustainable development means a high quality of life for all people on our planet. countries in the global south need to overcome poverty and increase the material welfare of their inhabitants in the future. This will require countries with high levels of per-capita resource consumption, such as europe, to sharply decrease their resource use. many actions can and should be taken in the short term: implementing policy measures that reward resource-efficient behaviour, increasing recycling and informing consumers about their options to reduce natural resource use. in the medium term, however, more fundamental questions need to be addressed. how can new models of development be created in europe and other industrialised countries that focus on well-being instead of increased production and consumption? how can developing countries increase their quality of life without overusing the resource capacities of our planet?
8. TOwards susTainable resOurce use
photo credits Michael Warhurst/FOE EWNI

30 | OVERCONSUMPTION? Our use of the world’s natural resources
are more aware of the true costs of resource consumption
and would prefer resource-saving products. Higher prices
for resources would also have an impact on transport, in-
creasing the cost of flying and driving. International freight
transport would be more expensive and trade would be
organised in more regional cycles.
However, rising prices for resources will have negative
social effects on the poorer parts of societies, including
in Europe. Such measures therefore need to consider the
social and distributional impacts.
Developing resource efficient public procurement. Public authorities across Europe are a major consumer of
products and services. Implementing resource efficien-
cy standards for such procurement (in addition to other
environmental and social criteria) will both reduce the
environmental impacts and stimulate demand for resour-
ce-efficient products and services.
Exploiting resource efficiency potentials in compa-nies. Companies must play a key role in the transformation
of our societies towards a sustainable resource use. Many
enterprises do not know in detail how much energy and re-
sources they purchase and what they cost. The potential for
saving resources - and often money - remains undetected
and unexploited.45
Producing with high resource efficiency will also be an in-
creasingly important factor to maintain the competitiveness
of companies on the international markets. As prices for
commodities and energy go up, using fewer natural resources
is one key strategy to reduce the costs of production. Pro-
ducers should also take a life-cycle perspective in their
production activities. This includes expanding their sphere
of responsibility to the materials and intermediate products
they purchase from their suppliers. Companies should set
high environmental and social standards for purchasing
raw materials, energy and resource efficient intermediate
products.
Increasing the recycling of materials. One of the most
straightforward methods of increasing resource efficiency
is to ensure that we recycle as much as possible, keeping
the materials concerned in the economy. Recycling rates
vary hugely around the EU (and the rest of the world), and
even valuable materials like aluminium frequently end up
buried in landfills or burnt in incinerators. Some companies
are now aiming to achieve zero waste to landfill or incinera-
tion, and some regions in Europe are demonstrating how to
achieve high levels of recycling of household waste (see the
case study on the Belgian region of Flanders on page 32).
Informing consumers about the resource use of pro-ducts. There has been increasing consumer awareness
about the environmental impacts of their consumption
in the past decade. This has been partly due to labelling
systems, and there is potential to extend these to cover
the resource use caused by a product or service during its
life cycle.
Changing lifestyles and consumption patterns. In
order to achieve substantial changes in our resource use,
we do need to make changes in our current lifestyles. For
example, a move towards vegetarian diets and a reduction
in the consumption of meat, milk and dairy products; and
more use of public transport and cycling, with a reduction
in travel by private car and airplane.
SECTION 2: MEDIUM TO LONG TERM CHALLENGES
Achieving significant reductions in resource use requires
us to address more fundamental questions, for example:
How can new models of development be created in Europe and other industrialised countries that focus on well-being instead of increased production and consumption?
How can developing countries increase their inhabi-tants’ quality of life without overusing the resource capacities of our planet?
These are not easy questions to answer, but the rest of the
chapter will outline some initial pointers.
Economic growth and the limits of de-coupling.Alt hough we are using resources more efficiently, the
OVERCONSUMPTION? Our use of the world’s natural resources | 31
continued growth of our economies is leading to a con-
tinued net increase in resource use.
A lot of examples of relative improvements exist but it is
very hard to find empirical evidence for overall reductions
in resource throughput. It is therefore clear that improving
resource efficiency in relation to GDP (decoupling) will not
be sufficient to solve our problems related to high resource
use.
There is therefore a real dilemma. On the one hand, our
current system requires economic growth. On the other,
surging environmental pressures are likely to put a severe
constraint on future economic growth. However, low, zero
or negative growth would be deeply problematic for the
current economic system. How can we create new models
of development that can achieve lasting prosperity for all?
We urgently need new ways of designing economies for
sustainability, creating a transition to a resilient and sus-
tainable economy.
Initiatives such as “Beyond GDP” by the European Union 46,
on “Sustainable De-growth” in various EU countries 47 as
well as the recently published report by the UK Sustainable
Development Commission, entitled “Prosperity without
Growth?” 48 indicate that this debate is now underway.
Resource use, quality of life and happiness. In the
modern consumerist society people often believe that the
higher their income and the more possessions they have,
the happier they will be. However, research examining hap-
piness and wellbeing has established that above a certain
threshold an increase in material wealth does not improve
life satisfaction any further.49 Happiness is then more
affected by other factors, such as the nature of relationships
with family and friends, and (in a negative sense) by mental
illness.
From these insights, two important implications arise for
the links between quality of life and sustainable resource
use. Firstly, aiming for a high and sustainable quality of life
will always require some resources, including a fair share
of resources between individuals and societies living today
and between current and future generations. Secondly,
there are different strategies to achieve the same level of
subjective life satisfaction. Such strategies will vary in their
resource use, and are highly dependent on cultural values.
Today, many societies (and governments) are focused on
maximising material wealth. However, it is clear that stra-
tegies based on more non-materialistic approaches could
achieve higher life satisfaction.
In a world with lower natural resource use, other aspects
of life could (again) become more important: good relation-
ships with our family and friends, more leisure time to
pursue personal interests, and higher self-fulfilment.
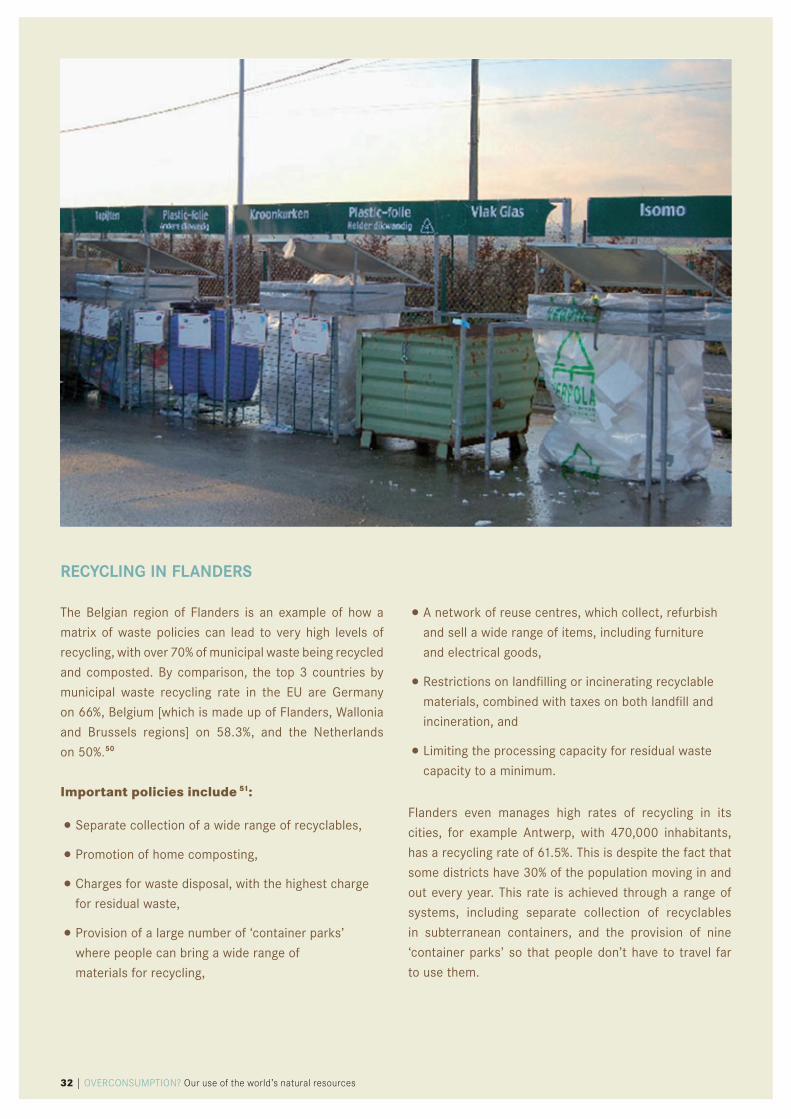
32 | OVERCONSUMPTION? Our use of the world’s natural resources
RECYCLING IN FLANDERS
The belgian region of flanders is an example of how a
matrix of waste policies can lead to very high levels of
recycling, with over 70% of municipal waste being recycled
and composted. by comparison, the top 3 countries by
municipal waste recycling rate in the eu are Germany
on 66%, belgium [which is made up of flanders, wallonia
and brussels regions] on 58.3%, and the netherlands
on 50%.50
Important policies include 51:
• separate collection of a wide range of recyclables,
• promotion of home composting,
• charges for waste disposal, with the highest charge
for residual waste,
• provision of a large number of ‘container parks’
where people can bring a wide range of
materials for recycling,
• a network of reuse centres, which collect, refurbish
and sell a wide range of items, including furniture
and electrical goods,
• restrictions on landfilling or incinerating recyclable
materials, combined with taxes on both landfill and
incineration, and
• limiting the processing capacity for residual waste
capacity to a minimum.
flanders even manages high rates of recycling in its
cities, for example antwerp, with 470,000 inhabitants,
has a recycling rate of 61.5%. This is despite the fact that
some districts have 30% of the population moving in and
out every year. This rate is achieved through a range of
systems, including separate collection of recyclables
in subterranean containers, and the provision of nine
‘container parks’ so that people don’t have to travel far
to use them.
OVERCONSUMPTION? Our use of the world’s natural resources | 33
(i) calculations based on fischer-Kowalski, m., haberl, h., hüttler, w., payer, h., schandl, h., winiwarter, v., Zangerl-weisz, h. (eds.). 1997. Gesellschaftlicher stoffwechsel und Kolonisierung von natur. G+b verlag.
(ii) seri Global material flow database. 2008 version. see www.materialflows.net.
(iii) seri Global material flow database. 2008 version. see www.materialflows.net.
(iv) seri Global material flow database. 2008 version. see www.materialflows.net.
(v) wTO. 2008. international trade statistics 2008. world Trade Organisation, Geneva.
(vi) wTO. 2008. international trade statistics 2008. world Trade Organisation, Geneva.
(vii) calculations based on Giljum, s., lutz, c., Jungnitz, a., bruckner, m., hinterberger, f. 2008. Global dimensions of european natural resource use. first results from the Global resource accounting model (Gram). seri working paper 7, sustainable europe research institute, vienna.
(viii) calculations based on eurostat. eu 27 Trade since 1995 by hs 2-hs 4. http://epp.eurostat.ec.europa.eu. (download: 16.07.2009). calculations for fodder based on faO, faOsTaT. TradesTaT. http://faostat.fao.org (download: 16.07.2009)
(ix) calculations based on Giljum, s., lutz, c., Jungnitz, a., bruckner, m., hinterberger, f. 2008. Global dimensions of european natural resource use. first results from the Global resource accounting model (Gram). seri working paper 7, sustainable europe research institute, vienna.
(x) calculations based on moll, s., watson, d. 2009. environmental pressures from european consumption and production. a study in integrated environmental and economic analysis. european Topic centre of sustainable consumption and production, copenhagen.
(xi) calculations based on seri Global material flow database. 2008 version. see www.materialflows.net.
(xii) calculations based on seri Global material flow database. 2008 version. see www.materialflows.net and Giljum, s., lutz, c., Jungnitz, a., bruckner, m., hinterberger, f. 2008. Global dimensions of european natural resource use. first results from the Global resource accounting model (Gram). seri working paper 7, sustainable europe research institute, vienna.
(xiii) Giljum, s., polzin, c., lutz, c. 2009. Global implications of a european environmental tax reform. petre working paper (available at www.petre.org.uk), seri & Gws, vienna & Osnabrück.
(xiv) bp (2007): review of world energy 2007. british petrol, london. usGs (2008): mineral commodity summaries. us Geological survey, washington d.c.
sOurces fOr fiGures

34 | OVERCONSUMPTION? Our use of the world’s natural resources
1 UNEP. 2007. Global Environmental Outlook 4. United Nations Environment Programme, Nairobi.
2 Heinberg, R. 2007. Peak Everything: Waking Up to the Century of Declines. New Society Publishers, Gabriola Island, Canada.
3 Ravallion, M., Shaohua Chen and Prem Sangraula. 2008. Dollar a day revisited, World Bank, Washington.
4 Schmidt-Bleek, F. 2009. The Earth: Natural Resources and Human Intervention. Haus Publishing Limited, London.
5 Fischer-Kowalski, M., Haberl, H., Hüttler, W., Payer, H., Schandl, H., Winiwarter, V., Zangerl-Weisz, H. (Eds.). 1997. Gesellschaft- licher Stoffwechsel und Kolonisierung von Natur. G+B Verlag.
6 Behrens, A., Giljum, S., Kovanda, J., Niza, S. 2007. The material basis of the global economy. World-wide patterns in natural resource extraction and their implications for sustainable resource use policies. Ecological Economics 64, 444-453. Weisz, H., Krausmann, F., Amann, C., Eisenmenger, N., Erb, K.H., Hubacek, K., Fischer-Kowalski, M. 2006. The physical economy of the European Union: Cross-country comparison and determi- nants of material consumption. Ecological Economics 58(4), 676.
7 Behrens, A., Giljum, S., Kovanda, J., Niza, S. 2007. The material basis of the global economy. World-wide patterns in natural resource extraction and their implications for sustainable resource use policies. Ecological Economics 64, 444-453. see also www.materialflows.net
8 Shell Accountability Coalition. 2007. Use your profit to clean up your mess. Report on how Shell should fund local solutions for environmental and social destruction caused by its projects. Visit www.ShellGuilty.com for more information. The ShellGuilty campaign is a global coalition including Friends of the Earth (www.foei.org), Oil Change International (www.priceofoil.org), and PLATFORM’s remember saro-wiwa project (www.remembersarowiwa.com), with support from environmental and human rights groups in Nigeria, North America, and Europe.
9 Eurostat. 2009. EU 27 Trade since 1995 by HS2-HS4. http://epp.eurostat.ec.europa.eu/newxtweb/defaultquery.do (Download: 14.07.2009).
10 Friends of the Earth Netherlands (Milieu Defensie). 2009. “Mining matters, Unacceptable metal mining in developing countries and the responsibilities of companies in the Netherlands”. http://www.milieudefensie.nl/globalisering/ publicaties/rapporten/mining_matters.pdf For more cases of people affected by mining visit: http://www.foei.org/en/who-we-are/testimonies
11 UNdata. 2009. UNSD Commodity Trade Statistics. http://data.un.org/Browse.aspx?d=ComTrade, (Download: 09.07.2009). Eurostat, EU 27 Trade since 1995 by HS2-HS4, http://epp.eurostat.ec.europa.eu/newxtweb/defaultquery.do (Download: 09.07.2009).
12 Eurostat. 2009. EU 27 Trade since 1995 by HS2-HS4. http://epp.eurostat.ec.europa.eu/newxtweb/defaultquery.do (Download: 16.07.2009).
13 UK Department for Transport. 2009. “Global and EU biofuel scenarios to 2020”. Presentation, 31 July 2009.
14 Friends of the Earth. 2005 “The oil for ape scandal, How palm oil is threatening the orang-utan”. http://www.foe.co.uk/resource/reports/oil_for_ape_full.pdf
15 The World Bank & DFID. 2007. “Indonesia and Climate Change”. Washington.
16 Friends of the Earth. 2008. “Losing Ground: The human rights impacts of oil palm plantation expansion in Indonesia”. http://www.foe.co.uk/resource/reports/losingground.pdf
17 Friends of the Earth. 2005 “The oil for ape scandal, How palm oil is threatening the orang-utan”. http://www.foe.co.uk/resource/reports/oil_for_ape_full.pdf
18 Malaysian Palm Oil Council (MPOC). 2009.“Palm Oil: The Green Answer”: Advert by the Malaysian Palm Oil Council.
19 WTO. 2008. International trade statistics 2008. World Trade Organisation, Geneva.
20 WTO & UNEP. 2009. Trade and Climate Change. WTO-UNEP Report. Available at http://www.wto.org/english/ res_e/booksp_e/trade_climate_change_e.pdf
21 Eisenmenger, N., Giljum, S. 2006. Evidence from Societal Metabolism Studies for Ecologically Unequal Trade. In: Hornborg, A., Crumley, C.L. (Eds.), The World System and The Earth System. Global Socio-Environmental Change and Sustainability Since the Neolithic, Left Coast Press Inc., Walnut Creek, California.
22 Weisz, H., Krausmann, F., Amann, C., Eisenmenger, N., Erb, K.H., Hubacek, K., Fischer-Kowalski, M. 2006. The physical economy of the European Union: Cross-country comparison and determinants of material consumption. Ecological Economics 58(4), 676.
23 The Economist. 2009. Buying farmland abroad: Outsourcing‘s third wave. The Economist, May 21st, Available at http://www.economist.com/world/international/displayStory. cfm?story_id=13692889
references in main TexT
OVERCONSUMPTION? Our use of the world’s natural resources | 35
24 ICCO. 2007. Food under threat! The effects of European trade treaties on agriculture products in Sub-Saharan Africa. Copyright ICCO, Utrecht, The Netherlands.
25 Reuters. 2009. EU to Reactivate Dairy Export Subsidies. 15/01/2009.
26 Reitinger, A. 2008. Wo die Saat aufgeht. In: natürlichFAIR, Neues aus der Welt des fairen Handels, 2/08.
27 Schmidt-Bleek, F. 1992. MIPS - A Universal Ecological Measure. Fresenius Environmental Bulletin 2, 407-412.
28 Schmidt-Bleek, F. (Ed.). 2004. Der ökologische Rucksack. Wirtschaft für eine Zukunft mit Zukunft. Hirzel, Stuttgart.
29 International Labour Organization, ILO. 2007. Labour productivity and unit labour costs indicator (KILM 18). The Key Indicators of the Labour Market (KILM) 5th edition, chapter 7. http://www.ilo. org/public/english/employment/strat/kilm/download/kilm18.pdf (Download: 22.07.2009).
30 EUROSTAT. 2007. Measuring progress towards a more sustainable Europe. 2007 monitoring report of the EU sustainable development strategy. Statistical Office of the European Communities, Luxembourg.
31 Binswanger, M. 2001. Technological progress and sustainable development: what about the Rebound Effect? Ecological Economics 36, 119-132.
32 Cooper, M. History of Cell Phones. From Newsstream/ Arraycomm for About.com. http://inventors.about.com/cs/ inventorsalphabet/a/martin_cooper.htm (Download: 16.07.2009). Environmental Literacy Council. Cell Phone Life Cycle. http://www.enviroliteracy.org/article.php/1119.php. (Download: 16.07.2009).
33 Fishbein, B.K., 2002. Waste in the wireless world – The challenge of cell phones. New York, N.Y., INFORM, Inc. Gartner Inc. Gartner says mobile phone sales will exceed one billion in 2009. http://www.gartner.com/it/page.jsp?id=492163 (Download: 15.07.2009).
34 Fishbein, B.K., 2002. Waste in the wireless world – The challenge of cell phones. New York, N.Y., INFORM, Inc.. Most, E. 2003. Calling all cell phones – Collection, Ruse, and Recycling Programs in the US. New York, N.Y., INFORM, Inc.
35 Mobile Takeback Forum. FAQ: What is a mobile made from?. http://www.mobiletakeback.co.uk/ (Download: 12.07.2009).
36 Sullivan, D.E., 2006. Recycled Cell Phones – A treasure trove of valuable metals. Fact Sheet 2006 – 3097, U.S. Geological Survey, Denver.
37 Most, E. 2003. Calling all cell phones – Collection, Ruse, and Recycling Programs in the US. New York, N.Y., INFORM, Inc.. Sullivan, D.E., 2006. Recycled Cell Phones – A treasure trove of valuable metals. Fact Sheet 2006 – 3097, U.S. Geological Survey, Denver.
38 Gartner Inc. Gartner says mobile phone sales will exceed one billion in 2009. http://www.gartner.com/it/page.jsp?id=492163 (Download: 15.07.2009).
39 OECD/IEA. 2009. World Energy Outlook 2009. International Energy Agency, Paris.
40 Cohen, D. 2007. Earth‘s natural wealth: an audit. New Scientist (2605).
41 European Commission. 2008. The Raw Materials Initiative. Meeting our critical needs for growth and jobs in Europe. COM(2008) 699, European Commission, Brussels.
42 Friends of the Earth Europe. 2009. “EU Raw Materials Initiative: Commentary from Friends of the Earth Europe”, February 2009. http://www.foeeurope.org/trade/publications/2009/FoEE_ commentary_RawMaterialsInitiative_feb09.pdf
43 WWF, Zoological Society of London, Global Footprint Network. 2008. Living Planet Report 2008. WWF, Gland, Switzerland.
44 Giljum, S., Hinterberger, F., Lutter, S., Polzin, C. 2009. How to measure Europe’s resource use. An analysis for Friends of the Earth Europe. Sustainable Europe Research Institute, Vienna.
45 Fischer, H., Lichtblau, K., Meyer, B., Scheelhase, J. 2004. Wachstums- und Beschäftigungsimpulse rentabler Material- einsparungen. Wirtschaftsdienst 2004/04.
46 See http://www.beyond-gdp.eu
47 See http://events.it-sudparis.eu/degrowthconference/en and http://www.clubofrome.at/2009/degrowth/index.html
48 Jackson, T. 2009. Prosperity without growth? The transition to a sustainable economy. Sustainable Development Commission, London.
49 Diener, E., Seligman, M.E.P. 2004. Beyond money. Toward an economy of well-being. Psychological Science in the Public Interest 5(1), 1-31.
50 European Environment Agency. 2009. “EU as a Recycling Society”, April 2009. Cophenhagen. http://scp.eionet.europa.eu/publica- tions/wp2009_2/wp/wp2009_2
51 Mariën, L./OVAM (Flemish Public Waste Agency), Talk: “Prevention and management of household waste in Flanders”. 27.04.2009. http://www.foe.co.uk/resource/event_ presentations/2_lore_marien.pdf
whO we are
Friends of the Earth Europe is the European arm of Friends of the Earth International, the world’s largest grassroots environmental network. We are the largest grassroots environmental network in Europe uniting national member organisations and thousands of local activist groups in more than 30 European countries. As the people’s voice at the heart of the European Union, we campaign for sustainable solutions to benefit the planet, people and our future, influencing European and EU policy and raising public awareness on environmental issues.
For more information see: www.foeeurope.org
The Sustainable Europe Research Institute (SERI) is a private research and consulting institution aiming to explore sustainable development options for European societies. SERI is one of the leading European institutes in the fields of environmental and resource use accounting, modelling of sustainability scenarios, indicators for sustainable development and policies for sustainable resource use.
For more information see: www.seri.at
GLObAL 2000 was founded in Vienna in 1982 and has been a member of the Friends of the Earth International network since 1998. With 60,000 members, GLObAL 2000 is the largest and most well-known Austrian environmental protection organisation. Through its work, GLObAL 2000 not only uncovers environmental scandals and advocates Austria’s responsibility to contribute to solving global environmental problems, but also offers sustainable solutions.
For more information see: www.global2000.at