overexpressing irs1 in endothelial cells enhances...
TRANSCRIPT

1
Overexpressing IRS1 in Endothelial Cells Enhances Angioblast Differentiation and 1
Wound Healing in Diabetes and Insulin Resistance 2
3
Sayaka Katagiri1, Kyoungmin Park
1, Yasutaka Maeda
1, Tata Nageswara Rao
2, Mogher 4
Khamaisi1, Qian Li
1, Hisashi Yokomizo
1, Akira Mima
1, Luca Lancerotto
3, Amy Wagers
2, 5
Dennis P. Orgill3, George L. King
1 6
1 Section of Vascular Cell Biology, Joslin Diabetes Center, Harvard Medical School 7
2 Department of Stem Cell and Regenerative Biology, Harvard University, Harvard Stem Cell 8
Institute & Joslin Diabetes Center 9
3 Division of Plastic Surgery, Brigham and Women’s Hospital, Harvard Medical School 10
Corresponding author: George L. King, MD. 11
Section of Vascular Cell Biology, Joslin Diabetes Center, Harvard Medical School, 1 Joslin 12
Place, Boston MA 02215 13
Tel: +1-617-309-2622 14
Fax: +1-617-309-2629 15
e-mail address: [email protected] 16
Running Title: IRS1 overexpression and wound healing 17
18
Page 1 of 39 Diabetes
Diabetes Publish Ahead of Print, published online May 23, 2016

2
Abstract 1
2
The effect of enhancing insulin’s actions in endothelial cells (EC) to improve angiogenesis 3
and wound healing was studied in obesity and diabetes. Insulin Receptor Substrate 1 (IRS1) 4
was overexpressed in EC using VE-cadherin promoter to create ECIRS1 TG mice, which 5
elevated pAkt activation and expressions of vascular endothelial growth factor (VEGF), 6
FLK1 and VE-cadherin in EC and granulation tissues (GT) of full thickness wounds. Open 7
wound and epithelialization rates and angiogenesis significantly improved in normal mice 8
and high fat (HF) diet induced diabetic mice with hyperinsulinemia in ECIRS1 TG vs. wild 9
type (WT), but not in insulin deficient diabetic mice. Increased angioblasts and EC numbers 10
in GT of ECIRS1 mice were due to proliferation in situ rather than uptake. GT in HF-fed 11
diabetic mice exhibited parallel decreases in insulin and VEGF induced pAkt and EC 12
numbers by >50% without changes in angioblasts vs. WT mice which were improved in 13
ECIRS1 TG mice on NC or HF diet. Thus HF induced diabetes impaired angiogenesis by 14
inhibiting insulin signaling in GT to decrease the differentiation of angioblasts to EC which 15
was normalized by enhancing insulin’s action targeted to EC, a potential target to improve 16
wound healing in diabetes and obesity. 17
18
Introduction 19
Every step of the complex process of wound healing has been reported to be 20
Page 2 of 39Diabetes

3
defective including impairments of neutrophil activation and responses, fibroblast migration 1
and proliferation, and angiogenesis (1-5). Poor glycemic control, neuropathy, presence of 2
micro- and macro-vascular complications and insulin resistance are associated with impaired 3
wound healing (6). Most strategies devised to improve chronic wound healing in diabetic 4
patients have not exhibited clear efficacy, possibly due to a lack of full understanding of the 5
mechanisms induced by diabetes to impair the wound healing process (5-8). 6
One major factor which contributes to impaired wound healing in diabetic and 7
insulin resistant states is reduced angiogenesis in the granulation tissue (GT) which could be 8
the result of decreased VEGF expression or its actions in response to hypoxia (4; 9; 10). 9
Multiple metabolic abnormalities can affect VEGF expression and actions including 10
hyperglycemia related oxidative stress, glycation products and activation of protein kinase C 11
(PKC) (10-13). Systemic insulin resistance could also affect angiogenesis since insulin’s 12
signaling can regulate VEGF expression which has been reported to be inhibited in diabetes 13
(14; 15). Thus, we postulate that insulin resistance may exist in the GT to impair angiogenesis, 14
by inhibiting insulin signaling to enhance VEGF expression and actions. 15
Insulin receptors are present in many cells of the GT, including: keratinocytes, 16
fibroblasts, endothelial cells and inflammatory cells (16-21). Mice with deletion of insulin 17
receptors in the fibroblasts and myocardium exhibited decreases in VEGF expression, and 18
capillary density in response to hypoxia (14). Insulin can induce VEGF expression mostly 19
Page 3 of 39 Diabetes

4
through the IRS1/PI3K/Akt pathway which is selectively inhibited in insulin resistance and 1
diabetes (14; 15; 22-24). Activation of pAkt affected VEGF secretion in keratinocytes, and 2
angiogenesis in cutaneous wound healing (25-27). The finding of insulin resistance may 3
impair wound healing also suggests differential pathogenic mechanisms may exist for 4
defective wound healing associated with diabetes due to insulin deficiency or resistance with 5
hyperinsulinemia. This study investigated the regulation of insulin signaling pathway in GT 6
and on the differentiation of angioblasts to endothelial cells in the GT using rodent diabetic 7
models of insulin deficiency or hyperinsulinemia and insulin resistance. 8
Materials and Methods 9
Wild type (WT) C57/BL6J mice were purchased from Jackson Laboratory (Bar 10
Harbor, Maine). Recombinant human VEGF (R&D Systems, Minneapolis, MN) and 11
antibodies to pAkt, Akt, pErk, Erk1/2, Fibronectin, IRS1 (Cell signaling, Danvers, MA), 12
VCAM1 (Millipore, Billerica, MA), Flk1, eNOS (BD Biosciences, San Jose, CA) and, 13
β-Actin (Santa Cruz Biotechnology Inc., Santa Cruz, CA) were obtained commercially. 14
Animals 15
All protocols for animal use and euthanasia were approved by the Animal Care 16
Committee of the Joslin Diabetes Center and are in accordance with NIH guidelines. Mice 17
with endothelial specific overexpression of IRS1 (ECIRS1 TG) with VE-cadherin promoter 18
were described previously (28) (Suppl. Fig. 1a). Following primers were used for IRS1 19
Page 4 of 39Diabetes

5
genotyping: 5’-ATCTGCAGGCAGCTCACAAAG-3’ and 5’-CGAAGAAGCGTTTGTGCA 1
TGC-3’. Two mice models of diabetes were used: 1) For hyperinsulinemia with insulin 2
resistance and hyperglycemia, male mice at age four weeks were fed with normal chow (NC), 3
(3.3% fat) or high fat (HF 60% fat) for ten weeks(28). Insulin deficient diabetic mice, was 4
produced by 5 consecutive days of intraperitoneal injection of 50 mg/kg streptozotocin (STZ) 5
(Sigma, St. Louis, MO) and fasting blood glucose concentrations of >400 mg/dl were 6
documented. Insulin treatment was performed using insulin pellet (LinShin Canada, Inc., 7
Canada) placed subcutaneously and with a release rate of 0.1u/day/insulin which were 8
adjusted to maintain plasma glucose at 150mg/dL range (at steady state) in STZ-induced 9
diabetic mice for 2 weeks. Intraperitoneal glucose tolerance tests (IPGTT) were performed as 10
described (29). 11
Wound Healing Model 12
Mice dorsal hair was depilated on the day before surgery (Nair; Church & Dwight, 13
Co., Inc., Ewing, NJ), and anesthetized by isoflurane inhalation (Isoflurane, USP; Novaplus, 14
LakeForest, Ill.). Their dorsum was disinfected with 70% alcohol and marked with standard 15
square template (1.0 cm2). Skin plus panniculus carnosus was excised to create a 16
full-thickness dorsal excisional wound, which was covered with transparent, semi-occlusive 17
adhesive polyurethane dressings (Tegaderm; 3M, St. Paul, Minn) and changed 2 x per week 18
(30-32). 19
Page 5 of 39 Diabetes

6
Tissue morphometric analysis 1
Digital macroscopic images of the wound were analyzed using NIH ImageJ software 2
v1.40 (Bethesda, MD). Standardized photographs were taken on the day of surgery and 3rd
, 3
7th
, 10th
and 14th
days for 14 days, from a standard height. Re-epithelialization and open 4
wound surface were measured as a percentage of the initial wound area as published (30-32). 5
Wound kinetics were quantified as follow: open wound rate (OWR) = open wound / 6
initial area of wound size, contraction rate (CR) = contraction / initial area of wound size, and 7
epithelialization rate (ER) = epithelialization / initial area of wound size – contraction (30; 8
31). On days 3, 7 and 10 post-surgery, wounds from 7-8 animals in each group were 9
harvested as described (32). 10
For signaling studies, insulin (1U/kg body weight) was administrated intravenously 11
and GT were collected 10 minutes afterward. For histological studies, excised tissues were 12
fixed in 4% formalin at 4°C. Panoramic cross-sectional digital images of each wound were 13
examined using FSX100 microscope (Olympus, Center Valley, CA). 14
Immunofluorescence (IF) studies 15
Immunohistochemistry studies were performed using paraffin sections, incubated 16
with 0.5% BSA, and rabbit mAbs to CD31 (Dianova GmbH, Hamburg, CA) as primary 17
antibody to identify EC, followed by Alexa Flour 488-conjugated secondary antibodies 18
(Invitrogen, Gland Island, NY). Nuclei were counterstained with DAPI (Invitrogen). 19
Page 6 of 39Diabetes

7
Quantitative fluorescent analyses were performed using FSX100 microscope and Adobe 1
Photoshop CS Software (San Jose, CA). 2
Immunoblot and Immunoprecipitation Studies 3
GT, frozen in dry ice, was homogenized in ice-cold tissue lysis buffer, as described 4
(33). Protein concentration was determined by Bradford assay and processed as described 5
(33). 6
Real-time Polymerase Chain Reaction (RT-PCR) 7
RT-PCR procedures were used to assess mRNA levels (Applied Biosystems, Grand 8
Island, NY) and normalized to 36B4 or 18S rRNA. PCR primers used in the study are listed 9
in Supplemental Table 1. 10
Culture of endothelial cells: 11
Lung tissues from c57/BL6J mice were used to obtain primary endothelial cells and 12
used between passages 3-5 (33; 34). EC was incubated for 16 hours in DMEM containing 13
0.1% BSA and stimulated with 100nM insulin for 24 hours. Expression of VEGF165 in 14
media was measured by ELISA kit (R&D Systems). 15
Bone marrow cell transplantation 16
Bone marrow (BM) cells from green fluorescent protein (GFP) expressing mice 17
(Jackson Lab, Bar Harbor, Maine) were harvested from tibias and femurs by flushing with 18
Dulbecco’s PBS+ 5% FBS, resuspended and filtered through a 70um cell strainer (35). 19
Page 7 of 39 Diabetes
8
Erythrocytes were depleted using ACK lysis buffer (Lonza, Basel, Switzerland). BM cells 1
were stained with lineage marker mix (Lin: Anti-CD3e (17-A2), Anti-CD4 (L3T4), anti-CD8 2
(53-6.72), anti-B220 (RA3-6B2), anti-TER-119, anti-Gr-1 (RB6-8C5), anti-Mac-1 (M1/70) 3
from eBioscience, San Diego, CA). Flow cytometry sorted lineage negative cells were 4
transplanted intravenously (2x10⁶cells / mouse) into congenic recipient mice and analyzed 7 5
days after transplantation (36). 6
Evaluating proliferation in vivo 7
At four and six days post wounding, bromodeoxy uridine (BrdU, 100ul) was injected 8
intraperitoneally and BrdU in angioblasts or EC from blood and GT was detected by flow 9
cytometry after 7 days (FITC BrdU Flow Kits, BD) (37). 10
Flow Cytometry of cells in GT 11
Dissected GT were incubated with collagenase I, II, DNAse and hyaluronidase in 12
Hepes buffer for 30 minutes at 37ºC, and then filtered through 70um cell strainer with 13
erythrocytes depleted by ACK lysis buffer. Cells were incubated with insulin (100nM), 14
anti-CD16/32 (BioLegend, San Diego, CA), fixed in 2% formaldehyde and permeabilized 15
using the Perm/Wash buffer (BD Bioscience, San Diego, CA) followed by incubation with 16
monoclonal antibodies: anti-CD45, for leukocyte, anti-CD31 for EC or anti-Flk1, marker for 17
angioblast and PI for viability. Rabbit-anti-Akt and rabbit-anti-phospho-Akt (Ser473) were 18
used to detect Akt activation, which were followed with Alexa Fluor ®647 goat anti-rabbit 19
Page 8 of 39Diabetes
9
IgG. All populations were routinely k-gated to verify purity and gating. One million cells 1
from BM or 200,000 cells from GT were analyzed using FlowJo software version 10.0 (Tree 2
Star, Inc., Ashland, OR). 3
Statistical Analysis 4
Values are expressed as mean and standard error (SE) of the mean. Student t tests 5
were performed for comparison of two groups. One-way analysis of variance, followed with 6
Tukey-Kramer was performed for comparisons of multiple groups using SPSS 22.0 (SPSS, 7
Inc., Chicago, Ill.). A value of p < 0.05 was considered significant. 8
Results 9
Characterization of ECIRSI transgenic mice and insulin signaling in GT. 10
To enhance insulin’s actions, IRS1 was overexpressed in the EC using VE-cadherin 11
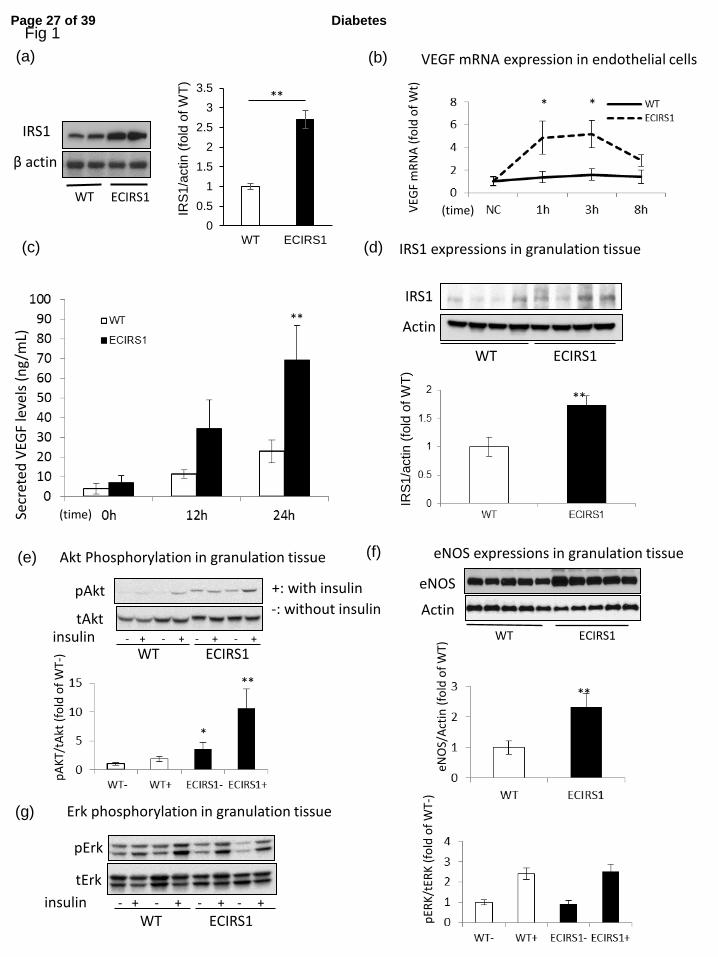
promoter to produce ECIRS1 TG mice which elevated IRSI expression in the EC by 170% 12
and in the retina, but not in PBMC (Fig. 1a & Suppl. Fig. 1b and c). Metabolically, WT and 13
ECIRS1 TG mice did not differ by glucose tolerance as measured by IPGTT and fasting 14
plasma insulin levels (Suppl. Fig. 1d and e). 15
Insulin increased VEGFB mRNA expression by 240% at 1 and 3 hours and protein 16
levels in the media by 200% after 24 hrs in EC from ECIRS1 TG mice vs WT mice (Fig. 1b 17
and c). IRS1 protein expression was increased in GT from ECIRS1 TG mice by 72% as 18
compared to WT mice (Fig. 1d, p<0.01). Further, Akt phosphorylation (pAkt) in the GT of 19
Page 9 of 39 Diabetes

10
ECIRS1 TG mice was significantly increased at basal (261%, p < 0.05) and after the addition 1
of insulin (480% <0.01) compared to WT (Fig. 1e), without difference in insulin’s activation 2
of Erk (p-Erk) (Fig. 1g). Expressions of eNOS, a marker of capillary density, in the GT also 3
increased significantly by 133% comparing ECIRS1 TG to WT mice. (Fig. 1f) 4
Insulin’s actions on wound healing in control and STZ-induced diabetic mice 5
The effect of increasing IRS1 expression and insulin’s actions in EC on wound 6
healing was evaluated by comparing OWR, CR, and ER in WT and ECRIS1 TG mice. The 7
results indicated that OWR decreased more rapidly in ECRS1 TG mice vs WT mice with 8
improvements at 3 and 7 days (p < 0.01) (fig. 2a – e). CR was significantly improved on day 9
14 and ER was increased in ECRIS1 TG mice by 96% and 48% on 3 and 7 days, respectively. 10
VEGF mRNA and FLK1 protein expressions in the GT were also increased significantly on 11
day 7 and VE-cadherin expression was increased on day 10. No changes in fibronectin were 12
observed comparing ECIRS1 TG to WT mice (Figs. 3a-d). 13
STZ induced diabetic ECIRS1 TG and WT mice had comparable weights and fasting 14
blood glucose of more than 500 mg/dl during the study (Suppl. Figs. 2a and b), with 15
comparable plasma insulin levels of < 0.2 ng/ml which were 4 times lower than non-diabetic 16
mice (Suppl. Fig. 2c). STZ diabetes delayed OWR, CR and ER significantly, compared to 17
non-diabetic WT and ECIRS1 TG mice at the 3 and 7 days (Figs. 2a - e) although no 18
differences were observed between diabetic STZWT and STZECIRS1 TG mice. VEGF 19
Page 10 of 39Diabetes
11
mRNA expression in the GT after 7 days of wound initiation was decreased by 38 % in STZ 1
WT vs. WT mice (p< 0.05) and in STZECIRS1 vs. ECIRS1 mice (p< 0.01) (Suppl. Fig. 2d). 2
We also evaluated wound healing between STZWT mice treated with insulin (STZWTins) 3
and STZECIRS1 mice treated with insulin (STZECIRS1ins). The results showed that OWR 4
was decreased (p< 0.05), and ER was increased (p< 0.01) in STZECIRS1ins mice compared 5
to STZWTins mice at 7 days after injecting (Suppl. Figs. 3a-d). 6
Assessment of HF diet induced diabetes and hyperinsulinemia on wound healing. 7
To determine whether diabetes and hyperinsulinemia affect wound healing, we 8
studied HF feeding in ECIRS1 TG (ECIRS1HF) and WT (WTHF) mice. After 10 weeks of 9
HF feeding, body weights were significantly increased in both WTHF and ECIRS1HF mice 10
compared to NC. Fasting blood glucose levels were elevated equally in both WTHF and 11
ECIRS1HF mice to above 200 mg/dl after of HF feeding (Suppl. Figs. 4a and b). IP-GTT 12
were similarly elevated fasting and post–infusion glucose levels at 15 minutes >500 mg/dl 13
(Suppl. Fig. 4c). Fasting plasma insulin levels increased significantly from 0.5 to 2.5 and 14
3.2ng/dl in WTHF and ECIRS1HF mice (Suppl. Fig 4d). Fasting plasma IGF1 level also 15
increased in ECIRS1HF and WTHF mice (Suppl. Fig 4e). Interestingly, VEGF mRNA 16
expressions were increased in WTHF vs WT mice (p< 0.05), and in ECIRS1HF vs ECIRS1 17
TG mice by 276% and to 341% respectively (Fig. 3e). Analysis of the wound showed HF 18
feeding delayed OWR and ER at 3 and 7 days. Further, ECIRS1HF mice had significant 19
Page 11 of 39 Diabetes
12
greater reduction in OWR, and increased ER than WTHF mice at 3 and 7 days (Figs. 4a - d). 1
Thickness of GT measured at seven days after surgery was greater in ECIRS1 TG mice vs. 2
WT mice (p < 0.01). HF feeding decreased GT thickness in both WTHF and ECIRS1HF mice 3
(p<0.05, Figs. 5 a and b). Immunohistological analysis of the GT showed the number of 4
CD31 positive cells, a marker for EC and capillaries, were increased in ECIRS1 TG vs. WT 5
mice (p < 0.01). HF feeding for 10 weeks decreased CD31+ cells by 84% in WTHF vs. WT 6
mice (Figs. 5c and d), and decreased by 63% in ECIRS1HF vs ECIRS1 TG mice. However, a 7
290% elevation of CD31+ cell numbers was observed in ECIRS1HF vs. WTHF mice (p < 8
0.05, Figs. 5c and d). 9
Assessing HF diet induced insulin resistance and diabetes on angioblast and endothelial 10
cell distributions in GT. 11
To characterize the potential mechanism for the reduction of EC in the GT associated 12
with HF diet, the distribution of angioblasts and EC in the GT of WT and ECIRS1 TG mice 13
on NC and HF were characterized. Angioblasts were identified by FLK1+, PI
-, CD45
- and 14
CD31-, and EC by CD45
-, PI
- and CD31
+ cell staining. Angioblast numbers increased 15
significantly by 50% in ECIRS1 TG compared to WT mice and by 65% in ECIRS1HF vs 16
WTHF mice (Figs. 6a and b). Interestingly, the elevations of angioblast levels were similar 17
between NC and HF fed WT and ECIRS1 TG mice. EC numbers in GT increased by 95% in 18
ECIRS1 TG vs. WT mice on NC. However, HF feeding decreased EC levels by 72% in 19
Page 12 of 39Diabetes
13
WTHF mice compared to WT mice (p < 0.01). Similarly, ECIRS1 HF fed mice also had 64% 1
less EC than ECIRS1 TG mice (Figs. 6a and b). However, EC levels in the GT were 2
significantly increased by 95% in ECIRS1 TG mice vs. WT mice (Fig. 6b). IRS1 3
overexpression in the EC only partially restored its reduction induced by HF feeding and 4
diabetes with elevation of EC by 150% in ECIRS1 HF vs. WTHF mice (Fig. 6b). 5
DNA synthesis of EC and angioblast were measured by BrdU incorporation in GT and bone 6
marrow. Figure 7a showed proliferation of angioblasts in the GT was increased by 47% in 7
ECIRS1 TG vs. WT mice (p<0.05), but no differences in BrdU incorporation were noted in 8
these cells in the bone marrow (Fig. 7b). To determine whether the elevation of angioblasts 9
and EC in the GT of ECIRS1 TG mice could also be due to uptake from circulation rather 10
than proliferation in situ, the uptake of circulating Lin- and GFP+ cells, which were negative 11
for PI, B220, CD4, CD8, Ter119, CD11b and Ly6G cells and isolated from bone marrow of 12
GFP+ mice, were infused into WT and ECIRS1 TG mice. Figs. 7c and d showed that no 13
increases of GFP+ cells in the GT of ECIRS1 TG or WT mice were observed. 14
Analysis of insulin’s signaling in isolated angioblasts and EC from granulation tissue. 15
To support the findings that insulin actions could be inhibited by HF diet and 16
positively enhanced by IRS1 overexpression in EC of ECIRS1 TG mice, IRS1 expressions 17
and signal changes in pAkt were studied in angioblasts and EC isolate from the GT. The 18
results showed that IRS1 expression was increased specifically in the EC of ECIRS1 TG 19
Page 13 of 39 Diabetes

14
mice by 291% (p< 0.01), but not in the angioblasts (Figs. 8a and b). IRS1 expression was 1
associated with the expression of VE-cadherin since its promoter was used in the transgene to 2
make ECIRS1 TG mice (Suppl. Fig. 1a). VE-cadherin expressions were only observed in EC 3
but not in angioblasts (Fig. 8c). The levels of pAkt stimulated by insulin (100 nM) were 4
similar in angioblasts from TG and WT mice (Fig. 8d) as assessed by FACS using antibodies 5
to pAkt. Similarly, HF feeding did not affect pAkt levels in angioblasts from WT or 6
ECIRS1TG mice. Unlike angioblasts, insulin induced pAkt levels in EC from GT were 7
significant higher by 196% in ECIRS1TG mice compared to WT mice (Fig. 8e). In contrast, 8
insulin induced pAkt levels only increased by 127% in EC isolated from HF fed ECIRS1HF 9
compared to WTHF mice (Fig. 8e). Unlike the angioblasts, the levels of pAkt were 10
significantly lower by 50% in the EC of GT from ECIRS1 HF mice vs. from or WT mice on 11
NC (Fig. 8e). Similarly, pAkt levels in the EC from ECIRS1 HF were decreased by 64% vs 12
ECIRS1 TG mice. Nevertheless, insulin induced pAkt levels in EC from ECIRS1 HF mice 13
were still significantly higher than those from WTHF mice by 107% (Fig. 8e). The levels of 14
pAkt stimulated by VEGF (2.5ng/ml) in angioblasts from GT were significantly higher in WT 15
mice compared to WTHF mice (Fig. 8f). 16
17
Discussion 18
This study demonstrated that enhancing insulin actions in the EC can improve wound healing 19
in non-diabetic, diabetic and insulin resistant states when insulin is present. Further we have 20
Page 14 of 39Diabetes

15
identified a novel defect in the differentiation of angioblast to EC with a parallel reduction of 1
insulin induced pAkt as a potential mechanism for the deficiency in angiogenesis in the GT 2
induced by diabetes and insulin resistance. 3
Our study confirmed that diabetes whether due to insulin deficiency or insulin resistance by 4
HF diet can impair both angiogenesis and the wound healing process (6; 38; 39). However, 5
mechanisms causing the impaired wound healing process may be different when diabetes is 6
the due to insulin deficiency or obesity and insulin resistance. In the insulin deficiency model, 7
enhancement of insulin action in the ECs did not have any beneficial effects on wound 8
healing which support the conclusion that the improvement in ECIRS1 TG mice was likely 9
due to enhancing of insulin’s actions in the EC of the granulation tissues. Evaluation of the 10
GT in ECIRS1 TG mice showed a sequential elevation of VEGF, FLK1 and VE-cadherin 11
expressions after the initial injury compared to WT mice. These findings strongly supported 12
the idea that improving insulin’s actions in EC enhanced VEGF expression and its signaling 13
cascades to improve angiogenesis and wound healing. It is also possible that insulin may 14
have perivascular effects due to its specific action on the ECs, such as the activation eNOS, to 15
elevate NO and blood flow from the increases in angiogenesis to enrich the cells of the GT 16
and improve wound healing (20; 33; 34; 40). Further, increased blood flow to GT has been 17
reported to improve the influx of inflammatory cells which can enhance angiogenesis (21). 18
Clearly, the elevated VEGF expression in the GT observed in ECIRS1 TG mice is likely due 19
Page 15 of 39 Diabetes

16
to the enhancement of insulin signaling through the IRS1/PI3K/Akt pathway, which has been 1
shown to regulate VEGF expression in EC (14; 40; 41). 2
The reduced in VEGF expression in the GT from STZ induced diabetic mice, which has been 3
reported, is likely due to insulin deficiency (3; 6; 42). This conclusion is supported by the 4
findings of the paradoxical increases of VEGF expression in GT from mice with HF induced 5
diabetes, which exhibited hyperinsulinemia rather than insulin deficiency. Hyperinsulinemia 6
may induce VEGF not only in ECs, but from fibroblasts and inflammatory cells (14; 42). The 7
paradoxical findings of VEGF expression in GT indicate that the impaired angiogenesis in 8
wound healing may have different pathogenic mechanisms for insulin resistant and deficient 9
induced diabetes. This study provided the first direct comparative analysis of GT and wound 10
healing between insulin deficient and hyperinsulinemic and insulin resistant models of 11
diabetes. A previous report showed that VEGF expression in whole wound from HF fed mice 12
was similar to control diet, but higher than ob/ob diabetic mice (39). 13
Interestingly, HF induced obesity clearly caused defects in GT formation and angiogenesis 14
with decreased capillary density, even in the presence of hyperinsulinemia, and elevated 15
VEGF levels suggesting the possibility of resistance to insulin or VEGF actions in the GT of 16
WTHF or ECIRS1HF mice. Analysis of GT cells indicated that enhancing EC’s insulin action 17
increased both angioblasts and ECs. Interestingly, diabetes and insulin resistance inhibited 18
only EC and not angioblasts in the GT numbers. This provided the first identification that 19
Page 16 of 39Diabetes
17
defect in capillary formation in GT induced by diabetes or insulin resistance is partly due to a 1
selective inhibition in the differentiation of angioblasts to ECs. Further, the reduction of ECs 2
could only be partially normalized by improving insulin’s signaling in the ECs, even though 3
VEGF levels were elevated in HF conditions. Our results also provide evidence that insulin 4
can have actions on angioblasts as shown by increasing DNA synthesis of angioblasts in the 5
GT of ECIRS1 TG mice may not be inhibited by obesity or diabetes since angioblast numbers 6
were not changed in these states. The effect of insulin to increase angioblasts and ECs in the 7
GT was the results of elevating in situ cellular proliferation since there were no increases in 8
the uptake from infused GFP labeled angioblasts or EC in WT or ECIRS1 TG mice. 9
Signaling studies indicated that HF diet induced selective inhibition of insulin induced pAkt 10
in the ECs but not in the angioblasts which is consistent with the finding that HF diet did not 11
decrease the number of angioblasts but only the ECs. These findings confirmed the idea that 12
diabetes and insulin resistance caused a selective defect in the differentiation of angioblasts to 13
EC. By using VE-cadherin promotor, IRS1 overexpression is limited to EC and not in 14
angioblasts which do not express VE-cadherin (43). This approach may not enhance 15
angioblasts differentiation to EC which appears to be abnormal also in diabetes. This study 16
suggests that angioblasts are sensitive to insulin. Previously, Schatteman et al., reported that 17
circulating angioblasts responded initially to insulin at 6-12 µg/ml but they become resistant 18
after prolonged exposure, which the authors suggested is the reason the hyperinsulinemia of 19
Page 17 of 39 Diabetes
18
type 2 diabetes could be causing poor angiogenesis in wound healing. However, the level of 1
insulin used by Schattaman et al., was ≈ 1uM, which is much higher than physiological levels 2
(<10nM), which makes the finding difficult to interpret for in vivo studies (44). 3
These studies provide documentation that diabetes caused by insulin deficiency or diet 4
induced obesity can induce a selective abnormality in the differentiation of angioblasts to ECs 5
in the GT which is related to resistance of pAkt activation induced by insulin and possibly 6
VEGF. Detailed studies to understand the mechanisms that are causing the inhibition of 7
insulin’s or VEGF activation of pAkt in the GT in diabetes will need to be performed in the 8
future. Further, we also observed that enhancing insulin action specifically in the ECs through 9
the IRS1/PI3K/pAkt pathway could improve wound healing both in non-diabetic and 10
obesity-induced diabetes, suggesting a new therapeutic target for wound healing. 11
12
Author contributions 13
S.K. performed most of the experiments and wrote the 1st draft of the manuscript. 14
K.P., Y.M., M.K., Q.L. and H.Y. assisted in some studies and reviewed the manuscript. L.L. 15
and D.P.O. provided expertise on the wound healing model. T. N. and A.W. provided advice 16
on the analysis of the angioblasts and EC from GT and BM. A.M. made the ECIRS1 TG 17
mouse. G.L.K. supervised all the studies and the writing of the manuscript. We want to thank 18
Mr. Scott Gordon at Joslin Diabetes Center in the preparation of the manuscript. 19
Page 18 of 39Diabetes

19
Acknowledgement 1
This work was supported by a National Institutes of Health/NIDDK R01 DK053105-13 grant 2
to G.L.K. S.K. is the recipient of a Research Fellowship (Hiroo Kaneda Scholarship, Sunstar 3
Foundation, Japan), DRC grant P30DK036836 and grant-in-Aid for Scientific Research from 4
the Japan Society for the Promotion of Science (26463128) also provided support. The 5
authors declare no potential conflicts of interest in this study. 6
7
8
9
10
11
12
13
14
15
16
17
18
19
Page 19 of 39 Diabetes

20
1
References 2
1. Boulton AJ, Vileikyte L, Ragnarson-Tennvall G, Apelqvist J: The global burden of diabetic 3
foot disease. Lancet 2005;366:1719-1724 4
2. Brandner JM, Zacheja S, Houdek P, Moll I, Lobmann R: Expression of matrix 5
metalloproteinases, cytokines, and connexins in diabetic and nondiabetic human 6
keratinocytes before and after transplantation into an ex vivo wound-healing model. Diabetes 7
Care 2008;31:114-120 8
3. Wetzler C, Kampfer H, Stallmeyer B, Pfeilschifter J, Frank S: Large and sustained 9
induction of chemokines during impaired wound healing in the genetically diabetic mouse: 10
prolonged persistence of neutrophils and macrophages during the late phase of repair. J Invest 11
Dermatol 2000;115:245-253 12
4. Lerman OZ, Galiano RD, Armour M, Levine JP, Gurtner GC: Cellular dysfunction in the 13
diabetic fibroblast: impairment in migration, vascular endothelial growth factor production, 14
and response to hypoxia. Am J Pathol 2003;162:303-312 15
5. Falanga V: Wound healing and its impairment in the diabetic foot. Lancet 16
2005;366:1736-1743 17
6. Brem H, Tomic-Canic M: Cellular and molecular basis of wound healing in diabetes. J 18
Clin Invest 2007;117:1219-1222 19
7. Thangapazham RL, Darling TN, Meyerle J: Alteration of skin properties with autologous 20
dermal fibroblasts. Int J Mol Sci 2014;15:8407-8427 21
8. Driskell RR, Lichtenberger BM, Hoste E, Kretzschmar K, Simons BD, Charalambous M, 22
Ferron SR, Herault Y, Pavlovic G, Ferguson-Smith AC, Watt FM: Distinct fibroblast lineages 23
determine dermal architecture in skin development and repair. Nature 2013;504:277-281 24
9. Thangarajah H, Yao D, Chang EI, Shi Y, Jazayeri L, Vial IN, Galiano RD, Du XL, Grogan 25
R, Galvez MG, Januszyk M, Brownlee M, Gurtner GC: The molecular basis for impaired 26
hypoxia-induced VEGF expression in diabetic tissues. Proc Natl Acad Sci U S A 27
2009;106:13505-13510 28
10. Brownlee M: Biochemistry and molecular cell biology of diabetic complications. Nature 29
2001;414:813-820 30
11. Wendt T, Harja E, Bucciarelli L, Qu W, Lu Y, Rong LL, Jenkins DG, Stein G, Schmidt 31
AM, Yan SF: RAGE modulates vascular inflammation and atherosclerosis in a murine model 32
of type 2 diabetes. Atherosclerosis 2006;185:70-77 33
12. Koya D, King GL: Protein kinase C activation and the development of diabetic 34
complications. Diabetes 1998;47:859-866 35
13. Geraldes P, King GL: Activation of protein kinase C isoforms and its impact on diabetic 36
Page 20 of 39Diabetes
21
complications. Circ Res 2010;106:1319-1331 1
14. He Z, Opland DM, Way KJ, Ueki K, Bodyak N, Kang PM, Izumo S, Kulkarni RN, Wang 2
B, Liao R, Kahn CR, King GL: Regulation of vascular endothelial growth factor expression 3
and vascularization in the myocardium by insulin receptor and PI3K/Akt pathways in insulin 4
resistance and ischemia. Arterioscler Thromb Vasc Biol 2006;26:787-793 5
15. Miele C, Rochford JJ, Filippa N, Giorgetti-Peraldi S, Van Obberghen E: Insulin and 6
insulin-like growth factor-I induce vascular endothelial growth factor mRNA expression via 7
different signaling pathways. J Biol Chem 2000;275:21695-21702 8
16. Apikoglu-Rabus S, Izzettin FV, Turan P, Ercan F: Effect of topical insulin on cutaneous 9
wound healing in rats with or without acute diabetes. Clin Exp Dermatol 2010;35:180-185 10
17. Madibally SV, Solomon V, Mitchell RN, Van De Water L, Yarmush ML, Toner M: 11
Influence of insulin therapy on burn wound healing in rats. J Surg Res 2003;109:92-100 12
18. Wilson JM, Baines R, Babu ED, Kelley CJ: A role for topical insulin in the management 13
problematic surgical wounds. Ann R Coll Surg Engl 2008;90:160 14
19. Rezvani O, Shabbak E, Aslani A, Bidar R, Jafari M, Safarnezhad S: A randomized, 15
double-blind, placebo-controlled trial to determine the effects of topical insulin on wound 16
healing. Ostomy Wound Manage 2009;55:22-28 17
20. Lima MH, Caricilli AM, de Abreu LL, Araujo EP, Pelegrinelli FF, Thirone AC, Tsukumo 18
DM, Pessoa AF, dos Santos MF, de Moraes MA, Carvalheira JB, Velloso LA, Saad MJ: 19
Topical insulin accelerates wound healing in diabetes by enhancing the AKT and ERK 20
pathways: a double-blind placebo-controlled clinical trial. PLoS One 2012;7:e36974 21
21. Gurtner GC, Werner S, Barrandon Y, Longaker MT: Wound repair and regeneration. 22
Nature 2008;453:314-321 23
22. Somanath PR, Chen J, Byzova TV: Akt1 is necessary for the vascular maturation and 24
angiogenesis during cutaneous wound healing. Angiogenesis 2008;11:277-288 25
23. Hinz B: Formation and function of the myofibroblast during tissue repair. J Invest 26
Dermatol 2007;127:526-537 27
24. Somanath PR, Kandel ES, Hay N, Byzova TV: Akt1 signaling regulates integrin 28
activation, matrix recognition, and fibronectin assembly. J Biol Chem 2007;282:22964-22976 29
25. Werner S, Krieg T, Smola H: Keratinocyte-fibroblast interactions in wound healing. J 30
Invest Dermatol 2007;127:998-1008 31
26. Goren I, Muller E, Schiefelbein D, Gutwein P, Seitz O, Pfeilschifter J, Frank S: Akt1 32
controls insulin-driven VEGF biosynthesis from keratinocytes: implications for normal and 33
diabetes-impaired skin repair in mice. J Invest Dermatol 2009;129:752-764 34
27. Nakai K, Yoneda K, Moriue T, Igarashi J, Kosaka H, Kubota Y: HB-EGF-induced VEGF 35
production and eNOS activation depend on both PI3 kinase and MAP kinase in HaCaT cells. 36
J Dermatol Sci 2009;55:170-178 37
28. Park K, Mima A, Li Q, Rask-Madsen C, He P, Mizutani K, Katagiri S, Maeda Y, Wu IH, 38
Page 21 of 39 Diabetes

22
Khamaisi M, Preil SR, Maddaloni E, Sorensen D, Rasmussen LM, Huang P, King GL: 1
Insulin's novel mechanis, to decrease atherosclerosis by unducing ETBR expression. J Clin 2
Invest Insight 2016 (In press); 3
29. Rask-Madsen C, Li Q, Freund B, Feather D, Abramov R, Wu IH, Chen K, 4
Yamamoto-Hiraoka J, Goldenbogen J, Sotiropoulos KB, Clermont A, Geraldes P, Dall'Osso C, 5
Wagers AJ, Huang PL, Rekhter M, Scalia R, Kahn CR, King GL: Loss of insulin signaling in 6
vascular endothelial cells accelerates atherosclerosis in apolipoprotein E null mice. Cell 7
Metab 2010;11:379-389 8
30. Pietramaggiori G, Scherer SS, Mathews JC, Gennaoui T, Lancerotto L, Ragno G, Valeri 9
CR, Orgill DP: Quiescent platelets stimulate angiogenesis and diabetic wound repair. J Surg 10
Res 2010;160:169-177 11
31. Pietramaggiori G, Kaipainen A, Ho D, Orser C, Pebley W, Rudolph A, Orgill DP: 12
Trehalose lyophilized platelets for wound healing. Wound Repair Regen 2007;15:213-220 13
32. Succar J, Douaiher J, Lancerotto L, Li Q, Yamaguchi R, Younan G, Pejler G, Orgill DP: 14
The role of mouse mast cell proteases in the proliferative phase of wound healing in 15
microdeformational wound therapy. Plast Reconstr Surg 2014;134:459-467 16
33. Park K, Li Q, Rask-Madsen C, Mima A, Mizutani K, Winnay J, Maeda Y, D'Aquino K, 17
White MF, Feener EP, King GL: Serine phosphorylation sites on IRS2 activated by 18
angiotensin II and protein kinase C to induce selective insulin resistance in endothelial cells. 19
Mol Cell Biol 2013;33:3227-3241 20
34. Li Q, Park K, Li C, Rask-Madsen C, Mima A, Qi W, Mizutani K, Huang P, King GL: 21
Induction of vascular insulin resistance and endothelin-1 expression and acceleration of 22
atherosclerosis by the overexpression of protein kinase C-beta isoform in the endothelium. 23
Circ Res 2013;113:418-427 24
35. Song G, Nguyen DT, Pietramaggiori G, Scherer S, Chen B, Zhan Q, Ogawa R, Yannas IV, 25
Wagers AJ, Orgill DP, Murphy GF: Use of the parabiotic model in studies of cutaneous 26
wound healing to define the participation of circulating cells. Wound Repair Regen 27
2010;18:426-432 28
36. Rao TN, Marks-Bluth J, Sullivan J, Gupta MK, Chandrakanthan V, Fitch SR, Ottersbach 29
K, Jang YC, Piao X, Kulkarni RN, Serwold T, Pimanda JE, Wagers AJ: High-level Gpr56 30
expression is dispensable for the maintenance and function of hematopoietic stem and 31
progenitor cells in mice. Stem Cell Res 2015;14:307-322 32
37. Seth AK, De la Garza M, Fang RC, Hong SJ, Galiano RD: Excisional wound healing is 33
delayed in a murine model of chronic kidney disease. PLoS One 2013;8:e59979 34
38. Moura J, Borsheim E, Carvalho E: The Role of MicroRNAs in Diabetic 35
Complications-Special Emphasis on Wound Healing. Genes (Basel) 2014;5:926-956 36
39. Seitz O, Schurmann C, Hermes N, Muller E, Pfeilschifter J, Frank S, Goren I: Wound 37
healing in mice with high-fat diet- or ob gene-induced diabetes-obesity syndromes: a 38
Page 22 of 39Diabetes

23
comparative study. Exp Diabetes Res 2010;2010:476969 1
40. Maeno Y, Li Q, Park K, Rask-Madsen C, Gao B, Matsumoto M, Liu Y, Wu IH, White MF, 2
Feener EP, King GL: Inhibition of insulin signaling in endothelial cells by protein kinase 3
C-induced phosphorylation of p85 subunit of phosphatidylinositol 3-kinase (PI3K). J Biol 4
Chem 2012;287:4518-4530 5
41. Taylor SM, Nevis KR, Park HL, Rogers GC, Rogers SL, Cook JG, Bautch VL: 6
Angiogenic factor signaling regulates centrosome duplication in endothelial cells of 7
developing blood vessels. Blood 2010;116:3108-3117 8
42. Khamaisi M, Katagiri S, Keenan H, Park K, Maeda Y, Li Q, Qi W, Thomou T, Eschuk D, 9
Tellechea A, Veves A, Huang C, Orgill DP, Wagers A, King GL: PKCdelta inhibition 10
normalizes the wound-healing capacity of diabetic human fibroblasts. J Clin Invest 11
2016;126:837-853 12
43. Giannotta M, Trani M, Dejana E: VE-cadherin and endothelial adherens junctions: active 13
guardians of vascular integrity. Dev Cell 2013;26:441-454 14
44. Schatteman GC, Hanlon HD, Jiao C, Dodds SG, Christy BA: Blood-derived angioblasts 15
accelerate blood-flow restoration in diabetic mice. J Clin Invest 2000;106:571-578 16
17
18
19
20
21
22
23
24
25
26
27
28
29
30
31
32
33
34
35
36
37
38
Page 23 of 39 Diabetes

24
1
2
Figure legends 3
Figure 1: Characterization of insulin signaling and VEGF expression in lung EC and GT of 4
WT and ECIRS1 TG mice. (a) IRS1 protein expression in lung ECs, (b) VEGF mRNA 5
expressions in cultured ECs from WT and ECIRS1 TG mice with insulin stimulation 6
(100nM) at 1, 3 and 8 hours (c) secreted VEGF protein levels in the media of cultured ECs 7
from WT and ECIRS1 TG mice with insulin stimulation (100nM) at 0, 12 and 24 hours (d) 8
IRS1 protein expressions in granulation tissue in WT and ECIRS1 TG mice at 7 days 9
post-surgery. (e) Total Akt and pAkt expressions at 7days in granulation tissue (f) eNOS 10
expression in granulation tissue (g) Total Erk and pErk expressions in granulation tissue *: p< 11
0.05, **: p<0.01, (n=4 in Fig. 1a, n=5 in Fig. 1b – g). 12
Figure 2: Comparison of wound healing among WT, ECIRS1 TG, STZWT and STZECIRS1 13
TG mice (a) Photographs of wound at 0, 3, 7, 10 and 14 days in WT and ECIRS1 TG mice. 14
Black bar = 1 cm. (b) in STZWT and STZECIRS1 mice; (c) Open wound rate, (d) 15
Contraction rate and (e) Epithelialization rate (n=5) **: p<0.01. 16
Figure 3: Analysis of genes for vessels in granulation tissue in (a) VEGF mRNA expressions; 17
(b) Ve-cadherin mRNA expressions; (c) Flk1 expression; (d) fibronectin mRNA at 3, 7 and 10 18
days post-surgery in the granulation tissue from WT and ECIRS1 TG mice (n= 7 at each time 19
point); (e) VEGF mRNA levels in the granulation tissues from WT, ECIRS1, WTHF and 20
ECIRS1HF mice at 7 days post-surgery *: p< 0.05, **: p<0.01 (n=7) 21
Page 24 of 39Diabetes

25
Figure 4: Comparison of wound healing among WT, ECIRS1, WTHF and ECIRS1HF mice 1
*: p< 0.05, **: p<0.01 (a) Photographs of wound at 0, 3, 7, 10 and 14 days after surgery. 2
Black bar = 1 cm. (b) Open wound rate (%). (c) Contraction rate (%). (d) Epithelialization 3
rate (%) (n=5 for each type of mice and at each time point). 4
Figure 5: Histological analysis of the wound 7 days post-surgery in WT, ECIRS1, WTHF and 5
ECIRS1HF mice. *: p< 0.05, **: p<0.01 (a) HE stained photograph. Black bar = 1 cm. G: 6
granulation tissue, E: epidermis, D: dermis, F: fatty tissue (b) Thickness of granulation tissue. 7
(n=5) (c) IHC of granulation tissue. Blue: DAPI. Green: CD31. (d) Percentage of CD31+ cells 8
isolated from GT (n=5). 9
Figure 6: Characterization of angioblasts and ECs in granulation tissue by flow cytometry at 10
7 days post-surgery in WT, ECIRS1, WTHF and ECIRS1HF mice. (a) angioblasts: 11
PI(-)CD45(-)Flk1(+)CD31(-), ECs: PI(-)CD45(-)Flk1(-/+)CD31(+). (b) Percentage of 12
angioblasts and ECs in PI(-)CD45(-) cells. n=5 *: p< 0.05, **: p<0.01 13
Figure 7: Analysis of angioblasts and ECs proliferation and uptake in granulation tissue (GT) 14
7 days after surgery in WT and ECIRS1 TG mice. *: p< 0.05 (a) BrdU positive cells in bone 15
marrow (BM). (n=7) (b) Percentage of angioblasts and ECs in PI(-)CD45(-) cells in BM. (c) 16
Flow cytometry analysis of uptake of lineage negative cells in granulation tissue. (n=6), (d) 17
GFP positive cells (%) in granulation tissue and blood at 7 days after cells transplantation 18
from GFP mice to WT and ECIRS1 TG mice. 19
Page 25 of 39 Diabetes

26
Figure 8: Expression and insulin/VEGF activation of signaling molecules in angioblasts and 1
endothelial cells in granulation tissue from WT, ECIRS1, WTHF and ECIRS1HF mice. (a) 2
IRS1 mRNA expression in angioblasts. (b) IRS1 mRNA expression in ECs of WT and 3
ECIRS1 TG mice. (c) Ve-cadherin mRNA expression in angioblasts and ECs; (d) analysis for 4
insulin induced (100nM) Akt phosphorylation in angioblasts and (e) ECs (f) analysis for 5
VEGF induced (2.5ng/ml) Akt phosphorylation in angioblasts by using flow cytometry 6
measuring the mean of the peak of fluorescent intensity. *: p< 0.05, **: p<0.01 (n=5). 7
8
Page 26 of 39Diabetes
(b)
Fig 1
(a)
(c)
IRS1
β actin
WT ECIRS1
* *
**
VEGF mRNA expression in endothelial cells
Secr
eted
VEG
F le
vels
(n
g/m
L)
IRS1
Actin
**
WT ECIRS1
(d) IRS1 expressions in granulation tissue
IRS
1/a
ctin (
fold
of W
T)
(e)
pAkt
tAkt
WT ECIRS1 - + - + - + - + insulin
**
Akt Phosphorylation in granulation tissue
*
(f)
Actin
eNOS
ECIRS1 WT
**
eNOS expressions in granulation tissue
(g)
pErk
tErk
WT ECIRS1 - + - + - + - + insulin
Erk phosphorylation in granulation tissue
pA
KT/
tAkt
(fo
ld o
f W
T-)
VEG
F m
RN
A (
fold
of
Wt)
eNO
S/A
ctin
(fo
ld o
f W
T)
pER
K/t
ERK
(fo
ld o
f W
T-)
(time)
(time)
+: with insulin
-: without insulin
0
0.5
1
1.5
2
2.5
3
3.5
WT ECIRS1
IRS
1/a
ctin (
fold
of W
T)
**
Page 27 of 39 Diabetes

WT
ECIRS1
0day 3days 7days 10days 14days
STZWT
STZECIRS1
0day 3days 7days 10days 14days (b)
Fig.2 (a)
Contraction rate (%)
Epithelialization rate (%)
(c) (d)
(e)
**
**
**
**
**
No
rmal
ized
op
en w
ou
nd
are
a
(% o
f in
itia
l w
ou
nd
are
a)
Co
ntr
acti
on
rat
e
(% o
f in
itia
l wo
un
d)
Epit
hel
ializ
atio
n r
ate
Open wound rate (%)
(%
of
tota
l wo
un
d a
rea)
(day) (day)
(day)
Page 28 of 39Diabetes

0
0.5
1
1.5
2
2.5
3
3days 7days 10days
WT
ECIRS1
*
Fig.3
(b)
(c)
VE-
cad
her
in/3
6B
4 (
fold
of
WT
3 d
ays)
VEG
F/3
6B
4 (
fold
of
WT
3 d
ays)
*
Flk1
/Act
in (
fold
of
WT
3 d
ays)
Flk1
Actin
3 day 7 day 10 day
**
(d)
WT ECIRS1 WT ECIRS1 WT ECIRS1
Flk1 protein expressions
VEGF mRNA expressions Ve-cadherin mRNA expressions (a)
Fib
ron
ecti
n/3
6B
4 (
fo
ld o
f W
T 3
day
s)
Fibronectin mRNA expressions
0
0.5
1
1.5
2
2.5
3
3days 7days 10days
VEGF mRNA expressions at 7 days (e)
VEG
F/3
6B
4 (
fold
of
WT)
*
0
2
4
6
8
10
12
WT ECIRS1 WTHF ECIRS1HF
**
* **
**
Page 29 of 39 Diabetes

(day)
0day 3days 7days 10days 14days
WT HF
ECIRS1 HF
No
rmal
ized
op
en w
ou
nd
are
a
(% o
f in
itia
l w
ou
nd
are
a)
Contraction rate
Fig.4 (a)
Epithelialization rate
(b) (c)
(d)
** *
(day)
Open wound rate
(day)
Co
ntr
acti
on
rat
e
(% o
f in
itia
l wo
un
d)
Epit
hel
ializ
atio
n r
ate
(%
of
tota
l wo
un
d a
rea)
*
Page 30 of 39Diabetes

0
1
2
3
4
WT ECIRS1 WTHF ECIRS1HF
60% HF diet
Normal chow
WT ECIRS1
Perc
enta
ge o
f C
D3
1(+
) ce
lls(%
)
**
* **
** **
*
HF diet
WT TG
Normal chow
Fig.5
(c)
(b)
(d)
**
* **
* **
(a) Granulation tissue (HE staining)
Th
ickne
ss o
f
gra
nu
lation
tis
su
e (
mm
)
IHC (green: CD31, blue:Dapi) Percentage of CD31 (+) cells
G
G
E E
D
G
F
E D
D
G
F
D E
CD31, Dapi
Page 31 of 39 Diabetes

0
0.5
1
1.5
2
2.5
angioblasts endothelial cells
WT
ECIRS1
WTHF
ECIRS1HF
(% o
f P
I (-
) C
D4
+ (-
) C
ell
An
gio
bla
sts/
end
oth
elia
l ce
lls)
Fig.6
(b)
*
*
** **
**
**
*
WT
HF diet
ECIRS1
Percentage of angioblasts/endothelial cells in PI(-)CD45(-) cells from granulation tissue
Flow cytometry in granulation tissue (a)
Co
mp
-FIT
C-A
(C
D3
1)
Normal
chow
Co
mp
-FIT
C-A
(C
D3
1)
Comp-APC-A (Flk1) Comp-APC-A (Flk1)
Comp-APC-A (Flk1) Comp-APC-A (Flk1) C
om
p-F
ITC
-A (
CD
31
) C
om
p-F
ITC
-A (
CD
31
)
Page 32 of 39Diabetes

Per
cen
tage
of
BrD
U(+
) ce
lls
*
(%)
Fig. 7
Percentage of angioblasts/endothelial cells in PI(-)CD45(-) cells from bone marrow
(b) (a) BrdU positive cells in granulation tissue (GT) and bone marrow (BM)
(c)
WT blood ECIRS1 blood WT GT ECIRS1 GT
(d)
GF
P p
ositiv
e c
ells
(%
)
Flow cytometry after transplantation of Lineage(-) cells from GFP positive mice to WT/ECIRS1 mice
Comp-PI-A Comp-PI-A Comp-Pacific blue-A (CD45) Comp-Pacific blue-A (CD45)
PI (
-) C
D4
+ (-
) C
ells
Page 33 of 39 Diabetes

IRS1
/18
s
( fo
ld o
f W
T)
**
Fig.8
(d)
(b) IRS1 expression in ECs (a) IRS expression in angioblasts
**
pA
kt/t
Akt
(fo
ld o
f W
T)
p-Akt in angioblasts (stimulated with insulin)
(c) Ve-cadherin
WT ECIRS1 WT ECIRS1
Angioblasts Endothelial cells
pA
kt/t
Akt
(fo
ld o
f W
T) **
** **
Angioblasts Endothelial cells
Comp-APC-A:: p-AKT(Ser473)
0 10 2
10 3
10 4
10 5
0
20
40
60
80
100
p-Akt in endothelial cells (stimulated with insulin)
% o
f M
ax
0 10 2
10 3
10 4
10 5
0
20
40
60
80
100
% o
f M
ax
Comp-APC-A:: p-AKT(Ser473)
IRS1
/18
s
(fo
ld o
f W
T)
0
0.5
1
1.5
2
WT ECIRS1
0
0.5
1
1.5
Ve-
cad
her
in/1
8s
(f
old
of
WT
ECs)
NC
WTHF
ECIRS1HF
WT
ECIRS1
Angioblasts
*
pA
kt/t
Akt
(fo
ld o
f W
T)
(f) p-AKT in angioblasts (stimulated with VEGF)
0 -10 10 10 10 3 3 4 5
0
20
40
60
80
100
Comp-APC-A:: p-AKT(Ser473)
(e)
Page 34 of 39Diabetes

Table S1. Primers used for real-time quantitative RT-PCR analysis
Gene Primers
Sense (5'-3') Anti-sense (5'-3')
IRS1 TCTTCTGTTACACCTCAAGGA GAGTAGGTGCTGAGAAGG
vegf CTCGCAGTCCGAGCCGGAGA GGTGCAGCCTGGGACCACTTG
ve-cadgerin CAGCAACTTCACCCTCATAAAC TCCCGATTAAACTGCCCATAC
fibronectin CTTTGGCAGTGGTCATTTCAG ATTCTCCCTTTCCATTCCCG
36B4 GCTCCAAGCAGATGCAGCA CCGGATGTGAGGCAGCAG
18s GTAACCCGTTGAACCCCATT CCATCCAATCGGTAGTAGCG
Page 35 of 39 Diabetes

Supplemental Figure 1: Characterization of WT and ECIRS1 TG mice (a) construct of
promoter VE-cadherin –IRS1 (DNA) (b) IRS1 protein in retina (c) IRS1 protein in
PBMC (d) IP-GTT in WT and ECIRS1 mice (e) Fasting plasma insulin concentration in
WT and ECIRS1 mice
Page 36 of 39Diabetes

Supplemental Figure 2: Physiologic studies in STZWT and STZECIRS1 mice. (a) Body
weights at 4 and 8 weeks in mice (b) Fasting blood glucose at 8 weeks in mice (c)
Fasting plasma insulin concentration between among WT, ECIRS1, STZWT and
STZECIRS1 mice (n=5) **: p< 0.01 (d) VEGF mRNA expression in GT at 7 days from
WT, ECIRS1, STZWT and STZECIRS1 mice (n=7, *:p < 0.05, **: p< 0.01)
Page 37 of 39 Diabetes

Supplemental Figure 3: Comparison of wound healing among STZWT, STZECIRS1,
STZWTins and STZECIRS1ins mice *: p< 0.05, **: p<0.01 (a) Photographs of wound
at 0, 3, 7, 10 and 14 days after surgery. Black bar = 1 cm. (b) Open wound rate (%). (c)
Contraction rate (%). (d) Epithelialization rate (%) (n=5 for each type of mice and at
each time point).
Page 38 of 39Diabetes
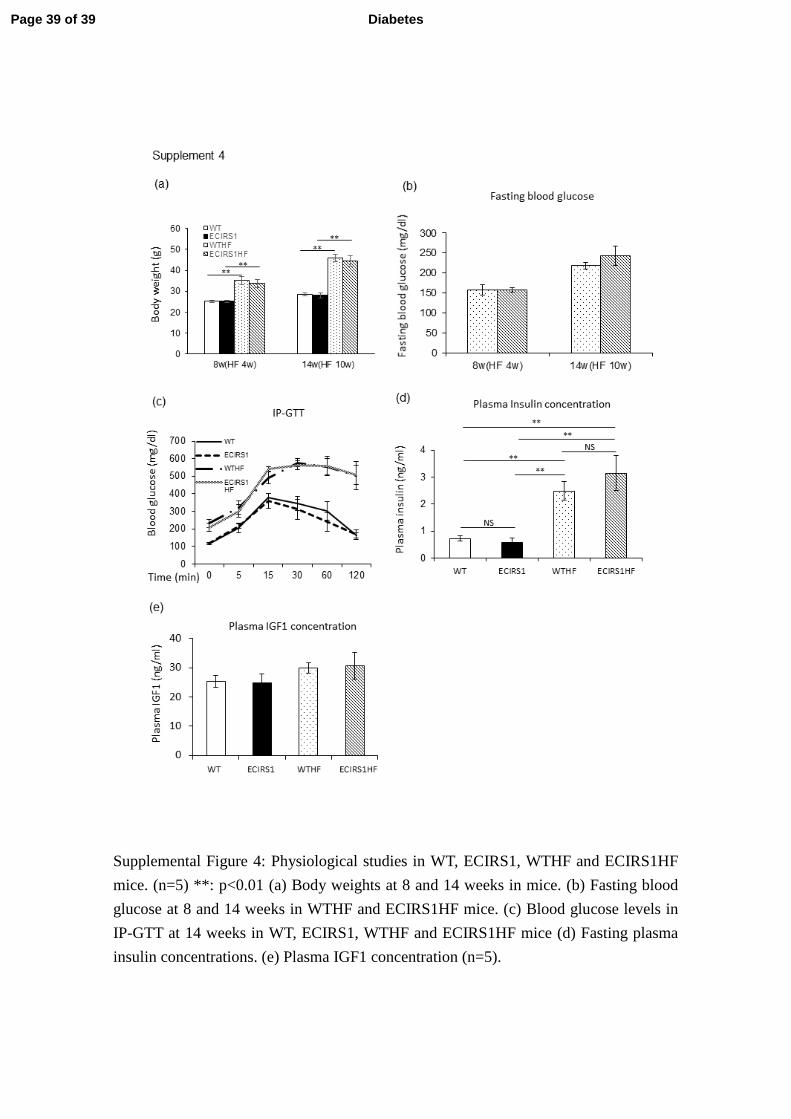
Supplemental Figure 4: Physiological studies in WT, ECIRS1, WTHF and ECIRS1HF
mice. (n=5) **: p<0.01 (a) Body weights at 8 and 14 weeks in mice. (b) Fasting blood
glucose at 8 and 14 weeks in WTHF and ECIRS1HF mice. (c) Blood glucose levels in
IP-GTT at 14 weeks in WT, ECIRS1, WTHF and ECIRS1HF mice (d) Fasting plasma
insulin concentrations. (e) Plasma IGF1 concentration (n=5).
Page 39 of 39 Diabetes