oversight – performance report 20 august 2015 july reporting period v
TRANSCRIPT

Oversight – Performance Report
20 August 2015 JULY reporting period
V

Overview
The purpose of this presentation is to provide context/word so support the performance of the metrics reported in CQC Dashboard in response to address the compliance areas of the CQC Action Plan as listed below:
• Compliance Action 1 : Staffing• Compliance Action 2 : Care and Welfare of People• Compliance Action 3 : Assessing and Monitoring• Compliance Action 4 : Safeguarding• Compliance Action 5 : Infection Control• Compliance Action 6 : Respecting and involving patients• Must Do’s• Should Do’s

Oversight ReportPublished Data for July 2015Version 1.2
Jan-15 Feb-15 Mar-15 Apr-15 May-15 Jun-15 Jul-15 Aug-15 Sep-15 Oct-15 Nov-15 Dec-15 TotalID Metric Target Notes
Compliance Action 1 - Staffing1 % of Paed staff working in department from 7am to 12pm in
l ine with required numberContract Hours % N/A 74.00% 81.00% 80.00% 63.00% 74.50%
Trajectory N/A 70% 75% 75% 80% 80% 90% 90% 100% 100%
6 % of Child ED arrival to assessment within 15 Mins greater 80% ( green ) Percentage of Patients 92.41% 87.59% 87.37% 78.58% 80.40% 84.38% 92.08% 86.11%
Trajectory 80% 80% 80% 80% 80% 80% 80% 80% 80% 80% 80% 80%
7 No. of Clinical CAMH Breaches - ED 0 0 0 1 2 3 0 1 7
Trajectory 0 0 0 0 0 0 0 0 0 0 0 0
12 PLANNED V ACTUAL for all Nursing Staff (to show staffi ng arrangements in place to meet needs of patients) Perm + Agency
greater 90% ( green ) HCA ( Contract Hours % )
114.49% 113.23% 93.53% 107.22% 110.74% 109.37% 100.28% 106.98%
Trajectory 90.0% 90.0% 90.0% 90.0% 90.0% 90.0% 90.0% 90.0% 90.0% 90.0% 90.0% 90.0%
greater 90% ( green ) Nursing & Midwifery( Contract Hours % )
101.06% 96.30% 103.00% 100.98% 97.59% 97.66% 95.13% 98.82%
Trajectory 90.0% 90.0% 90.0% 90.0% 90.0% 90.0% 90.0% 90.0% 90.0% 90.0% 90.0% 90.0%
13 Staff Turnover by Professional Group Less 10% ( green ) Medical & dental 11.04% 10.91% 10.53% 10.23% 11.11% 11.17% 11.05% 10.86%
Trajectory
Less 10% ( green ) Nursing & midwifery 9.62% 10.82% 12.09% 13.05% 12.68% 11.78% 12.87% 11.84%
Trajectory
Less 10% ( green ) Other clinical incl HCAs 17.86% 18.11% 17.48% 12.88% 13.32% 13.76% 14.30% 15.39%
Trajectory
Less 10% ( green ) Non-clinical 15.90% 15.55% 17.74% 18.39% 20.73% 19.91% 20.87% 18.44%
Trajectory
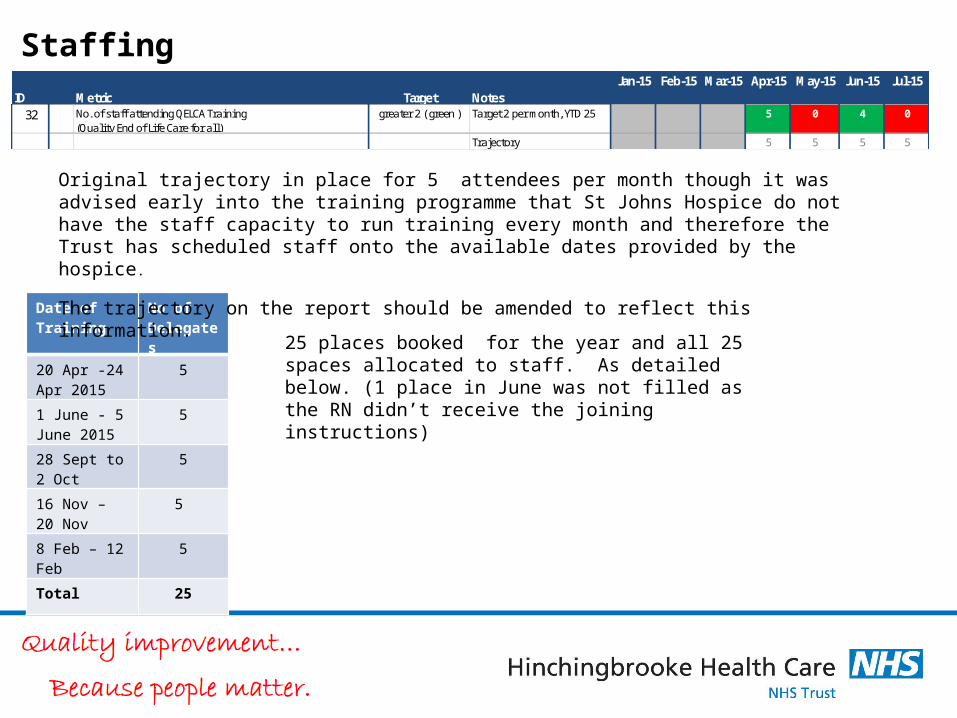
32 No. of staff attending QELCA Training (Quality End of Life Care for all)
greater 2 ( green ) Target 5 per every 2 months, YTD 25
5 0 4 0 9
Trajectory 5 5 5 5 5

Compliance Action 2 - Care and Welfare of PeopleMixed Sex Breaches 0 0 0 0 1 0 1 0 2
Trajectory 0 0 0 0 0 0 0 0 0 0 0 0
3 PEWS Observation Completion - 20% sample patients. greater 95% ( green ) 96.00% 97.00% 96.50%
Trajectory 95% 95% 95% 95% 95% 95% 95%
4 MEWS and MEOWs completion greater 80% (green) Data collection has commenced in May
83.00% 81.00% 82.00%
Trajectory 80% 80% 80% 80% 80% 80% 80%
9 No. of pressure Ulcers on all wards 0 Avoidable (1/2) 1 1 2 2 1 0 0 7
Trajectory 0 0 0 0 0 0 0 0 0 0 0 0
0 Avoidable (3/4) 0 0 0 0 0 0 1 1
Trajectory 0 0 0 0 0 0 0 0 0 0 0 0
10 Fluid chart compliance 100% Data collection has commenced in May. Initial 2 wards
87.00% 85.00% 86.00%
Trajectory 85% 87% 89% 92% 95% 97% 100%
11 % of delegates Completed HII catheter Training, 1.29% 2.94% 2.90% 8.42% 3.89%
Trajectory
% of delegates attending improving water low training, Includes SKINN Training 40.29% 43.17% 42.30% 42.69% 41.73%
Trajectory
% of delegates Completed HII VIP training Employee Mapping underway, % data due June. 21 59 95 170 170
Trajectory
15 No. of HCAI Cdif YTD 11 No of Cases 2 0 0 0 0 1 1 4
Trajectory 0 0 0 0 0 0 0 0 0 0 0 0
No. of MRSA 0 No of Cases 0 0 0 0 0 0 0 0
Trajectory 0 0 0 0 0 0 0 0 0 0 0 0
17 % of catheter related UTI's - All 0.82% 1.50% 1.69% 4.51% 3.30% 6.51% 2.19% 2.93%
Trajectory
% of catheter related UTI's - New 1% 0.00% 0.77% 0.42% 1.23% 0.47% 0.93% 0.00% 0.55%
Trajectory 0% 0% 0% 0% 0% 0% 0% 0% 0% 0% 0% 0%
18 % compliance with Ward Audit - Recording of Waterlow 90% Data collection has commenced in May
93.00% 89.00%
Trajectory 85% 87% 90% 90% 90% 90% 90%
19 DNAR audit - Engagement with Carers greater 80% ( green) Available from April, 2 Monthly
73.00% 90.00% 81.50%
Trajectory 75% 77% 79% 80% 80%
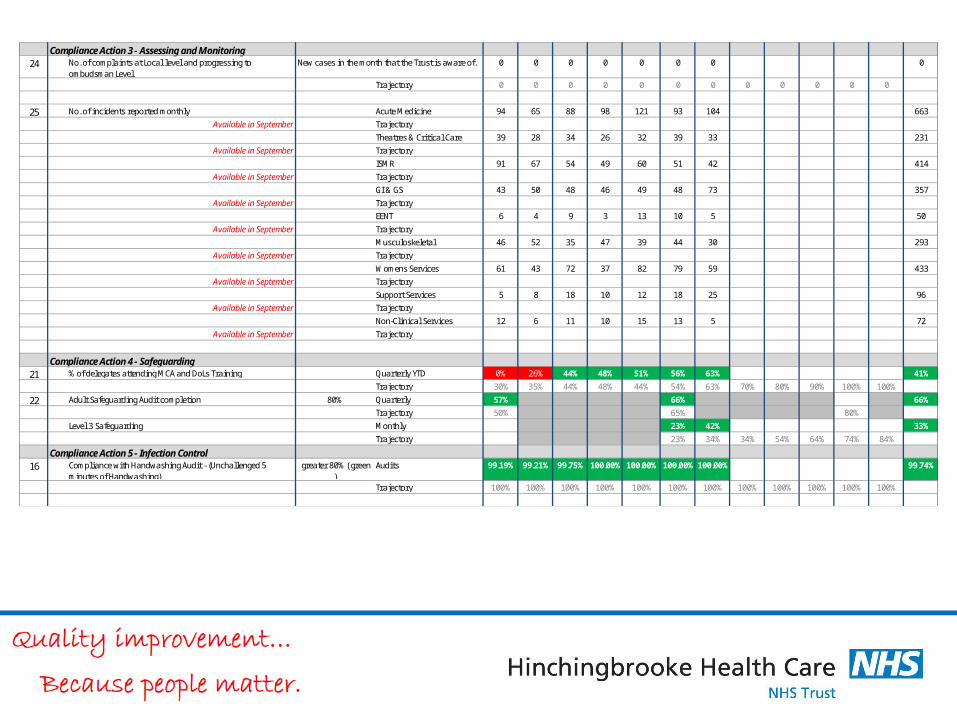
Compliance Action 3 - Assessing and Monitoring24 No. of complaints at Local level and progressing to
ombudsman Level0 0 0 0 0 0 0 0
Trajectory 0 0 0 0 0 0 0 0 0 0 0 0
25 No. of incidents reported monthly Acute Medicine 94 65 88 98 121 93 104 663
Available in September Trajectory
Theatres & Critical Care 39 28 34 26 32 39 33 231
Available in September Trajectory
ISMR 91 67 54 49 60 51 42 414
Available in September Trajectory
GI & GS 43 50 48 46 49 48 73 357
Available in September Trajectory
EENT 6 4 9 3 13 10 5 50
Available in September Trajectory
Musculoskeletal 46 52 35 47 39 44 30 293
Available in September Trajectory
Womens Services 61 43 72 37 82 79 59 433
Available in September Trajectory
Support Services 5 8 18 10 12 18 25 96
Available in September Trajectory
Non-Clinical Services 12 6 11 10 15 13 5 72
Available in September Trajectory
Compliance Action 4 - Safeguarding21 % of delegates attending MCA and DoLs Training Quarterly YTD 0% 26% 44% 48% 51% 56% 63% 41%
Trajectory 30% 35% 44% 48% 44% 54% 63% 70% 80% 90% 100% 100%
22 Adult Safeguarding Audit completion 80% Quarterly 57% 66% 66%
Trajectory 50% 65% 80%
Level 3 Safeguarding Monthly 23% 42% 33%
Trajectory 23% 34% 34% 54% 64% 74% 84%
Compliance Action 5 - Infection Control16 Compliance with Handwashing Audit - (Unchallenged 5
minutes of Handwashing) greater 80% ( green
)Audits 99.19% 99.21% 99.75% 100.00% 100.00% 100.00% 100.00% 99.74%
Trajectory 100% 100% 100% 100% 100% 100% 100% 100% 100% 100% 100% 100%
New cases in the month that the Trust is aware of.

Compliance Action 6 - Respecting and Involving People2 Response to Call Bells ( inside 2 mins ) greater 90% ( green ) Audits 91.98% 97.37% 95.83% 98.81% 96.25% 98.04% 98.15% 96.63%
Trajectory 90% 90% 90% 90% 90% 90% 90% 90% 90% 90% 90% 90%
5 Fluid and Nutrition Assessments for Adults ( screening ) greater 90% ( green ) Qrtly - All Wards 91% 93% 92.00%
Trajectory 60% 90% 100%
20 Audit of Intentional Rounding Document greater 80% ( green ) Data collection has commenced in May
86.00% 80.00% 100.00% 88.67%
Trajectory 80% 80% 80%
23 Friends and Family Test Responses received - Emergency Response Rates 10.00% 13.00% 14.00% 13.00% 17.00% 23.68% 13.95% 14.95%
Trajectory 19% 19% 20% 20% 20% 20% 20% 20% 21%
Friends and Family Test Responses received - Maternity Response Rates 40.00% 11.00% 75.00% 74.00% 55.00% 64.64% 23.77% 49.06%
Trajectory 64% 64% 66% 66% 66% 66% 66% 66% 67.0%
Friends and Family Test Responses received - In patients Response Rates 41.00% 53.00% 43.00% 43.00% 47.00% 52.82% 53.72% 47.65%
Trajectory 59% 59% 61% 61% 61% 61% 61% 61% 63%
Friends and Family satisfaction score - Emergency 94.00% 94.00% 95.32% 93.19% 94.13%
Trajectory 90% 90% 90% 90% 90% 90% 90% 90% 90%
Friends and Family satisfaction score - Maternity 98.00% 97.00% 97.44% 95.14% 96.90%
Trajectory 90% 90% 90% 90% 90% 90% 90% 90% 90%
Friends and Family satisfaction score - In patients 97.00% 96.00% 95.77% 96.24% 96.25%
Trajectory 90% 90% 90% 90% 90% 90% 90% 90% 90%

31 Compliance against Training needs Analysis for statutory, mandatory and essential clinical skil ls training
greater 90% ( green ) IPC Refresher (Clinical Staff) - 1 Year
86.26% 82.57% 83.06% 82.31% 83.55%
Available in September Trajectory
greater 90% ( green ) IPC Refresher (Non Clinical Staff) - 2 Years
98.25% 97.25% 97.45% 98.08% 97.76%
Available in September Trajectory
greater 90% ( green ) M&H High Risk (Non Clinical) Practical + Theory - 2 Year
20.54% 19.23% 19.23% 20.27% 19.82%
Available in September Trajectory
greater 90% ( green ) M&H Low Risk (Clinical) Practical + Theory - 2 Year
38.19% 76.17% 76.39% 75.43% 66.55%
Available in September Trajectorygreater 90% ( green ) M&H Low Risk (Non Clinical)
e-learning - 3 Year92.15% 96.46% 96.68% 97.33% 95.65%
Available in September Trajectory
greater 90% ( green ) Moving & Handling for People Handlers - 1 Year
58.19% 69.59% 70.86% 75.43% 68.52%
Available in September Trajectory
greater 90% ( green ) Fire Safety - 1 Year 83.44% 81.35% 82.61% 82.00% 82.35%
Available in September Trajectory
greater 90% ( green ) Mental Capacity Act - 3 Years 46.66% 49.89% 50.32% 61.57% 52.11%
Available in September Trajectory
greater 90% ( green ) Prevent Basic Awareness - 3 Years
17.55% 17.89% 18.10% 24.00% 19.38%
Available in September Trajectory
greater 90% ( green ) PREVENT - 3 Years 27.88% 26.21% 26.47% 24.51% 26.27%
Available in September Trajectorygreater 90% ( green ) Safeguarding Adults Level 1 -
3 Years92.77% 93.61% 94.18% 94.91% 93.87%
Available in September Trajectory
greater 90% ( green ) Safeguarding Children Level 1 - 3 Years
95.92% 95.89% 96.36% 94.69% 95.72%
Available in September Trajectory
greater 90% ( green ) Safeguarding Children Level 2 - 1 Year
78.19% 54.75% 55.16% 57.70% 61.45%
Available in September Trajectory
greater 90% ( green ) Safeguarding Children Level 3 - 1 Year
43.46% 25.53% 24.62% 48.20% 35.45%
Available in September Trajectory
greater 90% ( green ) Equality, Diversity and Human Rights - 3 Years
89.97% 90.26% 90.60% 87.91% 89.69%
Available in September Trajectorygreater 90% ( green ) Information Governance - 1
Year85.60% 85.40% 85.90% 84.90% 85.45%
Available in September Trajectory

Must Do26 % of wards reporting Drug Cupboard/Trolley secure greater 90% ( green ) Audits 98.93% 98.03% 98.21% 98.15% 95.00% 96.08% 98.15% 97.51%
Trajectory
27 Compliance with Medicine Administration AuditsMedicines Audit - Security/Storage
greater 90% ( green ) Quarterly 74.00% 78.00% 76.00%
Trajectory 85.00% 87% 90% 90%
Medicines Audit - Clinical safety/Admin greater 90% ( green ) Quarterly 88.00% 97.00% 92.50%
Trajectory 85% 87% 90% 90%
28 Drug fridge temps and range incorrect daily – monthly aggregate
greater 80% ( green ) Initial Data from 4 wards, then from all wards
96.00% 83.00% 91.00% 90.00%
Trajectory 80% 80% 80% 80% 80% 80% 80% 80%
29 Medication omissions Drugs not given 18 9 11 4 14 11 19 86
Available September Trajectory
30 % of completed appraisals greater 80% ( green ) 56.00% 76.00% 91.00% 84.34% 80.00% 75.60% 78.21% 77.31%
Available September Trajectory
% of Doctors Revalidation Not Currently Available 100.00% 100.00%
100% 100% 100% 100% 100% 100%
Should Do33 Compliance with daily Resuscitation Equipment Checks
(Audit)greater 95% ( green ) Specific wards each month.
All wards each Quarter.95.00% 83.00% 89.00% 90.00% 89.25%
Trajectory 85% 85% 85% 85% 90% 90% 95% 95% 95%
34 No. of avoidable transfers in the Trust after 10pm. Number of Moves 89 82 70 80 34 55 65 475
Trajectory 73 73 73 55 55 55 37 37 37
Document Author: Informatics, Template Version 1.0, Creation Date: 12th August 2015 13:00

Ward Dashboard
AAU Apple Tree ATSU Birch CCU Cherry Tree ED Juniper OutPatients PRUNET Reablement Short Stay Walnut
Percentage of compl iance with hand hygiene standards Red < 90% 100.00% 100.00% 90.00% 100.00% 100.00% 100.00% 100.00% 100.00% 100.00% 100.00% 100.00% 100.00% 100.00%
Compl iance with outcome 8 s tandards Red < 85% 86.00% 98.00% 97.00% 95.00% 97.00% N/A 92.00% 98.00% 89.00% 93.00%
Compl iance with saving l ives urinary catheter care bundle
Red < 90% 100.00% 100.00% 98.00% 100.00% 100.00% 100.00%N/A N/A
100.00% 100.00% 100.00% 100.00%
VTE Assessment score Red < 100%
100.00% 100.00% 100.00% 100.00% 97.60%N/A N/A
100.00% 100.00% 93.08%
Prophylaxis score Red < 100%
98.00% 100.00% 100.00% 100.00%N/A N/A
100.00% 100.00%N/A
Staff appraisa ls (by a l l groups) Red < 75% 94.00% 70.00% 64.00% 95.00% 64.00% 95.00% 90.00% 100.00% 80.00% 84.00% 96.00% 83.00%
Sickness (by a l l groups) Red > 4% 8.17% 4.76% 3.27% 2.46% N/A 9.68% 2.00% 5.10% 1.00%
Staff mandatory tra ining (by profess ional group) Red < 75% 100.00% 80.00% 90.00% 55.00% 89.00% 98.00% 100.00% 82.55% 100.00% 90.00% 86.00% 93.62% 100.00%
Percentage of relevant s taff tra ined in safeguarding chi ldren processes (by profess ional group and level of tra ining)
Red < 75% 80.00% 90.00% 100.00% 98.00% 100.00%N/A
94.12% 100.00% 90.00% 98.73% 100.00%
Percentage of relevant s taff tra ined in safeguarding adults processes , including Mental Capaci ty Act
Red < 75% 100.00% 90.00% 95.00% 100.00% 100.00%N/A
94.12% 100.00% 90.00% 98.73% 90.00%
Audit score documentation standards Red <60% 100.00% 100.00% 90.00% 100.00% 100.00% 80.00% N/A 100.00% N/A 100.00% 95.00% 100.00%
Number of medication incidents Red > 3 0 1 7 1 1 3 0 13 0 1 2 9 2
Centra l Venous Catheter - Insertion Red < 95% N/A N/A N/A N/A 100.00% N/A N/A N/A N/A N/A N/A N/A N/ACentra l Venous Catheter - Ongoing Red < 95% N/A N/A N/A N/A 100.00% N/A N/A N/A N/A N/A N/A N/A N/APeriphera l Lines Red < 95% 100.00% 95.00% 98.00% 100.00% 100.00% 100.00% 100.00% 100.00% 100.00% 100.00%
Periphera l Lines Ongoing Red < 95% 100.00% 100.00% 98.00% 100.00% 100.00% 100.00% 100.00% 100.00% 100.00% 100.00%
Surgica l Si te Infections - Pre-op Red < 95% N/A N/A N/A N/A N/A N/A N/A N/A N/A N/A N/A N/ASurgica l Si te Infections - Peri -op Red < 95% N/A N/A N/A N/A N/A N/A N/A N/A N/A N/A N/A N/AVentilated Pats - Ongoing Red < 95% N/A N/A N/A N/A 100.00% N/A N/A N/A N/A N/A N/A N/AVentilated Pats - Observe Red < 95% N/A N/A N/A N/A 100.00% N/A N/A N/A N/A N/A N/A N/AUrinary Cathater Insertion Red < 95% 100.00% 95.00% 100.00% 100.00% 100.00% 100.00% 100.00% 100.00% 100.00%
Urinary Cathater Ongoing Red < 95% 100.00% 95.00% 100.00% 100.00% 100.00% 100.00% 100.00% 100.00% 100.00%

Jan-15 Feb-15 Mar-15 Apr-15 May-15 Jun-15 Jul-15ID Metric Target Notes
7 No. of Clinical CAMH Breaches - ED 0 0 0 1 2 3 0 1
Staffing
Issue ED patient delays in treatment longer than 4 hours, therefore not complying with ED 4 hour performance when associated with CAMH Breaches Action The CAMH Paediatric and Adolescent Emergency Response service is currently provided to the Trust by CPFT and the Trust is contributing to the design and development of the CCG wide clinical pathway. ED staff complete a dynamic risk assessment for patients and this is an integral element of the pathway and on ward referral when appropriate. The department ensures the patient is safe while in their care and maintains regular contact with CAMH until allocation, consultation, intervention, discharge or transfer to specialist inpatient facility.

Staffing
Actions taken• In the period April to June 19 exit surveys have been completed ; 1-2 years was the most common length of service (31.58%)
with 6-12 months being the second most common (26.32%) We are starting a campaign to ensure more exit interviews are completed.
• Main 5 reasons for leaving were - better career opportunities, higher pay, career change, take up training/education and improved work life balance. Staff friendliness and colleague appreciation both scored 100% and 73.68% would recommend Hinchingbrooke as an employer.
• Internal Recruitment and Retention Surveys are being set up. • Successful recruitment campaign for Band 5 ward based nurses in Italy has resulted in 16 offers of employment, 12 of which
will be joining the Trust during July / August and the remainder in October.• A recruitment team will be travelling to the Philippines at the end of August, looking to recruit 45 nurses in three cohorts
from April 2016.• HCAs fully established - not currently in post - 31 going through recruitment process starting between July and August.• Establishment of Workforce Effectiveness Project to address attraction, retention with a view to reducing temporary staff
spend.• “Grow our own” – collaborative with Health Education England
Jan-15 Feb-15 Mar-15 Apr-15 May-15 Jun-15 Jul-15ID Metric Target Notes
13 Staff Turnover by Professional Group Less 10% ( green ) Medical & dental 11.04% 10.91% 10.53% 10.23% 11.11% 11.17% 11.05%
Trajectory
Less 10% ( green ) Nursing & midwifery 9.62% 10.82% 12.09% 13.05% 12.68% 11.78% 12.87%
Trajectory
Less 10% ( green ) Other clinical incl HCAs 17.86% 18.11% 17.48% 12.88% 13.32% 13.76% 14.30%Trajectory
Less 10% ( green ) Non-clinical 15.90% 15.55% 17.74% 18.39% 20.73% 19.91% 20.87%
Trajectory
StaffingJan-15 Feb-15 Mar-15 Apr-15 May-15 Jun-15 Jul-15
ID Metric Target Notes32 No. of staff attending QELCA Training
(Quality End of Life Care for all) greater 2 ( green ) Target 2 per month, YTD 25 5 0 4 0
Trajectory 5 5 5 5
25 places booked for the year and all 25 spaces allocated to staff. As detailed below. (1 place in June was not filled as the RN didn’t receive the joining instructions)
Date of Training
No of Delegates
20 Apr -24 Apr 2015
5
1 June - 5 June 2015
5
28 Sept to 2 Oct
5
16 Nov – 20 Nov
5
8 Feb – 12 Feb 5
Total 25
Original trajectory in place for 5 attendees per month though it was advised early into the training programme that St Johns Hospice do not have the staff capacity to run training every month and therefore the Trust has scheduled staff onto the available dates provided by the hospice.
The trajectory on the report should be amended to reflect this information.

Care and Welfare of PeopleJan-15 Feb-15 Mar-15 Apr-15 May-15 Jun-15 Jul-15
ID Metric Target Notes9 No. of pressure Ulcers on all wards 0 Avoidable (1/2) 1 1 2 2 1 0 0
Trajectory
0 Avoidable (3/4) 0 0 0 0 0 0 1
Since the Trust now has 2 x TVN’s in post (1 WTE, 1PTE since July 2014) who have been working on pressure ulcer reduction it has shown to have dramatically reduced the number of pressure ulcers and keep them consistently low to date. We plan to continue this work with the aim to eliminate all hospital acquired avoidable grade 2, 3 and 4 pressure ulcers within the Trust.
The chart shows the number of hospital acquired avoidable grade 2, 3 and 4 pressure ulcers since 2009/2010.
Each financial year is represented by a different colour.
The straight red line through the centre represents the mean number of pressure ulcers which the Trust aims to stay below to ensure we are reducing harm to our patients.

Care and Welfare of People
Fluid Chart Compliance
The Trust is undertaking a phased implementation of an electronic system for capturing patient observations via electronic handover tool. Additionally the Trust is implementing an electronic dashboard to capture clinical KPI’s from ward to board level.
The fluid balance documentation assessment was rolled out on two wards in June, four wards in July, and the remaining wards in August.
The implementation of these solutions, will improve metric collation and ultimately patient observation tracking on the wards. It is anticipated that live alerts will be functional as soon as mobile phones are purchased.
Jan-15 Feb-15 Mar-15 Apr-15 May-15 Jun-15 Jul-15ID Metric Target Notes
10 Fluid chart compliance 100% Data collection has commenced in May. Initial 2 wards
87.00% 85.00%
Trajectory 85% 87%

Care and Welfare of People
Issue: The Trust reported one case in July this is on line with the annual trajectory of no more than 4 at this point in the financial year.
Action taken A route cause analysis was performed. The learning has been shared with the Division Heads of Nursing and Matrons, Link Practitioners, Clinical Governance and Workforce Committee and will be discussed at the Trust IPC Committee on 19 August.
Jan-15 Feb-15 Mar-15 Apr-15 May-15 Jun-15 Jul-15ID Metric Target Notes
15 No. of HCAI Cdif YTD 11 No of Cases 2 0 0 0 0 1 1
Trajectory
Month Trajectory Cumulative Current position April 2015 2 2 0 May 2015 0 2 0 June 2015 1 3 1 July 2015 1 4 1 August 2015 0 4 September 2015 1 5 October 2015 1 6 November 2015 1 7 December 2015 1 8 January 2016 1 9 February 2016 1 10 March 2016 1 11

Respecting and Involving PeopleJan-15 Feb-15 Mar-15 Apr-15 May-15 Jun-15 Jul-15
ID Metric Target Notes31 Compliance against Training needs Analysis for statutory,
mandatory and essential clinical skil ls traininggreater 90% ( green ) IPC Refresher
(Clinical Staff) - 1 Year86.26% 82.57% 83.06% 82.31%
Available in September Trajectory
greater 90% ( green ) IPC Refresher (Non Clinical Staff) - 2 Years
98.25% 97.25% 97.45% 98.08%
Available in September Trajectory
greater 90% ( green ) M&H High Risk (Non Clinical) Practical + Theory - 2 Year
20.54% 19.23% 19.23% 20.27%
Available in September Trajectory
greater 90% ( green ) M&H Low Risk (Clinical) Practical + Theory - 2 Year
38.19% 76.17% 76.39% 75.43%
Available in September Trajectory
greater 90% ( green ) M&H Low Risk (Non Clinical) e-learning - 3 Year
92.15% 96.46% 96.68% 97.33%
Available in September Trajectory
greater 90% ( green ) Moving & Handling for People Handlers - 1 Year
58.19% 69.59% 70.86% 75.43%
Available in September Trajectory
greater 90% ( green ) Fire Safety - 1 Year 83.44% 81.35% 82.61% 82.00%
Available in September Trajectory
greater 90% ( green ) Mental Capacity Act - 3 Years 46.66% 49.89% 50.32% 61.57%
Available in September Trajectory
greater 90% ( green ) Prevent Basic Awareness - 3 Years
17.55% 17.89% 18.10% 24.00%
Available in September Trajectory
greater 90% ( green ) PREVENT - 3 Years 27.88% 26.21% 26.47% 24.51%
Available in September Trajectory
greater 90% ( green ) Safeguarding Adults Level 1 - 3 Years
92.77% 93.61% 94.18% 94.91%
Available in September Trajectory
greater 90% ( green ) Safeguarding Children Level 1 - 3 Years
95.92% 95.89% 96.36% 94.69%
Available in September Trajectory
greater 90% ( green ) Safeguarding Children Level 2 - 1 Year
78.19% 54.75% 55.16% 57.70%
Available in September Trajectory
greater 90% ( green ) Safeguarding Children Level 3 - 1 Year
43.46% 25.53% 24.62% 48.20%
Available in September Trajectory
greater 90% ( green ) Equality, Diversity and Human Rights - 3 Years
89.97% 90.26% 90.60% 87.91%
Available in September Trajectory
greater 90% ( green ) Information Governance - 1 Year
85.60% 85.40% 85.90% 84.90%
Available in September Trajectory

Respecting and Involving People July 2015 11 % of delegates attending UTI Indwelling Catheter Training
% of delegates attending Improving Water Low Training
% of delegates attending VIP training
8.42%. Catheterisation training commenced in March ’15. 67 delegates have so far been trained. Catheterisation training is now part of the new Trust Induction Programme, plus Statutory, Mandatory & Essentials Training Day (clinical staff attend this annually)
42.69%. Water Low training is covered within SKINN Training. This subject is scheduled onto Trust Induction, plus Statutory, Mandatory & Essentials Training Day (clinical staff attend this annually)
IV Cannulation training contains VIP training information
Currently 170 delegates have been trained. VIP training is also now part of the new Trust Induction Programme, plus Statutory, Mandatory & Essentials Training Day (clinical staff attend this annually)
14 No of delegates attending SKINN Initiative Training 67 delegates trained in July 2015. This training is part of the Statutory, Mandatory & Essentials Training Day that clinical staff attend annually. It is also scheduled onto the Trust Induction Programme. This training also covers Improving Water Low training. Requirement mapping on ESR is now complete. The Trust currently has 42.69% compliance with this competency.
31 Compliance against Trust Needs Analysis for statutory, mandatory and essential clinical skills training
82% - Fire Safety 86% - Infection Control 79% - Moving & Handling – NB: % now includes practical & theory requirements 85% - Information Governance 96% - Safeguarding Children Level 1 94% - Safeguarding Vulnerable Adults 90% - Equality & Diversity 63% - MCA & DOLS 21% - Prevent Basic Awareness 24% - Prevent WRAP
5 PLACES LEFT: Venepuncture & Cannulation Training, 17/08/2015 There are 5 places still available on the V&C training taking place on Monday 17th August 2015, 13.00 – 16.30. If possible, please could you book either yourselves or your staff onto this training due to the increased demand for Venepuncture & Cannulation.

Respecting and Involving PeopleTNA Ref Number of Assignments
requiring Comptency Number of Assignments
that meet competency% Assignments that Fulfil
Competence Requirements for Position
Competence Requirement Gap
Notes:
NHS|MAND|Fire Safety - 1 Year| 1A & 1B 1,729 1,407 81.38% 322
291|LOCAL|M&H Low Risk (Non Clinical) e-learning - 3 Year| 2A & 2B 449 437 97.33% 12
291|LOCAL|M&H High Risk (Non Clinical) Practical + Theory - 2 Year| 2C 74 15 20.27% 59
NHS|MAND|Moving & Handling for People Handlers - 1 Year| 2D & 2E 940 709 75.43% 231
291|LOCAL|M&H Low Risk (Clinical) Practical + Theory - 2 Year| 2F 235 165 70.21% 70
291|LOCAL|IPC Refresher (Non Clinical Staff) - 2 Years| 2G & 2H 469 460 98.08% 9
291|LOCAL|IPC Refresher (Clinical Staff) - 1 Year| 2G & 2I 1,227 1,010 82.31% 217
291|LOCAL|Adult Basic Life Support Resuscitation - Once| 2J 493 35 7.10% 458 Remapping underwayNHS|MAND|Adult Basic Life Support - 1 Year| 2J 163 81 49.69% 82 Remapping underway291|LOCAL|Acutely Deteriorating Patient - 1 Year| 2K 1,017 552 54.28% 465 Remapping underwayNHS|MAND|Safeguarding Adults Level 1 - 3 Years| 3A & 3B 1,729 1,641 94.91% 88 Remapping completeNHS|MAND|Deprivation of Liberty Safeguards - 3 Years| 3C & 3D 876 537 61.30% 339 Remapping completeNHS|MAND|Mental Capacity Act - 3 Years| 3C & 3D 876 541 61.76% 335 Remapping completeNHS|MAND|PREVENT - 3 Years| 3E 102 25 24.51% 77
291|LOCAL|Prevent Basic Awareness - 3 Years| 3F 1,729 415 24.00% 1,314
NHS|MAND|Safeguarding Children Level 1 - 3 Years| 4A & 4B 1,729 1,637 94.68% 92
NHS|MAND|Safeguarding Children Level 2 - 1 Year| 4C & 4D 1,243 717 57.68% 526
NHS|MAND|Safeguarding Children Level 3 - 1 Year| 4E & 4F 197 95 48.22% 102 Subject Leads has requested remapping
NHS|MAND|Equality, Diversity and Human Rights - 3 Years| 5A & 5B 1,729 1,520 87.91% 209
NHS|MAND|Information Governance - 1 Year| 6A & 6B 1,729 1,468 84.90% 261
291|LOCAL|NHS and our patients values + 6Cs - One Off| 7A 1,729 337 19.49% 1,392
291|LOCAL|Documentation and Care Plans - One Off| 7B 844 496 58.77% 348
291|LOCAL|Falls Awareness - One Off| 7B 816 270 33.09% 546
291|LOCAL|SKINN - 1 Year| 7C 851 358 42.07% 493
291|LOCAL|End of Life - 3 Years| 7D 595 154 25.88% 441
291|LOCAL|QELCA - One Off| 7D 45 0 0.00% 45 Remapping required with new Consultant in Palliative Care
NHS|MAND|Dementia Awareness - 3 Years| 7E 1,016 416 40.94% 600
291|LOCAL|UTI & Indwelling Catheters - One Off| 7F 805 81 10.06% 724
291|LOCAL|Nutrition and Hydration - One Off| 7G 748 416 55.61% 332
291|LOCAL|Venous Thrombosis Embolism - One Off| 7H 749 302 40.32% 447
291|LOCAL|Visual Infusion Phlebitis - One Off| 7I 816 139 17.03% 677
NHS|MAND|Blood Transfusion - 1 Year| 7J 917 370 40.35% 547
291|LOCAL|Blood Collection - 3 Years| 7K 721 332 46.05% 389
291|LOCAL|Blood Admin - 3 Years| 7L 590 317 53.73% 273
291|LOCAL|Blood Sample - 3 Years| 7M 484 203 41.94% 281

Respecting and Involving PeopleJan-15 Feb-15 Mar-15 Apr-15 May-15 Jun-15 Jul-15
ID Metric Target Notes23 Friends and Family Test Responses received - Emergency Response Rates 10.00% 13.00% 14.00% 13.00% 17.00% 23.68% 13.95%
Trajectory 19% 19% 20% 20%
Friends and Family Test Responses received - Maternity Response Rates 40.00% 11.00% 75.00% 74.00% 55.00% 64.64% 23.77%
Trajectory 64% 64% 66% 66%
Friends and Family Test Responses received - In patients Response Rates 41.00% 53.00% 43.00% 43.00% 47.00% 52.82% 53.72%
Trajectory 59% 59% 61% 61%
Friends and Family satisfaction score - Emergency 94.00% 94.00% 95.32% 93.19%
Trajectory
Friends and Family satisfaction score - Maternity 98.00% 97.00% 97.44% 95.14%
Trajectory
Friends and Family satisfaction score - In patients 97.00% 96.00% 95.77% 96.24%
Trajectory
Emergency – the response rate is a combined score from AAU and ED. AAU have achieved 52% response rate whilst ED have achieved 9.12%. Relocation of volunteer resource impacted on issuing and retrieval of FF cards. This resource has now been reinstated and new targets have been set and will be monitored by ECC Service Manager.
Maternity – the Maternity ward has been extremely busy with capacity issues for both Midwifes and administration support. This has impacted on the distribution and collation of forms. Additional administration support has been sourced which will see an increase in the response rates next month.
Inpatients – the response rate is a combined score from the inpatient wards on the trust. High response rates in most wards especially Reab and CHT, lower response rate on Daisy ward that is being investigated and actions to be put in place to address.

Must DoJan-15 Feb-15 Mar-15 Apr-15 May-15 Jun-15 Jul-15
ID Metric Target Notes30 % of completed appraisals greater 80% ( green ) 56.00% 76.00% 91.00% 84.34% 80.00% 75.60% 78.21%
We have commenced a data cleanse of ESR to ensure staff are allocated appropriately, and for local data to be added to ESR so that the central record is accurate. Completing this activity will have a positive impact on our completion rate

Must Do
SOP introduced 30/4/15w/c All moves Avoidable moves Q2 Cquin target 06/04/2015 43 25 2013/04/2015 33 24 2020/04/2015 17 7 2027/04/2015 21 11 2004/05/2015 31 16 2011/05/2015 12 1 2018/05/2015 7 2 2025/05/2015 14 9 2001/06/2015 26 12 2008/06/2015 22 9 2015/06/2015 37 15 2022/06/2015 23 11 2029/06/2015 35 15 1506/07/2015 42 25 1513/07/2015 40 11 1520/07/2015 38 9 1527/07/2015 38 16 15
1. The Moving Patients at night SOP was launched formally on 30 April 2015.2. Escalation is via the Site Manager to GM and a Director on Call3. Variation in avoidance of moves is directly related to Trust activity and available capacity.
• Two periods of underperformance in July• Week of 6th July – directly related to one day whereby the trust had 166 attendances and 48 admissions resulting in later moves affiliate with
secondary ward rounds and generation of later discharges• Week of 27th July – higher occupancy in the trust as overall percentage , backlog of DTOCs and lower discharges resulted in capacity pressures and
later bed moves4. Actions taken – trial of trolleys in AAU, successfully seen this week AAU siting at 2-3 inpatients by 6pm in the evening which enables all ED admissions
straight to AAU and minimises further hospital moves5. The Trust continues to implement improvements associated with ECIST recommendations and management of medically fit in order to create bed capacity
earlier in the day6. Performance improvement remains in line with the agreed trajectory as part of our CQIN scheme
Jan-15 Feb-15 Mar-15 Apr-15 May-15 Jun-15 Jul-15ID Metric Target Notes
34 No. of avoidable transfers in the Trust after 10pm. Number of Moves 89 82 70 80 34 55 65

Variation Report - as at 10 August 2015
Compliance Action Ref
Area Action Milestone Accountable ResponsibleDate to be delivered
Revised Estimated
delivery dateReason for Delay Effect on Action
1.2
Inflexible staffi ng
arrangements were in place in
the medical directorate to
meet the needs of patients
To ensure interim arrangements in place
which will continue until appointment of new
medical director
Interim Director in post with appointment until substantive
post recruitedChief Executive HR Director Apr-16
Recruitment campaign concluded with no successul appointment to post. Current MD to
remain in post. Expected to readvertise Sept/Oct ( appointment to post date forecast to
be April 2016)
No effect on action
Three Phased approach: Complete Revised document
1) Risk Assessment31/05/2015 21/08/2015
Risk Assessment document revised and currently at printers. Revised date for
implementation middle of August
Complete revised documentation
3) Nursing Care Plans18/08/2015
Review of Care Plans complete, send out for review by DHON's with a deadline of 12 Aug 2015. The next step after this date will be
printing and distribution to wards
To review the ward handover process and develop, implement and
embed a revised process that provides information on all patients to all staff
across the ward
Assurance that the practice is embedded
07/07/2015 30/09/2015
Process reviewed, revised handover process in place, rolled out across all wards. Spot
checks for assurance have been undertaken in June with audit to be completed by
September which will provide the assurance that the proess is embedded
6.3
Ensure patients are treated with
dignity and respect
To develop a compassion in Practice Strategy
Develop StrategyDirector of Nursing,
Midwifwery and Quality
Led by DHON - MSK for Trust
Wide Implementation
30/07/2015 31/08/2015The revised Nursing Midwifery Strategy will be developed in line with the 6c's and is currently
in the process of validation prior to launch.
2.1
The Trust is failing to plan
and deliver care that meets the
needs of service users
who are at risk due to pressure area, catheter
care, intravenous
care, and the risk associated with bed rails.
Deputy DIPC, DHON's and Ward
Matrons
Director of Nursing, Midwifwery and
Quality
Task and finish group to review current
documentation and develop revised format

The recent PLACE survey shows that the Trust exceeded the national average in all areas

Cherry Ward (update)
Offer of permanent ward matron made.
Mental Health Trainer - CPFT attended Cherry 12 August to provide feedback following the dementia care mapping they facilitated. The results were extremely positive and demonstrated that Cherry made significant improvements in the care and interaction with dementia patients. The results have demonstrated true engagement from the staff in improving the value during inpatient stays.Follow upfour follow up training days provided by CPFTFacilitation of one day training to staff on Dementia care Facilitation of several ‘on the job sessions’ on Cherry Tree ward. Request for the Mental Health training – CPFT to attend the ISMR partnership session in early October.