overvewi 3 2. oil 5 - international energy agency · pdf filespain 3 overview spain has very...
TRANSCRIPT

SPAIN OVERVIEW _______________________________________________________________________ 3
1. Energy Outlook _________________________________________________________________ 4
2. Oil ___________________________________________________________________________ 5 2.1 Market Features and Key Issues ___________________________________________________________ 5 2.2 Oil Supply Infrastructure _________________________________________________________________ 7 2.3 Decision-making Structure for Oil Emergencies ______________________________________________ 10 2.4 Stocks _______________________________________________________________________________ 11
3. Other Measures _______________________________________________________________ 13 3.1 Demand Restraint ______________________________________________________________________ 13 3.2 Fuel switching _________________________________________________________________________ 13 3.3 Relocating reserves ____________________________________________________________________ 13
4. Natural Gas ___________________________________________________________________ 14 4.1 Market Features and Key Issues __________________________________________________________ 14 4.2 Natural Gas Supply Infrastructure _________________________________________________________ 15 4.3 Emergency Policy for Natural Gas _________________________________________________________ 18
List of Figures
Total Primary Energy Supply ....................................................................................................................................4 Electricity Generation by Fuel ..................................................................................................................................4 Imports by Source, 4Q2010 .....................................................................................................................................5 Oil Demand in 2010 (kb/d)...................................................................................................................................................................... 5 Oil Consumption by Product ....................................................................................................................................6 Spanish Refinery Output and Oil Demand in 2010 (kb/d)........................................................................................7 Oil Infrastructure Map .............................................................................................................................................8 Stock levels, at end-Janaury 2011 ..........................................................................................................................11 Oil Consumption by Sector ....................................................................................................................................13 Natural Gas Imports by Source ..............................................................................................................................14 Natural Gas Consumption by Sector ......................................................................................................................15 Gas Infrastructure Map ..........................................................................................................................................16 Natural Gas storage facilities .................................................................................................................................17 Underground Storage Projects (end-2010) ............................................................................................................18

Key Oil Data1985 1990 1995 2000 2005 2008 2009 2010
Production (kb/d) 50.0 27.3 17.3 4.7 3.3 2.6 2.1 2.5Demand (kb/d) 857.6 1 009.9 1 186.7 1 433.2 1 607.3 1 547.0 1 466.4 1 440.4
Motor gasoline 136.4 188.6 197.6 196.8 172.2 145.2 139.2 131.3Gas/diesel oil 238.8 316.1 380.8 529.2 705.0 719.6 681.0 677.6Residual fuel oil 187.1 190.6 232.1 246.6 247.4 213.7 203.6 189.3Others 295.3 314.7 376.2 460.7 482.7 468.6 442.6 442.2
Net imports (kb/d) 807.6 982.6 1 169.4 1 428.5 1 604.0 1 544.4 1 464.3 1 437.9Import dependency 94.2% 97.3% 98.5% 99.7% 99.8% 99.8% 99.9% 99.8%Refining capacity (kb/d) 1 493 1 293 1 283 1 316 1 272 1 277 1 272 1 498Oil in TPES 54.8% 50.5% 53.3% 51.1% 48.0% 46.6% 47.2% -
End-Month Total Oil Stock Levels1 - Five Year Range
Range 2006 - 2010 2010 2011
Key Natural Gas Data1985 1990 1995 2000 2005 2008 2009 2010 *
Spain
0
20000
40000
60000
80000
100000
120000
140000
160000
JAN FEB MAR APR MAY JUN JUL AUG SEP OCT NOV DEC
thou
sand
bar
rels
1985 1990 1995 2000 2005 2008 2009 2010 *Production (mcm/y) 249 1 394 415 162 158 17 - 48Demand (mcm/y) 2 323 5 443 8 455 16 663 31 883 38 244 - 35 821
Transformation 770 573 858 2 940 11 821 19 652 - -Industry 1 294 4 129 6 095 10 538 15 073 10 690 - -Residential 132 425 1 044 2 159 3 461 3 959 - -Others 127 316 458 1 026 1 528 3 943 - -
Net imports (mcm/y) 2 074 4 049 8 040 16 501 31 725 38 227 - 35 773Import dependency 89.3% 74.4% 95.1% 99.0% 99.5% 100.0% 0.0% 99.9%Natural Gas in TPES 3.0% 5.5% 7.7% 12.5% 21.0% 25.0% 24.2% -* based on monthly data submissions to the IEA.
End-Month Natural Gas Stock Levels2 - Five Year Range
Range/ave. 2006 - 2010 2010 2011
1 -Primary oil stocks on national territory; these exclude utility stocks and including pipeline and entrepot stocks where known.2 -Stocks held on national territory, as reported to the IEA in monthly data submissions.
2
0
500
1000
1500
2000
2500
3000
JAN FEB MAR APR MAY JUN JUL AUG SEP OCT NOV DEC
mill
ion
cubi
c m
etre
s
0
20000
40000
60000
80000
100000
120000
140000
160000
JAN FEB MAR APR MAY JUN JUL AUG SEP OCT NOV DEC
thou
sand
bar
rels

SPAIN
3
OVERVIEW Spain has very little domestic oil and gas production and relies heavily on imports, the sources of which are well distributed amongst Africa, the Middle East, countries of the former Soviet Union and OECD countries. Oil consumption as a whole has dropped incrementally from its peak in 2007 (1.61 mb/d), and stood at 1.47 mb/d in 2010. Nevertheless, demand for middle distillates remained strong. The share of oil in total energy consumption as a whole is gradually declining. Natural gas demand stood at 38.2 bcm in 2008, up 10% on the previous year and in line with the steady upward trend of recent years, but demand is estimated to have dropped some 10% in 2009, due to weather conditions, the increase in renewable electricity supplies and the drop in economic activity. Spain imposes a stockholding obligation on both its oil and gas operators, and as such has emergency reserves of both oil and natural gas. Until 1995, Spain’s emergency oil reserves were held only by industry, after which an agency was created for holding public stocks – the Corporación de Reservas Estratégicas de Productos Petrolíferos (CORES). As of 2010, CORES is responsible for holding 50% of Spain’s emergency reserves. In an IEA co-ordinated action, Spain would likely respond by lowering the stock obligation on industry, thereby allowing the use of industry’s obligatory stocks. As a secondary measure, Spain could also release its public stocks.

SPAIN
4
1. Energy Outlook
Total primary energy supply (TPES) in Spain stood at 128.9 Mtoe in 2009, having declined some 11% (notably because of the financial crisis) from a maximum of 144.3 Mtoe in 2007. Spain’s TPES has grown consistently since 1973, increasing by a compound average annual growth rate of 2.6%. After growing significantly up until 2005, oil demand has since reached a plateau at just over 65 Mtoe, and accounts for 47% of TPES. Natural gas has seen the strongest and most consistent growth, growing from less than 1 Mtoe in 1973 to some 32 Mtoe in 2008. Natural gas now accounts for a quarter of the country’s TPES. The share of renewable energies has also grown considerably over the last decade, reaching over 12 Mtoe in 2009, partly due to a government policies to promote wind and photovoltaics. With a view to promoting its indigenous resources, the Spanish government has recently passed a Decree, effective 1st January 2011, which obliges electricity producers to consume a minimum of 6 million tonnes of Spanish coal per year. This is likely to result in an increase in coal’s share in the TPES, which had progressively declined in recent years.
Total Primary Energy Supply
1973: 51.8 MT 2009: 128.9 MT
Coal 9%
Oil 47%
Natural Gas 24%
Nuclear 11%
Hydro / Renewable
s / other9%Coal
17%
Oil 73%
Natural Gas 2%
Nuclear 3%
Hydro / Renewables / other
5%
The power generation market is highly dependent on natural gas, as the latter accounts for 52% of total electricity fuel inputs.
Electricity Generation by Fuel
0
50
100
150
200
250
300
350
TWh
Other
Hydro
Nuclear
Natural Gas
Oil
Coal
Electricity Useˆ
Source: Energy Balances of OECD Countries, IEA

SPAIN
5
2. Oil 2.1 Market Features and Key Issues
Oil supply Spain has very limited oil production, which stood at 3 kb/d in 2007 and 2008, and 2 kb/d in 2009. Spain is thus highly reliant on imports of both crude and products, which it imports from a variety of different sources. All oil imports arrive by sea. An estimated 50% of Spain’s supplies are sourced on the spot market, thereby providing Spain with a high degree of flexibility.
Imports by Source, 4Q2010
1 101.0 kb/d 457.0 kb/d
Total OECD 12%
Total OPEC 61%
Former USSR 16%
Other11%
Crude OilNorth
America 9% Pacific
0%
Europe 45%
Total OPEC 23%
Former USSR 10%
Other13%
Total Products
Source: IEA Monthly Oil Statistics
Of note, Spain had a biofuels blending target of 2.5% for both gasoline and diesel. Both targets were met in 2009, and the target for biodiesel was actually exceeded, reaching 3.4%. The target for 2010 is set at 5.83%, slightly above the stated EU target of 5.75%.
Oil demand In 2010, oil demand stood at 1.44 mb/d, down from 1.47 mb/d in 2009 and 1.55 mb/d in 2008. Whereas total product demand has increased by just 2.3% overall over the last decade, middle distillate demand has grown considerably. Diesel demand has shown the strongest growth, increasing by 42% since 2000, and standing at 485 kb/d in 2010. Oil is used primarily in the transport sector, which accounted for 58% of oil consumption in 2010. By contrast, the industrial sector’s share was 20%.
Oil Demand in 2010 (kb/d)
LPG and Ethane 59 Naphtha 55 Gasoline 131 Kerosene 113 Diesel 485 Heating/other Gasoil 193 Residual Fuels 189 Other Products 215
Total Products 1,441 Source: IEA Monthly Oil Statistics

SPAIN
6
Oil Consumption by Product
-
200
400
600
800
1,000
1,200
1,400
1,600
1,800
thou
sand
bar
rels
per
day Naphtha
Motor Gas
Jet and Kerosene
Diesel
Other Gasoil
Residual Fuels
Other
Source: Monthly Oil Statistics, IEA
Taxes and maximum price mechanism Spain has a specific excise tax for oil products, the Special Hydrocarbon Tax, and until 2009, regions have also been able to levy a regional tax. VAT is also applied, at a rate of 18%. Spain ranks as one of the EU countries with the lowest oil product taxes, and the country continues to offer amongst the lowest gasoline and diesel pump prices in Europe. Spain benefits from high levels of incoming fuel tourism thanks to retail prices that are significantly lower than in neighbouring France and Portugal. The basic excise duty is very low in Spain, with gasoline at € 392/cu.m. since 2002 and diesel moving up to € 302/cu.m (as of Jan 1, 2007), in line with floor rates set by the EU. The government will increase the diesel excise to € 330/cu.m. by January 1, 2012, as mandated by the EU. The EU’s plans to introduce a harmonised minimum rate of excise tax for commercially used diesel was met by significant opposition from the Spanish transport sector, as it would deprive industry of the advantage of Spain’s historically low rates of tax on the fuel. Thus Spain is one of four European countries that have applied for a deferred timetable (till 2012) for the implementation of the minimum tax on commercial diesel, which is set at € 330/cu.m. for all non-exempted EU countries as of January 2010. Imports/exports and import dependency Spain imports virtually all of its crude oil. As is the case in many European countries, Spain is experiencing a growing mismatch between its refinery mix and its motor fuel demand. Indeed, the country is a net importer of middle distillates and particularly gas/diesel oil, while it is a net exporter of gasoline. This exacerbating trend is in part due to a favourable tax regime for diesel in comparison to gasoline, making diesel-fired transport notably cheaper.

SPAIN
7
Spanish Refinery Output and Oil Demand in 2010 (kb/d)
0 200 400 600 800
Other Products
Residual Fuels
Gas/Diesel Oil
Jet and Kerosene
Gasolines
Naphtha
LPG and Ethane Refinery OutputDemand
Oil Company Operations The Spanish oil retail market is fully open to competition. Imports, exports, trade and prices are free. The government intervenes only to protect competition and to avoid abuse of dominant positions. At the end of 2009, there were around 9,400 filling stations. Spain’s retail network is highly concentrated, in spite of the number of operators in the country. Repsol YPF and Cepsa are the two top operators, with more than half of the country’s stations and motor fuel sales.
2.2 Oil Supply Infrastructure Refining Spain has a large and relatively complex refining industry, with nine refineries and a total nameplate capacity of 1.41 mb/d. Average utilisation rates in 2009 stood at 85%. Two Spanish companies, Repsol YPF (52% of total capacity1) and Cepsa (38%) dominate the domestic refining market, with some 90% of the total refining capacity. BP is the only other integrated player in the market, with its 110 kb/d Castellon de la Plana refinery. 8 of the 9 refineries are located on the coast, meaning that they are easily supplied by ship. Only Repsol YPF’s Puertollano refinery (south of Madrid) is located inland, and is supplied via a 358 km-long pipeline linked to the port and refinery of Cartagena. Ongoing refining investments aim to redress the supply shortfall of middle distillate products, notably diesel and jet fuel. BP completed a delayed coker at its Castellon refinery in early 2009. Cepsa is in the process of upgrading the two refineries at Algeciras and particularly Huelva. Repsol YPF is investing over Euro 3 billion in Cartagena, more than doubling capacity and adding a series of major conversion units, and is building a delayed coker at its Bilbao refinery. All these projects are expected to be streamed before end-2012.
1 Including Repsol YPF’s 86% stake in Petronor SA

SPAIN
8
Oil Infrastructure Map
Storage Total storage capacity in Spain is some 28.3 million cubic metres (178.6 mb), spread over 137 sites. There are 34 companies offering storage service in Spain, some of which are subsidiary companies of oil operators (20% of petrol and gasoil storage capacity). Most of the storage sites, including the largest ones, are connected to Spain’s CLH pipeline network (see below). The coastal refineries are the main sites for crude imports and storage, and these refineries also import a substantial share of refined products through the nearby ports. Total on-site storage capacity at the country’s refineries amounts to 8.1 million cubic metres, or around 50 million barrels. The remaining volumes of refined products are imported directly to storage facilities, located mainly in Barcelona and Bilbao. Compañía Logística de Hidrocarburos (CLH), S.A. has one of the largest and most efficient integrated oil product transport and storage networks in the world, which consists of a transport system and storage facilities. As per the Royal Decree-in-Law 6/2000 (23 June) establishing urgent measures to boost competition in the goods and services market, no individual equity holding in CLH can exceed 25%, and the joint economic participation of shareholders with refining capability installed in Spain should not exceed 45% of the corporate capital of the company. At end-2010, and taking into account these restrictions, the share structure of CLH is the following: Cepsa (14.15%), Oman Oil (10%), Disa (10%), AMP Capital Investors (10%), Repsol YPF (10%), BBK (5%), BP (5%), Galp (5%), Caixanova (5%), Deutsche Bank (5%), Her Majesty The Queen in Right of Alberta (5%), Stichting Pensioenfonds Zorg en Welzijn (5%), Public Sector Pension Investment Board (5%), Global Salamina (5%), Others (0.85%).

SPAIN
9
CLH is the main storage capacity holder, and has an extensive network of 38 oil product and biofuel storage facilities distributed over the whole of Spanish mainland territory and the Balearic Islands. CLH has considerably increased its storage capacity in recent years, to reach 7.2 million cubic metres (45 mb), as of end-2009 and adapted 13 facilities for storing and blending biodiesel to automotive gasoil and 9 facilities for storing and blending bioethanol to gasoline. Airport storage capacity stands at around 176 thousand cubic metres (1.1 mb), located in 49 facilities. Pipelines
The CLH oil pipeline network is over 4,000 kilometres long, which makes it the most extensive civil pipeline network in Western Europe, linking the main eight peninsular refineries and the main import ports with 24 storage plants of the company which serve the mainland, and with five storage plants which serve the main airports. The network has a Central Dispatching unit at Torrejón, close to Madrid, which supports, manages and supervises the automatic systems in all the installations, and from which it is possible to operate directly over any of their systems and solve any possible incidents, thereby guaranteeing the tanker truck loading service at the facilities 24 hours a day, 365 days a year. Clients of the CLH network can deliver and withdraw products instantaneously at any of the fitted points in the system, in exchange for a transport fee that it based on the distances separating the two points. CLH has doubled the Zaragoza-Torrejón and the Arahal-Loeches pipelines in order to increase the capacity of supply to the Spanish central market by the north and the south paths. The CLH logistics network is very flexible due to its high level of integration between storage facilities and pipelines. The construction of storage facilities at some crossing points of the pipeline system as Loeches, Arahal and Almodovar (under construction) will improve substantially its flexibility. From an operative point of view, the great majority of primary transport of liquid hydrocarbons is done via the product pipelines of CLH, which account for a share of around 90%; other means of transport, such as tankers, are used only marginally. In addition to the CLH pipeline network, Repsol owns two parallel pipelines transporting crude oil and products between the Cartagena and Puertollano refineries. The first pipeline has been operational since 2000 and the latter, under construction as of end-2010, is designed to increase diversification and security of supply by allowing for reversible products deliveries from the inland Puertollano refinery to Cartagena. The additional pipeline will also be used to improve synergies between the two refineries by moving intermediate (unfinished) products between both sites. The oil pipeline network is an integrated network, owned 100% by CLH (except for Repsol’s pipelines, mentioned above) but Third Party Access (TPA) is guaranteed2. According to Article 41 of Law 34/1998 (7 October) on the Hydrocarbons Act, the owners of rented permanent storage and transportation facilities for petroleum products must allow third party access by means of a negotiated procedure which has non-discriminatory, transparent and objective technical and economic conditions and the prices charged must be made public. As a result of the oil market liberalisation and the common carrier policy in the transportation of oil products, the transportation costs accounts for only 1% of total final price.
2 Note that TPA access is not required for privately-owned storage and pipelines, such as Repsol’s Cartagena-Puertollano
pipeline

SPAIN
10
2.3 Decision-making Structure for Oil Emergencies
Legislation and Emergency Response Policy
The Law 34/1998 and the Royal Decree 1716/2004 provide the Spanish Government with the powers to guarantee that oil stocks are sufficient to meet the IEA emergency reserves obligation and to draw stocks during an emergency, under a wide range of situations. According to those provisions, the Spanish Council of Ministries has the authority to establish demand restriction measures, release CORES strategic stocks and lower the stockholding obligation on industry. If an emergency situation is declared by the Spanish Council of Ministries, the emergency stocks shall be released either by CORES through a tender to all the operators, or directly by the operators following the instructions of the authorities. Of note, Article 39 of the Royal Decree 1716/2004 establishes that the Ministry of Industry, Tourism and Trade can approve CORES proposals for trades and swaps of strategic reserves with downstream operators. Emergency Organisation The Spanish National Emergency Sharing Organisation (NESO) is part of a rather complex structure of emergency organisations in Spain. On the ministerial level, the Government Delegate Commission for Crisis Situations (CDGSC) holds ultimate responsibility for handling crises. This ministerial commission is supported on a tactical level by the National Committee of Civil Emergency Planning (CNPCE). On the operational level, nine sector working committees are placed under the CNPCE, including the National Energy and Mining Resources Committee (CSREM), which forms the basis for NESO. A Decision by the Council of Ministers of January 1988 constitutes the legal basis for the operation of both CSREM and CNPCE. The main functions of these committees are supply/demand analysis, demand restraint plans and preparation of rationing schemes. The CNPCE is the body that must propose to the CDGSC the measures to be adopted in response to a supply disruption, following consultation with the affected sector committees. Members of the CSREM include: the General Directorate of Energy and Mines from the Ministry of Industry, Tourism and Trade; the Corporation of Strategic Reserves of Petroleum Products (CORES) and the National Energy Commission (CNE). The CSREM also includes various operators, logistics and storage companies. To ensure the effectiveness of the CSREM, representatives from the Ministry of Industry, Tourism and Trade, the CNE, CORES and from reporting companies that are members of the CSREM, participate in various training seminars and workshops. The Department for Infrastructures and Monitoring of Crisis Situations (DISSC) is a body directly linked to the President’s Cabinet, and would also play a role in a supply shortage. It is in charge of the proper functioning of the National Crisis Situation Management System, including the study and proposal of the legal framework. Preventive actions are developed through scenario planning at the sectorial level. In the case of the energy sector, the National Energy and Mining Resources Committee draws up a range of reports and crisis strategic scenarios associated with electricity, fuel and gas supplies, as well as necessary response measures at the national level.

SPAIN
11
2.4 Stocks Stockholding Regime Law 34/1998 on the Hydrocarbons Sector establishes the government’s power to oblige (by decree) all operators to hold emergency stocks up to a maximum of 120 days of sales or consumption (Art. 50) and several measures that the Government can implement during a supply disruption in order to reduce oil demand (Art. 49). The Royal Decree 1716/2004, which regulates the stockholding obligation of minimum security stocks, the natural gas diversification of supplies and the stockholding agency, was amended by the Royal Decree 1766/2007, which specifies the obligation to hold minimum emergency stocks and establishes a stockholding agency (Corporación de Reservas Estratégicas de Productos Petrolíferos, CORES3) in charge of creating and maintaining the strategic stocks and monitoring compliance with the minimum emergency stock obligation. Article 2 of the Royal Decree specifies the obligation for operators to hold a minimum of 92 days4 of stocks as emergency stocks, and Article 39 stipulates that the Government can regulate the use of emergency stocks during a supply disruption.
Stock levels, at end-Janaury 2011
Industry
84 326.0 kb
Public
52 279.0 kb
Crude Oil32%
Motor Gasoline
9%Middle
Distillates56%
Residual Fuel Oil
3%Crude Oil24%
NGL & Feedstocks
15%
Motor Gasoline
9%
Middle Distillates
33%
Residual Fuel Oil
7%
Other products
12%
Source: Monthly Oil Statistics, IEA
The obligation is calculated according to the operator’s sales or consumptions in the precedent 12-month period, and therefore it can change from month to month. The category breakdown of security stocks must reflect the breakdown of sales (gasoline, middle distillates, fuel-oil), and crude oil can be used to a certain extent in covering the stockholding obligation. All stocks owned or rented by the operators on Spanish territory can be counted towards the obligation (including the commercial or operational ones), provided they are available to the Spanish Government in a crisis situation. Some 70% of CORES stocks are held in the form of final products. CORES members are wholesale operators (refineries and trade companies). However, the stockholding obligation is also imposed on retail operators and large end-consumers for volumes that are imported directly and are not acquired from the wholesale operators.
3 CORES is a “public corporation” under the authority of the Ministry of Industry, Tourism and Trade (MITYC), but is not
part of the General State Administration structure. Its objectives are to create and manage the strategic stocks, and to control the minimum stockholding obligations of operators.
4 as of January 1st, 2010. Up to that date, the obligation was 90 days of sales or consumption.

SPAIN
12
A volume equivalent to 45 days of the stock obligation imposed upon the operators are “strategic reserves”, of which CORES is obliged to keep at least 42 days on an individual basis for each operator. Operators can ask CORES to hold up to 35 additional days5, which CORES can accept depending on the available storage capacity and available stocks volumes. The smallest operators (<0.5% market share) can delegate their whole obligation to CORES. Thus the “strategic reserves” kept by CORES could theoretically reach a volume equivalent to 77 days of the total 92-day obligation. As of 2010, CORES holds an additional volume of 35 days for all non-refining operators that have applied for it. By law, CORES has to hold a minimum of 45 days of the overall 92-day obligation. Although there are no legal provisions in this regard, CORES gives some consideration to geographical criteria in deciding where to maintain stocks, in order to maximise flexibility in the event of a domestic oil supply disruption. Stock Drawdown In the event of an IEA collective action, the Spanish Administration is likely to first lower the obligation on industry, so as to make additional barrels of industry stocks available to the market. The Spanish Administration also has the option of releasing public stocks. In the event of a CORES stock release, it would make additional barrels of oil available to operators, based on their market shares on the Spanish market. It should be noted that CORES keeps its “strategic reserves” mainly within the oil and logistic operators’ facilities (either segregated or commingled, according to storage agreements), and at its own facilities in Puertollano and Cartagena. CORES can rent stocks, but has never done so. Of note, all crude stocks (both industry and public) are located in refineries. Financing and Compliance
The average cost of the stocks held by CORES is EUR 15.40 per cubic metre per year. CORES finances its activities by collecting a monthly6 fee from operators, distributors and consumers obliged to keep security stocks. CORES calculates the fee on an annual basis based on a budget, which is then approved (or modified) and published by Order of the Ministry of Industry, Tourism and Commerce. CORES is not state-funded, and stock purchases are financed through bilateral loan agreements or public issues in the financial markets.
Stockholding compliance is controlled annually by CORES, and any breach by a company can be punished by the Ministry of Industry, Tourism and Commerce, in accordance with legal procedures managed by the National Energy Commission (NEC). Spanish law distinguishes three different levels of infringement (the security stocks legal obligations refer not only to the maintenance of stocks but also to reporting obligations, the breaching of which is punished less severely), and penalties can range from EUR 600,000 for minor violations to up to EUR 30,000,000 (and one-year activity ban) for very serious violations.
5 new version of Royal Decree 1716/2004, approved by Royal Decree 1766/2007 6 Collected on an annual basis in the case of natural gas and LPG obligations

SPAIN
13
3. Other Measures 3.1 Demand Restraint The transport sector makes up the majority of oil consumption in Spain, representing 58% in 2009. Thus the likely, most effective demand restraint measures would be targeted at the use of transport fuels.
Oil Consumption by Sector7
0%
10%
20%
30%
40%
50%
60%
70%
80%
90%
100%
shar
e of
tota
l oil
cons
umpt
ion
Transformation/Energy
Residential
Commercial/Agriculture/Other
Industry
Transport
58%
20%
5%5%
12%
2008 Source: Oil Information, IEA
Article 49 of Law 34/1998 (7 October) and Article 39 of Royal Decree 1716/2004 (23 July) establish that in situations of supply shortage, the Council of Ministers has the legal ability to take numerous demand restraint measures, such as carpooling, driving bans on odd/even license plate, speed limits, public transport fare reduction and public transport service increase. These measures’ legal prescription gives the Spanish Administration both power and flexibility in the case of a supply disruption. Certain demand restraint measures were put in place in March 2011, as a result of the Libyan crisis.
3.2 Fuel switching
In the case of an emergency, some diesel-fuelled power stations can switch to heavy fuel oil. However, since less than 1% of electricity consumed in Spain is produced by oil-fuelled8 power plants, the impact of an eventual oil crisis on the power supply to consumers would be negligible.
3.3 Relocating reserves As a result of previous incidents at national level, such as the Puertollano refinery accident in 2005, relocating the emergency reserves has proved to be a useful and effective way to deal with regional supply disruptions. CLH infrastructure has a major role in enhancing flexibility so that CORES and the Ministry of Industry, Tourism and Trade can put in place measures to relocate emergency reserves quickly. As a result, demand can be met with the existing resources without any need to implement additional measures or restrictions to consumption.
7 Total consumption (including refinery consumption), does not include international marine bunkers. 8 Fuel and gas turbine

SPAIN
14
4. Natural Gas 4.1 Market Features and Key Issues Gas supply Spanish production of natural gas is negligible, standing at 17 mcm in 2007 and 2008, and the country is thus highly reliant on gas imports to meet its domestic needs.
Natural Gas Imports by Source
0
5000
10000
15000
20000
25000
30000
35000
40000
45000
mill
ion
cubi
c m
etre
s
Other
Trinidad and Tobago
Qatar
Nigeria
Egypt
Algeria
Norway
Despite this high level of external dependence, the Spanish gas supply is well diversified with a large number of suppliers (10 in 2009) and a large proportion of LNG supplies. In 2009, 74% of Spain’s gas imports were LNG deliveries (from a diversified portfolio of sources), with the remaining 26% being pipeline supplies. Algeria is the main supplier of natural gas to Spain, supplying an estimated 12 bcm in 2009, or some 35% of total supplies, followed by Qatar, Egypt, Trinidad and Tobago, Nigeria and Norway (10-12% each). Algerian supplies are expected to increase further, following the completion of the 8 bcm MedGaz underwater pipeline directly from Algeria to Almería in 2010. It is important to note that Royal Decree 1766/2007 obliges direct suppliers and consumers carrying supplies for more than 7% of national consumption, to diversify their portfolio so that their supplies from the main supplying country stands below 50%. Gas demand Natural gas demand stood at 38.2 bcm in 2008, up 10% on the previous year and in line with the steady upward trend of recent years. However, the Spanish Administration estimates that demand dropped by an estimated 10% in 2009, due to weather conditions, the increase in renewable electricity supplies and the drop in economic activity. The natural gas consumption for electricity generation is high, accounting for 52% of total consumption. The industrial sector is the second largest consumer with 28% of demand, followed by the residential sector with 10%. The Spanish Administration estimates peak demand stands at around 1863 GWh, or 168 mcm/d. This is equivalent to 9 times the peak output from storage sites (18.5 mcm/d), but supply is amply covered by LNG regasification terminals alone (173 mcm/d) and pipeline import capacity (74 mcm/d).

SPAIN
15
Natural Gas Consumption by Sector
-
5,000
10,000
15,000
20,000
25,000
30,000
35,000
40,000
45,000 m
illio
n cu
bic
met
res Transformation
Energy
Dist. losses
Residential
Commercial/other
Industry
Transport
Source: Natural Gas Information, IEA
Natural gas is the dominant fuel source for power generation, accounting for 38-39% of total input in 2008 and 2009. As such, Spain’s electricity market is highly dependent on its gas supplies.
Gas company operations The Spanish natural gas sector is privately controlled, including production, distribution, and transmission. The largest gas supplier in Spain is Gas Natural. Enagás owns and operates Spain's domestic natural gas grid. The firm also owns and operates three of the country’s six LNG regasification terminals, at Huelva, Barcelona and Cartagena. After Enagás was privatised in 1994, Gas Natural initially acquired a controlling stake in the company. However, since December 2006, the government has limited individual company ownership of Enagás to a maximum of 5%.
4.2 Natural Gas Supply Infrastructure
Pipelines The international connections of the Spanish gas system consist of two gas import pipelines from Algeria and four international connections, two with France – Larrau (Navarra) and Irun (Guipúzcoa) – and two with Portugal – Badajoz and Tuy (Pontevedra). At present, interconnection capacities with France and the rest of continental Europe remain limited, meaning that the Iberian gas market is to a large extent perceived to be somewhat of a gas “island”. Nevertheless, all the interconnections to Portugal and France are reversible. A pipeline connecting the Iberian Peninsula with the Balearic Islands was commissioned in September 2008, integrating the Balearic Islands into the peninsular gas network, and thereby enhancing the reliability of the gas supply. Moreover, a reduction in CO2 emission into the atmosphere of around 225 000 tons per year is expected when natural gas fuelled power plants enter into operation in the Balearic Islands. Another important pipeline that became operational in 2009 was the Lemona-Haro pipeline, as well as the Haro and Navarra compression stations. These new facilities allow for greater imports and exports of natural gas trough the Larrau international connection with France (up to 90 mcm/d per day, or 100 GWh per day, for imports). With the success of the Open Season in 2009 and 2010, this will result in

SPAIN
16
having a minimum of 7.5 bcm in 2015 to export/import gas by pipeline to/from France and other countries north of the Pyrenees. Increasing interconnection capacity with France could increase Europe's gas supplies from North Africa, which has been identified as a priority project by the European Union. The 8-bcm MedGaz deepwater pipeline between Beni-Saf and Almería became operational in late 2010. This reinforced and diversified the supply to Southern Europe, supplying gas directly from Algeria without requiring transit through third countries (namely Morocco). The Iberian Peninsula could eventually become a new European gas hub, if sufficient interconnection capacity with France is added. Additional ongoing projects are a new pipeline parallel to the existing Ebro axis to duplicate the whole transmission capacity in this axis and will serve to increase the interconnection capacity with France, and a duplication of part of the Mediterranean axis. Once these new infrastructures are built, the gas network will be shaped by three basic South-North axes (Ruta de la Plata, Central Axis and Mediterranean Axis), interconnected among them thanks to another three West-East axes (Ebro axis, Galicia axis and transversal axis Alcázar-Montesa). All of them will be part of a grid that will enable the network to supply the needs of the peninsula centre from any entry point, reinforcing the flexibility of the system.
Gas Infrastructure Map
Ports (LNG terminals)
Spain has six operating regasification plants that are the main points of entry to the natural gas system. The latest addition is the REGANOSA LNG terminal, which was completed in November 2007. These plants are an essential element in the security of supply as they have a regasification capacity of 58 bcm per year, compared to an estimated natural gas demand of 35.5 bcm in 2009.

SPAIN
17
Regarding future developments, Enagás has been awarded the administrative license to build a new LNG terminal located in El Musel (Asturias), and two other LNG plants are planned in the Canary Islands (Tenerife and Gran Canaria). During the 2010-2011 winter, three new LNG tanks of 150 mcm each are to be added to the regasification terminals of Huelva, Cartagena and Barcelona. There are projects also for new tanks and further regasification capacity increase in coming years in existing terminals. Storage
Total LNG storage capacity stands at 2.5 mcm (equivalent to 1.54 bcm of gas storage), with a maximum drawdown rate of 6.86 mcm per day. The most recent upgrades are the third LNG tank in the Sagunto plant and the Barcelona terminal, whose additional send-out capacity reaches 1.95 mcm per hour. The regasification plants service will be further reinforced in the future due to increased injection capacity on the transmission system and LNG storage tanks (both are expected to increase by 30% between 2008 and 2012). By 2016, LNG storage should reach 4.59 mcm (equivalent to 2.82 bcm) and the maximum drawdown rate (“vaporisation”) should reach 9.68 mcm per day. There are currently only two operating underground storage (UGS) sites (both depleted fields) with a total working gas capacity of 1.66 bcm (total injection capacity 8.2 mcm/d and withdrawal capacity 12.5 mcm/d), namely Gaviota (offshore, Basque Country) and Serrablo (Huesca, Aragón).
Natural Gas storage facilities
Storage site/location Type of storage Working Capacity1
(mcm)
Peak Output
(mcm/day)2
Gaviota Depleted field 980 5.7Serrablo Depleted field 680 6.8Barcelona LNG 324 2.0Huelva LNG 282 1.4Cartagena LNG 262 1.4Bilbao LNG 180 0.8Sagunto LNG 270 1.0Mugardos LNG 180 0.4
Country Total 3 158.2 19.41 Working gas capacity = total gas storage minus cushion gas
2 Peak output = the maximum rate at which gas can be withdrawn from storage Total underground storage capacity is forecast to reach 6.88 bcm by 2016, with injection rates of 37.2 mcm/d and withdrawal capacity rates of 76.5 mcm/d. Two other storage sites are already under construction: Yela (Enagás – aquifer near Madrid) and Castor (Vinaroz – depleted oil field off coast of Castellon), which are expected to be operational mid-2012. The total available capacity of Spanish UGS is managed as a whole by the Technical System Manager in order to optimise the working of the network and to minimise gas flows from storages to consumers.
SPAIN
18
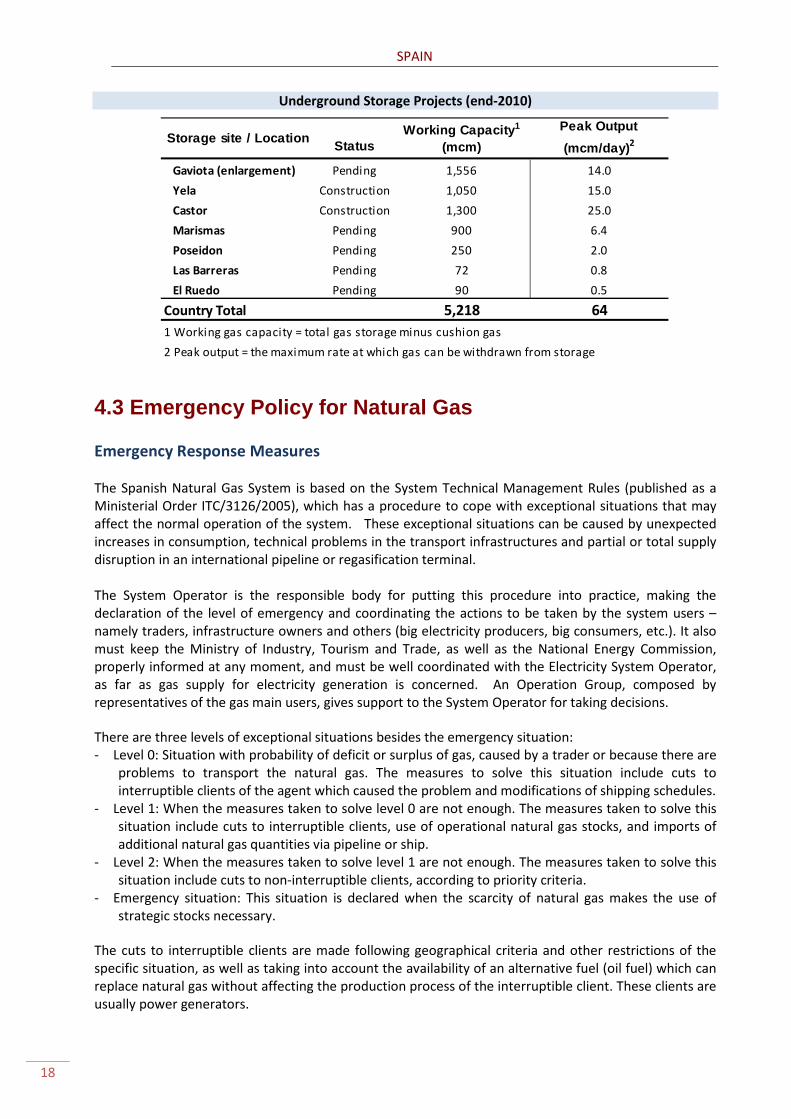
Underground Storage Projects (end-2010)
Storage site / LocationCurrent Status
Working Capacity1
(mcm)
Peak Output
(mcm/day)2
Gaviota (enlargement) Pending 1,556 14.0
Yela Construction 1,050 15.0
Castor Construction 1,300 25.0
Marismas Pending 900 6.4
Poseidon Pending 250 2.0
Las Barreras Pending 72 0.8
El Ruedo Pending 90 0.5
Country Total 5,218 641 Working gas capacity = total gas storage minus cushion gas
2 Peak output = the maximum rate at which gas can be withdrawn from storage
4.3 Emergency Policy for Natural Gas Emergency Response Measures The Spanish Natural Gas System is based on the System Technical Management Rules (published as a Ministerial Order ITC/3126/2005), which has a procedure to cope with exceptional situations that may affect the normal operation of the system. These exceptional situations can be caused by unexpected increases in consumption, technical problems in the transport infrastructures and partial or total supply disruption in an international pipeline or regasification terminal. The System Operator is the responsible body for putting this procedure into practice, making the declaration of the level of emergency and coordinating the actions to be taken by the system users – namely traders, infrastructure owners and others (big electricity producers, big consumers, etc.). It also must keep the Ministry of Industry, Tourism and Trade, as well as the National Energy Commission, properly informed at any moment, and must be well coordinated with the Electricity System Operator, as far as gas supply for electricity generation is concerned. An Operation Group, composed by representatives of the gas main users, gives support to the System Operator for taking decisions.
There are three levels of exceptional situations besides the emergency situation: - Level 0: Situation with probability of deficit or surplus of gas, caused by a trader or because there are
problems to transport the natural gas. The measures to solve this situation include cuts to interruptible clients of the agent which caused the problem and modifications of shipping schedules.
- Level 1: When the measures taken to solve level 0 are not enough. The measures taken to solve this situation include cuts to interruptible clients, use of operational natural gas stocks, and imports of additional natural gas quantities via pipeline or ship.
- Level 2: When the measures taken to solve level 1 are not enough. The measures taken to solve this situation include cuts to non-interruptible clients, according to priority criteria.
- Emergency situation: This situation is declared when the scarcity of natural gas makes the use of strategic stocks necessary.
The cuts to interruptible clients are made following geographical criteria and other restrictions of the specific situation, as well as taking into account the availability of an alternative fuel (oil fuel) which can replace natural gas without affecting the production process of the interruptible client. These clients are usually power generators.

SPAIN
19
Gas and LPG stockholding obligation
As per Royal Decree 1766/2007, natural gas and LPG operators are obliged to maintain minimum stocks equivalent to 20 days of consumption (10 days of “strategic reserves” and 10 days of “operational reserves”). As per Royal Decree 1716/2004, CORES is responsible for the Natural Gas and LPG sectors, and therefore is responsible for controlling the minimum stockholding obligations that correspond to operators in those sectors, as well as for verifying the obligation on operators to diversify Natural Gas supplies. However, CORES does not hold “strategic stocks” in the Natural Gas and LPG sectors. The use of underground storage is regulated by the Ministry so that all companies obliged to maintain stocks have access to the necessary capacity to store their strategic gas. The System Operator is the body in charge of the capacity allocation among companies, and reports to the Ministry and CORES. The natural gas sector obligation is calculated in accordance with what the regulations define as “firm sales” (supplies that cannot be interrupted, either for commercial or technical reasons) during the preceding calendar year. The stocks corresponding to this obligation must be maintained between April 1st and March 31st of the following year. The LPG obligation is based on the sales volume of the preceding 12-month period. The “strategic reserves” represent 10 days of non-interruptible sales made during the previous year. These stocks must be maintained by the traders and self-supplied consumers at any moment, and must be kept in underground storage only. The government assumes control of the strategic stocks in emergency situations. The “operational stocks” account for two days (average of the daily data) to be maintained along the year, in any kind of installation, plus another 8 additional days held in underground storage only, that at least need to be stored in October, and are calculated as an average of the daily data along the month. CORES is the organisation in charge of the supervision of this obligation fulfilment. It receives every month a complete range of data regarding the stocks of all the companies, which allows for having up-to-date information about the stocks situation in any moment. CORES also carries out an in-depth review of each company’s respective situation at least once a year. Responsibilities for releasing gas stocks in a gas crisis
Several stakeholders are attributed specific responsibilities in the event of a gas crisis, notably with regard to making gas stocks available to the market. ENAGAS, as the Technical System Manager, would declare one of the three levels of exceptionality regarding the emergency situation, and would coordinate the actions to be taken by the system users. Of note, the use of stocks is foreseen as of level 1. The Ministry of Industry, Tourism and Trade would establish the conditions and terms for the use of gas stocks by ENAGAS. CORES is responsible for monitoring the gas stocks, and would be responsible for ensuring that the obliged entities fulfil their responsibilities with regards to stock releases. CNE would not play a role in the release of gas stocks in the event of a crisis.

SPAIN
20
Interruptible Contracts and Fuel Switching The Royal Decree 1716/2004 (23 July) establishes that the guarantee of uninterruptible supplies shall apply to contracts that are not included in any of the following cases:
- The supplies are subject to an interruptible tariff, under the conditions laid down in the applicable regulations.
- The supplies are made in accordance with a contract by and between a trader and a consumer that includes commercial interruptibility clauses, as long as the said contract complies with the provisions laid down in applicable current legislation, as well as the following conditions:
o The supply point must have telemetering equipment. o The period of possible interruption that has been signed shall exceed 10 days per
year and the duration of the contract shall be at least annual.
In this regard, Resolution of 30 July 2010, by the Directorate General of Energy Policy and Mining, updates and establishes the requirements to allocate and the procedure to apply the cut-off regime in the gas system. The Technical System Operator keeps a permanent contact with its counterpart in the Electric Sector in order to allocate the interruptible contracts if necessary, and according to certain restrictions. If the peak demand coverage ratio (CR) is under 105, interruptible contracts are allowed. If the CR is between 105 and 115, interruptible contracts are only possible for those units with an alternative fuel. According to forecasts for the 2010-2011 winter, the minimum CR expected was 117, for a period of only two weeks. The rest of the year, the CR would be higher (the mean for 2009 was 130). The Spanish system is designed to be highly flexible (LNG diversification, etc.), and thus fuel switching is not regarded as a priority tool to face disruptions. Nevertheless, combined-cycle power plants can work with an alternative fuel (mainly diesel) for short periods of time. Additional measures
Every year, the Spanish Administration designs a Winter Action Plan, which lays out additional requirements for shippers from 1st November to 31st March. In accordance with the Gas System Technical Management Rules, the winter action plan is approved on a yearly basis by the Directorate General for Energy Policy and Mines at the Ministry of Industry, Tourism and Trade. The plan includes a limit on the gas nominations towards France in the Spain-France interconnection of Larrau, minimum LNG stocks levels, a method to predict the increase of demand in case of cold spell, and a cold spell definition. Spain’s gas network is based on the N-1 principle, whereby in the event of the disruption of any large piece of infrastructure, the remaining infrastructure is capable of meeting the total gas demand for the area. Diversification of supplies is a key tenant of Spain’s emergency policy design. Royal Decree 1766/2007 obliges direct suppliers and consumers carrying supplies for more than 7% of national consumption to diversify their portfolio so that their supplies from the main supplying country stand below 50%.

INTERNATIONAL ENERGY AGENCY
The International Energy Agency (IEA), an autonomous agency, was established in November 1974. Its primary mandate was – and is – two-fold: to promote energy security amongst its member countries through collective response to physical disruptions in oil supply, and provide authoritative
research and analysis on ways to ensure reliable, affordable and clean energy for its 28 member countries and beyond. The IEA carries out a comprehensive programme of energy co-operation among its member countries, each of which is obliged to hold oil stocks equivalent to 90 days of its net imports. The Agency’s aims include the following objectives:
n Secure member countries’ access to reliable and ample supplies of all forms of energy; in particular, through maintaining effective emergency response capabilities in case of oil supply disruptions.
n Promote sustainable energy policies that spur economic growth and environmental protection in a global context – particularly in terms of reducing greenhouse-gas emissions that contribute to climate change.
n Improve transparency of international markets through collection and analysis of energy data.
n Support global collaboration on energy technology to secure future energy supplies and mitigate their environmental impact, including through improved energy
efficiency and development and deployment of low-carbon technologies.
n Find solutions to global energy challenges through engagement and dialogue with non-member countries, industry, international
organisations and other stakeholders. IEA member countries:
Australia Austria
Belgium Canada
Czech RepublicDenmark
Finland France
GermanyGreece
HungaryIreland
ItalyJapan
Korea (Republic of)LuxembourgNetherlandsNew Zealand NorwayPolandPortugalSlovak RepublicSpainSwedenSwitzerland
TurkeyUnited Kingdom
United States
The European Commission also participates in
the work of the IEA.
Please note that this publication is subject to specific restrictions that limit its use and distribution.
The terms and conditions are available online at www.iea.org/about/copyright.asp
© OECD/IEA, 2011International Energy Agency
9 rue de la Fédération 75739 Paris Cedex 15, France
www.iea.org