overview about rock mechanical lab test-ing – part i
TRANSCRIPT

Editor: Prof. Dr.-Ing. habil. Heinz Konietzky Layout: Angela Griebsch, Gunther Lüttschwager
TU Bergakademie Freiberg, Institut für Geotechnik, Gustav-Zeuner-Straße 1, 09599 Freiberg • [email protected]
Overview about rock mechanical lab test-ing – part I: mechanical tests Authors: Dr. Thomas Frühwirt & Prof. Dr. habil. Heinz Konietzky (TU Bergakademie Freiberg, Geotechnical Institute)
1 Introduction .......................................................................................................... 2
2 Basic tests ........................................................................................................... 3
3 Mechanical lab tests ............................................................................................ 4
Static Hardness determination ...................................................................... 4
Rebound Hardness determination ................................................................. 7
Abrasion determination .................................................................................. 7
Point load index test ...................................................................................... 8
Sound velocity tests ..................................................................................... 11
Uniaxial compression tests .......................................................................... 12
Uniaxial tension test .................................................................................... 16
Brazilian test ................................................................................................ 19
Comparison between different types to measure tensile strength ............... 21
Triaxial test (Karman-type) ....................................................................... 25
True triaxial tests ...................................................................................... 29
Shear box tests ........................................................................................ 30
Fracture toughness tests .......................................................................... 33
3.13.1 KI fracture toughness tests ................................................................ 33
3.13.2 KII fracture toughness tests ................................................................ 37
4 Acoustic emission monitoring ............................................................................ 37
5 Further dynamic testing methods ...................................................................... 40
6 Large-scale testing (physical models) ............................................................... 42
7 Literature ........................................................................................................... 44

Overview about rock mechanical lab testing – part I mechanical tests
Only for private and internal use! Updated: 1 October 2018
page 2 of 46
1 Introduction
Rock mechanical lab testing provides basic parameters in respect to mechanical, hydrau-lic and thermal rock properties. This also includes the interaction of these properties, ob-tained by so-called hydro-thermal-mechanical coupled testing (HTM). Several tests are similar to those which are common in soil mechanics [e.g. Germaine & Germaine 2009], but due to the high stiffness and strength level of the rock material as well as the brittle characteristics of most of the rocks forces, resolution in respect to deformation and dis-placement as well as reaction time of testing devices have to meet special requirements. Rock mechanical lab testing can be subdivided into several types according to different criteria, for instance:
▪ Static vs. dynamic tests ▪ Uniaxial vs. triaxial tests ▪ Coupled vs. uncoupled tests ▪ Sophisticated tests vs. indicator tests ▪ Standardized tests vs. scientific tests ▪ Compression tests vs. tensile tests
Standards for rock mechanical lab tests are formulated in regulations or recommenda-tions by national or international scientific organizations. Important documents are the following:
▪ Recommendation of the DGGT (German Geotechnical Society)
▪ Recommendations of the ISRM (Int. Society for Rock Mechanics)
▪ ASTM standard (American Society for Testing and Materials)
Because brittle rocks have similar parameters and show similar pattern during testing compared with concrete, standards and recommendation valid for concrete can be con-sulted in addition to the rock mechanical literature. Prerequisite to obtain reliable data from rock mechanical testing is the correct sample selection and preparation. Samples should be prepared according to the specific recommendations valid for the different tests. Important are size (e.g. length to height ratio or ratio of grain size to sample size) and the surface conditions (e.g. roughness or parallelism). The most important mechani-cal properties are related to strength (e.g. uniaxial compressive and tensile strength) and stiffness (e.g. Young’s or Deformation Modulus and Poisson’s ratio). The most important hydraulic parameters are porosity and permeability. The most important thermal param-eters are thermal conductivity and thermal expansion coefficient. The next chapters describe the most popular tests in detail. The authors are aware, that several other test procedures exist but this chapter can cover only a few and the most popular ones. Fig. 1 illustrates how strain rate, test apparatus and deformation type cor-relate to each other.

Overview about rock mechanical lab testing – part I mechanical tests
Only for private and internal use! Updated: 1 October 2018
page 3 of 46
Fig. 1: Test apparatus vs. strain rate [Wong et al. 2017; SHPB = Split-Hopkinson-Pressure-Bar]
2 Basic tests
Before any more comprehensive test is performed, in most cases some basic parameters have to be determined, like density, porosity and water content using simple test proce-dures. Density values are obtained by determining the weight and the volume of the sam-ple. One can distinguish between the following different types:
▪ Bulk density ρ ▪ Saturated density ρsat ▪ Dry density ρd ▪ Grain density ρs
The grains (solid components of the sample) are characterized by mass Ms and volume Vs. Pore water and corresponding mass are characterized by Mw and Vw. Pore volume is given by Vv.
sS
s
s w vsat
sd
M
V
M
V
M V
V
M
V
=
=
+=
=

Overview about rock mechanical lab testing – part I mechanical tests
Only for private and internal use! Updated: 1 October 2018
page 4 of 46
Based on these parameters also water content w, degree of saturation Sr, porosity n and void ratio e are given, respectively.
w
s
w
v
v
v
s
1
r
Mw
M
VS
V
Vn
V
Ve
V
ne
n
=
=
=
=
=−
To determine dry density, samples have to be dried in an oven at 105 °C for at least 24 hours, but at least until equilibrium in mass is obtained. The volume (rock matrix and pores) can be determined by different methods: calliper method (volume determination by means of mechanical measuring devices, e.g. calliper), mercury displacement method (measurement of amount of mercury penetrating the dry sample), water displacement method (measurement of amount of water penetrating the dry sample) and buoyancy method (difference in weight between saturated and dry sample). More detailed infor-mation is given for instance in Ulusay & Hudson [2007].
3 Mechanical lab tests
Static Hardness determination
Static hardness testing is based on the indentation of a hard tool into the sample. Hard metal balls or diamond cones or pyramids can act as indentors. The test load is applied with a defined initial application time and duration and has to be applied perpendicular to the sample. The indentation is measured after removal of the load, either with integrated or separate optical devices (microscopes). The most popular methods applied in rock mechanics are the testing procedures according to Brinell (ball), Vickers (pyramid), Knoop (pyramid) and Rockwell (different shapes). Sample thickness should be at least ten times penetration depth of indentor. Load level and indentor size depend on material and considered resolution. Hardness testing is standardized by national and international regulations (e.g. ISO, DIN, ASTM). According to the different procedures different dimen-sionless hardness parameters can be determined.

Overview about rock mechanical lab testing – part I mechanical tests
Only for private and internal use! Updated: 1 October 2018
page 5 of 46
Fig. 2: Typical Indentec hardness testing devices [company leaflets]

Overview about rock mechanical lab testing – part I mechanical tests
Only for private and internal use! Updated: 1 October 2018
page 6 of 46
Fig. 3: Multi-functional hardness testing device with digital image analysis [RML 2016]

Overview about rock mechanical lab testing – part I mechanical tests
Only for private and internal use! Updated: 1 October 2018
page 7 of 46
Fig. 4: Schmidt Hammer after (top) and before (bottom) releasing the spring [RML 2016]
Rebound Hardness determination
The Schmidt Hammer is the most popular portable device to measure the rebound hard-ness and is often used to estimate uniaxial compressive strength or Young’s modulus via empirical relations [Ulusay 2015]. The Schmidt hammer consists of a spring loaded pis-ton, which is released when the plunger is pressed against the surface. The percentage of maximum stretched length of the spring before the release of the piston to the length after rebound gives the so-called rebound hardness value R. Depending on rock strength two different types are used: L-type (0.735 Nm) and N-type (2.207 Nm).
Abrasion determination
Abrasion tests measure the resistance of steel pins to wear during defined interaction with rock. During the past decades several testing procedures were developed to specify the abrasion characteristics of rocks [e.g. Ulusay 2007]. The most popular procedure is the so-called Cherchar test. During the test a steel pin (Rockwell hardness of 54 – 56 and tensile strength of 2 GPa) with angle of 60° and loaded by 70 N is scratching the rock surface. A distance of at least 50 mm or even better 100 mm is recommended to deter-mine the CAI (Cherchar Abrasiveness Index) according to Plinninger et al. [2003]. CAI itself is determined by microscopic inspection of the abrasion of the steel needle. CAI varies between 0.3 (not very abrasive) and 6.0 (extremely abrasive). By performing sev-eral scratch tests and rotating the sample anisotropy in abrasion can be determined.

Overview about rock mechanical lab testing – part I mechanical tests
Only for private and internal use! Updated: 1 October 2018
page 8 of 46
Fig. 5: Left side: Typical test device for determination of CAI. Right Side: Scratching traces on
limestone specimen after testing perpendicular to bedding and in parallel to bedding planes,
respectively [RML 2016]
Point load index test
The Point Load Index Test (PLT) is a simple alternative to the uniaxial compression test, but does not deliver directly uniaxial or tensile compressive strength data, but rather an index about rock strength, which can be either correlated to more precise parameters or directly used in empirical design procedures. During PLT a rock sample is compressed between conical steel platens (pins) until failure occurs. The PLT index IS is calculated according to the following formulae:
SS
FI
A=
where: S
F is the failure load (force)
A is the corresponding area of the fracture plane (sometimes also the square of the equivalent sample radius is used)
The PLT device (fig. 6) should meet several requirements in respect to size, shape and stiffness and allow to monitor the applied pressure including the determination of peak pressure. Also, only those tests, which show unique fracture pattern should be used for evaluation (fig. 7). Because PLT index shows a significant scale effect (increase with in-creasing sample size), a size correction has to be performed by log-log-plots or the LOGAR-procedure [Thuro 2008]. If enough reliable data for one specific rock type exist,

Overview about rock mechanical lab testing – part I mechanical tests
Only for private and internal use! Updated: 1 October 2018
page 9 of 46
a correlation between PLT index and uniaxial compressive strength (UCS) can be estab-
lished in terms of a linear relation: S
UCS c l= , where c is a correlation factor. Fig. 8 and
9 show such correlations for Cottaer Sandstone and Innsbrucker Quarzphyllit, respec-tively. More detailed information about PLT testing are given in Ulusay & Hudson [2007] or Thuro [2008].
Fig. 6: Point Load Index Device (loading frame, pump with manometer and data aquisition unit) [RML
2016]

Overview about rock mechanical lab testing – part I mechanical tests
Only for private and internal use! Updated: 1 October 2018
page 10 of 46
Fig. 7: Valid and invalid fracture patterns [Thuro 2008]
Fig. 8: Correlation between Point Load Index and UCS, Postaer Sandstone [RML 2016]
10.0
20.0
30.0
40.0
50.0
60.0
70.0
1.0 1.5 2.0 2.5 3.0 3.5 4.0 4.5 5.0Un
iaxi
al C
om
pre
ssiv
e S
tre
ngt
h [
N/m
m²]
Point Load Strength [N/mm²]
Data Set #1
Data Set #2
Data Set #3
Data Set #4
Is = 2.8 0.5 [N/mm²]
u = 43.2 7.6 [N/mm²]

Overview about rock mechanical lab testing – part I mechanical tests
Only for private and internal use! Updated: 1 October 2018
page 11 of 46
Fig. 9: Correlation between Point Load Index and UCS, Innsbrucker Quarzphyllit [Thuro 2008]
Sound velocity tests
Sound velocity is closely related to dynamic elastic constants by the following formulae:
( )
( )( )
1
1 1 2p
Ev
−=
+ −
( )
( )
1
2 1s
Ev
−=
+
where: vp Compressional wave speed vs Transversal wave speed E Dynamic Young’s modulus Dynamic Possion’s ratio Density
Sound velocity is usually measured by piezo-electric sensors (transmitter and receiver) on prepared cores samples, bars or bigger rock blocks. Frequencies are typically in the order of several 100 kHz. Three different measuring procedures are common:
▪ Determination of wave speed of longitudinal and transversal wave

Overview about rock mechanical lab testing – part I mechanical tests
Only for private and internal use! Updated: 1 October 2018
page 12 of 46
▪ Determination of velocity of dilatational and torsional waves in bar of rode-like specimen
▪ Determination of resonant frequency of dilatational and torsional waves in bar of rode-like specimen
Velocity of P- and S-waves are determined by dividing distance by travel time or multiply-ing two times the length of the bar with resonance frequency. Despite the determination of dynamic elastic constants (E, ) sound velocity measurements can also be used to
estimate the damage state, the anisotropy ratio or to classify rocks.
Fig. 10: Typical equipment to measure sound velocity on core samples [RML 2016]
Uniaxial compression tests
The aim of uniaxial compression testing is to determine compressive strength and stiff-ness of intact rock samples. A suitable testing machine has to be used, which should have the following features (see also specifications according to ASTM, DIN or ISRM / DGGT recommendations):
▪ Sufficient stiffness and load capacity ▪ Spherical seat and sufficient hardness of loading platens ▪ Sufficient size of loading platens (diameter of loading platen > sample diameter) ▪ High accuracy in measuring axial load and vertical displacement incl. display and
storage of data (measurement error < 1 %)
The rock samples should meet several requirements:
▪ Cylindrical shape with height to diameter ration of about 2 to 3 ▪ Diameter of specimen should be related to the largest grain diameter by a ratio of
10 : 1 or larger

Overview about rock mechanical lab testing – part I mechanical tests
Only for private and internal use! Updated: 1 October 2018
page 13 of 46
▪ The ends of the specimen should be flat and not depart from perpendicularity (parallel with high precision)
The testing shall be performed according to the following rules:
▪ Constant stress rate of about 0.5 to 1.0 MPa/s until failure ▪ To determine any kind of deformation modulus, Young’s modulus and Poisson’s
ratio, it is recommended to use separate high-precision measuring devices, like LVDT’s, strain gauges or optical devices (accuracy in strain determination should be better than 2 %)
Test reporting should contain information about the following items:
▪ Source of sample incl. lithological description and basic parameters (density, water content etc.)
▪ Orientation of sample axis in respect to planes of anisotropy ▪ Sample geometry ▪ Date of testing, used machine and loading rate ▪ Failure pattern ▪ Measured (forces and displacements) and deduced values (peak strength, defor-
mations modulus etc.) ▪ Photo documentation of sample before and after testing
Uniaxial compressive strength is determined by dividing the peak load P by the initial cross sectional area A0:
0
PUCS
A=
Axial strain a is measured by dividing change in axial length Δl by original axial length
l0:
0
a
l
l
=
The lateral deformation can be given either as diametric strain a (change in diameter)
or circumferential strain c (change in circumference):
0dd d = or 0c
c c = (both give identical results)
Deformation moduli incl. Young’s modulus are given by the slope of the axial strain – axial deformation curve, whereby according to the definitions different regions (parts) of the
stress – strain curve are used. Poisson’s ratio is given by dividing the horizontal strain h
by vertical strain a :
h
a
=

Overview about rock mechanical lab testing – part I mechanical tests
Only for private and internal use! Updated: 1 October 2018
page 14 of 46
Due to the inhomogeneity of the samples and measurement errors in general, it is rec-ommended to perform at least 3 or better 5 tests per rock type. Scale (size) effects should be taken into account (see also fig. 15).
Fig. 11: Typical machine for uniaxial compression tests [RML 2016]
Fig. 12: Sample, prepared for uniaxial compression testing with longitudinal and lateral strain
measurement direct on the sample [RML 2016]

Overview about rock mechanical lab testing – part I mechanical tests
Only for private and internal use! Updated: 1 October 2018
page 15 of 46
Fig. 13: Typical recording during uniaxial compression testing: vertical stress vs. vertical strain
[RML 2016]
Fig. 14: Typical fracture pattern: axial splitting (left) and shear fracturing (right) [RML 2016]

Overview about rock mechanical lab testing – part I mechanical tests
Only for private and internal use! Updated: 1 October 2018
page 16 of 46
Fig. 15: Example for scale effect of sample size [Pinto, 1990]
Uniaxial tension test
For the uniaxial tension test, the same general rules and recommendations are valid as for the uniaxial compression test (see chapter 3.6). After sample preparation cylindrical metal caps shall be cemented to the specimen ends, so that tensile stress can be applied. Care should be taken by cementation of the end caps and the load transfer system, so that alignment of the whole system (sample + end caps) with the load axis is guaranteed and any torsion or bending is avoided.

Overview about rock mechanical lab testing – part I mechanical tests
Only for private and internal use! Updated: 1 October 2018
page 17 of 46
Fig. 16: Uniaxial tension test: machine with sample during testing [RML 2016]

Overview about rock mechanical lab testing – part I mechanical tests
Only for private and internal use! Updated: 1 October 2018
page 18 of 46
Fig. 17: Uniaxial tension test: Samples with typical failure pattern [RML 2016]

Overview about rock mechanical lab testing – part I mechanical tests
Only for private and internal use! Updated: 1 October 2018
page 19 of 46
Fig. 18: Uniaxial tension test: typical results obtained for Postaer Sandstone [Baumgarten & Konietzky,
2012]
Brazilian test
The Brazilian test (also called tensile splitting test) is an indirect method to determine the tensile strength. This method is very popular, because sample preparation is easy and standard compressive testing equipment can be used. During a Brazilian test a circular rock disc is compressed by two diametrically applied forces (fig. 19). The applied com-pressive load should be transmitted to the sample only through a very small arc of contact (< 10°). Thickness if disc should be half the diameter. Based on a simplified analytical solution the splitting tensile strength σt can be calculated according to the following for-mulae:

Overview about rock mechanical lab testing – part I mechanical tests
Only for private and internal use! Updated: 1 October 2018
page 20 of 46
Fig. 19: Stress situation during Brazilian test [Dinh 2011]
2
t
P
Dt
=
where: P = maximum (peak) load at failure D = diameter of disc t = thickness of disc The above mentioned formulae is only valid, if a central tensile crack is observed. For anisotropic material, especially if plane of anisotropy is inclined to the loading direction, mixed-mode or even predominant shear failure can occur (see fig. 20). Also, sometimes shear failure is observed at the load entry points under the loading jaws. In these cases the above mentioned formulae is not valid. More detailed information, especially under consideration of anisotropic rocks and influence of testing parameters, is given by Dinh [2011], Dinh et al. [2013], Vervoort et al. [2014] and Dinh & Konietzky [2014].
Fig. 20: Typical potential failure pattern for anisotropic material [Dinh & Konietzky 2014]

Overview about rock mechanical lab testing – part I mechanical tests
Only for private and internal use! Updated: 1 October 2018
page 21 of 46
Fig. 21: Typical test arrangement with arc-formed loading jaws and cylindrical samples [RML 2016]
Fig. 22: Typical fracture pattern during Brazilian tests for quasi-isotropic rocks (Postaer Sandstone)
[RML 2016]
Comparison between different types to measure tensile strength
The tensile strength of rocks can be determined by different types of measurement. Besides the direct
tensile strength (DTS) measurement and the very popular Brazilian test method (BTS) – both are explained
above - also other methods are applicable like three or four point bending tests, hydraulic fracturing or ring
tests. In general these methods deliver slightly different values. These differences become even more pro-
nounced if the rock is anisotropic like documented in fig. 23.
Perras & Diederichs (2014) have evaluated tensile strength data from literature and performed a statistical
analysis. Besides some remarkable scatter they found also that in general the DTS is the smallest value
compared with values determined by indirect methods. Therefore, it is recommended to use only about
80% of the tensile strength value determined by indirect methods if DST has to be determined. Typically
the ratio between UCS and tensile strength for a specific type of rock is between 5 and 20. This is also
confirmed by Perras & Diederichs (2014) as documented in fig. 26.

Overview about rock mechanical lab testing – part I mechanical tests
Only for private and internal use! Updated: 1 October 2018
page 22 of 46
Fig. 23: Tensile strength of anisotropic sandstone measured via DTS method, BTS method and three-
point bending method (given are mean value and standard deviation as well as number of sam-
ples)

Overview about rock mechanical lab testing – part I mechanical tests
Only for private and internal use! Updated: 1 October 2018
page 23 of 46
Fig. 24: DTS versus indirect determined tensile strength (Perras & Diederichs, 2014)
Fig. 25: Histogram of ratio between DTS and BTS (Perras & Diederichs, 2014)

Overview about rock mechanical lab testing – part I mechanical tests
Only for private and internal use! Updated: 1 October 2018
page 24 of 46
Fig. 26: Relation between UCS and tensile strength (Perras & Diederichs, 2014)

Overview about rock mechanical lab testing – part I mechanical tests
Only for private and internal use! Updated: 1 October 2018
page 25 of 46
Triaxial test (Karman-type)
The Karman-type of testing is the most popular type of triaxial testing. This type of testing is designed for cylindrical specimen and characterized by circumferential and axial pres-sure (σ1 > σ2 = σ3 for compressional testing and σ1 < σ2 = σ3 for extensional testing). Requirements on sample preparation are similar to those already mentioned in chapter 3.6 (uniaxial compression testing). The axial pressure is applied by loading plates, the circumferential load by oil pressure. This demands, that the sample is encapsulated by a flexible rubber sleeve to avoid any direct contact between the pressurised oil and the rock sample. Sample size depends on triaxial cell size, but should follow a height to diameter ratio of about 2. Figure 27 shows a sample prepared for triaxial testing including axial and circumferential strain measurement sensors. Triaxial testing can be performed in quite different ways, following different stress paths, deformation or stress controlled and using different loading velocities. Also, due to the existing servo-algorithm, the post-peak be-haviour (strain softening) can be observed, if the machine frame provides sufficient stiff-ness (> 1 MN/mm). Fig. 29 illustrates the different stress paths, which can be applied (CTC: conventional triaxial compression, RTC: reduced triaxial compression, RTE: re-duced triaxial extension, HC: hydrostatic compression, TE: triaxial extension, RTE: re-duced triaxial extension). To determine the complete failure envelope different proce-dures can be applied: several single step tests, multi-stage tests or continuous failure state tests (fig. 30 and 31). National and international recommendations (e.g. given by ISRM or DGGT) describe in detail the different procedures and demands for conducting triaxial tests. A comprehensive overview is given by Kwasniewski [2012].
Fig. 27: Sample with rubber sleeve prepared for testing with sensors to measure axial and
circumferential deformation [RML 2016]

Overview about rock mechanical lab testing – part I mechanical tests
Only for private and internal use! Updated: 1 October 2018
page 26 of 46
Fig. 28: Typical triaxial testing device with loading frame and triaxial cell, pressure unit and data
recording unit [RML 2016]
Fig. 29: Typical stress paths applied in Karman-type triaxial testing

Overview about rock mechanical lab testing – part I mechanical tests
Only for private and internal use! Updated: 1 October 2018
page 27 of 46
Fig. 30: Coventional single-stage test (axial pressure σ1 versus axial deformation ε1 or confining
pressure σ3)
Fig. 31: Multi-stage test (axial pressure σ1 versus axial deformation ε1 or confining pressure σ3)

Overview about rock mechanical lab testing – part I mechanical tests
Only for private and internal use! Updated: 1 October 2018
page 28 of 46
Fig. 32: Triaxial single step and continuous failure state tests for determination of failure envelope for
Postaer Sandstone, Germany (axial pressure σ1 versus axial deformation ε1 or confining
pressure σ3) [Baumgarten & Konietzky, 2012]
Overview about rock mechanical lab testing – part I mechanical tests
Only for private and internal use! Updated: 1 October 2018
page 29 of 46
Fig. 33: Change of compressional wave speed during triaxial testing of Postaer Sandstone, Germany
[Baumgarten & Konietzky 2012]
True triaxial tests
True triaxial testing allows the application of three different principal stresses (σ1 > σ2 > σ3) on cubical samples. Depending on the specific construction 3 to 6 hydraulic cylinders or pressure cells are necessary to apply the 3-dimensional stress state. True triaxial testing is necessary to investigate the effect of the intermediate principal stress on strength, failure pattern and deformation characteristics. More detailed information are given by Kwasniewski [2012].

Overview about rock mechanical lab testing – part I mechanical tests
Only for private and internal use! Updated: 1 October 2018
page 30 of 46
Shear box tests
A shear box device consists of a loading frame, an upper and lower shear box and two pistons to apply shear force and normal force (fig. 34). Figure 35 shows a photo of the central part of a sophisticated shear box device including the empty upper and lower shear box. Inside these boxes the rock sample has to be placed. The fixation of the sam-ple (either cuboidal or cylindrical) is performed with special grout of high strength and stiffness.
Fig. 34: Principal sketch of a shear box device [Konietzky et al. 2012]
Fig. 35: Foto of a shear box device and view into empty shear boxes [Konietzky et al. 2012]
Lower shear frame Piston for shear load
Piston for normal load
Vertical frame
Upper shear frame
150

Overview about rock mechanical lab testing – part I mechanical tests
Only for private and internal use! Updated: 1 October 2018
page 31 of 46
Shear box testing can be performed in quite different manners:
▪ as a constant normal load (CNL) test or constant normal stiffness (CNS) test (fig. 36)
▪ as a static, cyclic or dynamic test ▪ as a pure mechanical test or HM-coupled test ▪ as a test for intact rock samples or test of discontinuities (joints, fractures etc.) ▪ as a single-stage or multi-stage test ▪ as a test up to the peak strength or until the residual strength
During the test the following parameters should be monitored:
▪ axial and horizontal forces ▪ axial displacement and heave of loading plate (dilation measurement)
In addition surface roughness of shear plane can be scanned before and after the tests as well as during test breaks. Normal stress and shear stress can be determined by the recorded forces and the corresponding areas, whereby it should be considered, that ef-fective shear area may be reduced with ongoing shear displacement and therefore, the normal stress should be updated continuously. Classical evaluation of shear tests include the determination of cohesion, friction and dilation. Cohesion and friction are determined using the Mohr-Coulomb theory by linear regression over several data pairs of normal and shear stresses (fig. 37 and fig. 38).
Fig. 36: Principle of CNL (left) and CNS (right) testing
W
(a)
S
N = constant
(b)
S
K

Overview about rock mechanical lab testing – part I mechanical tests
Only for private and internal use! Updated: 1 October 2018
page 32 of 46
Fig. 37: Example: Shear test results for 3 tests with different normal stress of 3.6, 5.0 and 10.0 MPa
Fig. 38: Example: Determination of peak and residual strength for a slate by linear regression of 3 shear
tests (peak cohesion = 2.5 MPa, peak friction angle 29°, residual cohesion = 0.16 MPa, residual
friction = 27°)
The dilation Ψ is defined as ratio between measured vertical to horizontal displacement components (valid under the assumption, that the shear plane is horizontal):
n
s
u
u
=
0
1
2
3
4
5
6
7
8
9
0 1 2 3 4 5 6 7 8 9 10
Shear displacement [mm]
Sh
ear
stre
ss [
MP
a]3.6 MPa
5.0 MPa
10.0 MPa
y = 0.568x + 2.4616
R2 = 0.9129
y = 0.5106x + 0.1676
R2 = 0.9959
0
1
2
3
4
5
6
7
8
9
0 1 2 3 4 5 6 7 8 9 10 11
Normal stress [MPa]
Shea
r st
ress
[M
Pa]
Peak
Residual

Overview about rock mechanical lab testing – part I mechanical tests
Only for private and internal use! Updated: 1 October 2018
page 33 of 46
However, one should take into consideration the actual orientation of the fracture plane. If the fracture plane is inclined, ‘apparent’ dilation is observed and the true value should be obtained by correction (fig. 39).
Fig. 39: Problem of ‘apparent’ dilation due to inclined fracture plane
Fracture toughness tests
Three different types of fracture toughness can be distinguished:
▪ Mode-I: tensile fracture ▪ Mode-II: in-plane shear fracture ▪ Mode-III: out-of-plane shear fracture (torsion fracture)
So far, for practical applications only Mode-I and Mode-II fracture propagations are con-sidered. Therefore, lab testing concentrates on these two types:
▪ Determination of critical stress intensity factor (= fracture toughness) KIC ▪ Determination of critical stress intensity factor (= fracture toughness) KIIC
In material sciences several methods were developed to determine fracture toughness. Due to the specific material characteristics of rocks specific testing methods were devel-oped in rock mechanics.
3.13.1 KI fracture toughness tests
Most popular methods are:
▪ Chevron Bend Specimen (CBS) test ▪ Short Rod Specimen (SRS) test ▪ Cracked Chevron Notched Brazilian Disc (CCNBD) test ▪ Semi-circular bend (SCB) test
CBS test is similar to a 3-point-bending test, but needs a special prepared cylindrical sample. A special shaped notch [Ulusay 2007] has to be created at the centre of the
us
no
Slope direction
Z
X
un < 0
Shear
direction
Initial position
no
Slope direction
O
(positive)
Slope direction
Shear
direction
us
Z
X
un > 0
Initial position
no
Shear
direction
Slope direction Slope direction
no
O
(negative)
Slope direction
Shear
direction

Overview about rock mechanical lab testing – part I mechanical tests
Only for private and internal use! Updated: 1 October 2018
page 34 of 46
specimen opposite to the load entry point. The measurements can be conducted on two different levels:
▪ Level-1-testing: considers only load at failure and sample dimensions ▪ Level-2-testing: considers non-linearities during fracture propagation based on
additional measurement of crack opening displacement and corresponding cor-rection terms in calculating fracture toughness [Ulusay 2007]
KIC based on level-1-testing is determined by the following formulae:
where MPa mIC IC
AFK K
D= =
2
1.835 7.15 9.85a a S
AD D D
= + +
where: F maximum load (load at failure) in kN D diameter of specimen in cm S distance between support points (3.33 D ) in cm
A Chevron tip distance from specimen surface ( 0.15 D ) in cm
Fig. 40: Test set-up for CBS test [RML 2016]

Overview about rock mechanical lab testing – part I mechanical tests
Only for private and internal use! Updated: 1 October 2018
page 35 of 46
SRS tests are designed for using short rods (cylindrical core specimen of short length) with chevron-shaped notch cut along core axis. SRS test can also be performed as level-1 or level-2 test. KIC based on level-1-testing is determined by the following formulae:
1.524 where MPa mIC IC
FK K
D= =
where: F maximum load (load at failure) in kN D diameter of specimen in cm CCNBD testing is similar to the classical Brazilian test, but needs a special preparation of the sample: a special designed notch (fig 40). KIC is determined by the following for-mulae:
IC I
P aK N
RB=
R radius of specimen a half crack length P load at failure B thickness of specimen NI special function depending on sample dimension and crack orientation (see
Chen & Konietzky [2014]) SCB tests is a special three-point bending test as shown in fig. 43. More specific recom-mendations are given by Kuruppu et al. (2014).
2
IC I
P aK Y
rt
=
where: P maximum load a notch length r radius of sample t thickness of specimen YI special dimensionless function depending on sample dimension and crack orien-
tation α according to Kuruppu et al. [2014]

Overview about rock mechanical lab testing – part I mechanical tests
Only for private and internal use! Updated: 1 October 2018
page 36 of 46
Fig. 41: CCNBD sample configuration [Aliha & Ayatollahi 2014]
Fig. 42: Test set-up for CCNBD test [RML 2016]
Fig. 43: Test set-up for SCB test [Kataoka & Obara 2015]

Overview about rock mechanical lab testing – part I mechanical tests
Only for private and internal use! Updated: 1 October 2018
page 37 of 46
3.13.2 KII fracture toughness tests
Several test methods have been developed to measure KIIC [e.g. Backers 2004, Back-ers & Stephansson 2012, Chen & Konietzky 2014, 2015, Ulusay 2015). Some common methods used in rock mechanics are illustrated in fig. 44. The Central Cracked Notch Brazilian Disc (CCNBD) test is quite interesting, because easy to perform using the stand-ard equipment for Brazilian tests. Also, the same test arrangement can be used to deter-mine both, Mode-I and Model-II fracture toughness (Chen & Konietzky 2014, 2015).
Fig. 44: Mode-II fracture toughness methods: A: antisymmetric four point bending, B: antisymmetric four
point bending cube, C: punch through shear, D: compression shear cube, E: short beam com-
pression, F: centrally cracked Brazilian disc, G: triaxial compression, H: three point bending semi
disc [Backers 2004]
4 Acoustic emission monitoring
Crack development and fracture propagation are connected with radiation of seismic en-ergy (seismic waves). Therefore, acoustic sensors can be used to monitor damage pro-cesses. Typical AE sensors have the following characteristics:
▪ frequency range between 103 Hz to 106 Hz ▪ velocity proportional registration (sometimes also acceleration proportional) ▪ sensors based on piezo-ceramic material ▪ sensor size: a few mm to a few cm
Sensors are either directly connected to the sample or fixed at the loading frame or load-ing plates. Monitoring can be performed in quite different ways, but in principal all applied
Overview about rock mechanical lab testing – part I mechanical tests
Only for private and internal use! Updated: 1 October 2018
page 38 of 46
techniques including data processing and evaluation are similar to earthquake monitor-ing. With one or just a very few sensors only event counting including some relative mag-nitude evaluation can be performed. If a complete network is installed, localization can be performed and seismic source parameters can be determined, e.g., seismic moment, magnitude, fault plane solution, stress drop, source dislocation and source dimensions. Localization can be performed with different techniques using first arrivals of P- and S-waves. Sophisticated AE analysis is described by Stanchits et al. (2011, 2014). Typical AE systems consists of the following elements:
▪ Sensors
▪ Pre-amplifier
▪ Transient recorder
▪ Computer with software (on-line data evaluation and post processing)
To perform localization and seismic source parameter determination a roughly spherical network of at least 6 to 10 sensors is necessary. Also, noise level should be as low as possible, because only events above the noise level can be detected.
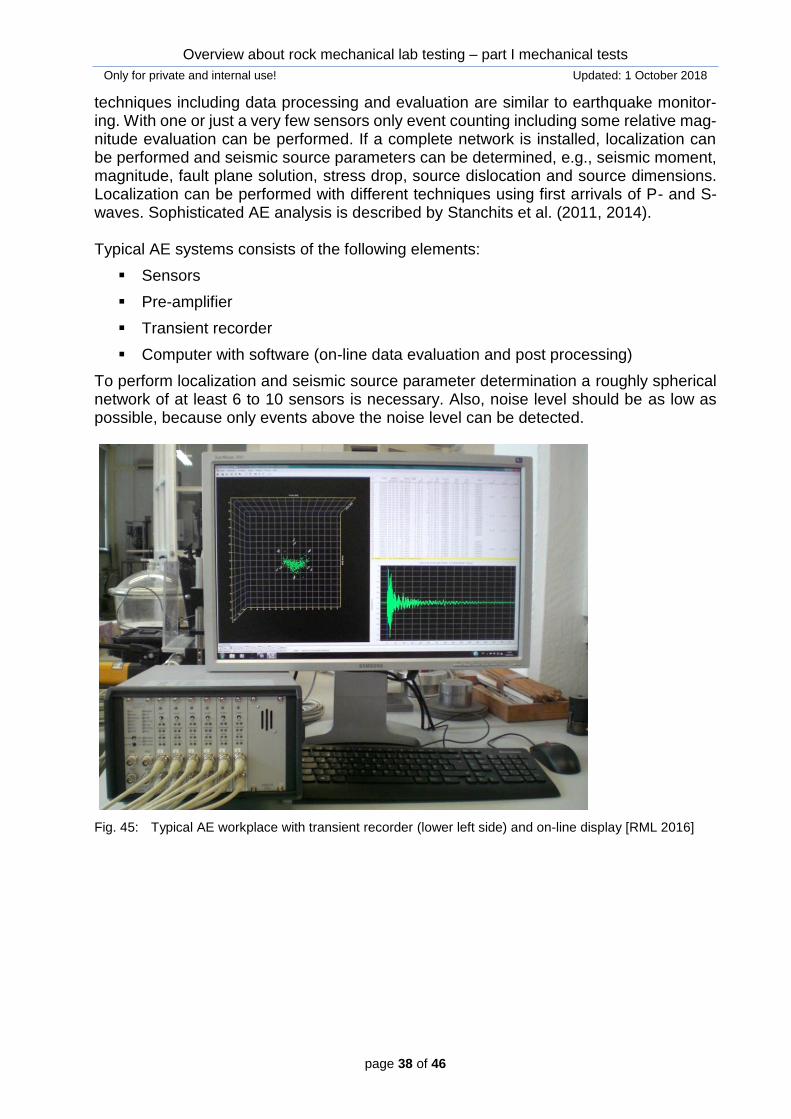
Fig. 45: Typical AE workplace with transient recorder (lower left side) and on-line display [RML 2016]

Overview about rock mechanical lab testing – part I mechanical tests
Only for private and internal use! Updated: 1 October 2018
page 39 of 46
Fig. 46: AE localization at different stress levels (percentage of failure stress) for uniaxial loading [Liu
2015].
Fig. 47: Fracture toughness test with AE monitoring und localization [RML 2016]

Overview about rock mechanical lab testing – part I mechanical tests
Only for private and internal use! Updated: 1 October 2018
page 40 of 46
5 Further dynamic testing methods
Several rock mechanical applications or processes demand the consideration of dynamic parameters, like earthquake engineering, blasting, explosions, rock bursts, drilling, impact and collision problems etc. Dynamic rock properties deviate significantly from static ones as exemplary demonstrated in fig. 48. Dynamic rock parameters have to be always given together with the loading rate used during testing, because they are strongly depending on the loading rate. Most popular dynamic testing methods are [Xia & Yao 2015, Zhou et al. 2012]:
▪ Split Hopkinson pressure bar (SHPB) test
▪ Dynamic notched semi-circular bend (NSCB) test
▪ Dynamic Brazilian test
▪ Dynamic compression test
Main dynamic rock parameters are:
▪ Dynamic compressive strength
▪ Dynamic tensile strength
▪ Dynamic punch shear strength
▪ Dynamic bending strength
▪ Dynamic fracture toughness
▪ Dynamic Young’s modulus
▪ Dynamic Poisson’s ratio
Many of the dynamic tests are performed in the same way as the corresponding static tests are done, but on much higher loading rate. However, the very popular Split Hopkin-son pressure bar test requires a special experimental set-up as exemplary shown in fig 49. SHPB consists of three interacting bars: a striker bar, an incident bar and a trans-mitted bar. Via a special gun the striker bar is accelerated. The impact of the striker bar on the free surface of the incident bar induces longitudinal compressive waves in two directions. The left propagation wave is fully released at the striker bar and forms the trailing edge of the incident compressive pulse. Reaching the incident bar – sample inter-face, part of the wave is reflected and the remainder passes through the specimen. Strain gauges are used to measure the stress wave pulse. The objective of SHPB tests is to determine the dynamic stress strain curves and to deduce dynamic strength and stiffness of the material. Fig. 50 shows the set-up of special SHPB device, which allows to test samples under confining pressure.

Overview about rock mechanical lab testing – part I mechanical tests
Only for private and internal use! Updated: 1 October 2018
page 41 of 46
Fig. 48: Tensile (left) and punch shear strength (right) for sandstones as a function of loading rate [Xia &
Yao 2015]
Fig. 49: Principal sketch of Split Hopkison pressure bar device [Xia et al. 2015]
Fig. 50: Advanced Split Hopkinson pressure bar device with sample under confining pressure [Li et al.
2017]
Overview about rock mechanical lab testing – part I mechanical tests
Only for private and internal use! Updated: 1 October 2018
page 42 of 46
6 Large-scale testing (physical models)
The aim of large-scale experiments is to investigate scale effects, bigger rock blocks or the behaviour of more complex systems. Large scale experiments consist of large loading frames. Two types of tests can be distinguished:
▪ Physical models based on up-scaling of complex systems under consideration of the laws of physical equivalence (e.g. mining systems or dam constructions)
▪ Test of geotechnical elements in real size (e.g. railroad systems, support ele-ments or huge rock blocks)
In most cases these tests are unique and need special designed measuring and loading arrangements. Large scale testing is very time and cost consuming and therefore often replaced or at least supported by numerical simulations.
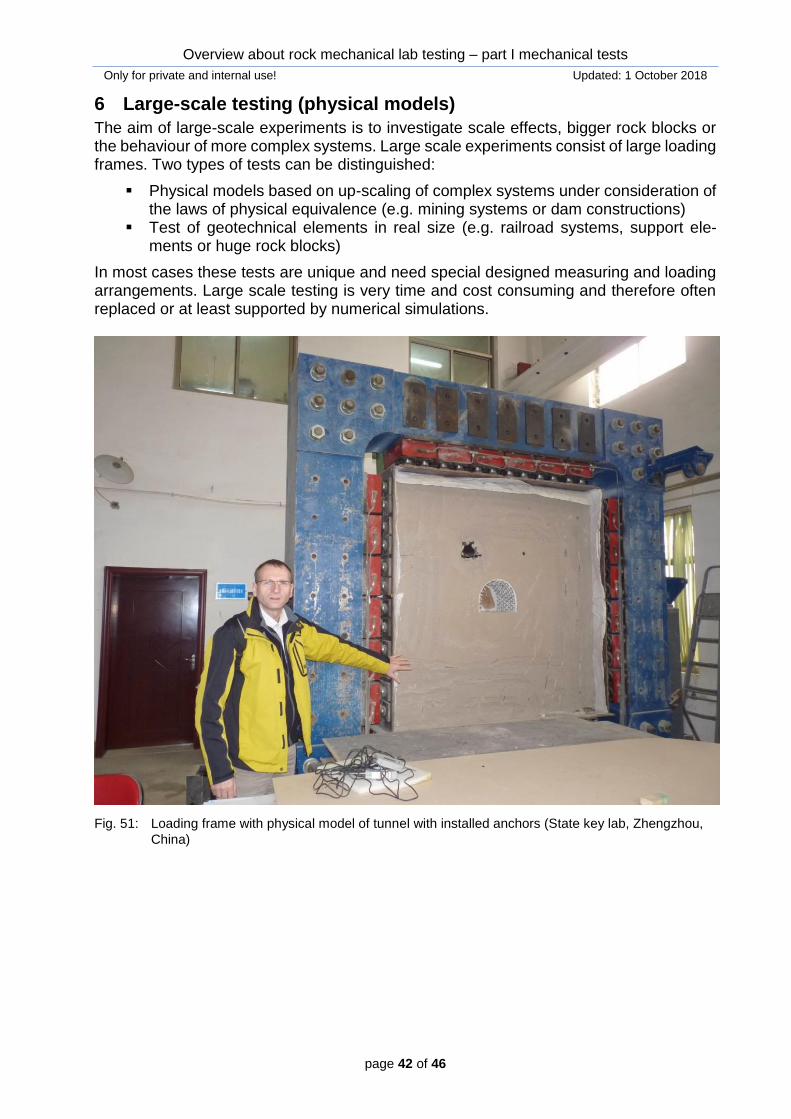
Fig. 51: Loading frame with physical model of tunnel with installed anchors (State key lab, Zhengzhou,
China)

Overview about rock mechanical lab testing – part I mechanical tests
Only for private and internal use! Updated: 1 October 2018
page 43 of 46
Fig. 52: Static and dynamic loading rig for testing of railway foundation in real size (CSU, Changsha,
China)
Fig. 53: True triaxial cell for large samples up to 3 x 3 x 3.5 m (State key lab, Zhengzhou, China)

Overview about rock mechanical lab testing – part I mechanical tests
Only for private and internal use! Updated: 1 October 2018
page 44 of 46
7 Literature
More detailed information and technical parameters of rock mechanical testing equipment can be found under the following link:
https://tu-freiberg.de/fakult3/gt/feme/labor.en.html
Aliha, M.R.M.; Ayatollahi, MN.R. (2014): Rock fracture toughness study using cracked
chevron notched Brazilian disc specimen under pure modes I and II loading – A stochastical approach, Theoretical and Applied Fracture Mechanics, 69: 17-25.
Backers, T. (2004): Fracture toughness determination and micromechanics of rock under mode I and mode II loading, PhD thesis, University Potsdam, Germany
Backers, T.; Stephansson, O. (2012): ISRM suggested method for the determination of model II fracture toughness, Rock Mech Rock Eng, 45: 1011-1022
Baumgarten, L.; Konietzky, H. (2012): Stress-strain, strength and failure behavior of Postaer Sandstone in tension and compression tests – laboratory investigations and numerical modelling with PFC3D, Veröffentl. Institut f. Geotechnik (ed. H. Ko-nietzky), TU Bergakademie Freiberg, Heft 2012-1, pp. 41-61
Baumgarten, L. (2015): Gesteinsmechanische Versuche und petrophysikalische Unter-suchungen – Laborergebnisse und numerische Untersuchungen, PhD-Thesis, Institut für Geotechnik, TU Bergakademie Freiberg
Chen, W., Konietzky, H. (2014): Simulation of heterogeneity, creep, damage and life time for loaded brittle rocks, Tectonophysics, 633: 164-175
Chen, W., Konietzky, H. (2015): Numerical simulation of time-independent and time-de-pendent fracturing in sandstone, Engineering Geology, 193: 118-131
Dinh, Q.D. (2011): Brazilian test on anisotropic rocks – laboratory experiment, numerical simulation and interpretation, Veröffentl. Institut Geotechnik (ed. H. Konietzky), TU Bergakademie Freiberg, Heft 2011-2
Dinh, Q.D; Konietzky, H.; Herbst, M., (2013): Brazilian Tensile Strength Tests on some Anisotropic Rocks, Int. J. Rock Mech. Mining Sci., 58: 1-7.
Dinh, Q.D.; Konietzky, H. (2014): Numerical simulations and interpretations of Brazilian tensile tests on transversely isotropic rocks, Int. J. Rock Mech. Min. Sci., 71: 53-63
Germaine, J.T & Germaine, A.V. (2009): Geotechnical laboratory measurements for en-gineers, John Wiley & Sons, 368 p.
Kataoka, M. & Obara, Y. (2015): Anisotropy in fracture toughness of sedimentary and crystalline rocks estimated by semi-circular bend test, Proc. of ISRM Regional Symposium – EUROCK 2015, Salzburg, Austria
Konietzky, H.; Frühwirt, T.; Luge, H., (2012): A new large dynamic rockmechanical direct shear box device, Rock Mech. Rock Eng., 45(3): 427-432.

Overview about rock mechanical lab testing – part I mechanical tests
Only for private and internal use! Updated: 1 October 2018
page 45 of 46
Kuruppu, M.D., Obara, Y., Ayatollahi, M.R., Chong, K.P. & Funatsu, T. (2014): ISRM-suggested method for determining the mode I static fracture toughness using semi-circular bend specimen, Rock Mech. Rock Eng., 47: 267-274
Kwasniewski, M. (2012): Recent advances in studies on the strength of rocks under gen-eral triaxial compression conditions, Veröffentl. Institut Geotechnik (ed. H. Ko-nietzky), TU Bergakademie Freiberg, Heft 2012-2, p. 77-104
Li, X., Gong, F., Tao, M., Dong, L., Du, K., Ma, C., Zhou, Z. & Yin, T. (2017): Failure mechanism and coupled static-dynamic loading theory in deep hard rock mining: a review, J. Rock Mech. Geotechn. Eng., 9(4): 767-782
Liu, J., Li, Y.-h., Xu, S.-d., Xu, S., Jin, C.-h., Liu, Z.-s. (2015): Moment tensor analysis of acoustic emission for cracking mechanisms in rock with a pre-cut circular hole under uniaxial compression, Eng. Fracture Mechanics, 135: 206-218
Mittelbach, L.; Konietzky, H.; Baumgarten, L., (2012): Ultrasonic wave measurements during triaxial tests - laboratory tests and numerical simulations, BAW-Mittei-lungen, 95: 71-78.
Nguyen, V.M. (2013): Static and dynamic behavior of joints in schistose rock: Lab testing and numerical simulation, Veröffentl. Institut Geotechnik (ed. H. Konietzky), TU Bergakademie Freiberg, Heft 2013-3
Nguyen, V.M; Konietzky, H.; Frühwirt, T., (2014): New Methodology to Characterize Shear Behavior of Joints by Combination of Direct Shear Box Testing and Nu-merical Simulations. Geotech Geol Eng., 32(4): 829-846
Pinto da Cunha, A., (1990): Scale Effects in Rock Masses. International Workshop, 7. & 8.6.1990, Leon, Norway, Balkema
Ulusay, R. & Hudson, J.A., (2007): The complete ISRM suggested methods for rock char-acterization, testing and monitoring: 1974-2006. Suggested Methods Prepared by the Commission on Testing Methods.
Ulusay, R. (2015): The ISRM suggested methods for rock characterization, testing and monitoring: 2007-2014, Springer International Publishing, 293 p.
Tan, X.; Konietzky, H.; Frühwirt, T., (2014): Laboratory observation and numerical simu-lation of permeability evolution during progressive failure of brittle rocks., Int. J. Rock Mech. Mining Sci., 68: 167-176.
Perras, M.A. & Diederichs, M.S. (2014): A review of the tensile strength of rock: concepts and testing, Geotechnical and Geological Engineering, 32(2): 525-546
Plinninger, R.; Käsling, H.; Thuro K.; Spaun, B. (2003): Testing conditions and geome-chanical properties influencing the Cherchar abrasiveness index (CAI), Int. J. Rock Mech. Mining Sci., 40(2): 259-263.
RML (2015): Rock Mechanical Laboratory, Chair for Rock Mechanics, Geotechnical In-stitute, TU Bergakademie Freiberg, Germany

Overview about rock mechanical lab testing – part I mechanical tests
Only for private and internal use! Updated: 1 October 2018
page 46 of 46
Stanchits, S., Mayr, S., Shapiro, S., Dresen, G., (2011): Fracturing of porous rock induced by fluid injection, Tectonophysics, 503(1-2): 129-145
Stanchits, S., Surdi, A., Gathogo, P., Edelman, E., Suarez-Rivera, R., (2014): Onset of hydraulic fracture initiation monitored by acoustic emission and volumetric defor-mation measurements, Rock Mech. Rock Eng., 47(5): 1521-1532
Thuro, K. (2008): The new suggested Method No. 5 of the AK 3.3. – Point Load Index Tests on Rocks Samples, Veröffentl. Institut Geotechnik (ed. H. Konietzky), TU Bergakademie Freiberg, Heft 2008-3, p. 23-36
Vervoort, A.; K.-B., Min; Konietzky, H.; Cho, J.-W; Debecker, B.; Dinh, Q. D.; Frühwirt, T.; Tavallali, A., (2014): Failure of transverselly isotropic rock under Brazilian test conditions., Int. J. Rock Mech. Mining Sci., 70: 343-352
Wong, L.N.Y., Li, Z., Kang, H.M., the, C.I., (2017): Dynamic loading of Carrara marble in a heated state, Rock Mech. Rock Eng., 50(6): 1487-1505
Xia, K.; Yao, W (2015): Dynamic rock test using split Hopkinson (Kolsky) bar system – A review, Journal of Rock Mech. Geotechn. Eng., 7: 27-59
Zhou, Y.X., Xia, K., Li, X., Dai, F. (2012): Suggested methods for determination the dy-namic strength parameters and mode-I fracture toughness of rock materials, Int. J. Rock Mech. Min. Sci., 49: 105-112