overview and latest topics related to energy systems … · overview and latest topics related to...
TRANSCRIPT

Overview and Latest Topics Related to Energy Systems in the U.S.
James Reilly, Principal ConsultantReilly Associates
SMART COMMUNITY SUMMIT
Tokyo
June 8, 2017

Power and Energy Trends
Issues and Solutions
Standards
Research + Development
THEMES
2

POWER AND ENERGY TRENDS
3

0
200
400
600
800
1,000
1,200
1,400
1,600
1,800
19
90
20
16
20
40
19
90
20
16
20
40
19
90
20
16
20
40
19
90
20
16
20
40
Electricity use by sector (billion kilowatt hours)
direct use
electricity sales
residential I commercial I Industrial I transportation -2
-1
0
1
2
3
4
5
6
1980 2000 2020 2040
Electricity use growth rate percent growth (three-year rolling average)
2016history projections
Source: EIA, Annual Energy Outlook 2017
Electricity use continues to increase, but the rate of growth remains lower than historic averages
ELECTRICITY DEMAND
4

Natural gas resource availability affects prices and plays a critical role in determining the mix of coal, natural gas, and renewable generation
FUEL MIX
5

Lower capital costs and tax credits boost near-term wind and sustain solar additions; coal-fired unit retirements are driven by low natural gas prices.
-30
-20
-10
0
10
20
30
40
2005 2010 2015 2020 2025 2030 2035 2040
2016history projections
solarwindoil and gasnuclearothercoal
additions
retirements
Annual electricity generating capacity additions and retirements (gigawatts)
Source: EIA, Annual Energy Outlook 2017
GENERATION FLEET
6

Natural gas production is driven by continued development of shale gas and tight oil plays
Source: EIA, Annual Energy Outlook 2017
NATURAL GAS PRODUCTION
7

Nuclear electricity generating capacity(gigawatts)
2016history projections
Reference
-4
-3
-2
-1
0
1
2
3
2015 2020 2025 2030 2035 2040
Year-over-year nuclear capacity changes (gigawatts)
additions
retirements
assumed upratesnew reactors
actual/announcedretirementsprojectedretirements
Reference
Source: EIA, Annual Energy Outlook 2017
Assumptions about license renewals in 2017 increase nuclear retirements, lead to net nuclear capacity decreases
NUCLEAR POWER
8

ISSUES AND SOLUTIONS
9

GENERATION MIX DRIVER TIMELINE
10
1994 – Energy Policy Act – Production Tax Credit (PTC)
2009 – American Recovery and Reinvestment Act (ARRA)
2013 – Hydraulic Fracturing on a commercial scale
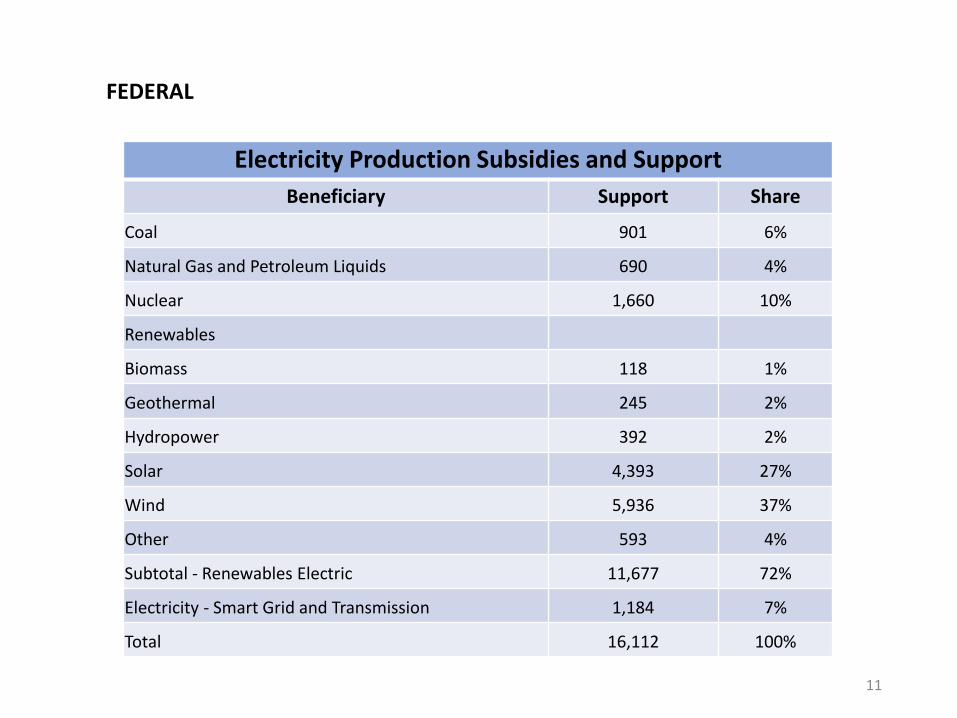
Electricity Production Subsidies and Support
Beneficiary Support Share
Coal 901 6%
Natural Gas and Petroleum Liquids 690 4%
Nuclear 1,660 10%
Renewables
Biomass 118 1%
Geothermal 245 2%
Hydropower 392 2%
Solar 4,393 27%
Wind 5,936 37%
Other 593 4%
Subtotal - Renewables Electric 11,677 72%
Electricity - Smart Grid and Transmission 1,184 7%
Total 16,112 100%
FEDERAL
11

Renewable Portfolio StandardsMandatory purchase of RES by utilities
Net MeteringCompensation at retail rates
Regulatory FrameworkDistribution Utilities
STATES – DISTRIBUTION LEVEL
12

WA: 15% x 2020*
OR: 50%x 2040* (large utilities)
CA: 50%
x 2030
MT: 15% x 2015
NV: 25% x
2025* UT: 20% x
2025*†
AZ: 15% x
2025*
ND: 10% x 2015
NM: 20%x 2020
(IOUs)
HI: 100% x 2045
CO: 30% by 2020
(IOUs) *†
OK: 15% x
2015
MN:26.5%
x 2025 (IOUs)31.5% x 2020 (Xcel)
MI: 15% x
2021*†
WI: 10%
2015
MO:15% x
2021
IA: 105 MWIN:
10% x
2025†IL: 25%
x 2026
OH: 12.5%
x 2026
NC: 12.5% x 2021 (IOUs)
VA: 15%
x 2025†KS: 20% x 2020
ME: 40% x 2017
29 States + Washington DC + 3 territories (8 states and 1 territories have renewable portfolio goals)
Renewable portfolio standard
Renewable portfolio goal Includes non-renewable alternative resources* Extra credit for solar or customer-sited renewables
†
U.S. Territories
DC
TX: 5,880 MW x 2015*
SD: 10% x 2015
SC: 2% 2021
NMI: 20% x 2016
PR: 20% x 2035
Guam: 25% x 2035
USVI: 30% x 2025
NH: 24.8 x 2025
VT: 75% x 2032
MA: 15% x 2020(new resources)
6.03% x 2016 (existing resources)
RI: 38.5% x 2035
CT: 27% x 2020
NY:50% x 2030
PA: 18% x 2021†
NJ: 20.38% RE x 2020 + 4.1% solar by 2027
DE: 25% x 2026*
MD: 25% x 2020
DC: 50% x 2032
RENEWABLE PORTFOLIO STANDARDS
Source: DSIRE, February 2017

State-developed mandatory rules for certain utilities (39 states + DC+ 3 territories)
No statewide mandatory rules, but some utilities allow net metering (2 states)
Source: DSIRE, April 2017
KEYU.S. Territories
39 States + Washington DC + 4 territories
DC
Statewide distributed generation compensation rules other than net metering (6 states + 1 territory)GU
AS PR
VI
NET METERING
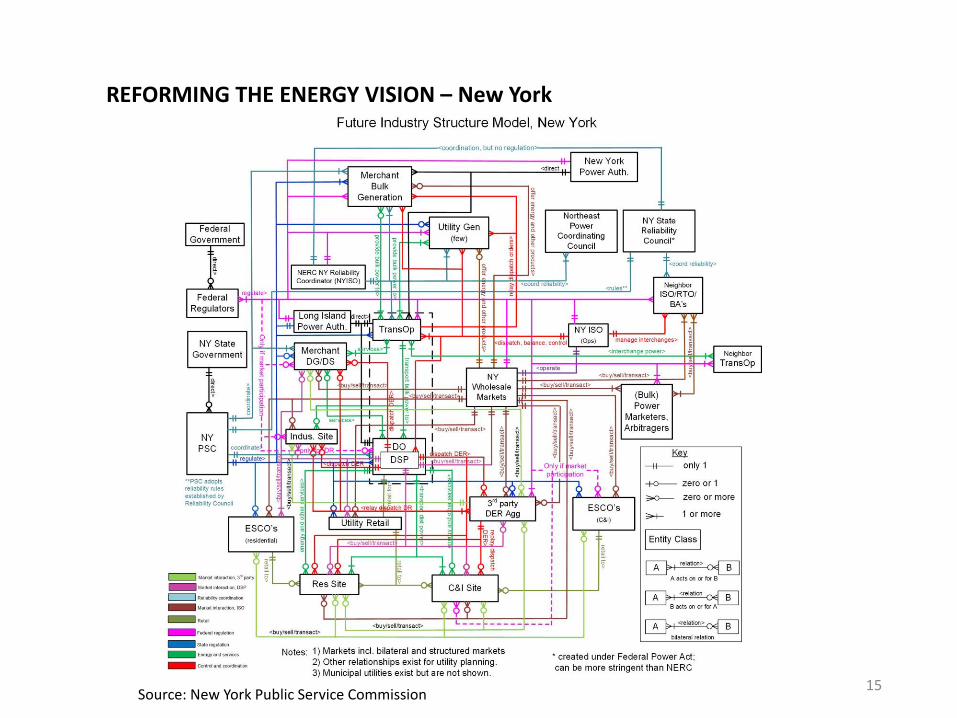
REFORMING THE ENERGY VISION – New York
Source: New York Public Service Commission15

▪ Avoided D – avoided demand,includes demand reduction value (DRV) & locational system relief value (LSRV)
▪ E – environmental benefit, rate fixed at time of interconnections
▪ Capacity (ICAP) – mirrors capacity currently provided under NEM, changes over time
▪ Energy (LBMP) – current wholesale energy price, changes hourly
▪ MTC – market transition credit for mass market portion of Community Distributed Generation (CDG) projects
Base Retail Rate (NEM)
Value StackValue Stack + MTC
Ce
nts
/kW
h (
illu
stra
tive
)
VALUE OF DISTRIBUTED ENERGY RESOURCES
Volumetric vs Monetary Metering
Volumetric metering tracks net kWh delivered to grid▪ NEM – production exported to grid; credited on the customer’s utility bill with a kWh reduction on a 1:1 ratio
Monetary metering converts energy production into dollars▪ customers see a dollar credit on their energy bill (rather than a kWh credit)▪ Solar energy consumed onsite is not delivered to the grid and is not converted to a monetary credit
For both metering methods, PV kWh consumed on-site is a kWh not purchased from the utility. 16

BROOKLYN QUEENS DEMAND MANAGEMENT PROGRAM (BQDM)
Investment deferral for 52 MW supply shortfall at two substations, feeders and switching stations - $1.2 billion
Alternative solution:▪ Customer-side
▪ energy efficiency + demand response - $150 million
▪ Utility-side ▪ solar, fuel cells, storage - $50
millionService Territory – 310,000 customers
Source: Consolidated Edison
17

CALIFORNIA
Renewable Portfolio Standard
50% by 2030
Distribution Resource Planning
Policies, procedures, and rules to guide California investor-owned electric utilities (IOUs) in developing their Distribution Resources Plan. Evaluate IOUs existing and future electric distribution infrastructure and planning procedures to incorporate Distributed Energy Resources (DERs) into the planning and operations of their electric distribution systems.
Microgrids: Demonstration project where the utility serves as a distribution system operator of a microgrid
Storage Mandate
1.325 GW by 2020
Community Choice Aggregation
Local government agencies that purchase and may develop power on behalf of residents, businesses, and municipal facilities within a local or sub-regional area. Local control over power mix and rates.
18Source: CPUC

WHOLESALE MARKETS – NEGATIVE PRICES
19

STANDARDS
20

IEEE P1547-REV STANDARD FOR INTERCONNECTION
21
Source: P1547™/D6.7.2 1 Draft Standard for Interconnection and Interoperability of Distributed Energy Resources with Associated Electric Power Systems Interfaces
DER Fault Response to Abnormal Frequencies and Frequency Ride-through Requirements

IEEE P2030.7 STANDARD FOR THE SPECIFICATION OF MICROGRID CONTROLLERS
22
Grid Substation
Transformer
Breaker
Dispatchable Generation
Sensitive and critical loads
CHP
Battery storage
Controllable loads
Load
Microgrid controlsystem
Non-dispatchable generation
Load
Solar Wind
Microgrid
Centralized electrical storage
Storage
Load
▪ Dispatch function – optimizes the use of DER assets, ensures operation of the microgrid meets requirements for internal operation and as seen from the point of interconnection to the distribution system; dispatch orders: steady state conditions and transitions.
▪ Transition function – manages transitions: planned and unplanned islanding; reconnection/resynchronization (with black start as required).

Cyber Security – overarching priority
▪ R&D programs across agencies and departments – DHS, FBI, DOD, DOE, NIST
▪ Framework for Improving Critical Infrastructure Cybersecurity, NIST (update January 2017)
Critical Infrastructure Protection Standards – NERCFERC approved updates, 2015 (effective date for implementation - April 1, 2016)
▪ CIP-003-6 (Security Management Controls)
▪ CIP-004-6 (Personnel and Training),
▪ CIP-006-6 (Physical Security of BES Cyber Systems)
▪ CIP-007-6 (Systems Security Management)
▪ CIP-009-6 (Recovery Plans for BES Cyber Systems)
▪ CIP-010-2 (Configuration Change Management and Vulnerability Assessments)
▪ CIP-011-2 (Information Protection)
GridEx – national cyber exercise planned by NERC
▪ Operational aspects, rather than IT applications for cybersecurity
▪ Bi-annual – GridEx IV, November 2017
▪ Participants: ISOs, Utilities, Federal, State and Local agencies– 3,500 individuals
CYBER SECURITY
23

RESEARCH AND DEVELOPMENT
24

Electricity Delivery and Energy Reliability (OE)
FY2017 $208 million
FY2018 $123 million
Energy Efficiency and Renewable Energy (EERE)
FY2017 $2,473 million
FY2018 $1,275 million
Advanced Research Projects Agency – Energy (ARPA-E)
FY 2017 $285 million
FY 2018 $173 million
DEPARTMENT OF ENERGY – FY18 BUDGET
40% reduction
48% reduction
25
39% reduction

DOE "Smart Grid" Program
▪ ARRA (2009 - 2014)$3.5 billion
▪ Smart Grid (FY2018) $10 million
Grid Modernization Initiative (2015 to 2018)
▪ 88 R&D projects
▪ 14 national laboratories
▪ $220 million to GMLC (over three years)
GRID MODERNIZATION
Grid Modernization Lab Consortium (GMLC)
26

CORE ACTIVITIESProject 6: Grid Sensing and Measurement Strategy
PIONEER REGIONAL PARTNERSHIPSProject 15: Grid Frequency Support from Distributed Inverter-Based Resources in Hawaii
CROSSCUTTING ACTIVITIESProject 19: Advanced Sensor Development
PROGRAM SPECIFIC SELECTIONSBUILDING TECHNOLOGIES OFFICEProject 1: Virtual Batteries
FUEL CELLS TECHNOLOGIES OFFICEProject 2: Integrated Systems Modeling of the Interactions between Stationary Hydrogen, Vehicle, and Grid Resources
SOLAR ENERGY TECHNOLOGIES OFFICEProject 12: CyDER: A Cyber Physical Co-simulation Platform for Distributed Energy Resources in Smart Grids
VEHICLE TECHNOLOGIES OFFICEProject 3: Modeling and Control Software to Support V2G Integration
WIND AND WATER POWER TECHNOLOGIES OFFICEProject 4: Providing Ramping Service with Wind to Enhance Power System Operational Flexibility
ADVANCED GRID MODELINGProject 4: Protection and Dynamic Modeling, Simulation, Analysis, and Visualization of Cascading Failures
ADVANCED DISTRIBUTION MANAGEMENT SYSTEMSProject 3: Advanced Distribution Management System Testbed Development
ENERGY SYSTEMS RISK AND PREDICTIVE CAPABILITIESProject 1: Improved Forecasts of Electric Outages from Tropical Cyclones
ENERGY STORAGEProject 2: Collaborative Demo for Secondary Use and Use Case Validation
SMART GRIDProject 2: A Closed-Loop Distribution System Restoration Tool for Natural Disaster Recovery
TRANSMISSION RELIABILITYProject 3: HVDC and Load Modulation for Improved Dynamic Response Using Phasor Measurements
TRANSFORMER RESILIENCE AND ADVANCED COMPONENTSProject 3: High Voltage Testing and Modeling of Transformer, Line Interface Devices, and System Components Under Electromagnetic Pulse, Geomagnetic Disturbance, and Other Abnormal Transients
CYBERSECURITY FOR ENERGY DELIVERY SYSTEMSProject 2: Cybersecurity for Renewables, Distributed Energy Resources, and Smart Inverters
GRID MODERNIZATION PROJECTS – GMLC
27

LOCATIONAL VALUE OF DISTRIBUTED ENERGY RESOURCES
Integration of Distribution System Power Flow Optimization, (Advanced) DER Asset Economic Optimization, Economic and Security Constrained DER Buildouts and Load Projections, Transmission System Power Flow and Optimization, Dispatch / Merit Order Modeling with distribution factors / locational performance assessed across systems.
28
DER Siting and Optimization Tool
Integrated Model Development Project

MICROGRID R&D PROGRAM TIMELINE
The microgrid is a concept for which the controller is the defining and enabling technology. Indeed, the microgrid may be defined as the resources – generation, storage, and loads – within a boundary that are managed by the controller.
The microgrid controller manages the resources within the microgrid’s boundaries, at the point of interconnection with the utility and in interaction with the utility during normal operations, sometimes called “cooperative control”. It is at this level that the microgrid controller achieves its full potential for optimizing the value of distributed energy resources for the grid operations and customers, both those served by the microgrid directly and the utility overall. The microgrid controller is what defines the microgrid’s operational relationship with the distribution utility.
Evolution of microgrids and controllers
Functionality and standards
Demonstration projects for deployment of DER and microgrids
FOA 997 Metrics
+ TestingUse Cases
2013 - 2014 2015 - 20182014 - 2017 2014 - 2017 2017 - 2020
uGrid Controller+ DMS
Simulations
IEEE Standards
Workshops
2011 - 2012
29

ADVANCED DISTRIBUTION MANAGEMENT SYSTEMS
30

INTEGRATED CONTROLS AND OPERATIONS
31