overview of 3q fy2017results full-year projections : nisshin fire & marine insurance co., ......
TRANSCRIPT

February 14, 2018
Tokio Marine Holdings, Inc.
◆Abbreviations used in this materialTMNF : Tokio Marine & Nichido Fire Insurance Co., Ltd.
NF : Nisshin Fire & Marine Insurance Co., Ltd.TMNL : Tokio Marine & Nichido Life Insurance Co., Ltd.
TMHCC : Tokio Marine HCC
Overview of 3Q FY2017 Resultsand
Full-Year Projections

Copyright (c) 2018 Tokio Marine Holdings, Inc. 1
Table of Contents
Consolidated Results– Overview ・・・・・・・・・・・・・・・・・・・・・・・・・・・・・・・・・・・・・・・・ 3– Ordinary Profit ・・・・・・・・・・・・・・・・・・・・・・・・・・・・・・・・・・・・・・・・ 4
Adjusted Net Income– Adjusted Net Income ・・・・・・・・・・・・・・・・・・・・・・・・・・・・・・・・・・・・・・・・ 5
Domestic Non-Life– TMNF Financial Results ・・・・・・・・・・・・・・・・・・・・・・・・・・・・・・・・・・・・・・・・ 6– TMNF Combined Ratio ・・・ ・・・・・・・・・・・・・・・・・・・・・・・・・・・・・・・・・・・・・ 7– TMNF NPW & Loss Ratio ・・・ ・・・・・・・・・・・・・・・・・・・・・・・・・・・・・・・・・・・・・ 8– TMNF Asset Management ・・・・・・・・・・・・・・・・・・・・・・・・・・・・・・・・・・・・・・・・ 9– NF Financial Results ・・・・・・・・・・・・・・・・・・・・・・・・・・・・・・・・・・・・・・・・10
Domestic Life– TMNL Financial Results ・・・・・・・・・・・・・・・・・・・・・・・・・・・・・・・・・・・・・・・・11
International Insurance Business– Net Premiums Written ・・・・・・・・・・・・・・・・・・・・・・・・・・・・・・・・・・・・・・・・12– Business Unit Profits ・・・・・・・・・・・・・・・・・・・・・・・・・・・・・・・・・・・・・・・・13– North America (Breakdown) ・・・・・・・・・・・・・・・・・・・・・・・・・・・・・・・・・・・・・・・・14
Consolidated Projections– Consolidated Projections ・・・・・・・・・・・・・・・・・・・・・・・・・・・・・・・・・・・・・・・・16
■ I. 3Q FY2017 Results
■ II. FY2017 Revised Projections
Copyright (c) 2018 Tokio Marine Holdings, Inc. 2
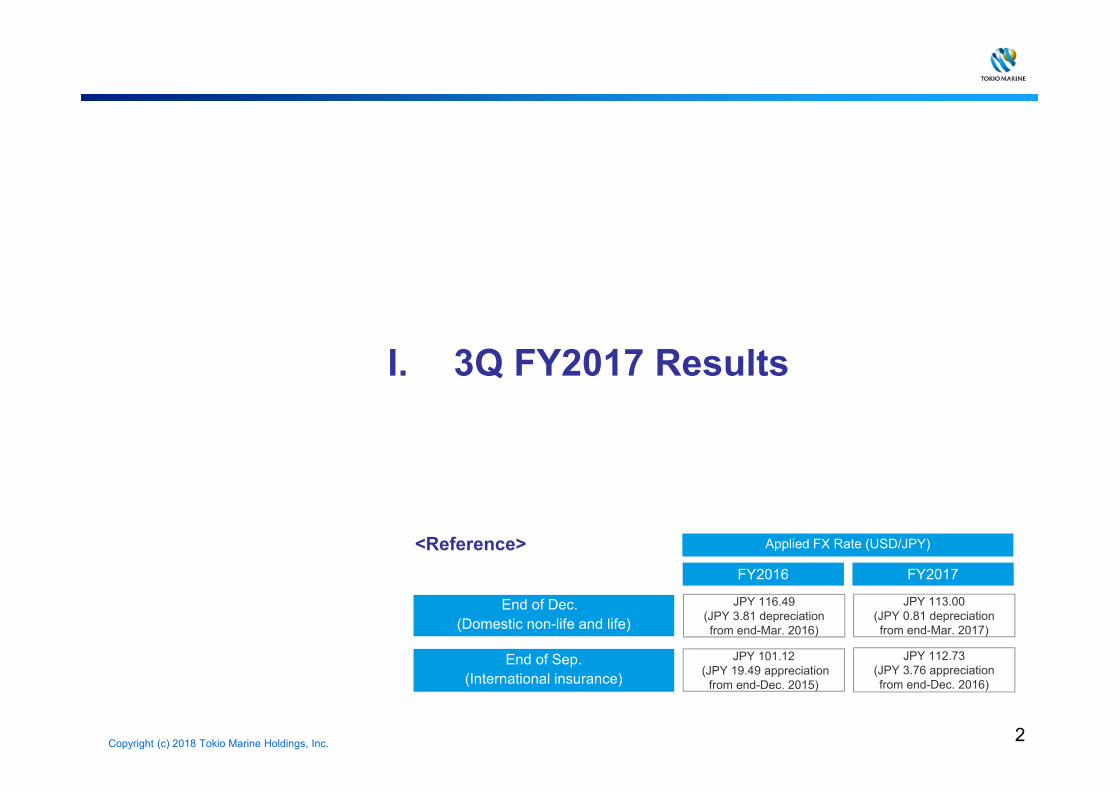
I. 3Q FY2017 Results
JPY 112.73 (JPY 3.76 appreciation from end-Dec. 2016)
FY2016 FY2017
Applied FX Rate (USD/JPY)
JPY 116.49(JPY 3.81 depreciation from end-Mar. 2016)
<Reference>
JPY 101.12(JPY 19.49 appreciation
from end-Dec. 2015)
End of Sep.(International insurance)
End of Dec. (Domestic non-life and life)
JPY 113.00 (JPY 0.81 depreciation from end-Mar. 2017)

Copyright (c) 2018 Tokio Marine Holdings, Inc.
(billions of yen, except for %)
■Ordinary income (TMHD Consolidated) 3,812.4 4,094.1 281.6 + 7.4%
Net premiums written (TMHD Consolidated) 2,538.9 2,715.7 176.8 + 7.0%Life insurance premiums (TMHD Consolidated) 633.1 676.4 43.3 + 6.8%
■Ordinary profit (TMHD Consolidated) 315.7 237.2 - 78.5 - 24.9%
Tokio Marine & Nichido 244.8 251.0 6.1 + 2.5%Nisshin Fire 5.5 3.7 - 1.7 - 31.3%Tokio Marine & Nichido Life 17.4 17.5 0.0 + 0.3%Overseas subsidiaries 118.7 89.2 - 29.4 - 24.8%Financial and general 4.5 5.0 0.4 + 10.7%
Others (Consolidation adjustments, etc.) - 75.3 - 129.3 - 53.9
■Net income attributable to owners of the parent 228.1 159.3 - 68.8 - 30.2%
Tokio Marine & Nichido 193.0 201.5 8.5 + 4.4%Nisshin Fire 3.8 2.6 - 1.1 - 29.7%Tokio Marine & Nichido Life 11.8 11.4 - 0.3 - 3.2%Overseas subsidiaries 92.5 64.0 - 28.4 - 30.8%Financial and general 2.9 3.4 0.5 + 18.1%
Others (Consolidation adjustments, etc.) - 76.0 - 123.9 - 47.8
【KPI for the Group Total】■ Adjusted net income 319.9 238.4 -81.5 - 25.5%
YoYFY20163Q
Results
FY20173Q
Results%Change
3
Ordinary profit (billions of yen)
Net premiums written: Increased due to business expansion at domestic non-life and overseas subsidiaries and the depreciation of the yen at overseas, etc.
Life insurance premiums: Increased due to an increase in in-force policies at TMNL and the depreciation of the yen at overseas, etc. Ordinary profit and net income attributable to owners of the parent decreased mainly due to an increase in net incurred losses relating to
natural catastrophes in domestic and overseas and the impact of large losses at TMNF, etc. Adjusted net income, which excludes the effect of provision for catastrophe loss reserves and amortization of goodwill and other intangible
fixed assets, etc., decreased as well due to the factors above
315.7
237.2
Net income attributable to owners of the parent (billions of yen)
228.1
159.3
-78.5
(-24.9%)
Consolidated Results Overview (1)3Q FY2017 Results - Consolidated Results - 1
Consolidated
DomesticNon-Life
DomesticLife
InternationalConsolidated Results Overview (1)Consolidated
DomesticNon-Life
DomesticLife
International
-68.8
(-30.2%)

Copyright (c) 2018 Tokio Marine Holdings, Inc. 4
Ordinary Profit (billions of yen)
— Domestic Non-LifeIncreased mainly due to the following factors: Increase in net incurred losses relating to natural
catastrophes Increase in amount taken down from catastrophe loss
reserves Impact of large losses at TMNF, etc.
Increase in dividends income from overseassubsidiaries at TMNF
– Overseas SubsidiariesDecreased mainly due to the following factors: Large natural catastrophe losses relating to hurricanes in
North America, etc.
Deterioration of foreign exchange gains/losses
Impact of the depreciation of the yen
– Consolidation Adjustments, etc. Negative adjustment increased due to an increase in
dividends income from overseas subsidiaries at TMNF
315.7
-43.5
(a)Impact ofnatural
catastrophes
-24.4(b)
Impact of catastrophe
loss reserves
Domestic Non-Life
8.8
Underwriting profit (excl. (a)(b)) and
others
Net investment income and other
63.6
0.0
-29.4
0.4
-53.9
237.2
-78.5
(-24.9%)
4.4
Consolidated Results Overview (2)3Q FY2017 Results - Consolidated Results - 2
Consolidated
DomesticNon-Life
DomesticLife
International
FY163Q
Results
FY173Q
Results
DL Ovs F&G Adjetc. Total
FY16 17.4 118.7 4.5 - 75.3 315.7
FY17 17.5 89.2 5.0 - 129.3 237.2
250.3
254.8
DNL
: Total of the followings:
On this page, figures of each business domain are calculated as follows, and they differ from segment information in the Summary Report.
DNL (Domestic Non-life)DL (Domestic life)Ovs (Overseas subsidiaries)F&G (Financial & General)Adj, etc (Consolidation adjustments, etc.)
: Total of TMNF and NF: TMNL
i) purchase method adjustmentsii) amortization of goodwill and negative goodwill iii) others (elimination, etc.)

Copyright (c) 2018 Tokio Marine Holdings, Inc.
FY20163Q
Results
FY20173Q
Results
YoYChange
228.1 159.3 -68.8
Provision for catastrophe loss reserves*2 +27.2 +20.8 -6.4
Provision for contingency reserves*2 +2.5 +2.6 0.1
Provision for price fluctuation reserves*2 +3.1 +3.7 0.6
Gains or losses on sales or valuation of ALM*3 bondsand interest rate swaps
+1.3 -3.2 -4.5
Gains or losses on sales or valuation of fixed assetsand business investment equities -4.2 +0.9 5.1
Amortization of goodwill and other intangible fixedassets +63.6 +55.4 -8.2
Other extraordinary gains/losses,valuation allowances, etc. -1.9 -1.2 0.7
319.9 238.4 -81.5
Net income attributable to owners of the parent(consolidated)
Adjusted Net Income
55
Adjusted Net Income for 3Q FY2017 decreased by ¥81.5B YoY to ¥238.4B
Note: Factors positive to profit are showed with “plus signs”
• Reconciliation*1
Definition of Adjusted Net Income
AdjustedNet Income
Net income(consolidated)
Provision forcatastrophe loss
reserves*2
Provision forcontingency
reserves*2
Provision forprice fluctuation
reserves*2
Gains or losses on sales orvaluation of ALM*3 bondsand interest rate swaps
= + + +
-
Amortization of goodwill and
other intangible fixed assets
Gains or losses on sales or valuation of fixed assets and business investment
equities
Other extraordinarygains/losses,
valuation allowances, etc.
-
+ -
Consolidated
DomesticNon-Life
DomesticLife
International
(billions of yen)
3Q FY2017 Results - Adjusted Net Income
Adjusted Net Income (Group Total)
— Major changes in reconciliation YoY
Provision for catastrophe loss reserves Decrease in net provision for catastrophe loss
reserves due to an increase in W/P loss ratio at TMNF (also decreases reconciling amount)
Gains or losses on sales or valuation of ALM bonds and interest rate swaps Increase in gains on sales of foreign bonds due to a
decrease in interest rates (decrease in reconciling amount)
Gains or losses on sales or valuation of fixed assets and business investment equities Reversal effect of gains on sales of fixed assets in
FY2016 at TMNF (increase in reconciling amount)
Amortization of goodwill and other intangible fixed assets Decrease in amortization of other intangible fixed
assets at TMHCC, etc. (also decreases reconciling amount)
*1: Each adjustment is on an after-tax basis*2: In case of reversal, it is subtracted from the equation*3: ALM: Asset Liability Management. Excluded since it is counter balance of ALM related liabilities

Copyright (c) 2018 Tokio Marine Holdings, Inc. 6
■ Changes in Major P/L Items — Underwriting ProfitDecreased by ¥58.8B YoY to ¥40.8B mainly due to the following factors: Net premiums written (Private insurance) (See p.8 for details) :
Auto : Increased mainly due to an increase in the number of policies Other: Increased due to sales expansion of Super Business Insurance,
etc. Net incurred losses (Private insurance):
Increase in net incurred losses relating to natural catastrophes Reversal effect of an increase in provision for foreign currency
denominated outstanding claims reserves due to the depreciationof the yen in FY2016
Impact of large losses, etc. Increase in net incurred losses associated with an increase in NPW
Business expenses (Private insurance): Increase in agency commissions associated with an increase in NPW
Catastrophe loss reserves : Increase in amount taken down associated with an increase in
W/P loss ratio in auto and fire
— Net Investment Income and Other (See p.9 for details)
Increased by ¥62.7B YoY to ¥209.2B mainly due to an increase in dividends income from overseas subsidiaries
– Extraordinary gains/lossesDecreased by ¥14.3B YoY to ¥-10.4B due to the reversal effect of gains on sales of fixed assets in FY2016, etc.
— Net IncomeDue to the factors above, etc., increased by ¥8.5B YoY to ¥201.5B
3Q FY2017 Results - Domestic Non-Life - 1
TMNF Financial ResultsConsolidated
DomesticNon-Life
Domestic Life
International
(billions of yen)
YoYChange
Underwriting profit/loss 99.7 40.8 - 58.8
133.3 66.3 - 67.0
1,371.8 1,396.0 24.2
1,368.7 1,398.4 29.7
- 789.7 - 873.3 - 83.5
Natural catastrophe losses - 43.6 - 65.9 - 22.3
Provision/Reversal of foreign currency denominatedoutstanding claims reserves - 3.3 - 0.6 2.7
Other than above - 742.7 - 806.7 - 63.9
Business expenses (Private insurance) - 441.8 - 446.6 - 4.8
- 33.6 - 25.5 8.1
Auto - 12.9 - 5.2 7.6
Fire - 11.5 - 6.9 4.5
146.5 209.2 62.7
160.3 231.5 71.2
Interest and dividends 124.2 185.1 60.8
Dividends from foreign stocks 34.2 91.5 57.2
Gains/Losses on sales of securities 78.0 78.7 0.7
Impairment losses on securities - 0.7 - 1.1 - 0.4
Gains/Losses on derivatives - 1.8 - 2.3 - 0.4
244.8 251.0 6.1
3.9 - 10.4 - 14.3
193.0 201.5 8.5
*Including loss adjustment expenses
(Notes) 1. Plus and minus of the figures in the above table correspond to positive and negative to profit respectively
Net income/loss
2. Private insurance includes all lines excluding compulsory automobile liability insurance and residential earthquake insurance
Extraordinary gains/losses
Net investment income (loss) and other
Ordinary profit/loss
Net investment income/loss
Provision/Reversal of catastrophe loss reserves
Net incurred losses (Private insurance)*
FY20163Q
Results
FY20173Q
Results
Net premiums written (Private insurance)
Net premiums earned (Private insurance)
(Underwriting profit/loss: excluding provision/reversal ofcatastrophe loss reserves)

Copyright (c) 2018 Tokio Marine Holdings, Inc. 7
■ Combined Ratio (Private insurance: E/I basis)
– E/I Basis Loss Ratio
Worsened by 4.7 points YoY to 62.5% mainly due to: Increase in net incurred losses relating to
natural catastrophes Reversal effect of an increase in provision for
foreign currency denominated outstanding claims reserves associated with the depreciation of the yen in FY2016
Impact of large losses, etc.
– Expense RatioImproved by 0.2 points YoY to 32.0% mainly due toan increase in NPW
※( ): YoY Change
89.9%93.5% 94.4(+4.5pt)
Expense Ratio
E/I Loss Ratio*
Impact of natural catastrophes (pt) 4.75.1 3.2
57.7%61.4% 62.5% (+4.7pt)
32.2%32.1% 32.0% (-0.2pt)
3Q FY2017 Results - Domestic Non-Life - 2
TMNF Combined RatioConsolidated
DomesticNon-Life
Domestic Life
International
(billions of yen)
YoYChange
Net premiums written 1,388.7 1,371.8 1,396.0 24.2
Net incurred losses* 822.7 789.7 873.3 83.5
Business expenses 446.1 441.8 446.6 4.8
Corporate expenses 170.3 170.0 169.3 - 0.6
Agency commissions 275.8 271.8 277.2 5.4
FY20173Q
Results
FY20163Q
Results
FY20153Q
Results
(Reference)
89.0% 88.5% 91.4% 3.0pt
56.8% 56.3% 59.4% 3.2pt
* Including loss adjustment expenses
Private insurance W/P combined ratio* Private insurance W/P loss ratio*

Copyright (c) 2018 Tokio Marine Holdings, Inc. 8
■ Net Premiums Written by Line
■ E/I Loss Ratio by Line – Major Factors of Changes in E/I Loss Ratio
– Major Factors of Changes in NPW
Fire: Increased both in the household and the corporatesectors
P.A.: Decreased due to shift of sub-lines of P.A. insurance intothe “Other” category
Auto: Increased mainly due to an increase in the number of policies CALI: Increased mainly due to an increase in the number of policies Other: Increased due to sales expansion of Super Business
Insurance, etc. as well as the premium shift of sub-linesfrom the “P.A.” category despite the impact of surrender in surety insurance
Fire: Worsened due to an increase in large and medium size losses, etc. as well as an increase in net incurred losses relating to natural catastrophes
Marine: Worsened due to an increase in medium size losses, etc. Auto: Worsened due to an increase in net incurred losses
relating to natural catastrophes and net incurred lossesrelating to riders, etc.
3Q FY2017 Results - Domestic Non-Life - 3
TMNF NPW & Loss RatioConsolidated
DomesticNon-Life
Domestic Life
International
(billions of yen, except for %)
Change %
Fire 198.4 205.1 6.6 3.4%
Marine 43.3 43.2 -0.1 -0.3%
P.A. 136.1 131.6 -4.4 -3.3%
Auto 786.6 797.2 10.6 1.3%
CALI 209.0 216.2 7.1 3.4%
Other 208.4 219.6 11.1 5.4%
Total 1,582.0 1,613.0 31.0 2.0%
Private insuranceTotal 1,371.8 1,396.0 24.2 1.8%
YoYFY2016
3QResults
FY20173Q
Results
Fire 52.1% 69.3% 17.2pt
Marine 50.1% 76.6% 26.5pt
P.A. 50.9% 55.4% 4.5pt
Auto 60.5% 61.3% 0.8pt
Other 58.5% 61.2% 2.8pt
Private insuranceTotal 57.7% 62.5% 4.7pt
YoYChange
FY20173Q
Results
FY20163Q
Results

Copyright (c) 2018 Tokio Marine Holdings, Inc.
(billions of yen)
YoYChange
Sales of business-related equities 97 93 - 4
FY20173Q
Results
FY20163Q
Results
(billions of yen)
YoYChange
Net investment income and other 146.5 209.2 62.7
Net investment income 160.3 231.5 71.2
Net interest and dividends income 88.2 152.7 64.4
Interest and dividends 124.2 185.1 60.8
Dividends from domestic stocks 51.0 55.6 4.6
Dividends from foreign stocks 34.2 91.5 57.2
Income from domestic bonds 19.4 18.2 - 1.2
Income from foreign bonds 4.0 3.0 - 1.0
Income from other domestic securities*1 0.0 0.3 0.2
Income from other foreign securities*2 6.8 8.0 1.2
- 35.9 - 32.3 3.5
Net capital gains 72.0 78.8 6.7
Gains/Losses on sales of securities 78.0 78.7 0.7
Impairment losses on securities - 0.7 - 1.1 - 0.4
Gains/Losses on derivatives - 1.8 - 2.3 - 0.4
- 3.1 0.4 3.5
- 0.1 3.1 3.2
Other ordinary income and expenses - 13.8 - 22.2 - 8.4
Note: Plus and minus of the figures in the above table correspond to positive and negative to profit respectively
FY20173Q
Results
FY20163Q
Results
Transfer of investment incomeon deposit premiums
*2. Income from foreign securities excluding foreign stocks and foreign bonds*1. Income from domestic securities excluding domestic stocks and domestic bonds
Other investment income and expenses
Others
9
3Q FY2017 Results - Domestic Non-Life - 4
TMNF Asset Management ResultsConsolidated
DomesticNon-Life
DomesticLife
International
Net Investment Income and Other
Sales of Business-Related Equities
– Net investment income and other increased by ¥62.7B YoY to ¥209.2B mainly due to an increase in dividends from foreign stocks (dividends income from overseas subsidiaries)
– Sales of business-related equities decreased by ¥4B YoY to ¥93B
– Gains relating to sales of business-related equities increased by ¥2B YoY to ¥72B

Copyright (c) 2018 Tokio Marine Holdings, Inc. 10
NF Financial Results3Q FY2017 Results - Domestic Non-Life - 5 Consolidated
DomesticNon-Life
DomesticLife
International
Changes in Major P/L Items
— Underwriting ProfitDecreased by ¥2.4B YoY to ¥2.7B mainly due to the following factors: Net premiums written (Private insurance)
Increased due to sales expansion of a new product in fire Increased due to sales expansion of a new product for SMEs
in specialty insurance Net incurred losses (Private insurance)
Increase in net incurred losses relating to natural catastrophes Decrease in net incurred losses relating to auto Increase in net incurred losses in P.A. and specialty insurance
‒ Net Investment Income and OtherIncreased by ¥0.8B YoY to ¥1.5B due to an increase in gains on sales of securities and gains on redemption of securities, etc.
‒ Net IncomeAccordingly, decreased by ¥1.1B YoY to ¥2.6B
(billions of yen)
5.1 2.7 - 2.4
9.6 6.4 - 3.1
91.1 92.9 1.7
90.9 92.7 1.7
- 50.1 - 53.7 - 3.5
Natural catastrophe losses - 1.8 - 3.9 - 2.1
Other than above - 48.3 - 49.7 - 1.4
- 31.1 - 31.9 - 0.7
- 4.4 - 3.7 0.7
Fire - 0.6 0.0 0.7
Auto - 3.1 - 3.0 0.0
0.6 1.5 0.8
1.4 1.7 0.3
Interest and dividends 2.9 2.9 - 0.0
Gains/Losses on sales of securities 0.1 0.2 0.0
Gains/Losses on redemption of securities - 0.0 0.1 0.1
5.5 3.7 - 1.7
- 0.1 - 0.2 - 0.0
3.8 2.6 - 1.1
55.1% 57.9% 2.8pt
34.2% 34.4% 0.1pt
89.3% 92.3% 3.0pt
* Including loss adjustment expenses
Ordinary profit/loss
Net premiums written (Private insurance)
Net incurred losses (Private insurance)*
Net investment income (loss) and other
Net investment income/loss
Business expenses (Private insurance)
(Notes)1. Plus and minus of the figures in the above table correspond to positive and negative to profit respectively2. Private insurance includes all lines excluding compulsory automobile liability insurance and residential earthquake insurance
Net income/loss
Extraordinary gains/losses
Loss ratio (Private insurance, E/I basis)*
Expense ratio (Private insurance)
E/I Combined ratio (Private insurance)*
YoYChange
Underwriting profit/loss
Provision/Reversal of catastrophe loss reserves
(Underwriting profit/loss: excluding provision/reversalof catastrophe loss reserves)
Net premiums earned (Private insurance)
FY20173Q
Results
FY20163Q
Results
Copyright (c) 2018 Tokio Marine Holdings, Inc. 11
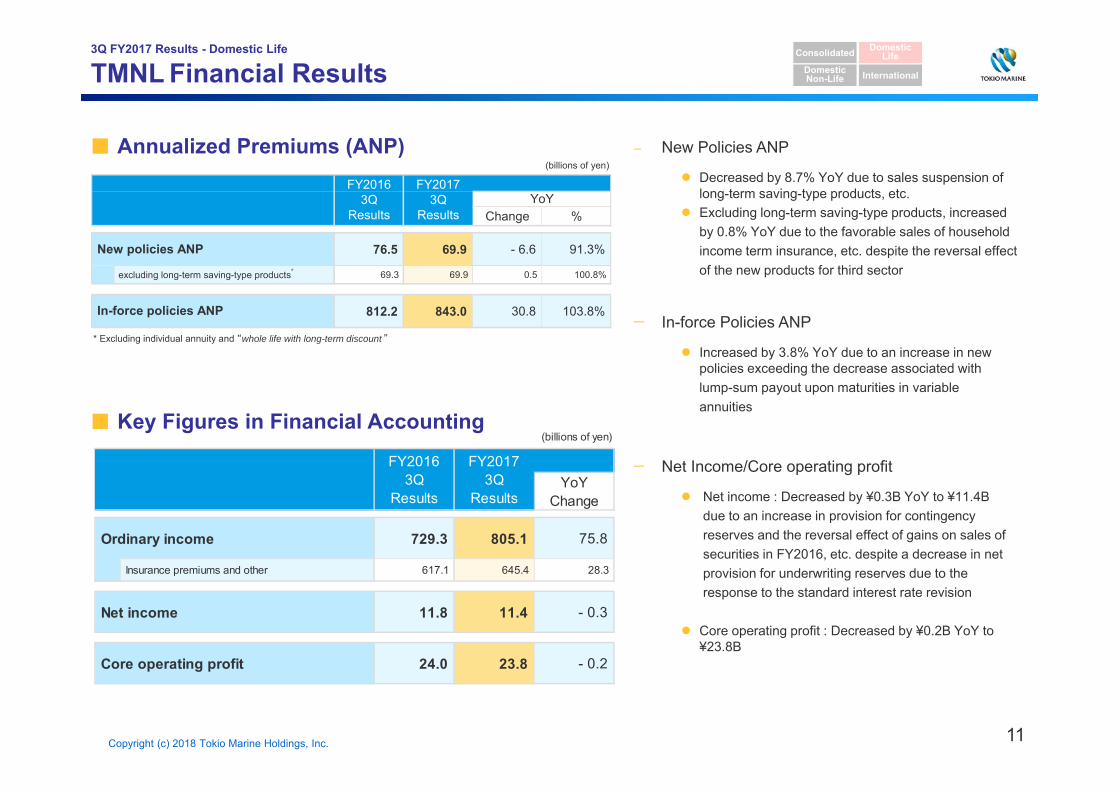
■ Annualized Premiums (ANP)
■ Key Figures in Financial Accounting
– New Policies ANP
Decreased by 8.7% YoY due to sales suspension of long-term saving-type products, etc.
Excluding long-term saving-type products, increasedby 0.8% YoY due to the favorable sales of household income term insurance, etc. despite the reversal effect of the new products for third sector
— In-force Policies ANP
Increased by 3.8% YoY due to an increase in new policies exceeding the decrease associated with lump-sum payout upon maturities in variable annuities
— Net Income/Core operating profit
Net income : Decreased by ¥0.3B YoY to ¥11.4B due to an increase in provision for contingency reserves and the reversal effect of gains on sales of securities in FY2016, etc. despite a decrease in net provision for underwriting reserves due to the response to the standard interest rate revision
Core operating profit : Decreased by ¥0.2B YoY to ¥23.8B
TMNL Financial Results3Q FY2017 Results - Domestic Life Consolidated
DomesticNon-Life
DomesticLife
International
(billions of yen)
YoYChange
729.3 805.1 75.8
617.1 645.4 28.3
11.8 11.4 - 0.3
24.0 23.8 - 0.2 Core operating profit
Ordinary income
Insurance premiums and other
Net income
FY20173Q
Results
FY20163Q
Results
(billions of yen)
Change %
76.5 69.9 - 6.6 91.3%
69.3 69.9 0.5 100.8%
812.2 843.0 30.8 103.8%
YoYFY2017
3QResults
New policies ANP
In-force policies ANP
excluding long-term saving-type products*
* Excluding individual annuity and “whole life with long-term discount ”
FY20163Q
Results

Copyright (c) 2018 Tokio Marine Holdings, Inc. 12
Net Premiums Written3Q FY2017 Results - International Insurance Business - 1 Consolidated
DomesticNon-Life
DomesticLife
International
North America NPWs of Philadelphia, Delphi, and TMHCC increased due to
rate increases in renewal book and business expansion, etc.
Europe Increased due to business expansion at Tokio Marine Kiln,
etc.
South & Central America Increased mainly due to auto insurance sales growth in
Brazil
Asia & Middle East Increased due to an increase of shareholdings in India and
the progress of growth measures in each country, etc.
Reinsurance Decreased due to the reversal effect of multi-year policies in
FY2016, etc.
Life Increased mainly due to the depreciation of the yen
– Increased by 18% YoY due to the progress of growth measures ineach business segment and the depreciation of the yen, etc.
The above figures of International Insurance Business are the total of foreign branches of TMNF, equity method investees, and non-consolidated companies, etc. which are aligned with the disclosure format of our IR materials from before
(billions of yen, except for %)
As of end-Sep. 2016
As of end-Sep. 2017
JPY 101.1 JPY 112.7
North America 696.1 806.0 109.8 16% 4%
Europe 92.6 122.6 30.0 32% 15%
South &Central America 83.7 113.7 30.0 36% 18%
Asia &Middle East 78.8 107.2 28.4 36% 22%
Reinsurance 119.5 115.1 - 4.4 - 4% - 14%
1,070.8 1,264.8 193.9 18% 5%
60.9 67.2 6.2 10% - 1%
1,131.8 1,332.1 200.2 18% 5%
*2: Excluding FX effects due to yen conversion
Change
FY20173Q
Results
%
Total
Applied FX rate(USD/JPY)
FY20163Q
Results (Ref.)YoY
(ExcludingFX effects)*2
*1: Total Non-Life figures include some life insurance figures of composite overseas subsidiaries
Total Non-Life*1
Life
YoY

Copyright (c) 2018 Tokio Marine Holdings, Inc. 13
Consolidated
DomesticNon-Life
DomesticLife
InternationalBusiness Unit Profits 3Q FY2017 Results - International Insurance Business - 2
North America Philadelphia’s profit decreased due to the natural catastrophe
and large losses, etc. Delphi’s profit increased due to strong investment income
associated with an increase in investment assets and lower capital losses
TMHCC’s profit decreased due to the natural catastrophe and foreign exchange losses, etc.
Europe Decreased due to the natural catastrophe and foreign exchange
losses, etc.
South & Central America Increased mainly due to profitability improvement of auto
insurance in Brazil
Asia & Middle East Increased due to profitability improvement in each country as
well as an increase of shareholdings in India and reserve takedown, etc.
Reinsurance Decreased due to an increase in loss ratio of non-catastrophe
and natural catastrophe business as well as foreign exchange losses, etc.
Life Decreased due to the reversal effect of the impact of interest
rate fluctuation in Thailand in FY2016, etc.
The above figures of International Insurance Business are the total of foreign branches of TMNF, equity method investees, and non-consolidated companies, etc. which are aligned with the disclosure format of our IR materials from before
– Decreased by ¥41.0B YoY (-34%) due to the large natural catastrophe losses relating to hurricanes in North America, etc. and foreign exchange losses despite the progress of growth measures in each business segment and the depreciation of the yen, etc.
(billions of yen, except for %)
As of end-Sep. 2016
As of end-Sep. 2017
JPY 101.1 JPY 112.7
North America 88.8 91.2 2.3 3% - 8%
Europe 10.9 - 22.2 - 33.2 - 303% - 271%
South &Central America 2.5 4.1 1.6 66% 44%
Asia &Middle East 5.7 11.6 5.8 102% 78%
Reinsurance 9.3 - 5.0 - 14.3 - 154% - 149%
117.0 79.5 - 37.5 - 32% - 38%
4.3 4.1 - 0.1 - 4% - 15%
120.4 79.4 - 41.0 - 34% - 40%
Change
*2: Excluding FX effects due to yen conversion*1: Total Non-Life figures include some life insurance figures of composite overseas subsidiaries
Total Non-Life*1
Life
Total
Applied FX rate(USD/JPY)
(Ref.)YoY
(ExcludingFX effects)*2
FY20163Q
Results YoY
%
FY20173Q
Results

Copyright (c) 2018 Tokio Marine Holdings, Inc. 14
Consolidated
DomesticNon-Life
DomesticLife
InternationalNorth America (Breakdown)3Q FY2017 Results - International Insurance Business - 3
Net Premiums Written
Business Unit Profits
(billions of yen, except for %)
As of end-Sep. 2016
As of end-Sep. 2017
JPY 101.1 JPY 112.7
234.0 275.3 41.2 18% 6%
168.2 197.1 28.8 17% 5%
240.4 274.1 33.7 14% 2%
%
Delphi
(Ref.)YoY
(ExcludingFX effects)*
YoY
Change
FY20173Q
Results
FY20163Q
Results
Applied FX rate(USD/JPY)
TMHCC
Philadelphia
* Excluding FX effects due to yen conversion
(billions of yen, except for %)
As of end-Sep. 2016
As of end-Sep. 2017
JPY 101.1 JPY 112.7
29.0 26.7 - 2.3 - 8% - 17%
26.2 35.0 8.7 33% 19%
31.7 28.0 - 3.7 - 12% - 21%
Delphi
Change %
FY20163Q
Results YoY
FY20173Q
Results
* Excluding FX effects due to yen conversion
TMHCC
Philadelphia
(Ref.)YoY
(ExcludingFX effects)*
Applied FX rate(USD/JPY)

Copyright (c) 2018 Tokio Marine Holdings, Inc. 15
II. FY2017 Revised Projections
JPY 112.73
FX rateUSD/JPY Nikkei Stock Average
Assumptions used for FY2017 Full-Year Projections
18,909 yen
<Reference>
20,356 yenRevised Projections in Nov. 17 and Feb. 14
(end of Sep. 2017 rate and stock avg.)
Original Projections (end of Mar. 2017 rate and stock avg.) JPY 112.19
Copyright (c) 2018 Tokio Marine Holdings, Inc. 16
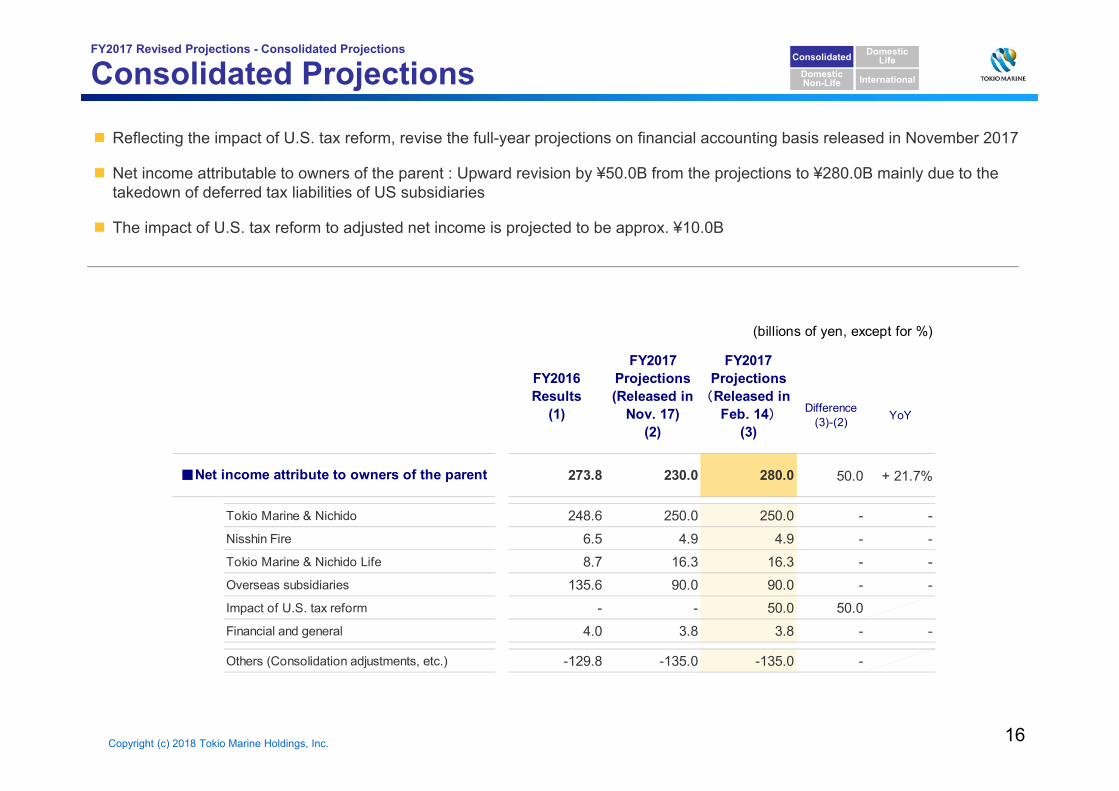
Reflecting the impact of U.S. tax reform, revise the full-year projections on financial accounting basis released in November 2017
Net income attributable to owners of the parent : Upward revision by ¥50.0B from the projections to ¥280.0B mainly due to the takedown of deferred tax liabilities of US subsidiaries
The impact of U.S. tax reform to adjusted net income is projected to be approx. ¥10.0B
Consolidated Projections FY2017 Revised Projections - Consolidated Projections
Consolidated
DomesticNon-Life
DomesticLife
International
(billions of yen, except for %)
273.8 230.0 280.0 50.0 + 21.7%
Tokio Marine & Nichido 248.6 250.0 250.0 - -Nisshin Fire 6.5 4.9 4.9 - -Tokio Marine & Nichido Life 8.7 16.3 16.3 - -Overseas subsidiaries 135.6 90.0 90.0 - -Impact of U.S. tax reform - - 50.0 50.0Financial and general 4.0 3.8 3.8 - -
Others (Consolidation adjustments, etc.) -129.8 -135.0 -135.0 -
YoY
■Net income attribute to owners of the parent
FY2016Results
(1)
FY2017Projections(Released in
Nov. 17)(2)
FY2017Projections(Released in
Feb. 14)(3)
Difference(3)-(2)

DisclaimerThese presentation materials include business projections and forecasts relating to
expected financial and operating results of Tokio Marine Holdings and certain of its affiliates in current and future periods. All such forward looking information is based on information and assumptions available to Tokio Marine Holdings when the materials were prepared and is subject to a range of inherent risks and uncertainties. Actual results may vary materially from those estimated, anticipated, expected or projected in the accompanying materials and no assurances can be given that any such forward looking information will prove to have been accurate. Investors are cautioned not to place undue reliance on forward looking statements in these materials. Tokio Marine Holdings undertakes no obligation to update or revise any of this forward looking information, whether as a result of new information, recent or future developments, or otherwise.
These presentation materials do not constitute an offering of securities in anyjurisdiction. To the extent distribution of these presentation materials or theinformation included herein is restricted by law, persons receiving these materials must inform themselves of and observe any such restrictions.
For further information...
Investor Relations Group, Corporate Planning Dept.
Tokio Marine Holdings, Inc.
E-mail: URL : www.tokiomarinehd.comTel : +81-3-3285-0350
20180213