overview of cardiovascular disease in american indians and alaskan natives barbara v. howard, phd...
Post on 19-Dec-2015
213 views
TRANSCRIPT
Overview of Cardiovascular
Disease in American Indians and Alaskan
Natives Barbara V. Howard, PhD
MedStar Research Institute
Terry Raymer MD, CDE
The Rising Tide of CVD

Strong Heart Study
Ak-Chin
Phoenix
Salt River Indian Community
ARIZONA
Gila RiverIndianCommunity
Oklahoma City
AnandarkoLawton
OKLAHOMA
NORTH DAKOTA
SOUTH DAKOTA
Rapid CityPine Ridge
Oglala
Cheyenne RiverEagle Butte
Bismarck
Spirit Lake
Ak-Chin
4549 American Indians ages 45-74 years
Arizona: Pima/Maricopa/Papago in the Gila River, Salt River, and Ak-Chin Indian communities
Oklahoma: Apache, Caddo, Comanche, Delaware, Fort Sill Apache, Kiowa, and Wichita
South/North Dakota: Oglala Sioux and Cheyenne River Sioux (SD) and the Spirit Lake Tribe in the Fort Totten area (ND)

Strong Heart Study 1988-2003• Community Mortality Study
35–74-year-old men and womenDeaths between 1984 and 1994Medical record review of all possible CVD deaths
• Physical Examinations of Cohort1989-91, 1993-5 and 1998-9 ECG, Cardiac and Carotid ECHO, Anthropometry, BP, ABI, PFT, Blood, urine
and DNA samples, Medical and medication history
• LifestyleDiet, Activity, Quality of Life, smoking, alcohol

Strong Heart Study 1988-
2003 • Cohort SurveillanceYearly contactMedical record review for all cause and CVD Mortality and nonfatal CVD
• Family Study120 families of 30 members eachExamination similar to that of cohort10cM genetic map

Hospital AdmissionsPhoenix PHS Indian Hospital, 1957-1966
Myocardial All hospital infarction admissions (n = 61) (N = 24,121)
Tribe No. % %
Pima 28 45.9 36.2Apache 7 11.5 22.0Navajo 1 1.6 10.5Papago 5 8.2 8.4Hopi 7 11.5 6.5Other SW Indians 13 21.3 16.4Total 61 100.0 100.0
Sievers, Ann Intern Med 1967;67:800

CVD and Total Mortality Rates
Arizona vs Strong Heart Study, Men, 1986per 10,000
45-54 65-7455-64
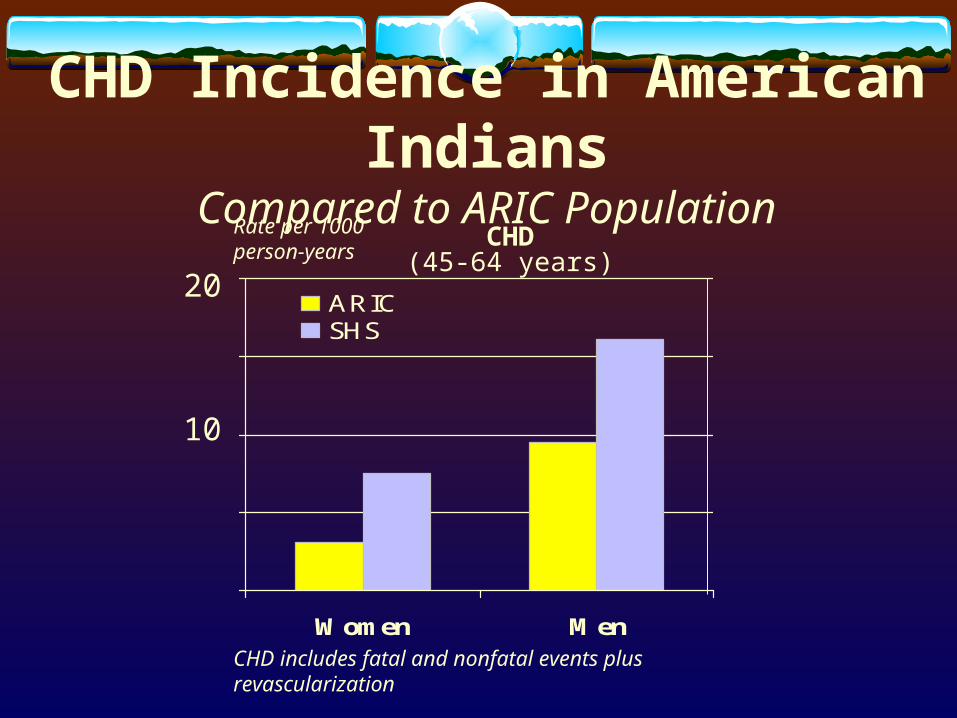
CHD Incidence in American Indians
Compared to ARIC Population
Women Men
ARICSHS
Rate per 1000 person-years
CHD(45-64 years)
CHD includes fatal and nonfatal events plus revascularization
10
20

Prevalence of DiabetesStrong Heart Study, by Gender and Center
Women Men
%

Contribution of Diabetes to CHD
Strong Heart Study
Hazard Ratio 6.3 3.1
Prevalence 60% 50%
PAR* 76% 51%
Women Men
*PAR = Attributable riskDiabetes is the engine driving the increase in CVD
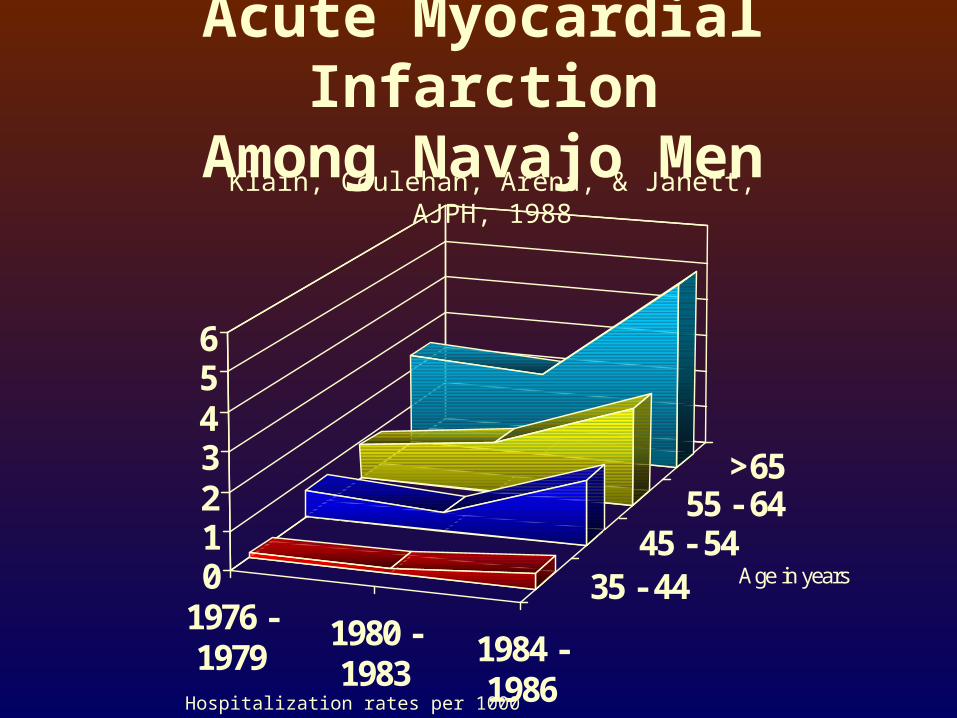
Acute Myocardial Infarction
Among Navajo Men
1976 -1979
1980 -1983
1984 -1986
35 - 4445 - 54
55 - 64>65
0123456
Age in years
Hospitalization rates per 1000
Klain, Coulehan, Arena, & Janett, AJPH, 1988

Acute Myocardial Infarctions
Hopi Tribal Members
Average values 1957-66 from Seivers and average for 1975-78 taken from Sievers and Fisher; p,0.001
1957 1962 1967 1972 1977 1982 1987 1992
Year
0
2
4
6
8
10
12
Num
ber
of M
yoc a
rdia
l In f
a rc t
ion
Actual Data Regression line

per 100,000. Ages 45 to 79. Arch Intern Med 2002;162:1368-1372.C.
The Apache Heart StudyIncidence of Confirmed CAD Cases
0
5
10
15
20
87 -88 89 - 90 91 - 92 93 - 94 95 - 96

Prevalence of Atherosclerotic Plaque in GOCADAN and U.S.
Whites & Blacks
010
2030
4050
6070
8090
100
15-19 20-29 30-39 40-49 50-59 60-69 70-89
GOCADANARIC/CHS
Age (years)15 May 2003

American Indian Mortality Rates
0
50
100
150
HeartDisease
Cancer Accidents Diabetes
AI/AN Mortality US All Races
Trends in Indian Health, 1997; Age-adjusted data

Age-Adjusted Heart Disease Mortality
0
50
100
150
200
250
300
US All Races AI/AN Actual AI/AN Adjusted
Trends in Indian Health, 2000

Strong Heart Study conclusions for CVD in
American Indians CVD rates in American Indians are now
higher than in the general U.S. population The rates are increasing The majority of CVD occurs in people
with diabetes

• Conventional Risk Factors
• New Risk Factors

CVD Risk Factorswhat’s important in
diabetes? Age (!) Gender not significantly different:
diabetes is the “equalizer” LDL cholesterol HDL cholesterol Blood Pressure (systolic) Smoking (!) Non-HDL cholesterol

Distribution of LDL Cholesterol
in American Indians
LDL Cholesterol (mg/dl)
Men Men Women Women
FHS SHS FHS SHS
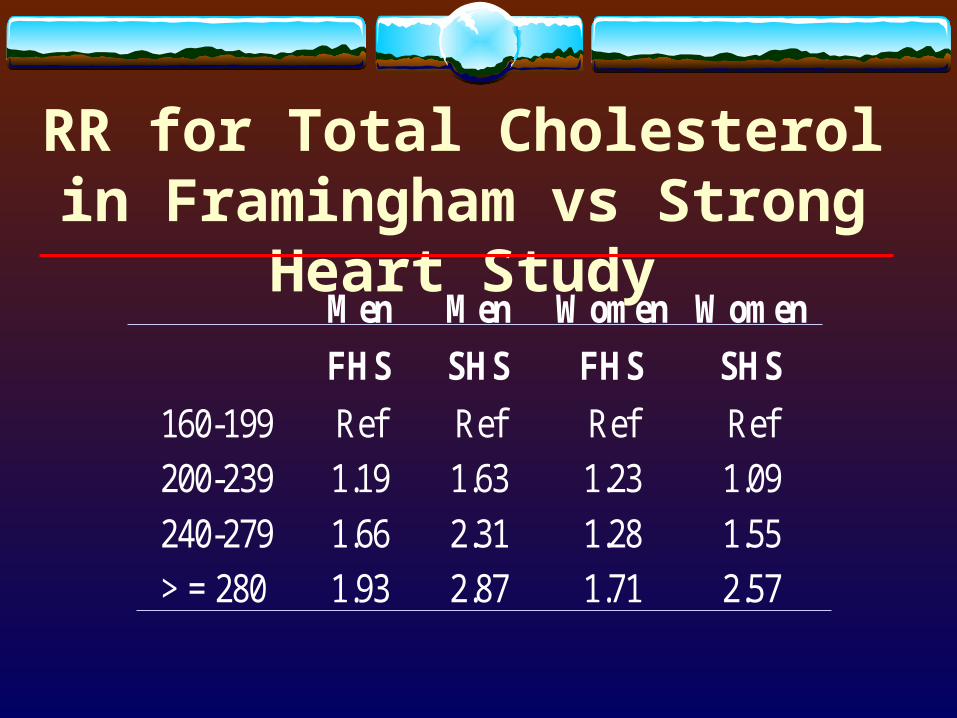
160-199 Ref Ref Ref Ref
200-239 1.19 1.63 1.23 1.09
240-279 1.66 2.31 1.28 1.55
> = 280 1.93 2.87 1.71 2.57
RR for Total Cholesterol in Framingham vs Strong
Heart Study

Are all LDL levels created equal?
Vs.
Large “Fluffy” LDL Small “Dense” LDL
Less atherogenic More atherogenic
LDL = 130 mg/dL in both examples

Non-HDL Cholesterol:
Non-HDL cholesterol = Total Cholesterol - HDL
A secondary target of therapy when serum triglycerides
are 200 mg/dL (esp. 200–499 mg/dL)““The simple non-HDL cholesterol measurement,which can The simple non-HDL cholesterol measurement,which can be conducted in the be conducted in the nonfasting statenonfasting state and can be determined and can be determined
regardless of triglyceride concentration, may be of particularregardless of triglyceride concentration, may be of particular
clinical utility.” clinical utility.”
Lu et al; Diabetes Care 26:16-21Lu et al; Diabetes Care 26:16-21

Non-HDL Cholesterol as a Predictor of Cardiovascular Disease in Type 2 Diabetes:
The Strong Heart Study*
Non-HDL cholesterol is a better predictor of risk for CVD than LDL & TG in men & women and Total/HDL in women
Conclusion: This study suggests that non-HDL cholesterol index may be particularly useful in predicting CVD risk in patients with diabetes.
*Lu W et al Diabetes Care 2003 26:16-23

Distribution of Systolic Blood Pressure in Diabetic and
Nondiabetic American Indians Diabetic
Nondiabetic
Systolic blood pressure (mmHg)
Systolic blood pressure (mmHg)mm Hg
Diabetic

Systolic Blood Pressure and CVD Relative Risk in Diabetic
American Indians
Adjusted by LDL, HDL, TG, gender, smoking and age

• Conventional Risk Factors
• New Risk Factors
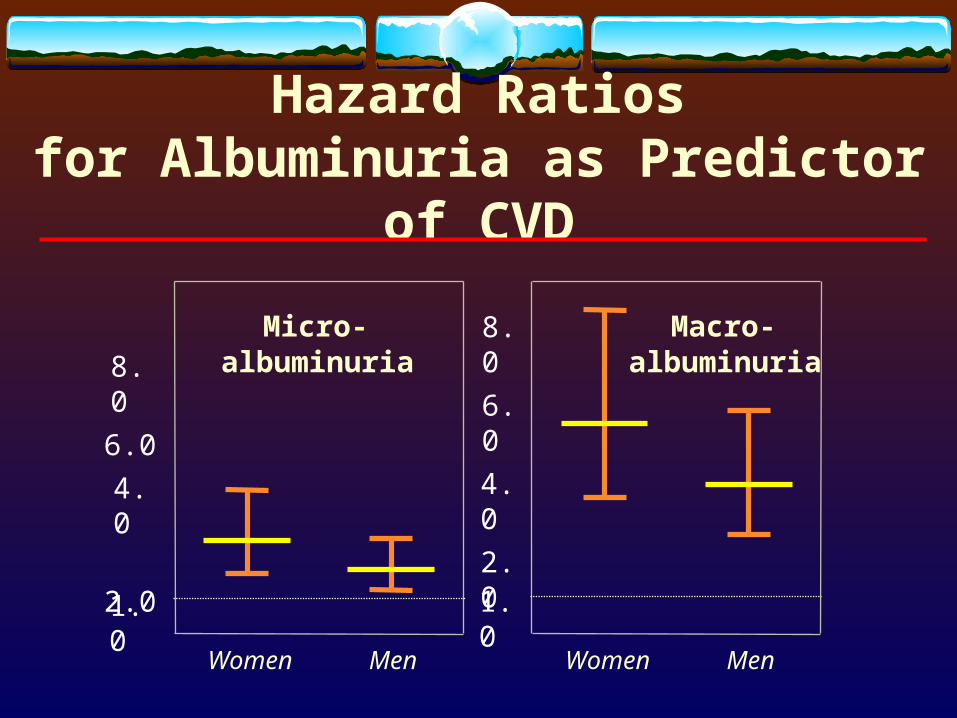
Women Men
1.02.0
4.0
6.0
8.0 Macro-albuminuria
Women Men
1.0 2.0
4.0
6.0
8.0 Micro-albuminuria
Hazard Ratiosfor Albuminuria as Predictor of
CVD
Survival
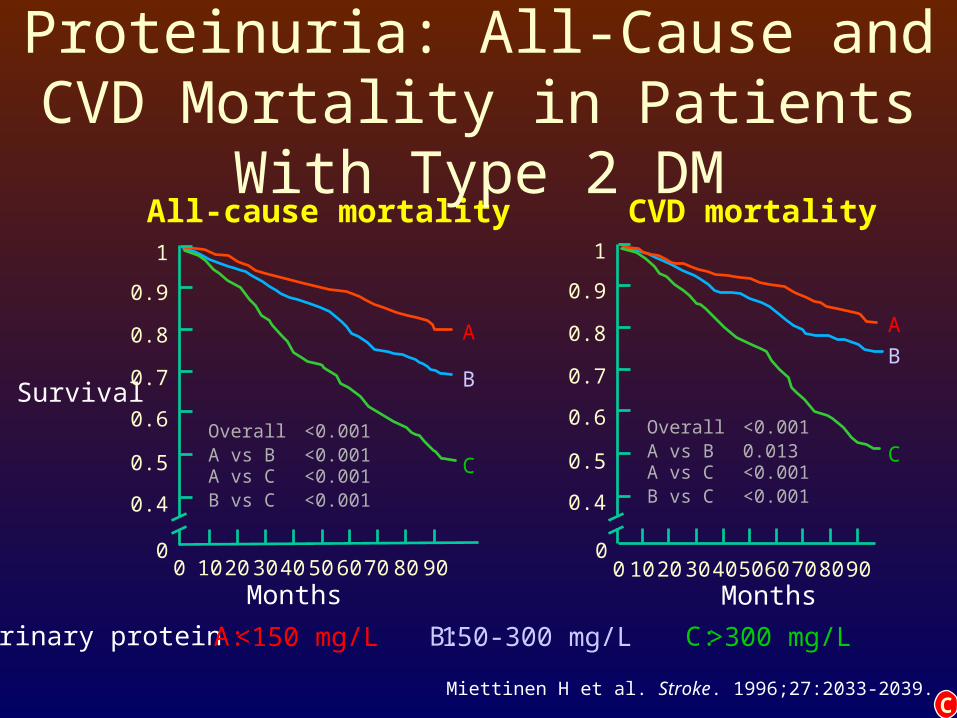
Miettinen H et al. Stroke. 1996;27:2033-2039.
<150 mg/L >300 mg/L150-300 mg/LUrinary protein
All-cause mortality1
0.6
0.5
0.4
0
0.7
0.8
0.9
Months30 40 50 60 70 80 9020100
A
B
C
CVD mortality
0
Months30 405060 70 80 9020100
A
B
C
A: B: C:
1
0.6
0.5
0.4
0.7
0.8
0.9
Overall <0.001A vs B <0.001A vs C <0.001B vs C <0.001
Overall <0.001A vs B 0.013A vs C <0.001B vs C <0.001
Proteinuria: All-Cause and CVD Mortality in Patients With Type
2 DM
C

0
5
10
15
20
25
30
35
1st Tertile 2nd tertile 3rd Tertile
Tertile of HOMA IR
Pe
rce
nt
(%)
0
5
10
15
20
25
30
Absent Present
ATP III Metabolic Syndrome
Per
cent
(%
)
IR and MS as Predictors of Diabetes

01
23
45
67
89
10
1st Tertile 2nd tertile 3rd Tertile
Tertile of HOMA IR
Per
cen
t (%
)
0
1
2
3
4
5
6
7
8
9
10
Absent Present
ATP III Metabolic Syndrome
Perc
ent (
%)
IR and MS as Predictors of CVD
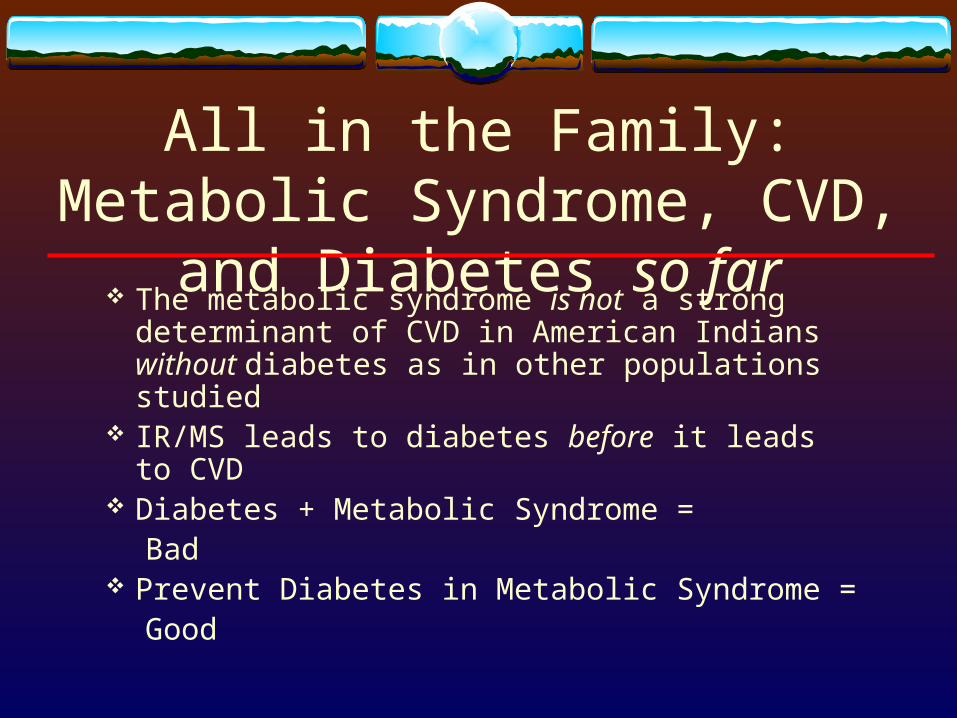
The metabolic syndrome is not a strong determinant of CVD in American Indians without diabetes as in other populations studied
IR/MS leads to diabetes before it leads to CVD Diabetes + Metabolic Syndrome =
Bad Prevent Diabetes in Metabolic Syndrome =
Good
All in the Family: Metabolic Syndrome, CVD, and Diabetes
so far
Inflammatory Markers?
Markers of Pre-Clinical Disease?

LV Function and CVD Mortality in Diabetes
Time (months)
706050403020100-10
Cumu
lativ
e Su
rviva
l
1.1
1.0
.9
.8
E/A>1.5
No
Yes
Months
50403020100
Cum
ulat
ive S
urviv
al
1.00
.98
.96
.94
.92
.90
EF
<40%
40-54%
>=55%
LVEF Abnormal LV Filling

Multivariate Relative Risk of Mortality in Diabetes*
0.0
0.5
1.0
1.5
2.0
2.5
3.0
3.5
4.0ST DepressionPCA RatioQTc
Rel
ativ
e R
isk
Cardiovascular Mortality All-Cause Mortality
p=0.0009
p=0.006
p=0.082
3.68
p=0.242
p=0.001p=0.002
2.61
1.87
2.36
1.33
2.03
* Adjusted for age, sex, BMI, BP, HDL, LDL, TGs, albuminuria, alcohol use, smoking, prevalent CHD, and center
Application to the Clinical ECG
50 uV of ST depression = 1/2 mm (half
a small box) The QTc is the longest interval from
onset of QRS to the end of the T-wave

“It’s not all epidemiology and bad
news”

Multifactorial Intervention in DM
The Steno-2 trial
0
5
10
15
20
25
30
35
40
45
50
12 24 36 48 60 72 84 96
Months
En
d P
oin
t %
Conventional Intensive
44%
24%
Composite end-point: CV death, MI, CABG, PCI, stroke, amputation from ischemia, surgery for PVD.
P=0.008
47% Risk Reduction

There is a rising tide of CVD in AI/AN Most CVD is in those with diabetes Diabetes care should include attention to
major CVD risk factors – LDL, BP, smoking In addition, albuminuria and ECG
abnormalities can be considered in identifying those with increased risk
Research is focusing on future strategies for therapy and prevention of CVD in diabetes
Summary