overview of ccd intensity and brightness distribution · brightness distribution on back-light is...
TRANSCRIPT

Measurement method for back-light/ coaxial light data
Brightness distributionLuminosity characteristics
Measuring luminosity change
Luminosity graph
Brightness distribution
Uniformity of brightness is an important point when selecting a back-light and a coaxial light. To ensure that our products are of high quality, we perform luminosity measurements. As shown in the diagrams, luminosity is measured at 5-mm intervals along the X0-X1 and Y0-Y1 lines and recorded.
Measurement points and luminosity changes are indicated. Differences in the characteristics of each light due to the type of LED used and the manufacturing method are clear.The lower diagram is a graph showing luminosity changes in the LDL-TP-63×60 and LFL-4012. The LDL-TP Series achieves high luminosity and high uniformity by mounting chip LEDs on a flat circuit board.The LFL Series features light emission using the light conduction method. A dim light is produced that is very even and does not have high luminosity.In this way, luminosity characteristics provide a guideline for selecting a light that matches the application.
We perform measurements of brightness distribution of back-lights at an LWD of 0 mm. This information in combination with luminosity graphs helps provide a good understanding of the characteristics of each light. The diagram shows the brightness distributions of the LDL-TP-63×60 and LFL-4012. The LDL-TP shows a broad, even distribution around the center. The LFL clearly shows the characteristics of the light conduction method. Please use the brightness distributions and luminosity graphs as an aid in selecting the optimum light for your application.
Devices used for testingLuminosity meterPower unit
Two dimentional brightnessdistribution measuring system
Minolta LS-110PSD-3012-WW,PSD-3024-WW(CCS Co.)
(CCS Co.)
Test conditionsMeasurement start timeMeasurement distanceMeasurement interval
Approximately 30 minutes after turning on power of LED light180mmX0-X1, Y0-Y1 measured at 5-mm intervals
Brightness distribution
Devices used in testing
Test conditions
This curve shows the relationship between CCD intensity and LWD. The maximum value of CCD intensity is shown on the Y axis as 100%.In the case of the lower diagram, CCD intensity reaches a maximum when the LWD is approximately 40 mm. This maximum CCD intensity is shown on the graph and can be used as an indication of the brightness of each light.
The two-dimensional brightness distribution measuring system selects three points of work distance (LWD) that are recommended as factory standard. The three points selected are those that are useful for understanding the characteristics of a light. Of these three points, the point with the highest brightness level is taken to be 100% and the other points assigned percentage values accordingly.Ten levels are set and expressed by contour lines and color. The diagram at right compares the brightness distributions of the LDR2-90RD.It can be seen that the center point at an LWD of 50 mm is the brightest of the three points. Moving outward from the center, the brightness decreases one level at a time and the different levels are indicated by color.At distances of LWD 100 to 150 mm, the number of levels decrease and the field becomes more uniform.In this way, it can be determined how the light strength and the illumination range change with varying LWD, and the result can be used as a guideline for selecting the most suitable LWD.
CCD intensity vs. LWD
CCD camera
Power unit
Two dimentional brightnessdistribution measuring system
Reference plate
NC300 (Takenaka System Device Co.)f 50 mm lens, 5-mm close-up ring, lens opening of 17, 1.1 focus
PSD-3012-WW,PSD-3024-WW(CCS Co.)
(CCS Co.)
K3401 (Mitsubishi Plastic), white mat
Measurement start timeMeasurement distanceMeasurement intervalCamera position
Approximately 30 minutes after turning on power of LED light10 to 150 mm at 10 mm intervalsWaited one minute after each move of 10 mm and then performed measurement
180mm
69 70
"CCD intensity" as used in our product literature refers the level of output from the CCD camera.
The data provided in this literature is intended only as a guideline for light selection. It does not constitute a guarantee of the quality and performance of each light.
Measuring brightness distributionBrightness distribution on back-light is measured using a two-dimensional brightness distribution measuring system that we independently developed.400 light receptors are mounted at a pitch of 10 mm on a 200×200 mm receptor plate. These receptors detect the brightness of the light and the data is sent to a computer. For all points the computer converts the data into a brightness map, brightness pattern, and time-elapse chart, and stores this information.
Two-dimensional brightness distribution measuring system
As shown in the diagram, we use our own proprietary measurement unit to acquire and measure image signals from the CCD camera using a distance from the reference plate to the light (LWD) that is varied over a range of 10 to 150 mm.
Measuring brightness distribution
Comparing brightness distributions
Two-dimensional brightness distribution measuring system
Sketch of two dimensional brightness distribution measuring system
200mm
200m
m
10mm
LWD5~150mm
LED light
Luminosity change in the x direction Luminosity change in the y direction5
4
3
2
1
00 10 20 30 40 50
Distance (mm)
5
4
3
2
1
00 10 20 30 40
Distance (mm)
Luminosity change in the x direction Luminosity change in the y direction1816141210
86420
0 10 20 30 40 50 60Distance (mm)
1816141210
86420
0 10 20 30 40 50Distance (mm)
LDL-TP-63x60
LFL-4012
X0
Y0
Y1
X15mm
Emittingsurface
180mm
Luminosity meter
Emittingsurface
LED light
LDR2-90RD CCD intensity change charactersticVS distance to work piece.
100
80
60
40
20
00 25 50 75
LWD mm (Light Working Distance)100 125 150
CC
D in
tens
ity %
(max
: 100
)
Maximum output of CCD camera: 1.44V
180mm
10~150mm
CCD camera
LED light
Standard white plate
Lum
inos
ity (1
00 c
d/m
2)
Lum
inos
ity (1
00 c
d/m
2)
Lum
inos
ity (1
00 c
d/m
2)
Lum
inos
ity (1
00 c
d/m
2)
Overview of CCD Intensity and Brightness Distribution
LDL-TP-63×60
LFL-4012
Brig
htne
ss le
vel
100
10
10mm
10mm
Brig
htne
ss le
vel
100
10
LWD:50mm
10mm
LWD:100mm
10mm
LWD:150mm
10mm
Brig
htne
ss le
vel
100
10
Sketch of two dimensional brightness distribution measuring system
200mm
200m
m
10mm
LWD
LED light
0mm
Brightness dis t r ibut ion is measured using a two-dimensional brightness distribution measuring system that we independently developed.400 light receptors are mounted at a pitch of 10 mm on a 200×200 mm receptor plate. These receptors detect the brightness of the light and the data is sent to a computer. For all points the computer converts the data into a brightness map, brightness pattern, and time-elapse chart, and stores this information.
Data measuring method of direct light/surface light emission ring illumination
LWD characteristics of CCD luminance
Measuring LWD characteristics of CCD luminance
CCD luminance change characteristics in relation to the distance from the workpiece (LWD), distribution of brightness, and change of luminance are shown in a graph form as a guide for selecting illuminations.

71 72
without with
With the conventional construction, the light was not able to dissipate heat with total effeciency due to the gap between the PCB and aluminum housing.By employing a special heat dissipating enclosure between the PCB and the housing in the new construction, there is substantial absorption of heat generation from LED, and efficient heat conductivity into the housing.This new construction of LDR2 suppresses the temperature rise of LED sharply, providing stable images for a long period of time.
Although the white LED ring light without heat dissipation has a range of fluctuation of about 14% over a period of 60 minutes at 100% light intensity, the new ring light, LDR2 maintains the highest intensity with a fluctuation range of only 2% over the same period.
Data Acquisition Environment:LED light is installed inside environmental chamger at 40 , and light intensity and temperature are measured (LED light is fixed to the aluminum plate of 5mm thickness).
While the light without heat dissipation material goes into a 'heat-balanced state'after 38 minutes with a temperature of 111.3 ,the new LDR2 ring light attains a 'heat-balanced state' after 42 minutes andtemperature is stabilized at only 57.2 .This shows the success of the LDR2 light in sharply suppressing temperature rise,compared with the light without heat dissipation.
Note: Less than 0.5 is a stable range.
With 120 white LED ring light, the temperature rise of the solder joint is measured with100% light intensity.Although the soldered part of the PCB of the light without heatdissipation material heated up to 106.6 after 60 minutes, the new LDR2 ring light wasmeasured at a maximum of 58.7 , representing a successful suppression of heat, adecrease of 45% less than the temperature of the earlier light in the same conditions.
LED Radiation Pattern
Light Spectrum
CCS has studied LED life cycles and intensity degeneration for many years. In particular, we have focused on the issue of "heat radiation and it's impact on the life of LED" and taken measures to extend the useful life of our standard LED arrays by incorporating life extending features. These features include manufacuturing the light cases out of aluminum, which has excellent heat conducting characteristics, as well as heat dissipating measures such as air connections and fans. Recently, we have taken this research to the next plateau by providing LED illumination that can be used for a longer period with ease by adding LDR2 LDM2 Series with our original heat dissipating architecture.
The following chart shows the relative directional characteristics. In general, the center shows the highest intensity with the intensity diminishingas the angle becomes lower.
Each LED type has a characteristic spectrum pattern which affects the sensitivity of CCD cameras. The optimal image can not be obtained if the light spectrum pattern and the CCD's sensitivity pattern are not well matched.
Directional pattern of Red LED N-type Directional pattern of Red LED W-type Directional pattern of White LED W-type Directional pattern of Blue and Green LED
AluminumHousing
PCB
LED
Radiation Fin
Heat DissipationMaterial
550 600 650 700 750 800 850 900 950 1000 1050500450Wavelength (nm)
4003503000
20
100
80
60
40
Rel
ativ
e em
issi
on in
tens
ity (%
)
UV light:365 nm
Green light:525 nm Infrared light: 850 nm
Red light: 660 nm
White light
Infrared light:940 nm
Blue light:470 nm
Ta=25
Technology OverviewTechnology Overview Technology OverviewTechnology OverviewAn introduction to the characteristics of LED lighting An introduction to the characteristics of LED lighting
Skillful use of LED lighting Skillful use of LED lighting
Using an LED light at high temperature shortens its life.LED lights generate heat that decreases luminosity and speeds degeneration. In particular, the luminosity of red LEDs decreases 1% for each degree (Celsius) the temperature rises. (The original luminosity is restored by cooling the LED.) Prolonged use at high temperature results in gradual degeneration and decreased luminosity. (The original luminosity is not restored by cooling the LED.)
To prevent decreased luminosity and degeneration due to heat Only turn light on during imaging
Strobe Power Supplies
Use the light with the light level turned as low as possible.
Install a fan Provide air flow Install on a bracket with good heat conductivity
PTU2-3012/PTU2-3024
As indicated in Figures 1 and 2, setting the light level to 50% keeps current flow low and therefore generates minimal heat, allowing you to prevent luminosity weakening. Reducing the current flowing to the light makes it possible to keep the amount of heat generated low. In general, we recommend a light level of 30% to 50%. If prolonged use has caused degeneration and reduced luminosity, you can raise the light level without concern.
Luminosity weakening can be reduced by installing a fan or providing air flow for heat dissipation. As indicating in Figure 3, luminosity decreases when the room temperature increases, and increases when the room temperature decreases.
LED lights are very durable with respect to switching. When a LED is used for strobe lighting or is only turned on as needed by means of an external signal, light intensity is stable and the life of the LED increases dramatically.
The standard CCS LED light can be used as a strobe light.The unit has two independent circuits so that the strobe Illumination time can be set from 10 sec to 990 sec.For more information, see P65
Measurement conditions and methodsMeasurement conditions
Measurement methods
Measuring instrument
Measurements performed with the light level set to maximum (100%) and 50%.Measurement time also included 24-hour continuous illumination.Digital power source PSD Series and analog power source PSB Series(EOL) are used as the power source.Ambient temperature is ordinary temprateure.
Light was reflected off of a standard white plate from a height of 50 mm and the luminosity(reflected light)at the center of the plate was measured.Once a week, the light was turned off for at least two hours to allow it to return to normal temperature, and then the light level was set to 100%, the light was turned on, and the luminosity was immediately measured.
Luminosity meter: Minolta LS-110Note: Although this measurement was held with LDR-50A.
We currently produce and sell LDR2-50 Series which has superior heat radiation characterstics.
Decrease deterioration of light intensity against heat generationStructure comparison LDR2-90SW vs. Light without heat dissipation
LDR2-120SW(white) vs. Light without heat dissipation LDR2-120SW (white) vs. Light without heat dissipation
Figure 1 Relation between light modulation and brightness(Heat radiation = n/a, Intensity Control = Max, LDR-50A)
Figure 3 Relation between intensity and room temperature.(Heat radiation = n/a, Intensity Control = Max, LDR-50A)
Figure 2 Relation between light modulation and brightness(Heat radiation = n/a, Intensity Control = 50% LDR-50A)

1.0
0.8
0.6
0.4
0.2
0400 500 600 700
Wavelength nm800 900 1000
Spe
ctra
l lum
inou
s ef
ficie
ncy
1.0
0.8
0.6
0.4
0.2
0400 500 600 700
Wavelength nm800 900 1000
Spe
ctru
m o
f CC
D s
ensi
tivity
Figure 2 Spectral sensitivity characteristics of a CCD camera
Figure 1 Standard spectral luminous efficiency curve
Figure 4 CCD sensitivity change
CCD sensitivity graph Test configuration
Figure 3 Brightness comparison graph
Spectral luminous efficiency and CCD sensitivity
Distance from the light to the work (the object of inspection)
Shape, condition, and color of the work
Size of the field of view
Obtaining an image with good contrast
908070605040302010
00 50 100 150 200 250
LWD mm (Light Working Distance)
Brig
htne
ss lx
(1000)
Green
Red
73 74
1.0
0.8
0.6
0.4
0.2
0400 500 600 700
Wavelength nm800 900 1000
Rel
ativ
e se
nsiti
vity
Spectral sensitivity characteristics (CCD only) Spectral sensitivity characteristics (with infrared filter)
Figure 1 shows a cross-section of a coaxial light (LFV Series). Light from the LED is reflected using a half-mirror, and thus the position of the emitting surface can be treated as if it is directly behind the mirror. In this case, the distance from the emitting surface to the work is called the "LWD'".The effective field of view of coaxial light is determined by 1) the LWD (distance from the light to the work) and 2) the WD (distance to the CCD camera). Figure 2 shows how to determine the field of view "V" when the WD is held constant and the LWD (distance to the light) is varied. The following is an explanation of what the effective field of view will be when the provisional emitting surface is at positions A and B.In the case of position A, if we assume that the work is a reflecting surface, we can say that there is an emitting surface at A opposite to the work (position A' of the LWD'a distance). Therefore, when the work piece is viewed through the camera, it appears as if the emitting surface is at A', and thus the effective field of view is Va.In the same way, in the case of B the emitting surface is at B' and the effective field of view is Vb. Comparing Va to Vb, we find that Va, which has the shorter LWD, has a greater effective field of view. In this way, the effective field of view grows as the LWD shortens.
<What is the effective field of view?>For example, when reading characters engraved on a shiny piece of metal, if we assume that the provisional emitting surface is at position B, Vb will be determined by the virtual provisional emitting surface position B'. For this reason, only the letters CDEFG will be visible as dark letters against a light background, and the letters AB and HI, which appear dark against a dark background, will not be discernible. In this way, the effective field of view Vb is smaller than the field of view V.
The human eye is most sensitive to a wavelength of 555 nm. As the wavelength grows longer or shorter, the human eye becomes less sensitive. (Although there is some variation depending on the person, most people can view a wavelength range of 380 nm to 760 nm.) This sensitivity of the eye to light is
called spectral luminous efficacy.Spectral luminous efficiency is a measure based on a value of 1 for the spectral luminous efficacy of 555 nm light. Figure 1 shows a standard spectral luminous efficiency curve for the human eye. Wavelengths longer than the visible range are called infrared light and wavelengths shorter than the visible range are called ultraviolet light.Figure 2 shows the spectral sensitivity characteristics of a typical CCD camera (NC300, Takenaka System Devices). It can be seen that sensitivity to infrared light is better than in Figure 1. In this way, there is a difference between the sensitivity of the human eye and that of a CCD camera.
Figures 3 and 4 show the relationship between brightness and distance for our LDR-50B (red) and GR (green) LED lights. Figure 3 shows the change of brightness, and the green light has a higher brightness than the red light. Figure 4 shows the change of CCD sensitivity, and in this case red has a higher brightness than green. (Brightness/luminosity meters are correlated to the spectral luminous efficiency of the human eye.)In this way, green appears brighter than red to the human eye, whereas red appears brighter than green to a CCD camera. A CCD camera is normally used for image processing, and thus we provide graphs showing CCD sensitivity change rather than brightness and luminosity values.
Determining the field of view of coaxial lightingTo help you better understand our LED light catalogue
Important points when using a red LED light and a CCD camera with a built-in infrared cutoff filter
Changes in CCD sensitivity due to illumination time for each color of LED
When using a red LED light, remove the infrared cutoff filter from the CCD camera. If the infrared cutoff filter is not removed, the light intensity will decrease by more than one half as the wavelength of red LED light is 660 nm.In addition, the light shifts toward infrared if it becomes hot, and thus heating will cause the image to darken.
120
100
80
60
40
20
00 10 20 30 40 50 60
Per
cent
age
of c
hang
e %
Elapsed time (minutes)
Measurement results Red light shows a sensitivity decrease of approximately 6%. Red light shows a sensitivity decrease of approximately 31% when an infrared filter is attached. White light shows an increase of approximately 2.6%. Green and blue show no change in sensitivity.
1.0
0.8
0.6
0.4
0.2
0400 500 600 700
Wavelength nm800 900 1000
Rel
ativ
e se
nsiti
vity
Color and model used Red LDR-50B Red (W/an infrared cut filter) LDR-50B White LDR-50B-SW Green LDR-50B-GR Blue LDR-50B-BL
Camera
Shutter speed
Camera Lens
F-Stop
Extension tube
Field of view
Power Supply
Volume Level
Temperature
Humidity
WD
LWD
Ingrared cut filter is used. The intensity is measured
on the light reflected from the standard white plate.
NC-300(Takenaka system)
1/60 Sec.
f25mm Lens
F-16
5mm
20mm
PSD-3012/3024
100%(Max)
25°C
50%
99mm
50mm
0.80.70.60.50.40.30.20.1
00 50 100 150
LWD mm (Light Working Distance)
CCD
sens
itivity
Red
Green
Object
Reflected light (1/2)
Diffusion Plate
LWD
'LW
D
Transmittedlight(1/2)
LED
Field of view V (field of view of camera WD, A to I)
Effective field of view Vb
Half mirror
CCD camera
VaVb
WD
LWD
'bLW
D'b
LWD
'aLW
D'a
CCD camera
Provisional emittingsurface positions A
Provisional emittingsurface positions B
Virtual emittingsurface positions B'
Virtual emittingsurface positions A'
A B C D E F G H I
Figure 2 Determining field of view by LWD
Figure 1 Cross-section of coaxial light
Figure 3 Field of view and effective field of view
Provisional emitting surface
Technology OverviewTechnology Overview An introduction to the characteristics of LED lighting
What to consider when selecting a lightWhat to consider when selecting a light
2
4
5
3
1
2
4
53
1
CCD sensitivity change and brightness distribution characteristics provide a good guideline for selecting a light based on the above conditions.
75 76
CCS Inc. will repair or replace the product free of charge if it should fail to function or if the radiant quantity of the product should drop to 50% or less of its initial radiant quantity within the specified warranty period.If either of these conditions occurs, please take the product to your CCS sales representative.
This warranty information provides the scope of CCS's product warranty within the specified period, and does not indicate or imply any further guarantee beyond the warranty terms.Contact CCS for inquiries or information on repairs to the product after the expiration of the warranty.
The radiant quantity refers to the wattage of physical energy radiated from a LED. It refers to the radiation luminosity of the LED measured under conditions specified by CCS or the radiation illumination of the LED under specified irradiation conditions. CCS specifies the radiant quantity for each LED light because the measurement and irradiation conditions vary from the form, the application and the irradiation wavelength.
Warranty Terms
Warranty Information
Warranty period:Two years (one year for radiant quantity), starting from CCS Inc. shipping date.
CCS Inc. will repair or replace the product free of charge if it should fail to function under normal use in accordance with the Instruction Guide and other written cautions during the indicated warranty period of two yearsCCS Inc. will repair or replace the product free of charge if its radiant quantity should drop to 50% or less of its initial radiant quantity under normal use in accordance with the Instruction Guide and other written cautions during the indicated warranty period of one year.CCS Inc. will charge a repair fee under the following conditions :
If the product has been subjected to misuse, unauthorized repairs, or modification from its original design.If the product has been damaged from impacts due to inappropriate handling.If damage to the product results from external causes including accidents, fire, pollution, riots, communication failures, earthquakes, thunderstorms, wind and flood damage, or any other act of providence, or from any extraordinary conditions such as electrical surges, water leakage, condensation, or the use of chemicals.If the damage results from connection to any power supply or to any equipment which CCS Inc. does not manufacture or does not specify for use.
1.
2.
3.
1) 2) 3)
4)
Note:
CCS's activities with regard to environmental issues
Environmentally friendlyEnvironmentally friendly
Please visit our website for detailed information on the RoHS Directive and product compliance with RoHS Directive.
http://www.ccs-grp.comPlease visit our website for detailed information on warranties.
http://www.ccs-grp.com
*1: Items listed in this brochure (Except for some products). *2,*3 : Visit our website for detailed information on the RoHS Directive and product compliance with the RoHS Directive.
CCS has achieved compliance with the RoHS
Directive for products including its standard
lineup of LED illuminators , power supplies ,
and optional accessories ,
and delivers RoHs compliant products
CCS has achieved compliance with the RoHS
Directive for products including its standard
lineup of LED illuminators , power supplies ,
and optional accessories ,
and delivers RoHs compliant products
*1 *1
*2 *3
I t is our desire to contribute to society through dissemination of LED illuminators.
*1
77 78
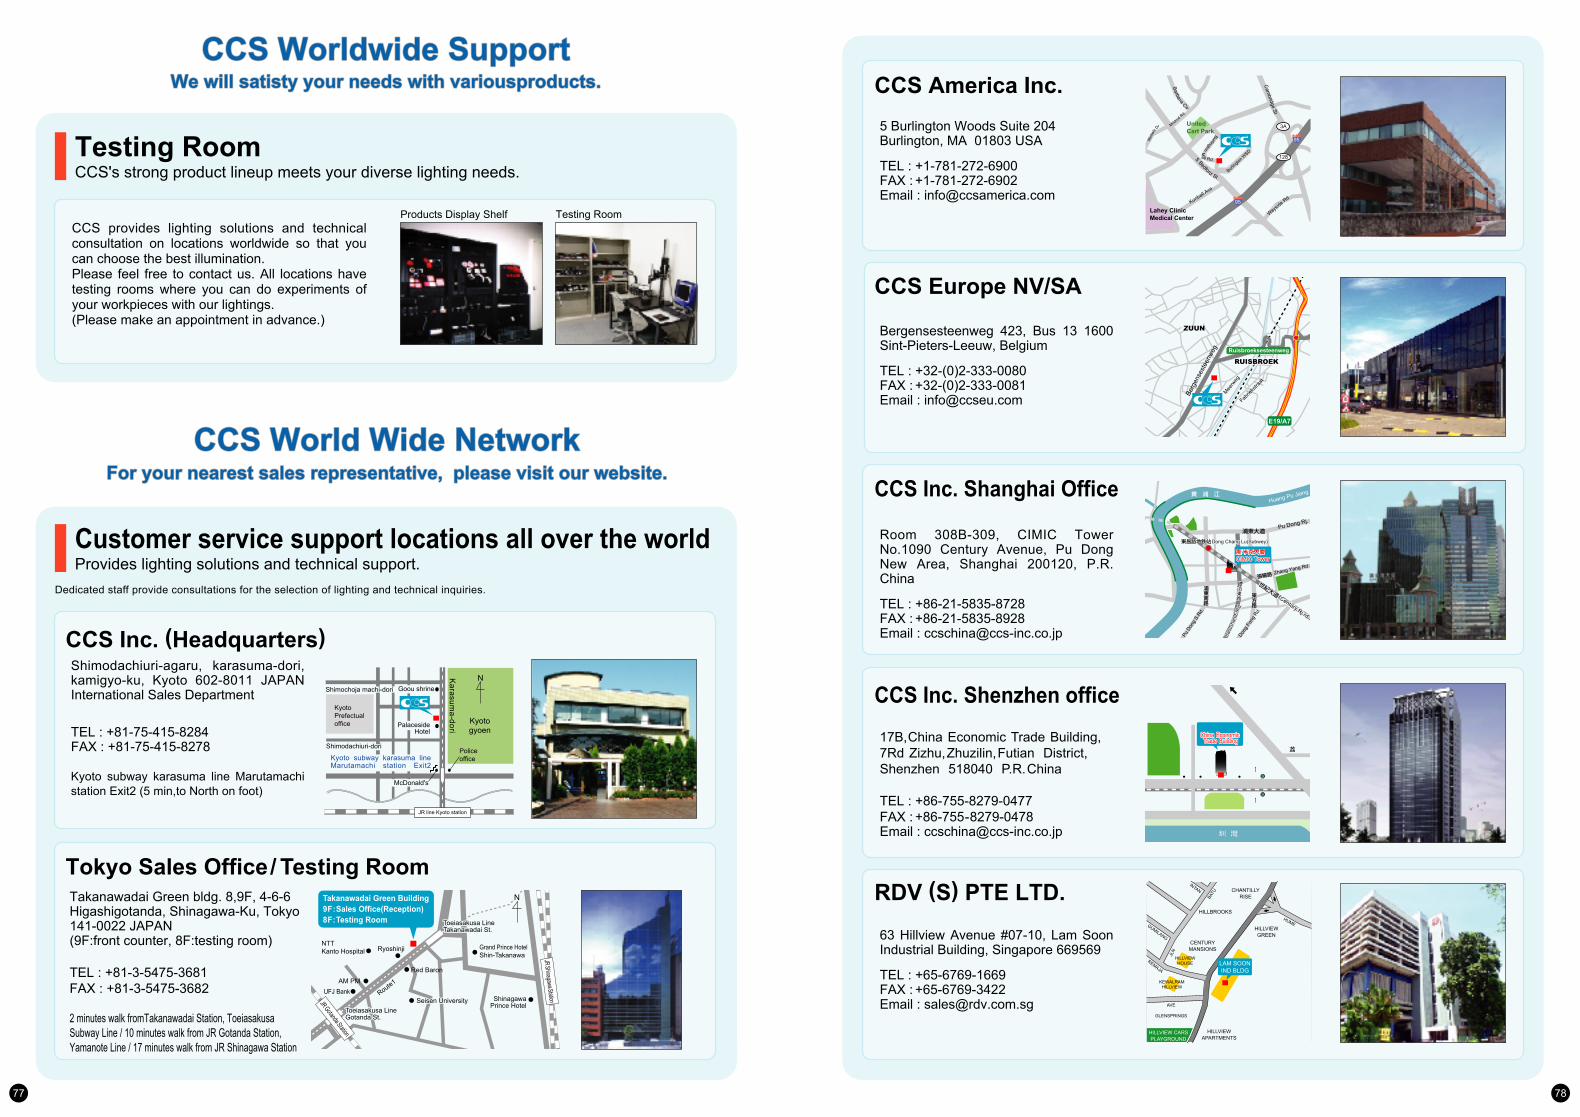
CCS Worldwide SupportWe will satisty your needs with variousproducts.
CCS World Wide NetworkFor your nearest sales representative, please visit our website.
CCS Worldwide SupportWe will satisty your needs with variousproducts.
CCS provides lighting solutions and technical consultation on locations worldwide so that you can choose the best illumination.Please feel free to contact us. All locations have testing rooms where you can do experiments of your workpieces with our lightings.(Please make an appointment in advance.)
Testing RoomProducts Display Shelf
CCS World Wide Network
CCS Europe NV/SA
Bergensesteenweg 423, Bus 13 1600 Sint-Pieters-Leeuw, Belgium
TEL : +32-(0)2-333-0080FAX : +32-(0)2-333-0081Email : [email protected]
RDV (S) PTE LTD.
63 Hillview Avenue #07-10, Lam Soon Industrial Building, Singapore 669569
TEL : +65-6769-1669FAX : +65-6769-3422Email : [email protected]
CCS Inc. Shanghai Office
Room 308B-309, CIMIC Tower No.1090 Century Avenue, Pu Dong New Area, Shanghai 200120, P.R. China
TEL : +86-21-5835-8728FAX : +86-21-5835-8928Email : [email protected]
CCS America Inc.5 Burlington Woods Suite 204Burlington, MA 01803 USA
TEL : +1-781-272-6900FAX : +1-781-272-6902Email : [email protected]
CCS Inc. (Headquarters)
Tokyo Sales Office/ Testing Room
Shimodachiuri-agaru, karasuma-dori, kamigyo-ku, Kyoto 602-8011 JAPAN International Sales Department
TEL : +81-75-415-8284FAX : +81-75-415-8278
Kyoto subway karasuma line Marutamachi station Exit2 (5 min,to North on foot)
PalacesideHotel
Goou shrine
Policeoffice
McDonald's
Karasum
a-dori
Kyotogyoen
KyotoPrefectualoffice
N
JR line Kyoto station
Kyoto subway karasuma line Marutamachi station Exit2
Shimochoja machi-dori
Shimodachiuri-dori
Testing RoomCCS's strong product lineup meets your diverse lighting needs.
Dedicated staff provide consultations for the selection of lighting and technical inquiries.
For your nearest sales representative, please visit our website.
CCS Inc. Shenzhen office17B,China Economic Trade Building,7Rd Zizhu,Zhuzilin,Futian District,Shenzhen 518040 P.R.China
TEL : +86-755-8279-0477FAX : +86-755-8279-0478 Email : [email protected]
NTT Kanto Hospital Ryoshinji Grand Prince Hotel
Shin-Takanawa
UFJ BankAM PM
Route 1
Seisen UniversitySeisen University
Red Baron
ShinagawaPrince Hotel
Toeiasakusa LineTakanawadai St.Toeiasakusa LineTakanawadai St.
Toeiasakusa LineGotanda St.Toeiasakusa LineGotanda St.
JR Shinagawa StationJR Gotanda Station
NNTakanawadai Green bldg. 8,9F, 4-6-6 Higashigotanda, Shinagawa-Ku, Tokyo 141-0022 JAPAN(9F:front counter, 8F:testing room)
TEL : +81-3-5475-3681 FAX : +81-3-5475-3682
2 minutes walk fromTakanawadai Station, Toeiasakusa Subway Line / 10 minutes walk from JR Gotanda Station, Yamanote Line / 17 minutes walk from JR Shinagawa Station
Kunball Ave
128
3A
95
95
Lahey ClinicMedical Center
Mildred R
d
Barbara Cir
Mich
ele Dr
Wayside Rd
Cam
bridge St
Burlington Ma
ll RdS Bedford St
UnitedCart Park
Burling
ton W
SD
E19/A7
Ruisbroeksesteenweg
ZUUN
Berg
ense
stee
nweg
Meerw
eg
RUISBROEKRUISBROEK
Fabrie
kstra
at
HUMEHILLVIEWGREEN
CHANTILLYRISE
HILLBROOKS
INTAN
BATU
CENTURYMANSIONS
HILLVIEWHOUSE
GUMILANG
JLN
REMAJA
KEWALRAMHILLVIEW
AVE
GLENSPRINGS
HILLVIEWAPARTMENTS
HILLVIEW CARSPLAYGROUND
LAM SOONIND BLDG
Pu D
ong
S.Rd
.
Dong
Fong
Rd.
Pu Dong Rj.
Zhang Yang Rd.
Huang Pu Jiang
Lao
Shan
E.R
d.
Lao
Shan
E.R
d.
Century Rj rd.
Century Rj rd.
Dong Chang Lu(Subwey)Dong Chang Lu(Subwey)
CIMIC TowerCIMIC Tower
Customer service support locations all over the worldProvides lighting solutions and technical support.
廣 深 高 速 公 路
紅 西路
農林路
交通局大廈
招商銀行大厦
光大銀行大廈
紅樹林路
敦煌大廈
財富廣場
本元大廈
深航酒店
地鐵1號綫竹子林站
地鐵1號綫竹子林站
園博園
人才公園( 擬建中)
濱 海 大 道
深 南 大 道
深
往皇崗口岸方向
往CB D中心區
往機場方向
中国経貿大廈中国経貿大廈China Economic
Trade BuildingChina Economic
Trade Building
Takanawadai Green Building9F:Sales Office(Reception)8F:Testing Room
Notes:
Examples of workpiece imaging in this catalog are a guide that may be informative for choosing illuminations. Please check the functions of the equipment and requirements when choosing.In addition, the sample workpieces that are used are processed by us and do not represent the original quality and performance.
Carefully read the product's instruction manual before use to ensure correct operation. Product specifications and design are subject to change without notice.
Many of our products are protected by industrial property rights (patents, industrial designs, and trademarks). Be warned against imitations of CCS brand.
*
HeadquartersShimodachiuri-agaru, Karasuma-dori, Kamigyo-ku, Kyoto 602-8011 JapanPhone: +81-75-415-8284 / Fax: +81-75-415-8278
URL: http://www.ccs-grp.com E-mail: [email protected]
Copyright(c) 2008 CCS Inc. All Rights Reserved.Description in this catalog is based on the information as of April 2008. 02001-10-0409