overview of coal mining industry in india · pdf fileoverview of coal mining industry in india...
TRANSCRIPT
OVERVIEW OF COAL MINING INDUSTRY IN INDIA
FUTURE PROSPECTS AND POSSIBILITIES
PARTHA S. BHATTACHARYYACHAIRMAN, COAL INDIA LIMITED
05-07Th. JUNE 2007
GOVT. OF INDIA
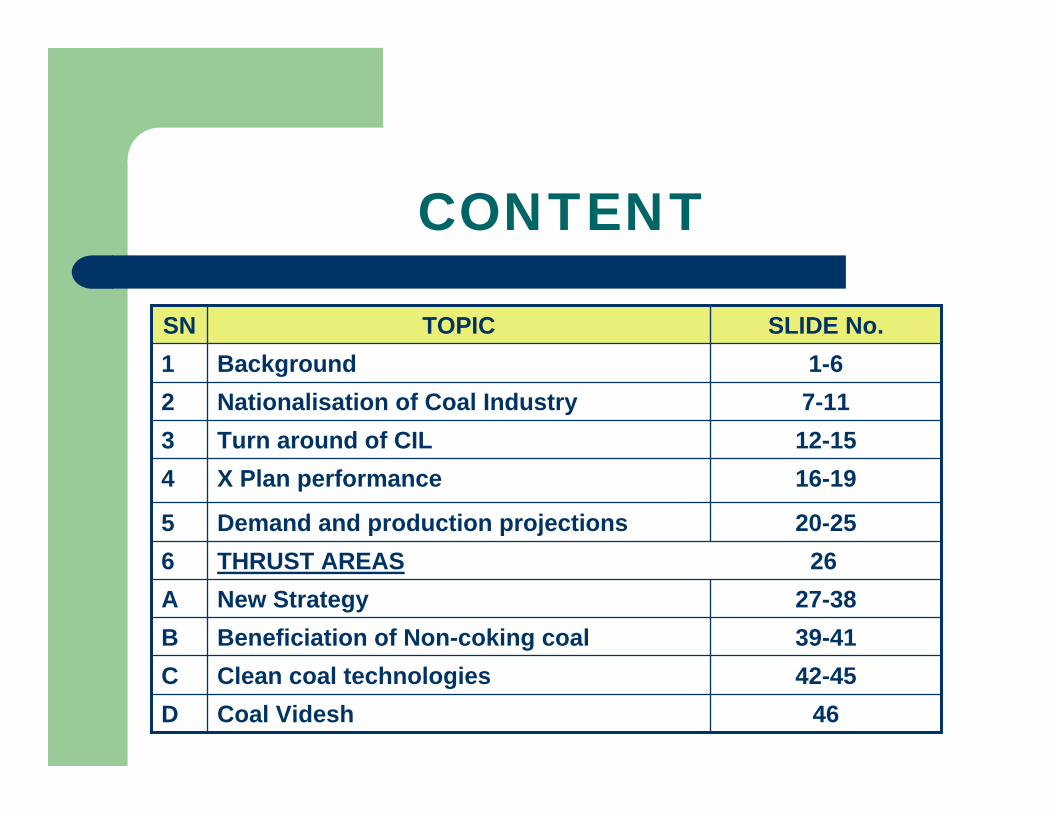
CONTENT
THRUST AREAS 266
1-6Background1
46Coal VideshD42-45Clean coal technologiesC39-41Beneficiation of Non-coking coalB27-38New StrategyA
20-25Demand and production projections5
16-19X Plan performance412-15Turn around of CIL37-11Nationalisation of Coal Industry2
SLIDE No.TOPICSN
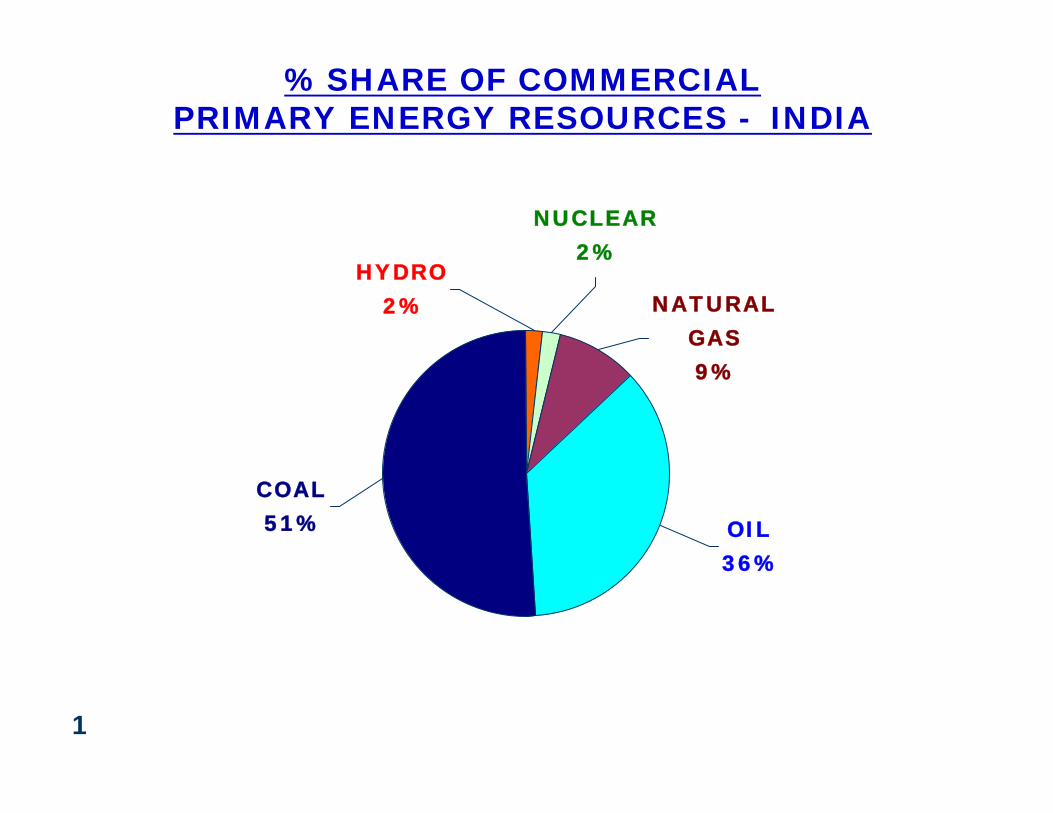
COAL51% OIL
36%
NUCLEAR2%
HYDRO2% NATURAL
GAS9%
% SHARE OF COMMERCIAL PRIMARY ENERGY RESOURCES - INDIA
1
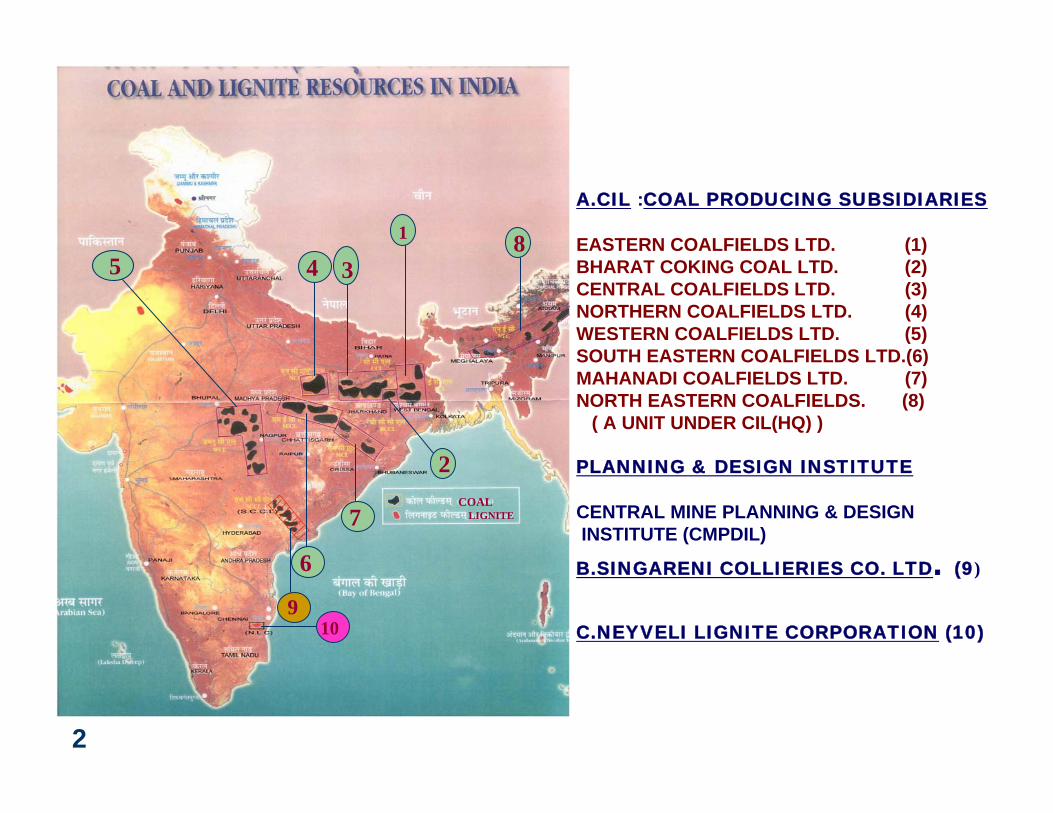
A.CIL :COAL PRODUCING SUBSIDIARIES
EASTERN COALFIELDS LTD. (1)BHARAT COKING COAL LTD. (2)CENTRAL COALFIELDS LTD. (3)NORTHERN COALFIELDS LTD. (4)WESTERN COALFIELDS LTD. (5)SOUTH EASTERN COALFIELDS LTD.(6)MAHANADI COALFIELDS LTD. (7)NORTH EASTERN COALFIELDS. (8)
( A UNIT UNDER CIL(HQ) )
PLANNING & DESIGN INSTITUTE
CENTRAL MINE PLANNING & DESIGNINSTITUTE (CMPDIL)
B.SINGARENI COLLIERIES CO. LTD. (9)
C.NEYVELI LIGNITE CORPORATION (10)
1
2
345
6
7
9
8
10
COALLIGNITE
2
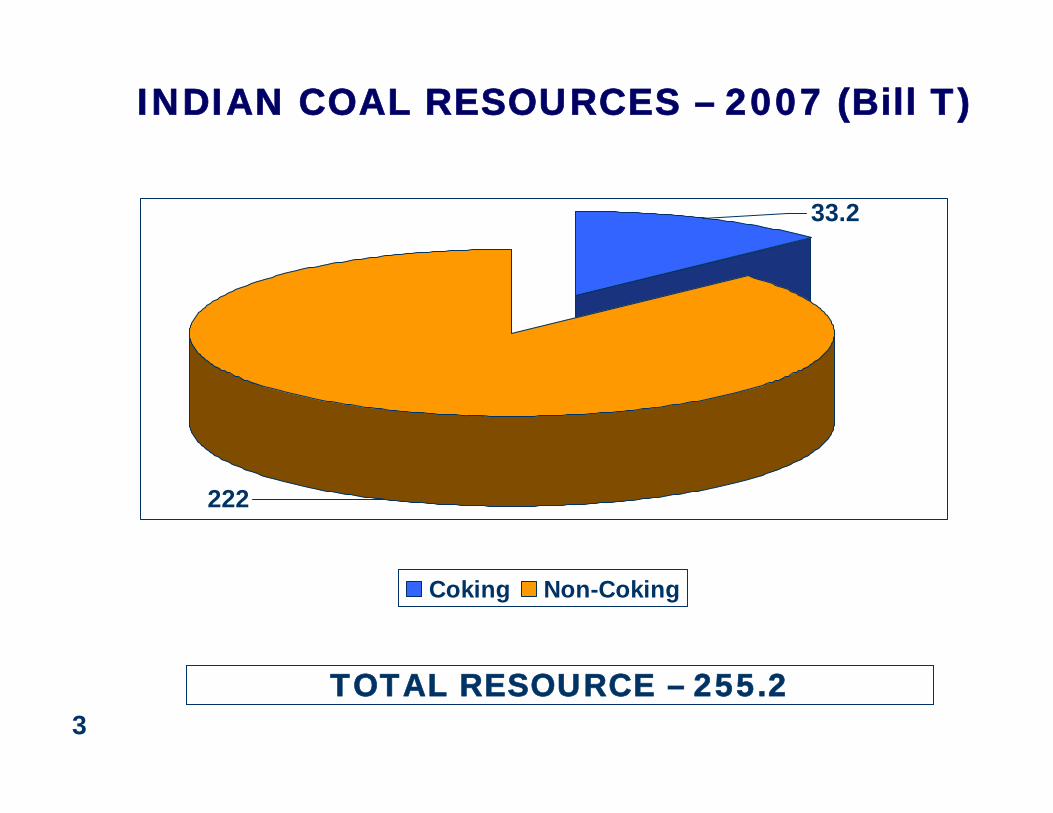
TOTAL RESOURCE – 255.2
INDIAN COAL RESOURCES – 2007 (Bill T)
33.2
222
Coking Non-Coking
3
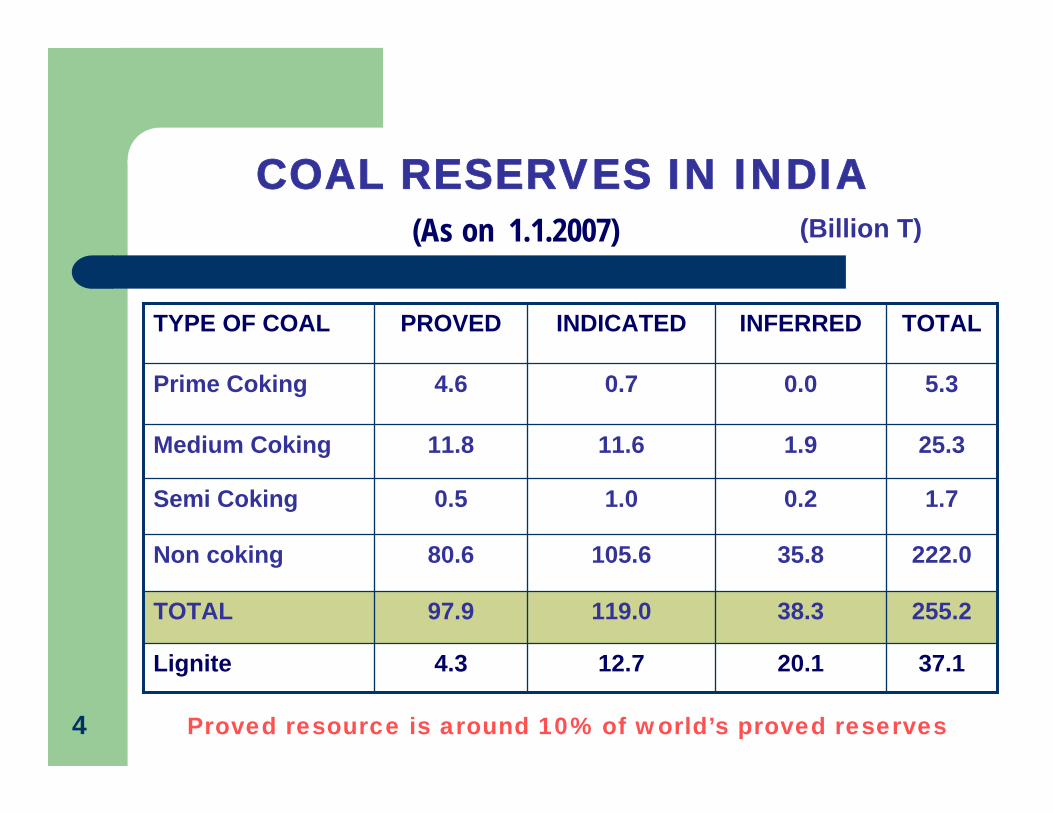
COAL RESERVES IN INDIA
37.120.112.74.3Lignite
255.238.3119.097.9TOTAL
222.035.8105.680.6Non coking
1.70.21.00.5Semi Coking
25.31.911.611.8Medium Coking
5.30.00.74.6Prime Coking
TOTALINFERREDINDICATEDPROVEDTYPE OF COAL
(Billion T)(As on 1.1.2007)
Proved resource is around 10% of world’s proved reserves4
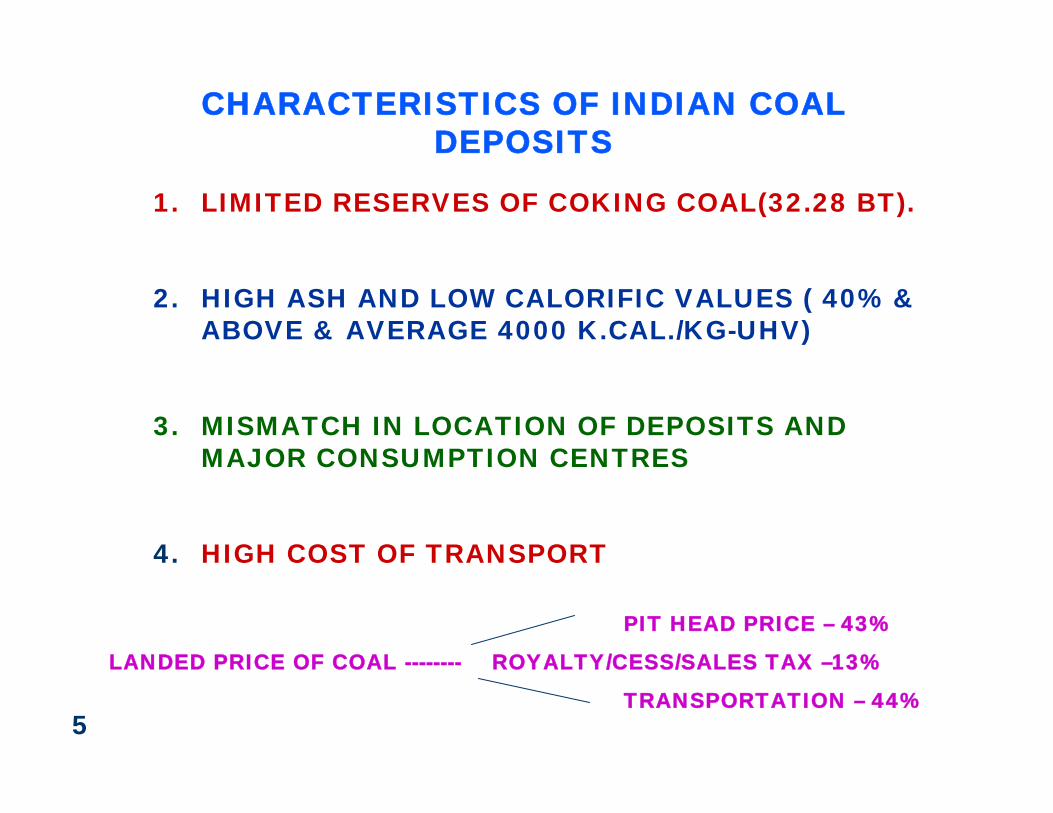
CHARACTERISTICS OF INDIAN COAL DEPOSITS
1. LIMITED RESERVES OF COKING COAL(32.28 BT).
2. HIGH ASH AND LOW CALORIFIC VALUES ( 40% & ABOVE & AVERAGE 4000 K.CAL./KG-UHV)
3. MISMATCH IN LOCATION OF DEPOSITS AND MAJOR CONSUMPTION CENTRES
4. HIGH COST OF TRANSPORT
PIT HEAD PRICE – 43%
LANDED PRICE OF COAL -------- ROYALTY/CESS/SALES TAX –13%
TRANSPORTATION – 44%5
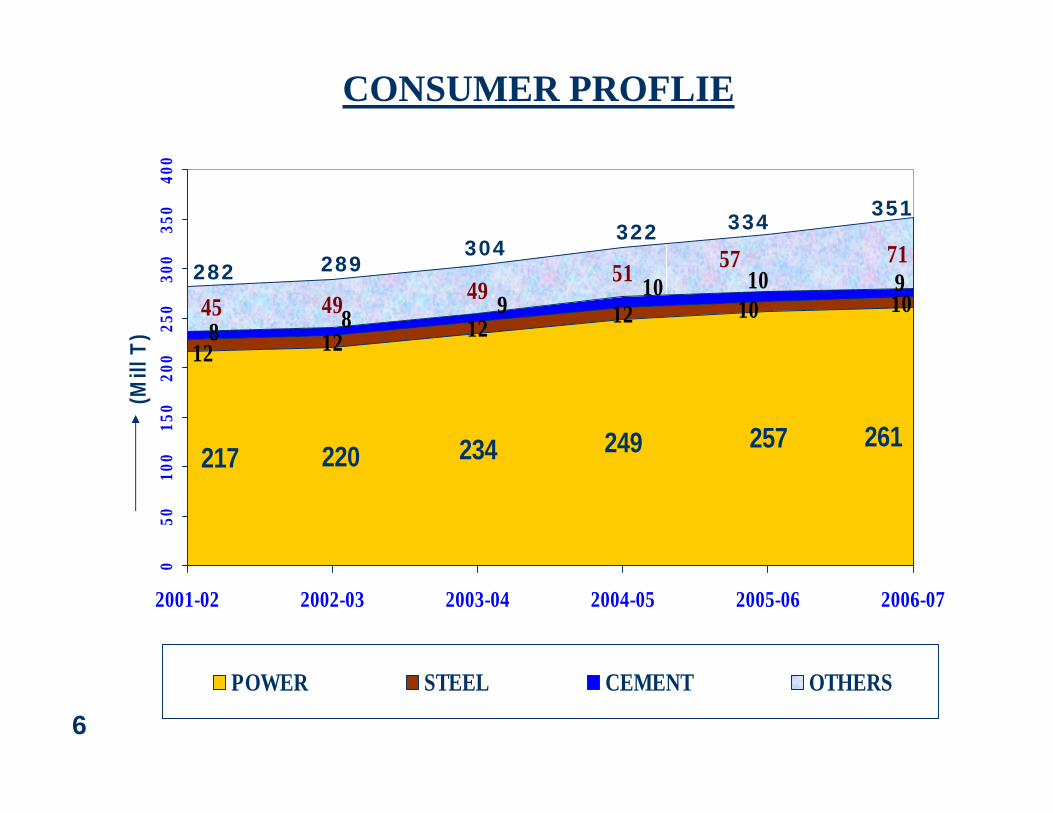
234 249 257
12 12 1249 4951
261220217
12
10 101010
988
971
45
57
050
100
150
200
250
300
350
400
2001-02 2002-03 2003-04 2004-05 2005-06 2006-07
(Mill
T)
POWER STEEL CEMENT OTHERS
CONSUMER PROFLIE
282 289304
322 334 351
6
NATIONALISATION OF COAL INDUSTRY
• Pursuant to a Oil price shock a high power committee was formed in early 1970s.
• The Committee identified - Coal as the mainstay for future energy requirements.
7
• Growth of coal Industry was sluggish prior to 1970s – less than 2% per annum.
• Private investment was not forthcoming due to non-remunerative coal price.
• Hiking Coal price was not feasible.
• Substantial investment was required to reach a level of 5.5% growth to sustain GDP growth of 5%.
8
• The situation necessitated channelising public funds into coal mining.
• Mainly for these reason, Coal mining was nationalised between 1971 & 1973.
• Coal India was formed as PSU in Nov 1975.
• During 1975-91 massive investment by Govt. helped to achieve a growth rate of 5.3%
• ‘Coal at any cost’ continued to dominate the investment strategy during this period. 9
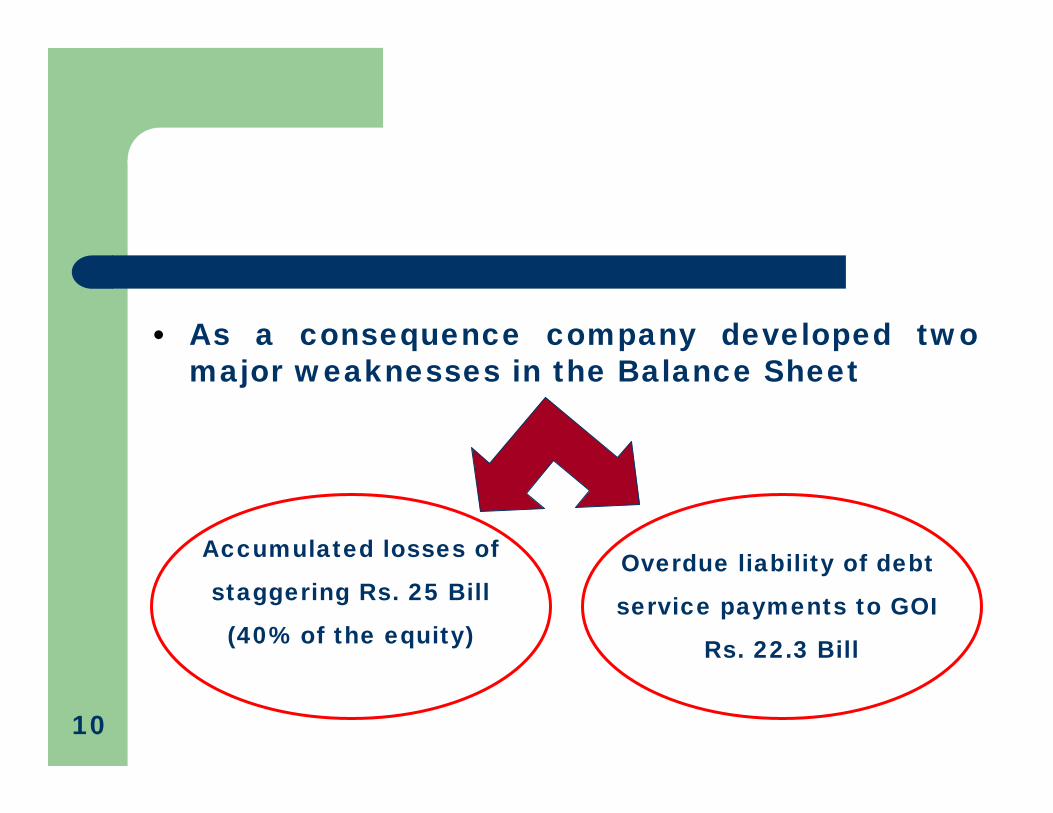
• As a consequence company developed two major weaknesses in the Balance Sheet
Accumulated losses of
staggering Rs. 25 Bill
(40% of the equity)
Overdue liability of debt
service payments to GOI
Rs. 22.3 Bill
10
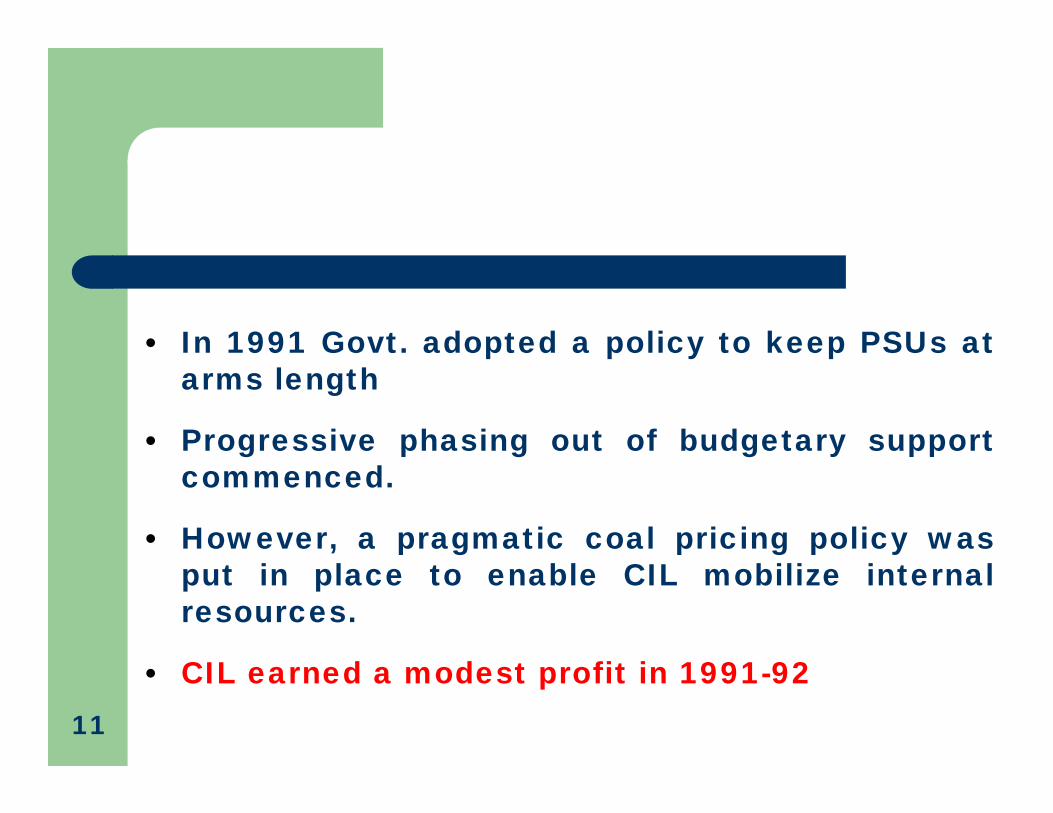
• In 1991 Govt. adopted a policy to keep PSUs at arms length
• Progressive phasing out of budgetary support commenced.
• However, a pragmatic coal pricing policy was put in place to enable CIL mobilize internal resources.
• CIL earned a modest profit in 1991-9211
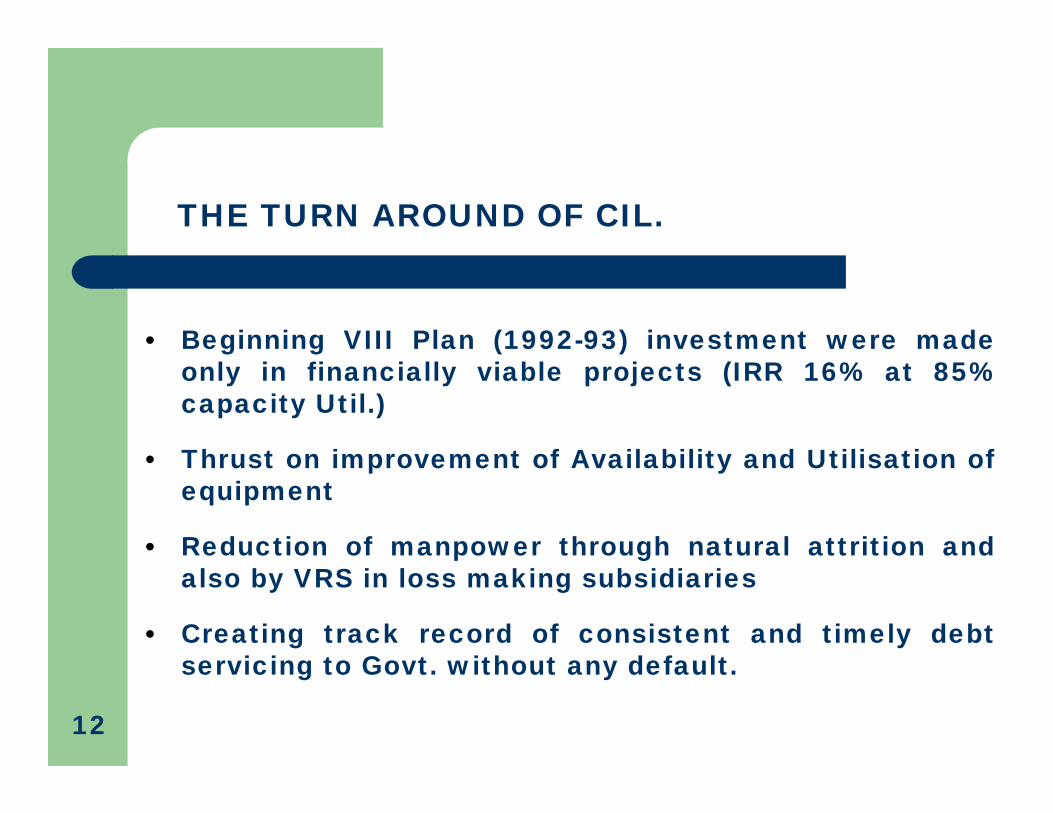
• Beginning VIII Plan (1992-93) investment were made only in financially viable projects (IRR 16% at 85% capacity Util.)
• Thrust on improvement of Availability and Utilisation of equipment
• Reduction of manpower through natural attrition and also by VRS in loss making subsidiaries
• Creating track record of consistent and timely debt servicing to Govt. without any default.
THE TURN AROUND OF CIL.
12
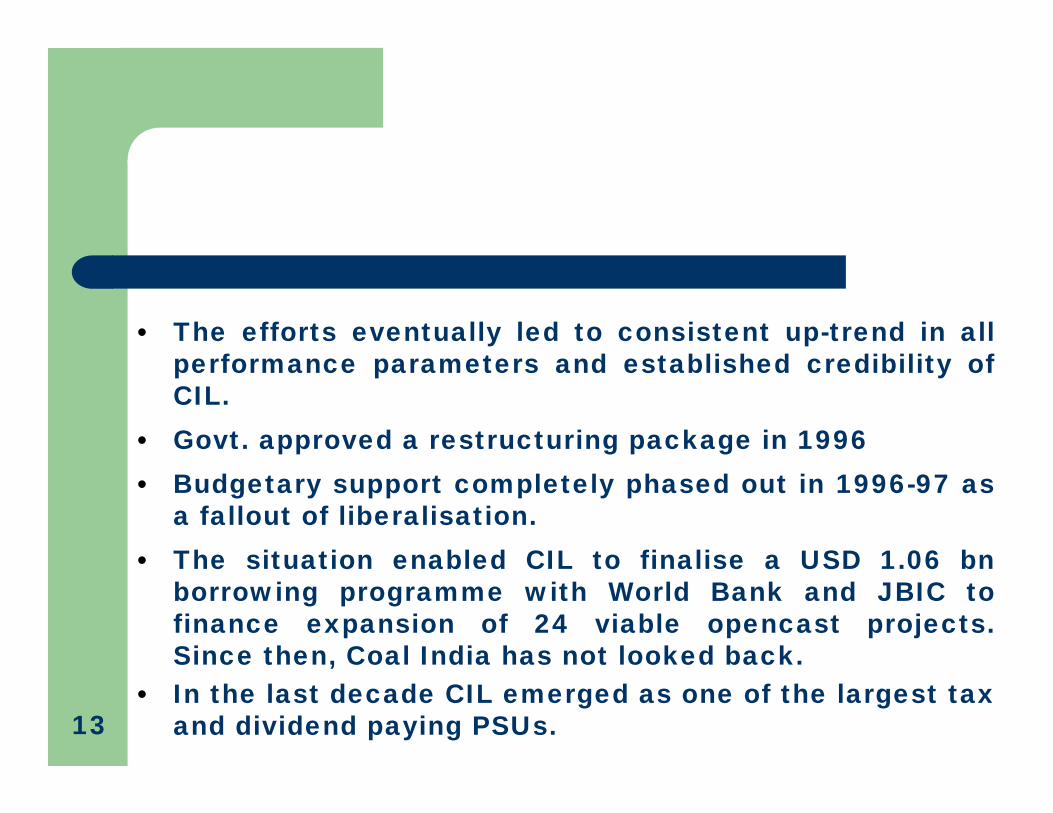
• The efforts eventually led to consistent up-trend in all performance parameters and established credibility of CIL.
• Govt. approved a restructuring package in 1996• Budgetary support completely phased out in 1996-97 as
a fallout of liberalisation.• The situation enabled CIL to finalise a USD 1.06 bn
borrowing programme with World Bank and JBIC to finance expansion of 24 viable opencast projects. Since then, Coal India has not looked back.
• In the last decade CIL emerged as one of the largest tax and dividend paying PSUs.13
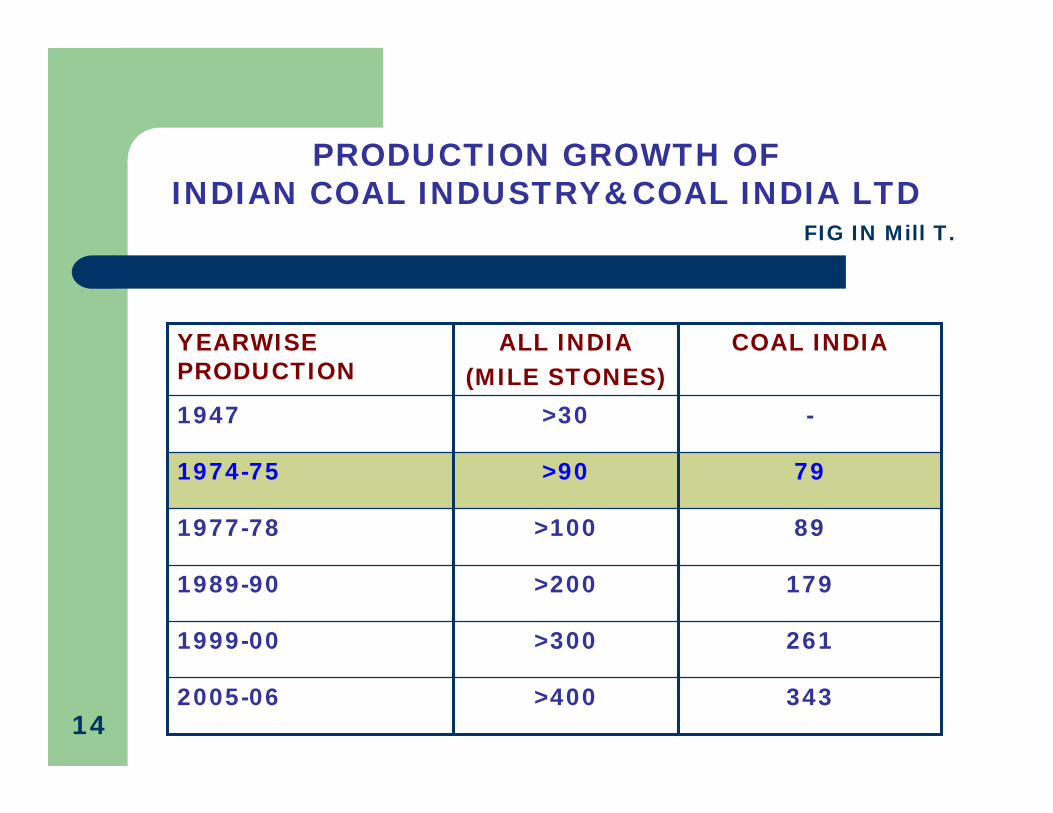
79>901974-75
89>1001977-78
261>3001999-00
343>4002005-06
179>2001989-90
->301947
COAL INDIAALL INDIA(MILE STONES)
YEARWISE PRODUCTION
PRODUCTION GROWTH OF INDIAN COAL INDUSTRY&COAL INDIA LTD
FIG IN Mill T.
14
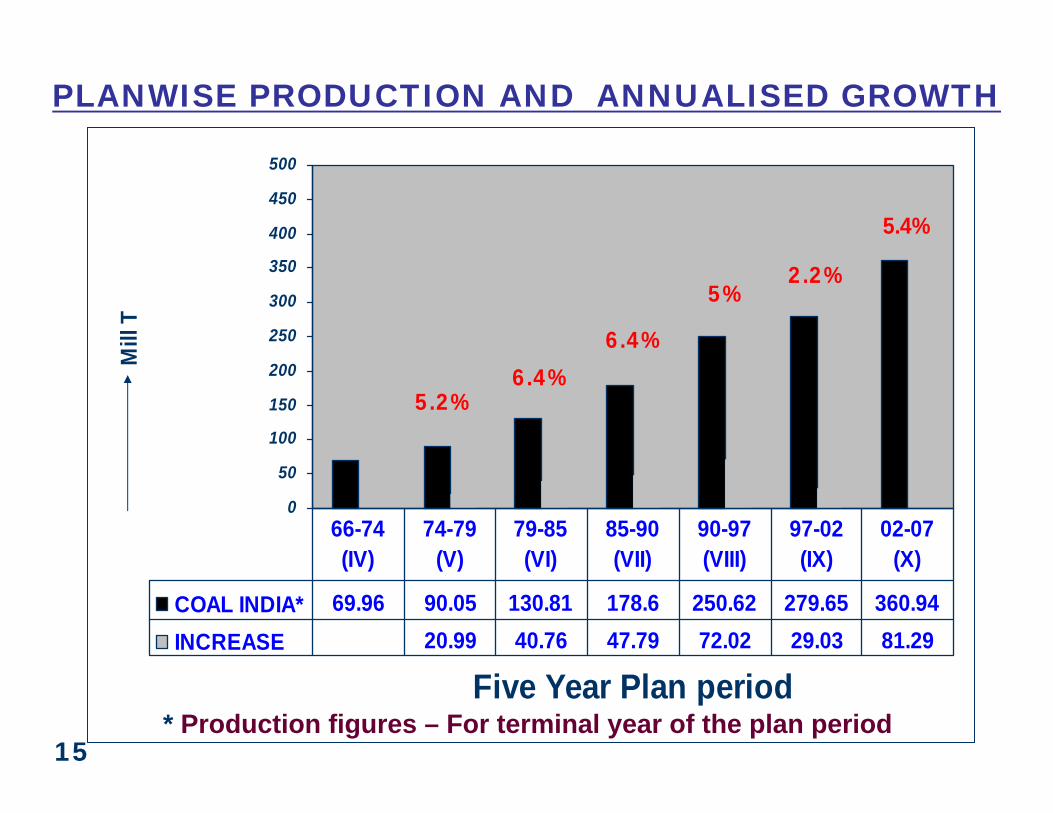
5.4%
2.2%5%
6.4%6.4%
5.2%
0
50
100
150
200
250
300
350
400
450
500
Five Year Plan period
Mill
T
COAL INDIA* 69.96 90.05 130.81 178.6 250.62 279.65 360.94INCREASE 20.99 40.76 47.79 72.02 29.03 81.29
66-74 (IV)
74-79 (V)
79-85 (VI)
85-90 (VII)
90-97 (VIII)
97-02 (IX)
02-07 (X)
PLANWISE PRODUCTION AND ANNUALISED GROWTH
* Production figures – For terminal year of the plan period15
X PLAN PERFORMANCE
• During X Plan period the company has augmented coal production by 81 Mill T.
• Aggregate payment to the Govt. of India by way of corporate tax, dividends and tax on dividend Rs.164 bn (USD 3.66 bn)
• In 06-07 alone CIL earned pre-tax provisional & estimated profit of Rs. 82.12 bn (USD 1.88 bn)
• Paid Rs. 30.20 bn (USD 0.69 bn) as corporate tax, dividend and tax on dividend.
16
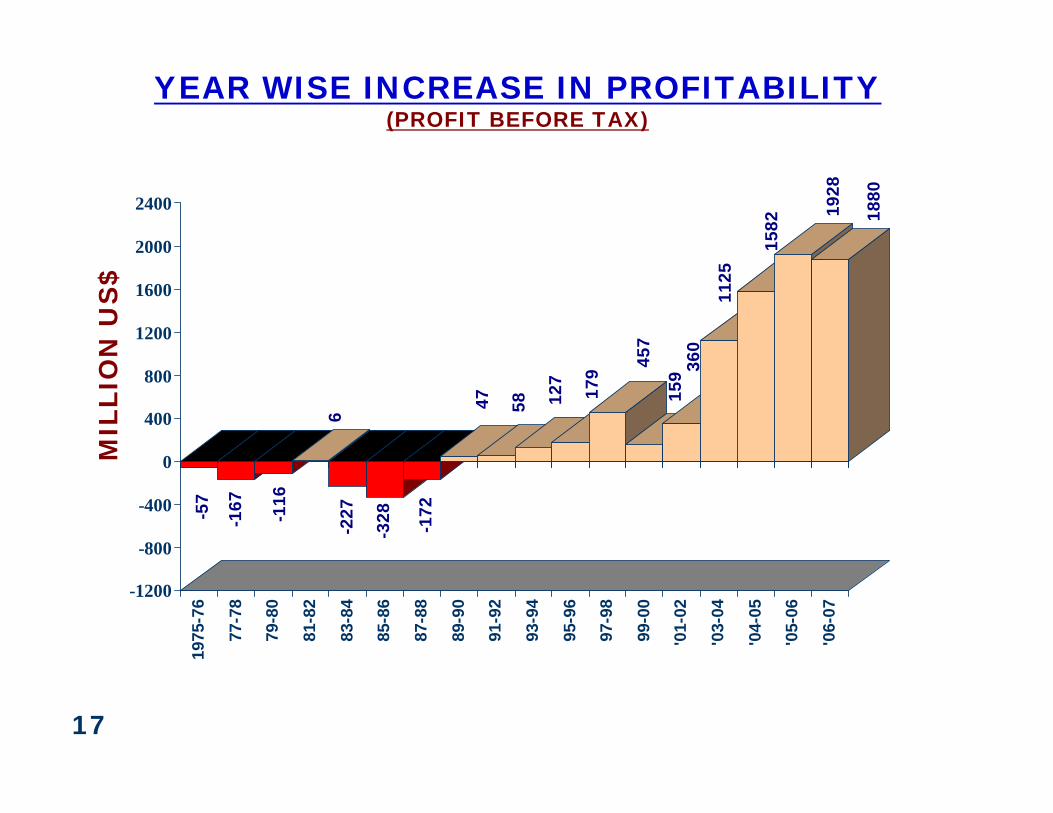
YEAR WISE INCREASE IN PROFITABILITY(PROFIT BEFORE TAX)
MIL
LIO
N U
S$
-57
-167 -116
6-2
27
-328 -172
47 58 127
179 45
7
159 36
0
1125
1582
1928
1880
-1200
-800
-400
0
400
800
1200
1600
2000
240019
75-7
6
77-7
8
79-8
0
81-8
2
83-8
4
85-8
6
87-8
8
89-9
0
91-9
2
93-9
4
95-9
6
97-9
8
99-0
0
'01-
02
'03-
04
'04-
05
'05-
06
'06-
07
17
• CIL has secured AAA the highest credit rating by CRISIL in 2005-06 reaffirmed for 06-07
• Highest credit rating LAAA↑ by ICRA.
• This is despite CIL supplying coal to its core sector consumers at a competitive price per energy unit at consumption point vis-a-vis imported coal.
18
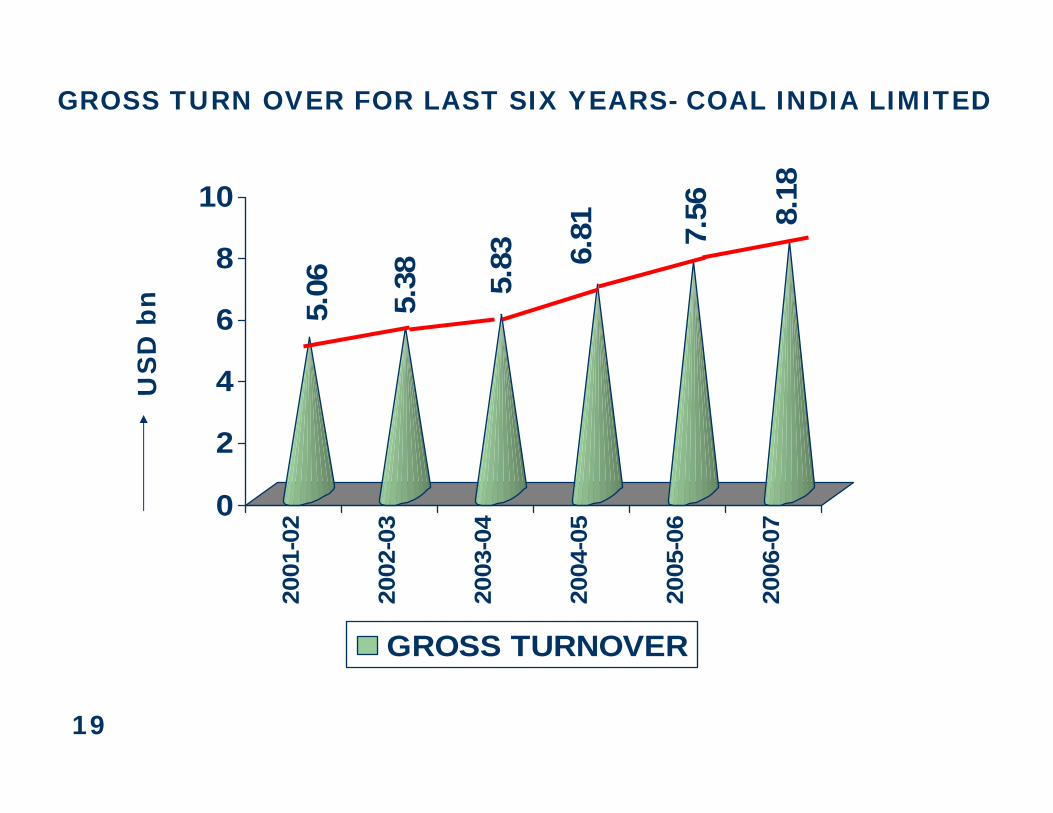
5.06 5.38 5.
83 6.81 7.
56 8.18
0
2
4
6
8
10
2001
-02
2002
-03
2003
-04
2004
-05
2005
-06
2006
-07
GROSS TURNOVER
GROSS TURN OVER FOR LAST SIX YEARS- COAL INDIA LIMITED
US
D b
n
19
Demand and production projections
20
PRIOR TO1972-73 1970 S EARLY
1990 S1996 2000-06
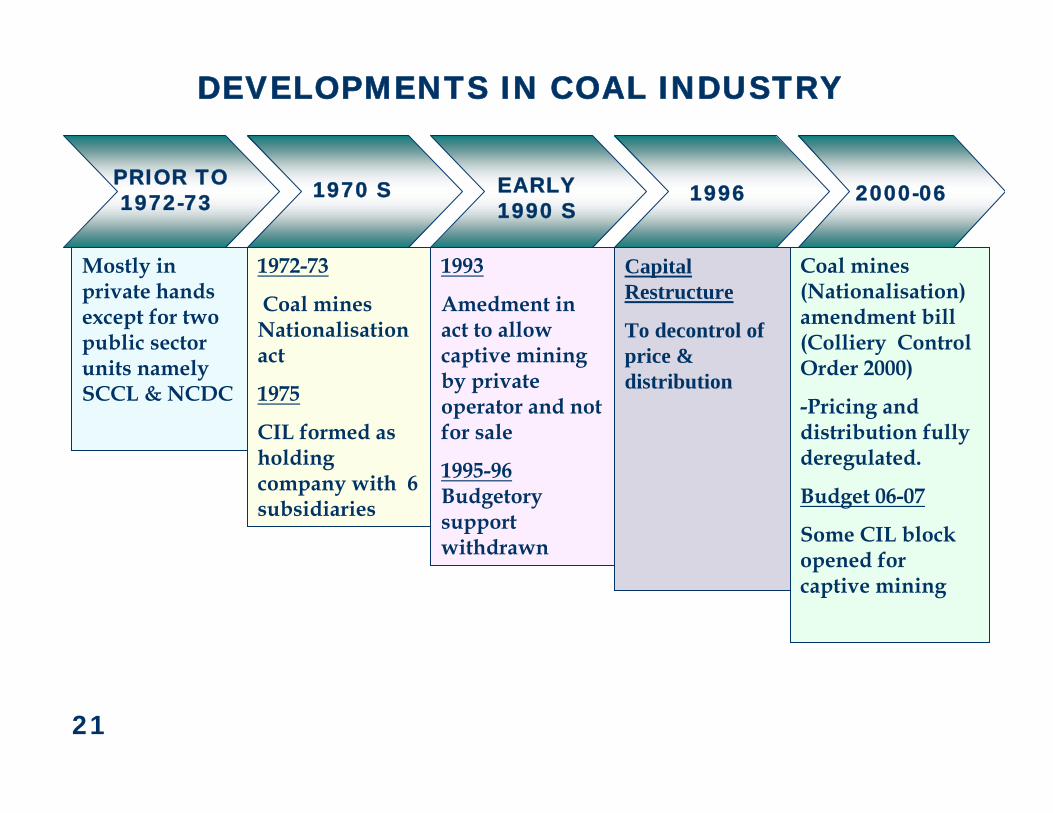
Mostly in private hands except for two public sector units namely SCCL & NCDC
1972-73
Coal mines Nationalisationact
1975
CIL formed as holding company with 6 subsidiaries
DEVELOPMENTS IN COAL INDUSTRY
1993
Amedment in act to allow captive mining by private operator and not for sale
1995-96Budgetorysupport withdrawn
Capital Restructure
To decontrol of price & distribution
Coal mines (Nationalisation) amendment bill (Colliery Control Order 2000)
-Pricing and distribution fully deregulated.
Budget 06-07
Some CIL block opened for captive mining
21
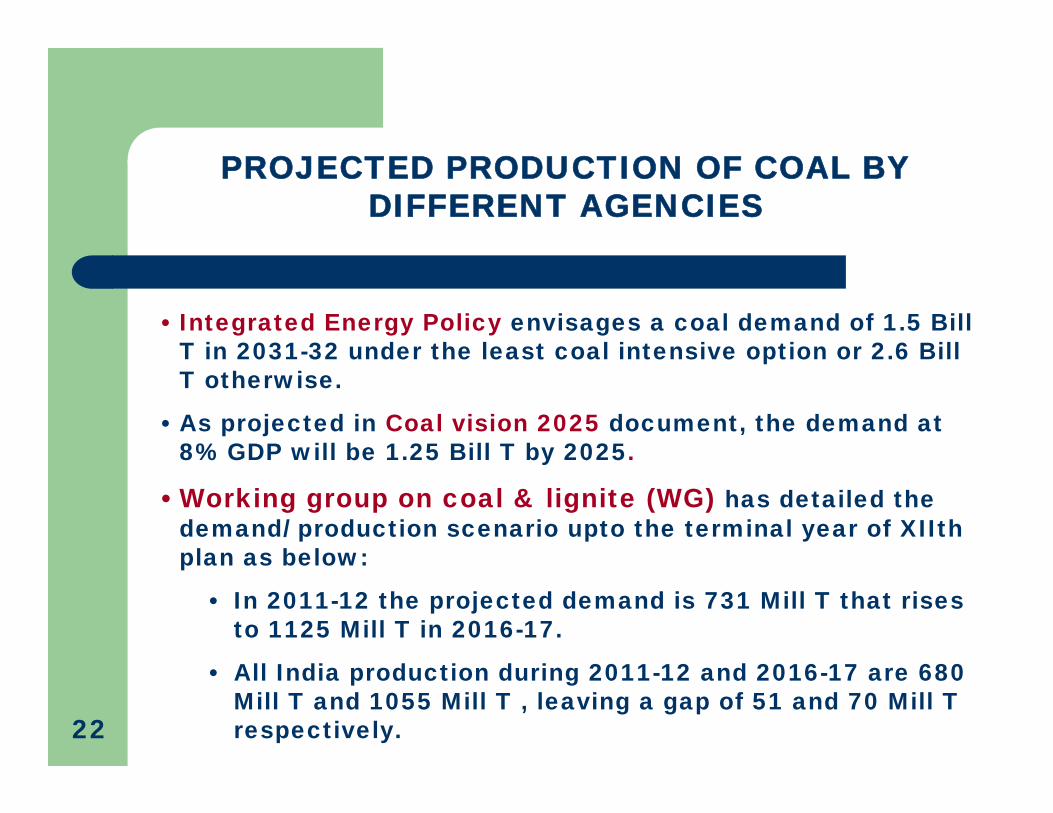
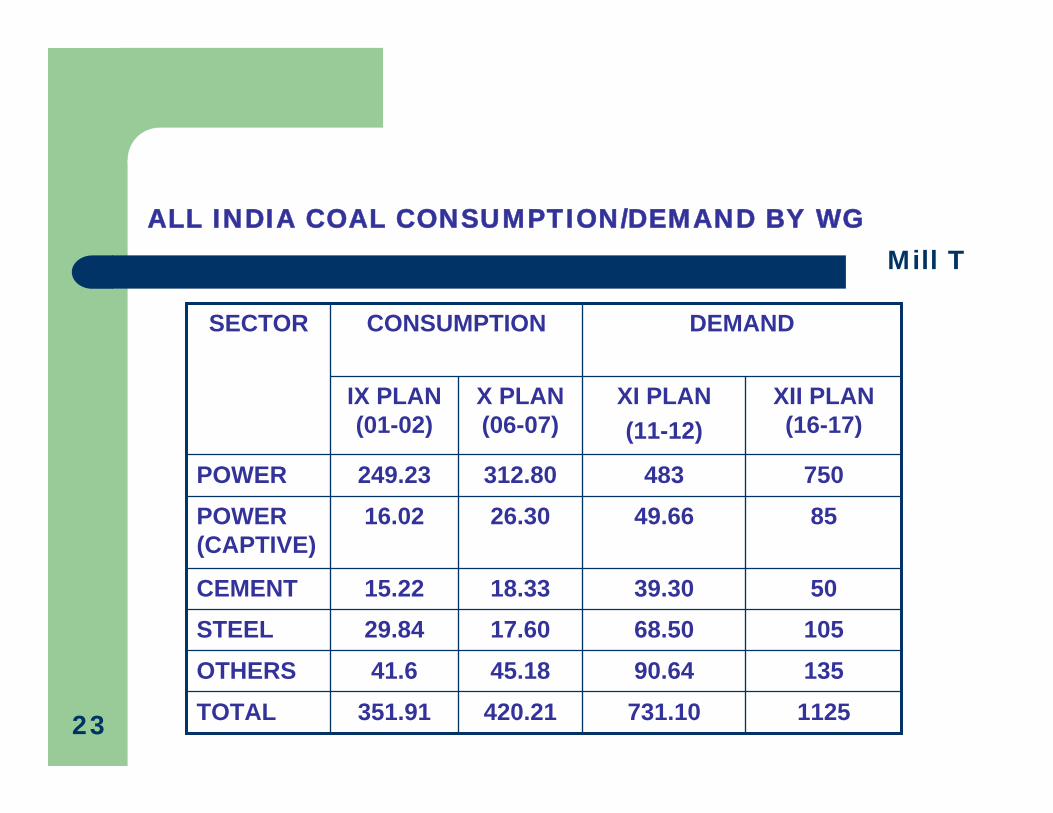
• Integrated Energy Policy envisages a coal demand of 1.5 Bill T in 2031-32 under the least coal intensive option or 2.6 Bill T otherwise.
• As projected in Coal vision 2025 document, the demand at 8% GDP will be 1.25 Bill T by 2025.
• Working group on coal & lignite (WG) has detailed the demand/ production scenario upto the terminal year of XIIthplan as below:
• In 2011-12 the projected demand is 731 Mill T that rises to 1125 Mill T in 2016-17.
• All India production during 2011-12 and 2016-17 are 680 Mill T and 1055 Mill T , leaving a gap of 51 and 70 Mill T respectively.
PROJECTED PRODUCTION OF COAL BY DIFFERENT AGENCIES
22
10568.5017.6029.84STEEL13590.6445.1841.6OTHERS
IX PLAN (01-02)
X PLAN (06-07)
420.21
18.33
26.30312.80
1125
50
85750
XII PLAN (16-17)
731.10
39.30
49.66483
XI PLAN (11-12)
DEMAND
TOTAL
CEMENT
POWER (CAPTIVE)
POWER
SECTOR
351.91
15.22
16.02249.23
CONSUMPTION
ALL INDIA COAL CONSUMPTION/DEMAND BY WGMill T
23
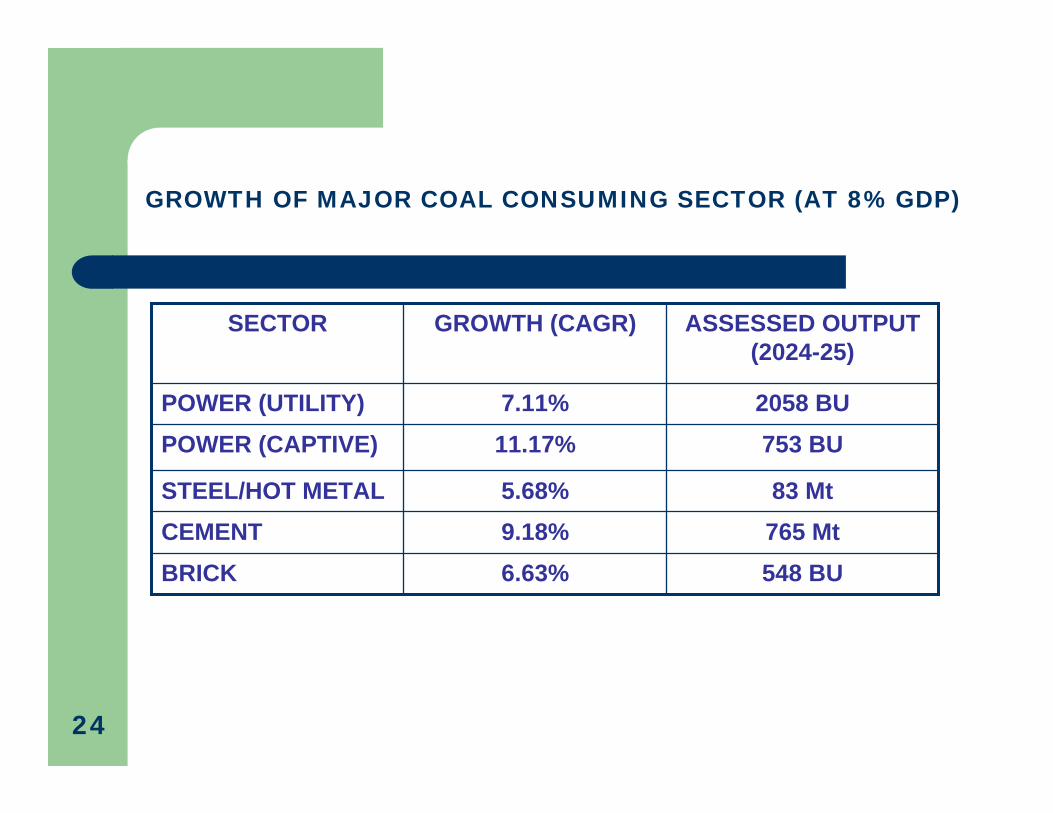
765 Mt9.18%CEMENT548 BU 6.63%BRICK
83 Mt
753 BU2058 BU
ASSESSED OUTPUT (2024-25)
STEEL/HOT METAL
POWER (CAPTIVE)POWER (UTILITY)
SECTOR
5.68%
11.17%7.11%
GROWTH (CAGR)
GROWTH OF MAJOR COAL CONSUMING SECTOR (AT 8% GDP)
24
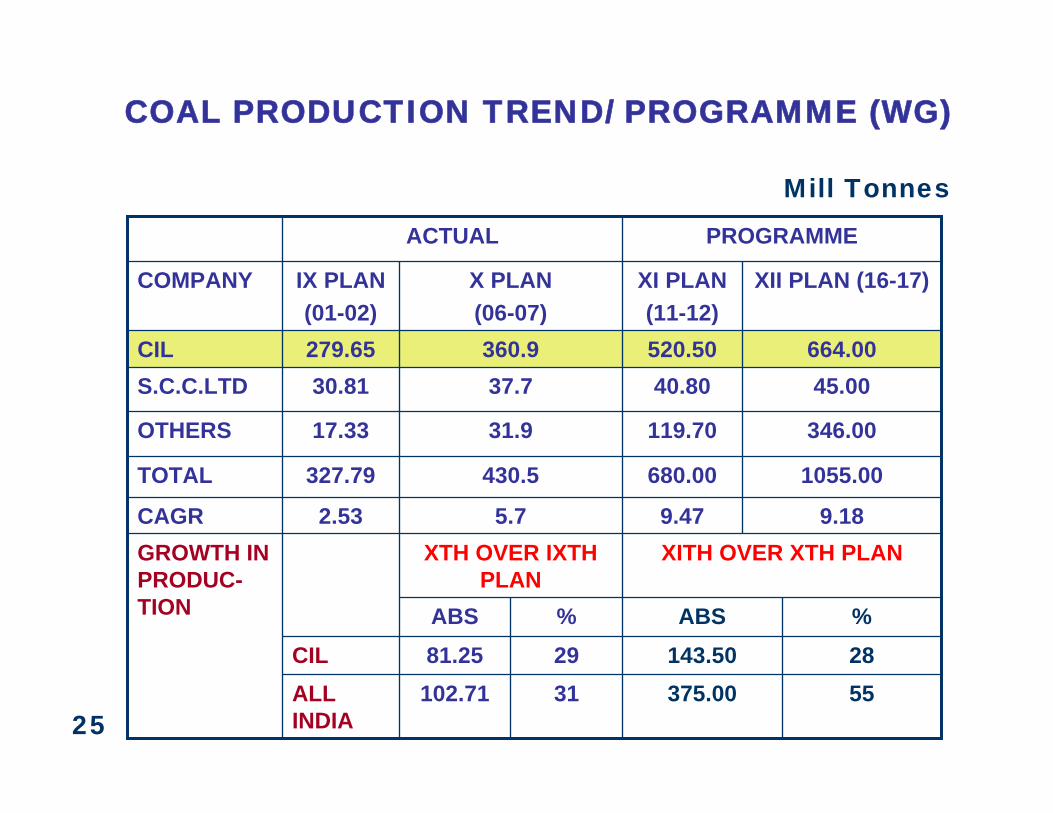
ALL INDIA
CIL55375.0031102.7128143.502981.25%%
XTH OVER IXTH PLAN
ABSABS
XITH OVER XTH PLANGROWTH IN PRODUC-TION
5.7
430.5
31.9
37.7360.9
X PLAN (06-07)
9.18
1055.00
346.00
45.00664.00
XII PLAN (16-17)
PROGRAMMEACTUAL
9.472.53CAGR
680.00327.79TOTAL
119.7017.33OTHERS
40.8030.81S.C.C.LTD520.50279.65CIL
XI PLAN (11-12)
IX PLAN (01-02)
COMPANY
COAL PRODUCTION TREND/ PROGRAMME (WG)
Mill Tonnes
25

THRUST AREAS
26
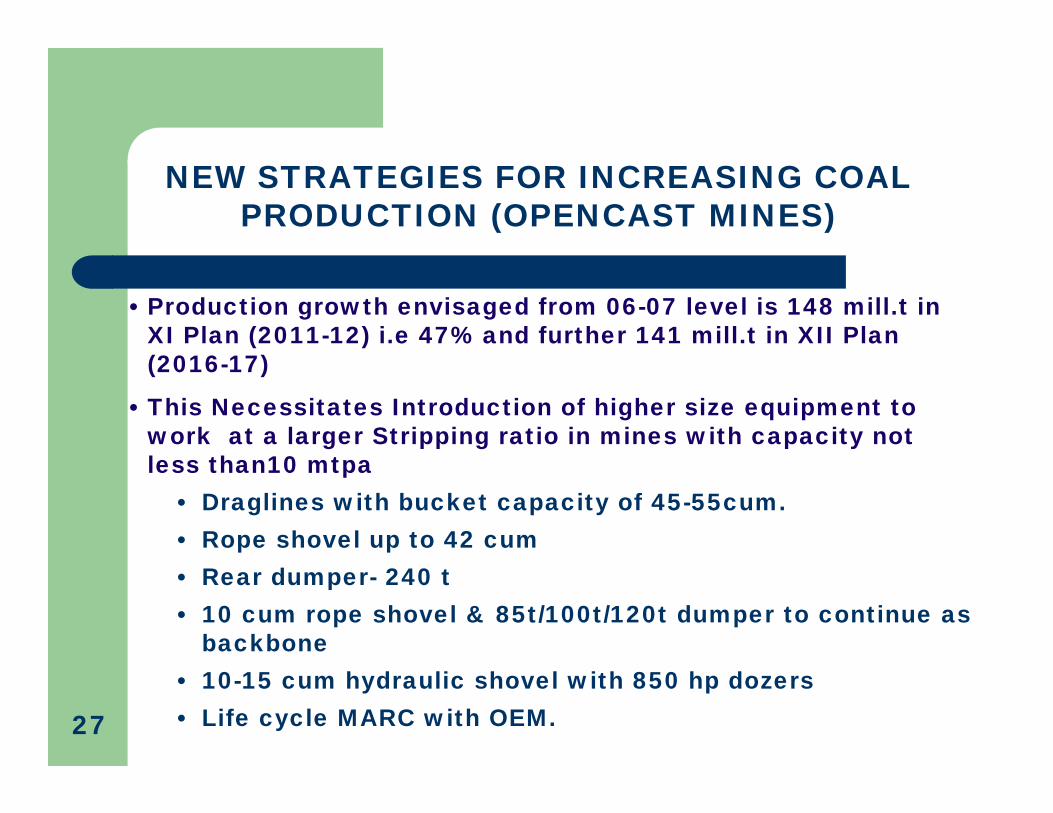
NEW STRATEGIES FOR INCREASING COAL PRODUCTION (OPENCAST MINES)
• Production growth envisaged from 06-07 level is 148 mill.t in XI Plan (2011-12) i.e 47% and further 141 mill.t in XII Plan (2016-17)
• This Necessitates Introduction of higher size equipment to work at a larger Stripping ratio in mines with capacity not less than10 mtpa
• Draglines with bucket capacity of 45-55cum.• Rope shovel up to 42 cum• Rear dumper- 240 t• 10 cum rope shovel & 85t/100t/120t dumper to continue as
backbone• 10-15 cum hydraulic shovel with 850 hp dozers• Life cycle MARC with OEM.27
• Inpit crushing & conveying technology as an alternative for large volume handling
• High wall mining
• Trolley assist dump trucks for long distance haul
• Use of Mobile crushing unit
• Use of IT in mining operation. 28
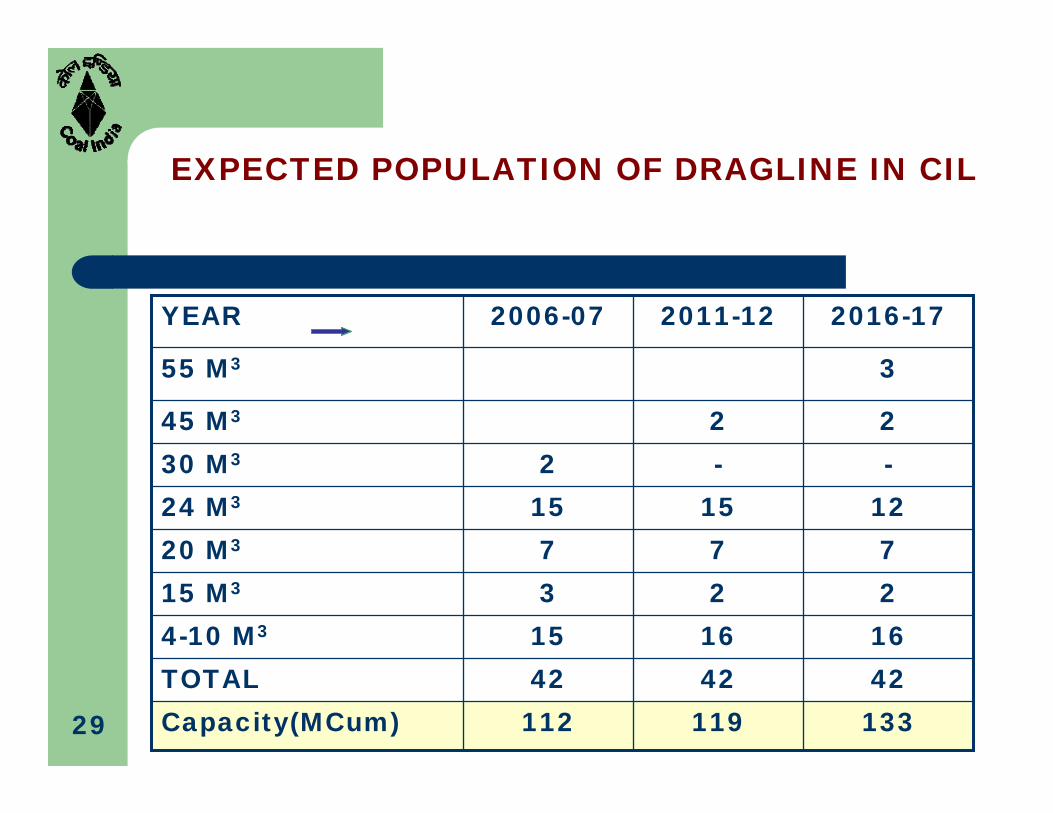
EXPECTED POPULATION OF DRAGLINE IN CIL
424242TOTAL133119112Capacity(MCum)
2016-172011-122006-07YEAR
355 M3
2245 M3
--230 M3
77720 M3
22315 M3
1616154-10 M3
12151524 M3
29
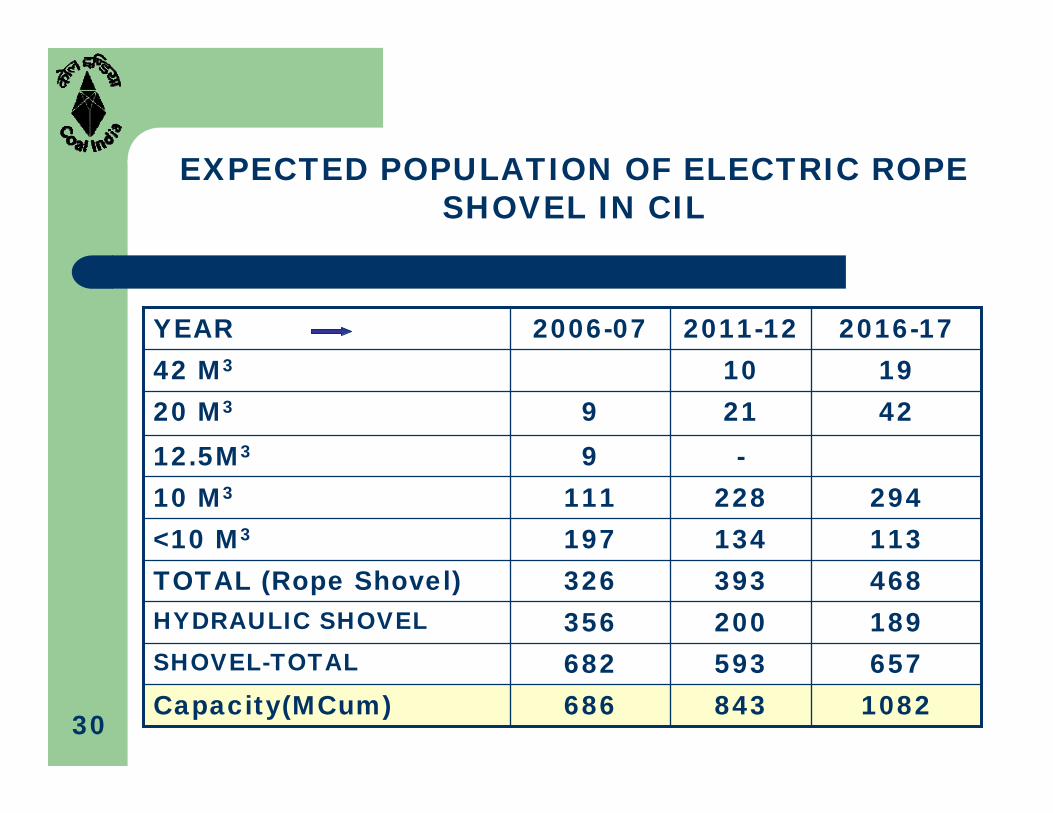
EXPECTED POPULATION OF ELECTRIC ROPE SHOVEL IN CIL
189200356HYDRAULIC SHOVEL
657593682SHOVEL-TOTAL
468393326TOTAL (Rope Shovel)
1082843686Capacity(MCum)
4221920 M3
-912.5M3
2016-172011-122006-07YEAR191042 M3
29422811110 M3
113134197<10 M3
30
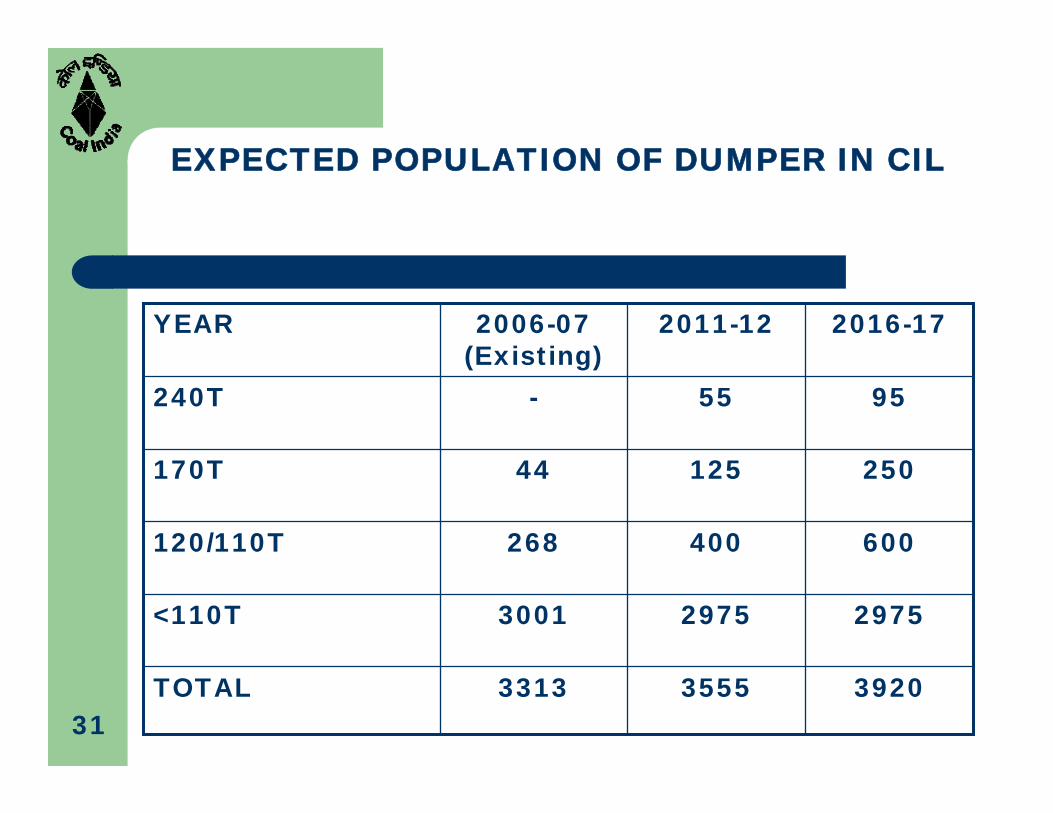
392035553313TOTAL
297529753001<110T
600400268120/110T
25012544170T
9555-240T
2016-172011-122006-07 (Existing)
YEAR
EXPECTED POPULATION OF DUMPER IN CIL
31
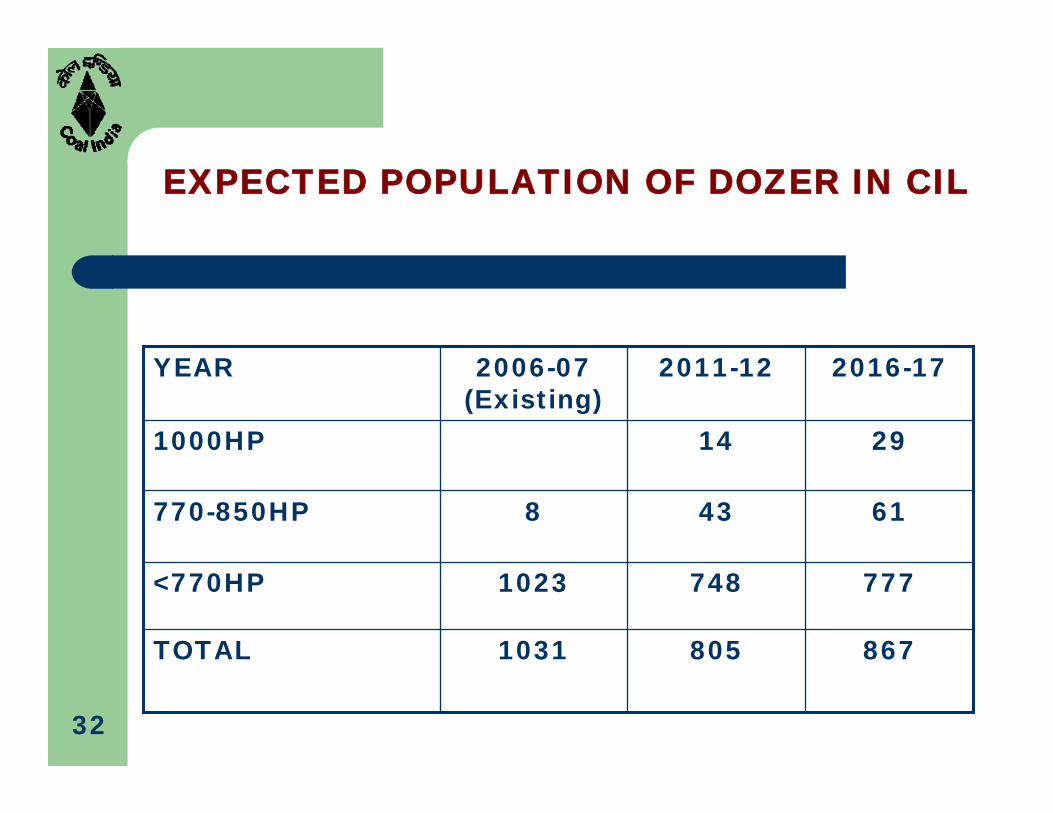
8678051031TOTAL
7777481023<770HP
61438770-850HP
29141000HP
2016-172011-122006-07 (Existing)
YEAR
EXPECTED POPULATION OF DOZER IN CIL
32

717655839TOTAL
627598823<311 MM
614316311 MM
2914-400 MM
2016-172011-122006-07 (Existing)
YEAR
EXPECTED POPULATION OF DRILL IN CIL
33
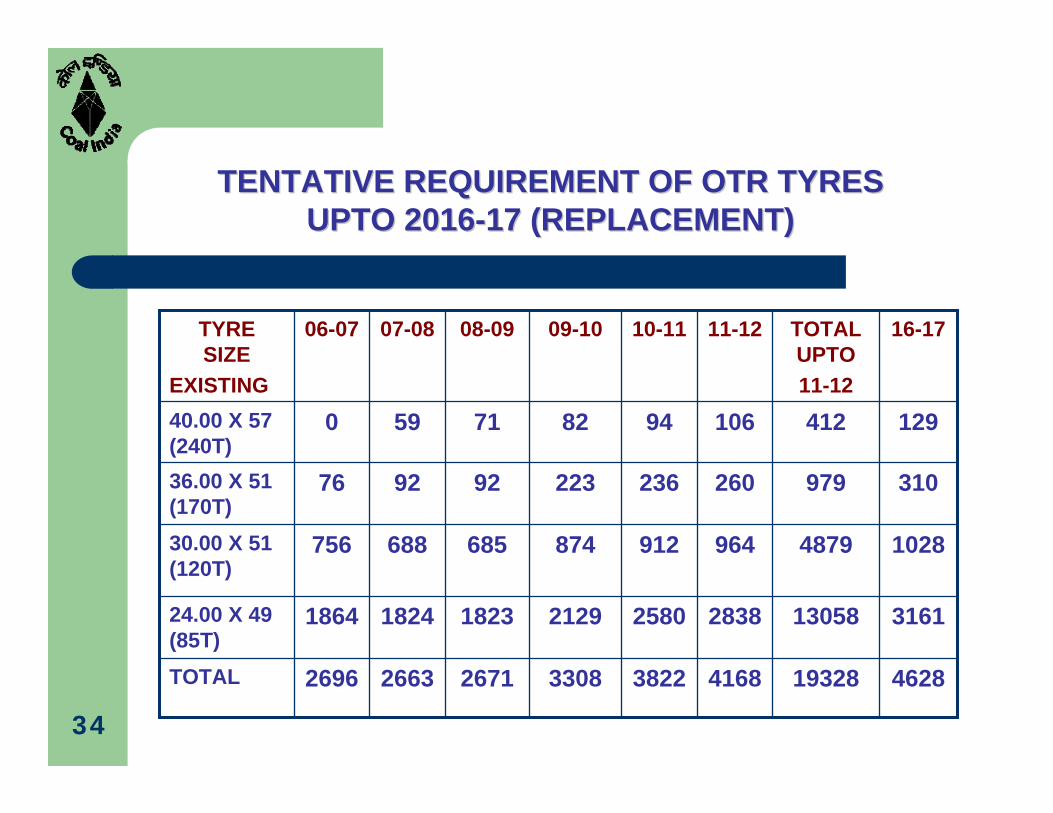
TENTATIVE REQUIREMENT OF OTR TYRES TENTATIVE REQUIREMENT OF OTR TYRES UPTO 2016UPTO 2016--17 (REPLACEMENT)17 (REPLACEMENT)
19328
13058
4879
979
412
TOTAL UPTO 11-12
4628416838223308267126632696TOTAL
2838
964
260
106
11-12
31612580212918231824186424.00 X 49 (85T)
102891287468568875630.00 X 51 (120T)
31023622392927636.00 X 51 (170T)
12994827159040.00 X 57 (240T)
16-1710-1109-1008-0907-0806-07TYRE SIZE
EXISTING
34
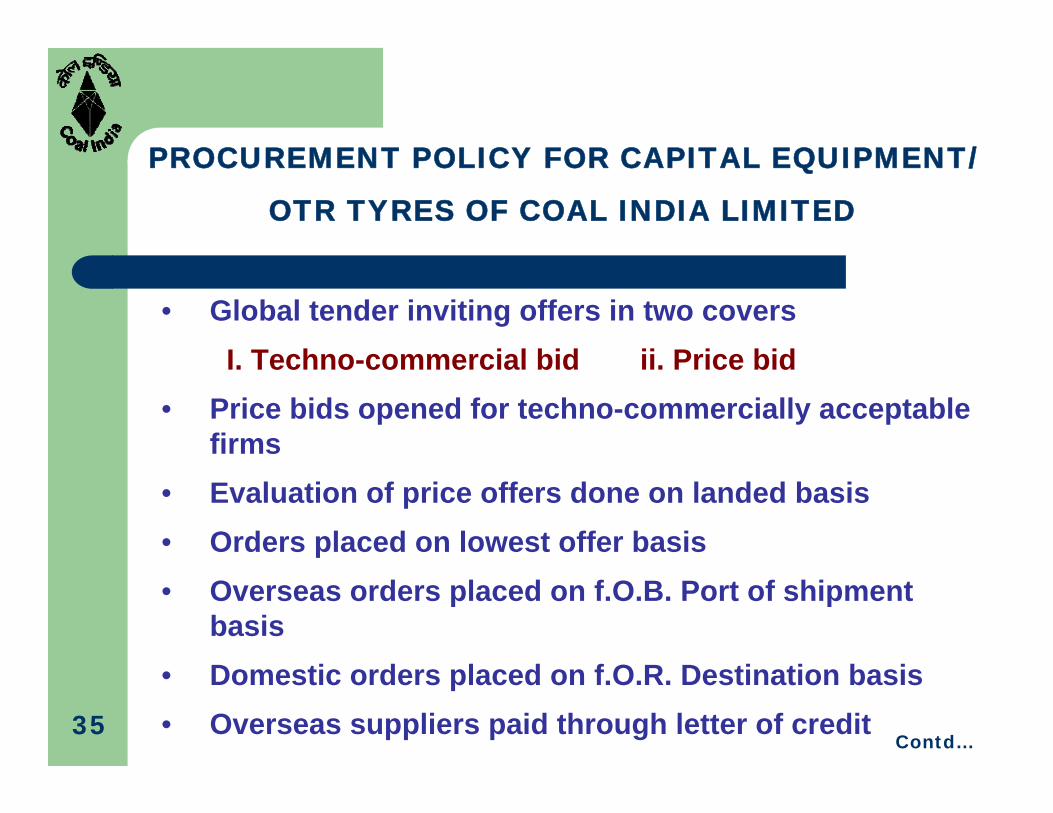
PROCUREMENT POLICY FOR CAPITAL EQUIPMENT/
OTR TYRES OF COAL INDIA LIMITED
• Global tender inviting offers in two coversI. Techno-commercial bid ii. Price bid
• Price bids opened for techno-commercially acceptable firms
• Evaluation of price offers done on landed basis• Orders placed on lowest offer basis• Overseas orders placed on f.O.B. Port of shipment
basis• Domestic orders placed on f.O.R. Destination basis• Overseas suppliers paid through letter of credit
Contd…35
• The supplies carry a warranty period of 12 months from date of commissioning or 18 months from date of dispatch which ever is earlier
• Bank guarantee for 10% of the value of order kept as performance coverage of the contract and released after fulfilment of all contractual obligations.
• Supply to be within agreed scheduled time & price.
• In case of non-execution of order- damages prescribed for both purchaser & seller36
STRATEGIES FOR INCREASING COAL PRODUCTION (UNDERGROUND MINES)
• Development of underground projects with Longwall/Mass production technology on risk/gain sharing basis
• Application of Longwall/Shortwall technology in extraction of pillars
• Existing Bord & Pillar & Longwall to Continue
• Intensify mechanised Roof Bolting
• Opening large Longwall mine (2-10 Mill T) within XIth plan
period .
• 100% mechanisation by 201737
• Technology for deep Shaft Sinking
• High speed tunneling machine for faster Incline / Drift drivage.
• Introduction of state-of-the-art Safety Monitoring devices
• Introduction of Man Riding systems in mines.
• Automation and use of IT
• Capacity building through training and redeployment of manpower.38
BENEFICIATION OF NON-COKING COAL
Study by Planning Commission concluded that carrying beneficiated coal > 400 kms is more attractive.
70% Thermal coal move > 400 km but only 20% of coal is beneficiated at present
ROM coal is usually not consistent in quality thus affecting Power Plants adversely.
39
BENEFICIATION OF NON-COKING COAL
Dispatching washed coal shall also:– Reduce strain on Railways.– Reduce pace for investment by Railways to augment
coal transportation infrastructure and thus save on interest/opportunity cost
– Reduce diesel, maintenance cost per K.Cal-KM of transport
Ideally CIL should supply only washed Thermal coal to all Power Stations except for those at pitheads and also generate power from rejects
Formulation of roadmap for the same is being taken up.40
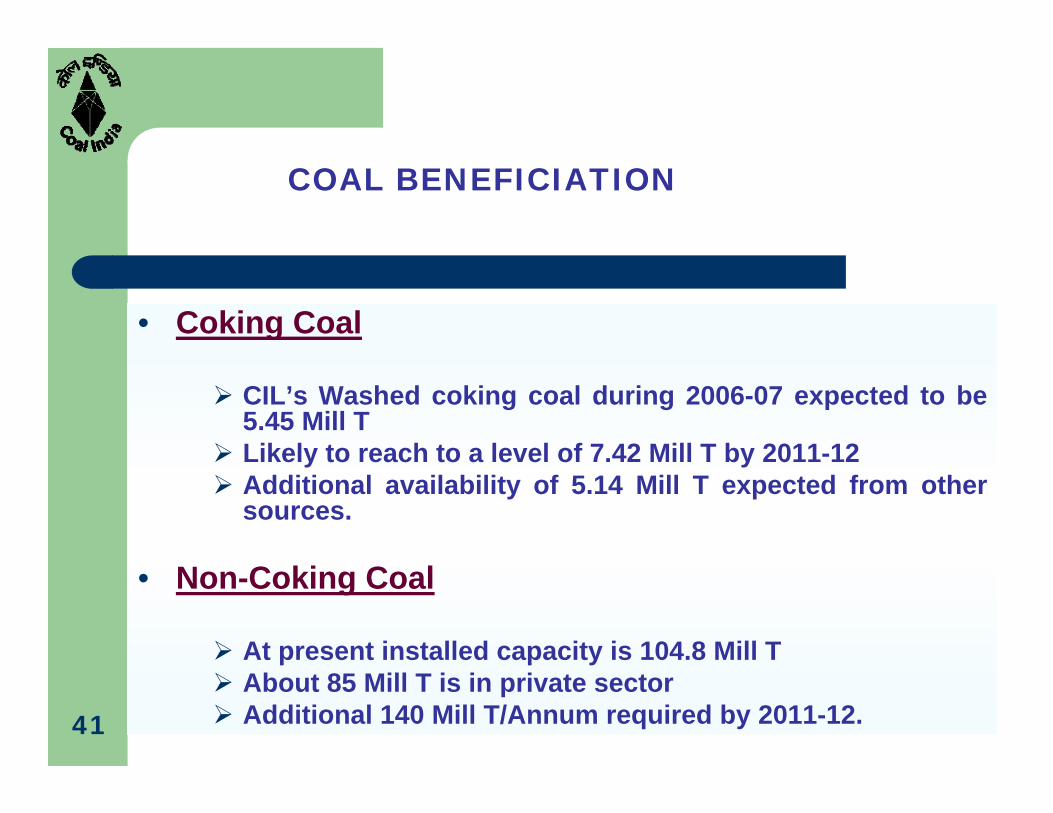
COAL BENEFICIATION
• Coking Coal
CIL’s Washed coking coal during 2006-07 expected to be 5.45 Mill TLikely to reach to a level of 7.42 Mill T by 2011-12Additional availability of 5.14 Mill T expected from other sources.
• Non-Coking Coal
At present installed capacity is 104.8 Mill TAbout 85 Mill T is in private sectorAdditional 140 Mill T/Annum required by 2011-12. 41
• CBM /CMM/AMM EXPLORATION & EXPLOITATION, R&D PROJECTS.
• UNDERGROUND COAL GASIFICATION.
• COAL LIQUEFACTION.
CLEAN COAL TECHNOLOGIES
42
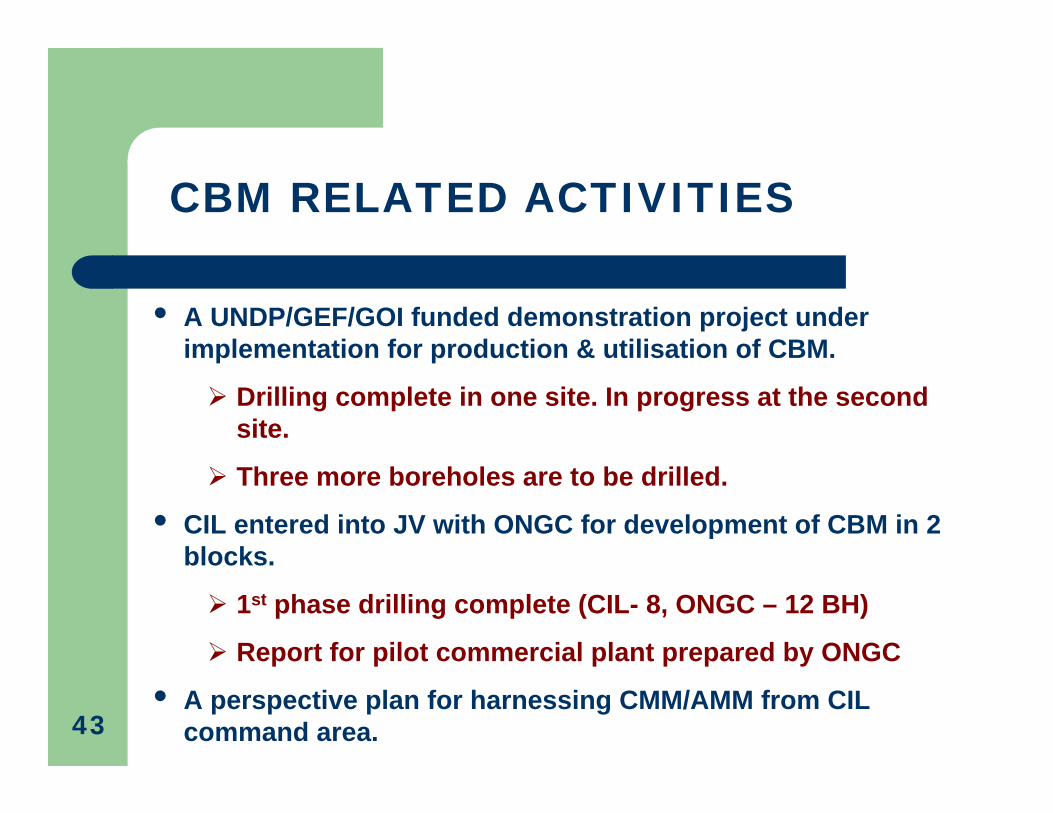
CBM RELATED ACTIVITIES
• A UNDP/GEF/GOI funded demonstration project under implementation for production & utilisation of CBM.
Drilling complete in one site. In progress at the second site.
Three more boreholes are to be drilled.
• CIL entered into JV with ONGC for development of CBM in 2 blocks.
1st phase drilling complete (CIL- 8, ONGC – 12 BH)
Report for pilot commercial plant prepared by ONGC
• A perspective plan for harnessing CMM/AMM from CIL command area.43
UNDERGROUND COAL GASSIFICATION
• ONGC & GAIL pursuing UCG in collaboration with CIL.
• MOU signed between CIL & ONGC for a pilot project in JV mode.
44
COAL LIQUEFACTION
• 4 plants currently operational in USA and South Africa for Coal Liquefaction
• 6 mt coal can produce 3.6 million barrel of Diesel at NEC & Naptha at a cost of Rs.1532 (USD 35) to Rs.1751 (USD 40) per barrel.
• CIL and Oil India limited to sign an MOU for a 5000 barrels/ day.
• Availability of 3 Mill Tonnes coal being explored
• Meeting held with Govt. of Meghalaya and Arunachal Pradesh for availability of coal.
45
COAL VIDESH
• CIL Board approved formation of a subsidiary ‘Coal India Videsh Ltd’ which is presently under consideration of Government.
• Objective is to acquire overseas reserve, produce and import Coking and high grade Non-Coking coal to India.
• To contribute 10 mt of coal by 2011-12 and 50 mt by 2020
• Destination :
• Coking coal : Australia, Zimbabwe, Mozambique, Russia,Kazakhstan, Canada, Venezuela.
• Thermal coal : Indonesia, South Africa
• Panel of Investment Bankers & consultants created for due diligence studies.
• Fact-finding Mission team from Coal Videsh Dept. visited target countries
46

THANK YOU
47